By Steven Goddard
The topic this week is verification of data sources. NSIDC reports :
At the end of the month, extent fell near the level recorded in 2006, the lowest in the satellite record for the end of May
That sounds bad! Let’s see how 2010 compares with ten, twenty and thirty years ago :

Ice looks healthier than 10 years ago

Ice looks healthier than 20 years ago

Ice looks healthier than 30 years ago
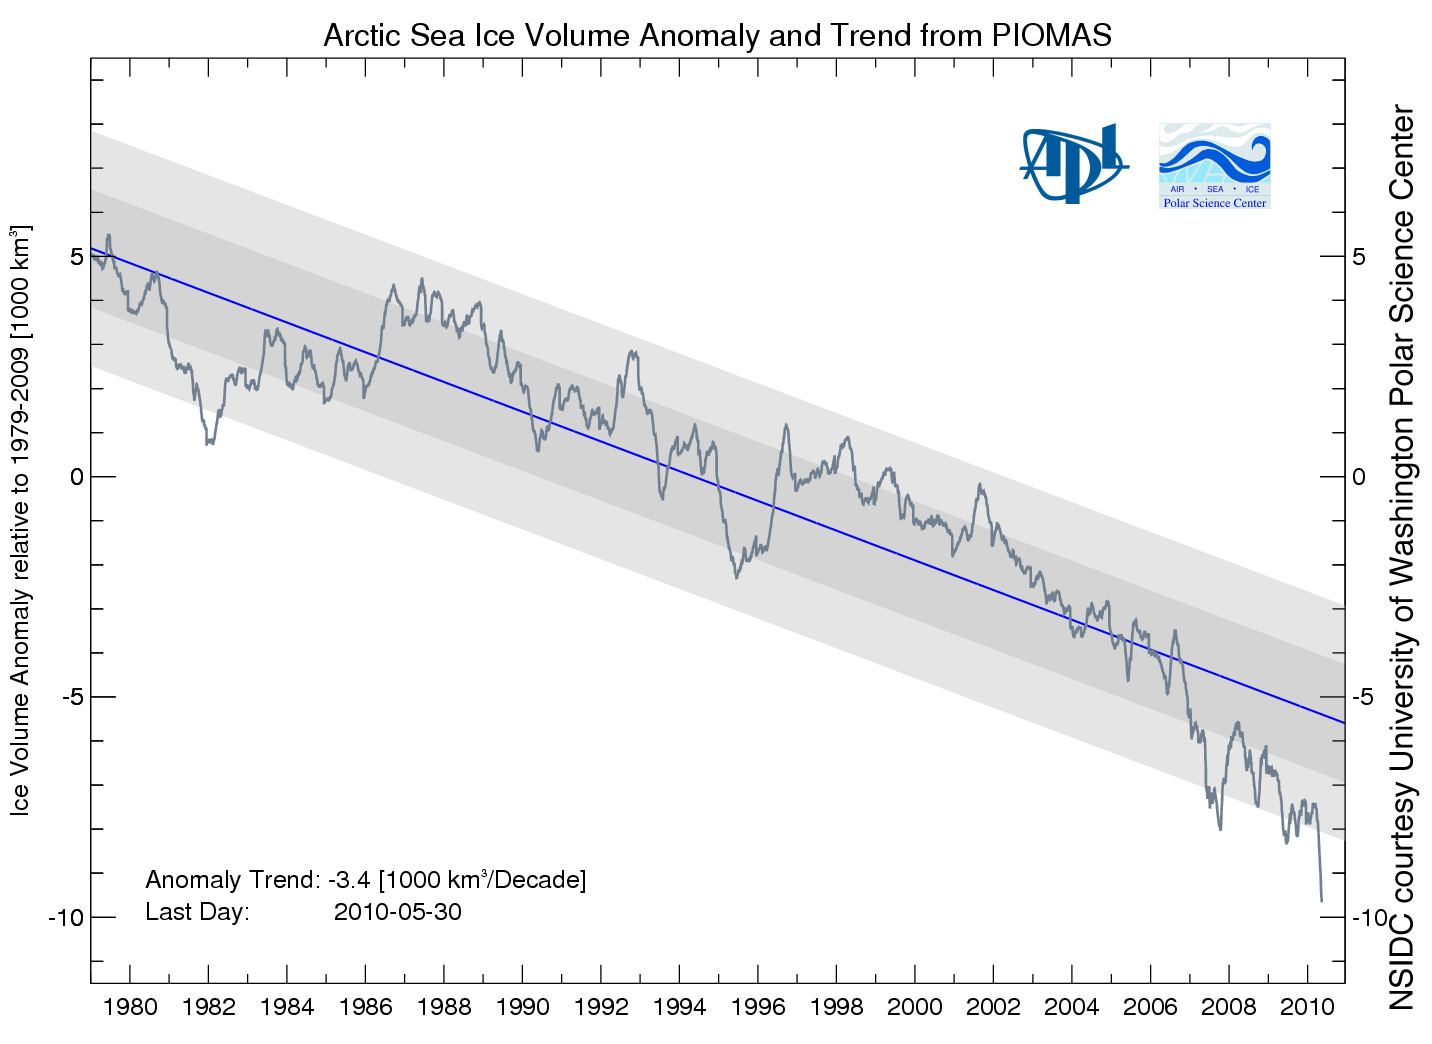
Then NSIDC discussed my favorite graph from PIOMAS, showing a record low anomaly of Arctic ice volume.

PIOMAS shows an anomaly nearly 50% greater than 2008. If that is correct, then surely we will have a record minimum this summer. However, the PIOMAS data seems inconsistent with PIPS2 data, which shows thicker ice covering a much larger area in 2010. My guess is that PIOMAS is looking at only a small region of the Arctic interior.
Next data source to look at are the Arctic Ice Concentration maps. UIUC has archived lower resolution maps since the start of the satellite record, such as the one below for June 11, 2010.

Their newer maps appear to show a lot more detail.
")
Note that the newer map shows a lot of low concentration ice in the Beaufort Sea (green, yellow, light pink.) Let’s see how that compares with a current satellite photo.

I must be missing something, because I don’t see much of that low concentration (green) ice in the satellite photo. The two videos below compare satellite vs new and old concentration maps. New comparison first :
The old concentration maps correlate much more closely with the satellite photo.
You can also see in the video below how erratic the bands of yellow and green are in the newer maps. They appear one day and disappear the next.
In the low colour version of the video, it appears that they may be having trouble differentiating between cloud cover and low concentration ice. We see large areas of open water switching to saturated ice overnight, and vice-versa.
It appears that the precision of the newer maps is much greater than their accuracy. Better to use a low precision map which is matched correctly with its accuracy.
Moving on, Barrow Sea Ice is starting to show first signs of thinning. By June 16, 2007 the ice had already broken up.
.
http://seaice.alaska.edu/gi/observatories/barrow_sealevel/brw2010/BRW_MBS10_overview_complete.png
Temperatures in the Arctic have continued below normal and below freezing for the last few weeks.
")
http://ocean.dmi.dk/arctic/meant80n.uk.php
NCEP is forecasting below freezing temperatures for much of the Arctic Basin during the next week.

This week, the sun reaches its highest point in the sky. Next week it starts its decline towards winter.
Now, the really interesting stuff. Arctic Basin sea ice volume (calculated from PIPS maps) remains close to the 2006 track, and well above the last three years

Area is slightly below 2006 and 2009.

Thickness is nearly identical to 2006 and 2007.

Conclusion : 2010 minimum extent is on track to come in just below 2006. With the cold temperatures the Arctic is experiencing, the likelihood of a big melt is diminishing.
NSIDC shows extent lower than 2007. The modified NSIDC map below shows where they believe the gaps are (in red.)

On the surface, this appears to disagree with my measurement above that Arctic Basin ice area is greater than 2007. The difference is that I am only considering regions that have perennial ice – i.e my PIPS calculations assume that there is no summer ice in Hudson Bay or the Barents Sea, and that they are a “don’t care” for estimating minimum extent. You can see in my PIPS ROI (Region of Interest) maps for June 14 below, that there is excellent agreement between PIPS and NSIDC. 2007 had less ice in the Chukchi and Laptev Sea, and more in the Beaufort Sea.

PIPS June 14, 2010

PIPS June 14, 2007
The modified NSIDC image below shows ice loss since June 3.

The modified NSIDC image below shows ice loss since early April.

And finally, the modified NSIDC image below shows regions which have below normal ice extent.

My analysis indicates the highest late summer extent since 2006. In discussing, please remember that the regions in red above normally have no ice in September. They don’t figure in to the summer minimum.
PS: You can actually make a bid or offer at any price, in hopes that the odds will move in that direction and you’ll “catch a bid.” This is one of the “pluses” of Intrade — you don’t have only a take-it-or-leave-it choice about the odds. You can specify the odds you like and hope someone eventually will agree to bet with you at that level.
http://climateinsiders.files.wordpress.com/2010/06/piomas.png?w=510&h=371
I really do detest Anomaly taxation without Data representation.
Anomaly study may be great for calculating a slope, but it doesn’t do anything for expressing the significance of said slope.
I’m sure someone could come up with a PIOTSI Anomaly map looking equally scary.
Roger Knights says:
June 16, 2010 at 9:53 pm
It remains a tortuous way of creating 43% and the illusion of general consensus based on the betting of a few people. Hardly a piece in the bigger picture.
Anu
You appear to be getting really desperate.
stevengoddard says:
June 16, 2010 at 8:37 pm
CO2
I can’t be responsible for whatever is going on inside your head.
——————–
I do not seek responsibility; the difficult I do straight away, the impossible just takes a little longer. Why disclaim responsibility for something you have no control over to begin with. As it is I am quite comfortable with my thought processes though. However I do recognise a diversion when I see it.
Smokey says:
June 16, 2010 at 8:10 pm
“All vanished after independent replication? Downgraded from a hypothesis to unsupported conjecture? Pseudo scientific opinion?”
Yep.
——————–
Care to cite all the independent replications? Who did the downgrading from one supposition to another? Read this blog and others like it, then give me a definition of ‘pseudo scientific opinion’. Perhaps using ‘lay-person’s scientific opinion’ may be better? Generalisations seldom serve a purpose.
What’s the significance of 6 November? Random or selective? Look at http://igloo.atmos.uiuc.edu/cgi-bin/test/print.sh?fm=09&fd=16&fy=1980&sm=09&sd=16&sy=2009.
While there look at the 1980 – 2007 comparison. Not a healthy look at all.
For a sobering look at sea ice extent visit COI (Centre for Ocean and Ice Denmark ) http://ocean.dmi.dk/arctic/icecover.uk.php
Using data from OSISAF and counting 30% cover as continuous ice, they calculate the extent now (June 16) to be 7.8 million km2 and the minimum of 2007 at 3.5 million km2
Agreed. Intrade’s notation system is Byzantine.
Creating such an impression was not my intention; nevertheless, I’d say that money-backed opinions carry more weight than mouth-backed opinions.
That’s why I’m trying to rustle up more bettors — to obtain a weightier “gauge” of seriously held opinion on the topic.
Yes and no. Although betting-markets are often “thin,” Intrade’s bettors are collectively quite shrewd: they are well known for having often “called” the outcome of many events better than the punditry’s consensus, especially on election results. (A recent example is their refusal to give much credence to the proposition that any country would leave the eurozone, which several stock-market-opinionators were claiming was inevitable.) However, when I post a number like 43%, I don’t really think it carries much authority. Odds can often get quite detached from reality.
I have other goals in mind. For instance, I’d like to post the odds in the next two weeks, four weeks, etc., in order to indicate the direction in which bettor-opinion is trending, which is a matter of some interest. I also want to cool down the heatedness of conflict here by encouraging combatants to “take it outside” by betting against each other over there.
Halfwise, Codetech,
So you cannot find any scientific papers supporting this hypothesis of yours of a majority of climate scientists declaring an imminent ice age in the ’70s.
I’ll thus provide a summary of what the facts are:
1) There was no ice age predicted by science in the ’70s.
2) Popular media took a couple of comments from a few scientists and wildly exaggerated them to sell papers.
You have so far provided no refutation of these facts. Arm waving and derogatory remarks about revisionism aren’t facts. A list of scientific papers predicting an ice age in the ’70s would be fact. Google Scholar is but two clicks away. Have at it.
On the St. Roch: yes, I didn’t want to imply it didn’t cross in one season (once), I know it did. What I was saying is that it wasn’t an average ship, it was reinforced to cross through a partially iced arctic, breaking through if necessary. The ships that crossed in the 2000s were commercial ships. Big difference.
From: stevengoddard on June 15, 2010 at 10:38 am
I want to know where he found a captain of an icebreaker willing to plow right through 14 meter thick ice with a vessel normally capable of laboriously breaking up just over a meter thick ice. Didn’t they expect any tough spots, at all? Maybe someone was getting a bit heady from their daily ration of grog. 😉
Hypnos says:
June 17, 2010 at 1:39 am
On the St. Roch: yes, I didn’t want to imply it didn’t cross in one season (once), I know it did. What I was saying is that it wasn’t an average ship, it was reinforced to cross through a partially iced arctic, breaking through if necessary.
During its first crossing the St Roch had to overwinter and at one point had to dynamite its way out of the ice
The ships that crossed in the 2000s were commercial ships. Big difference.
And recently by several yachts each year, like this one: http://www.sail-world.com/photos/Alt_Berrimilla_heads_south.jpg
“Berrimilla is the first yacht to circumnavigate the world under sail via the North West Passage and the first to circumnavigate via both Cape Horn and the North-West Passage – opposite ends of the Americas.”
stevengoddard says:
June 16, 2010 at 10:53 pm
Anu
You appear to be getting really desperate.
“Desperate” is a good word for you to be using:
http://ocean.dmi.dk/arctic/icecover.uk.php
I’ll be back in late September to gloat.
Keep those amusing quotes coming – the Internet doesn’t forget.
Yup, we have confirmation from the esteemed Dr. William Connolley, PhD Climatology:
“Was an imminent Ice Age predicted in the ’70’s? No”
*cough*
This is confirmed by the authoritative Wikipedia Global cooling article, which rather than be some dry factual article providing a scientific description of possible actual cooling of the globe and its possible effects, is wisely instead a long thought-out historical treatise about global cooling myths and hysteria and the debunking thereof, since global cooling can absolutely never ever occur, and it will especially absolutely never ever occur without serious reductions of atmospheric CO2 concentrations to below pre-industrialization levels.
And of course Wikipedia is well known for its absolute unquestionable authority, absolutely especially on matters related in any way to climate. For example:
Compare that to this line from “Invasion of Kuwait”:
Thus it is established as absolute unquestionable fact that Kuwait was known for massive oil well fires in the 1980’s, said knowing leading to a prediction of significant effects on climate, before the invasion by Iraq and Iraq’s subsequent expulsion during the Gulf War.
CO2 says:
June 16, 2010 at 11:17 pm:
“Care to cite all the independent replications? Who did the downgrading from one supposition to another? Read this blog and others like it, then give me a definition of ‘pseudo scientific opinion’. Perhaps using ‘lay-person’s scientific opinion’ may be better? Generalisations seldom serve a purpose.”
OK, one by one: Care to cite all the independent replications?
My point went over your head: there are no independent replications of the CO2=CAGW conjecture. It is not testable, therefore it is not science. Read Popper if you think that statement is incorrect: “… the criterion of the scientific status of a theory is its falsifiability, or refutability, or testability.”
Who did the downgrading from one supposition to another?
I and others downgraded CO2=CAGW from a hypothesis to a conjecture, which is what it is, by definition. And we pointed it out many moons ago, and repeatedly, not just in this thread. You’re new here, but you can check the archives. Absent falsifiability, refutability, or testability, CO2=CAGW is nothing but a non-scientific scare tactic.
Read this blog and others like it, then give me a definition of ‘pseudo scientific opinion’.
OK. For examples of pseudo-scientific opinion, I give you: RealClimate, DeSmogBlog, climate progress, tamino, etc. And any other source that still believes the repeatedly debunked idea that a tiny trace gas controls the Earth’s climate, and will bring about runaway global warming and climate catastrophe. The real world disagrees; who are you going to believe?
Perhaps using ‘lay-person’s scientific opinion’ may be better?
Perhaps — if the lay person’s opinion is independent, and not bought and paid for by organizations with a CAGW agenda. If you haven’t noticed, climate science has been corrupted by money.
Generalisations seldom serve a purpose.
Wrong. People routinely generalize, you do it too, therefore it serves a purpose. QED.
I’ve answered your questions. Now please answer just one of mine: what’s your favorite alarmist blog? You know, the one you came here from?
Anu,
My guess is that you will be gone in September, because you are too embarrassed.
Enviroment Canada paints a rather worrying picture of arctic sea ice in their 30 day forecasts.
http://ice-glaces.ec.gc.ca/app/WsvPrdCanQry.cfm?subID=2008&Lang=eng
For (hopefully) the last time, the region north of 80N is only about 20% of the Arctic and the DMI polar temp. is not the average temperature of the Arctic! Why don’t you use NCEP/NCAR instead, as you can see the anomalies everywhere. I’m beginning to suspect cherry picking because NCEP/NCAR shows the first 15 days of June being warmer than normal over almost the entire Arctic, with one major exception being the immediate vicinity of the pole. The NCEP/NCAR plot shows that the period from June 8-15 averages above +1 C over most of the Arctic Ocean (but again not the immediate vicinity of the pole which is what DMI sees.)
http://www.esrl.noaa.gov/psd/cgi-bin/data/composites/comp.day.pl?var=Air+Temperature&level=Surface&iy%5B1%5D=&im%5B1%5D=&id%5B1%5D=&iy%5B2%5D=&im%5B2%5D=&id%5B2%5D=&iy%5B3%5D=&im%5B3%5D=&id%5B3%5D=&iy%5B4%5D=&im%5B4%5D=&id%5B4%5D=&iy%5B5%5D=&im%5B5%5D=&id%5B5%5D=&iy%5B6%5D=&im%5B6%5D=&id%5B6%5D=&iy%5B7%5D=&im%5B7%5D=&id%5B7%5D=&iy%5B8%5D=&im%5B8%5D=&id%5B8%5D=&iy%5B9%5D=&im%5B9%5D=&id%5B9%5D=&iy%5B10%5D=&im%5B10%5D=&id%5B10%5D=&iy%5B11%5D=&im%5B11%5D=&id%5B11%5D=&iy%5B12%5D=&im%5B12%5D=&id%5B12%5D=&iy%5B13%5D=&im%5B13%5D=&id%5B13%5D=&iy%5B14%5D=&im%5B14%5D=&id%5B14%5D=&iy%5B15%5D=&im%5B15%5D=&id%5B15%5D=&iy%5B16%5D=&im%5B16%5D=&id%5B16%5D=&iy%5B17%5D=&im%5B17%5D=&id%5B17%5D=&iy%5B18%5D=&im%5B18%5D=&id%5B18%5D=&iy%5B19%5D=&im%5B19%5D=&id%5B19%5D=&iy%5B20%5D=&im%5B20%5D=&id%5B20%5D=&monr1=6&dayr1=8&monr2=6&dayr2=15&iyr%5B1%5D=2010&filenamein=&plotlabel=&lag=0&labelc=Color&labels=Shaded&type=1&scale=&label=0&cint=1&lowr=-3&highr=3&istate=0&proj=Custom&xlat1=55&xlat2=90&xlon1=0&xlon2=360&custproj=Northern+Hemisphere+Polar+Stereographic&level1=1000mb&level2=10mb&Submit=Create+Plot
The areas below +1 C over that period are a small area near the New Siberian Islands, the Barents Sea, east of Greenland, and a large area of the Arctic Basin which remained ice-covered even in 2007. The vast majority of the area of the “bite” out of the ice pack in 2007 has been above freezing for the last week.
Nightvid Cole,
You talk about “cherry picking,” then you only post an Arctic reference.
FYI, most of the Antarctic is getting more ice cover. That’s why global ice cover is increasing.
See? No more cherry picking only one hemisphere, please. You have to include the Antarctic.
Smokey says:
June 17, 2010 at 5:22 pm
Nightvid Cole,
You talk about “cherry picking,” then you only post an Arctic reference.
The title of this thread is: WUWT Arctic Sea Ice News #9
Anthony has said before that he doesn’t want these threads going OT on the Antarctic so ~SNIP~
Ok, take the Antarctic
http://www.esrl.noaa.gov/psd/cgi-bin/data/composites/comp.day.pl?var=Air+Temperature&level=Surface&iy%5B1%5D=&im%5B1%5D=&id%5B1%5D=&iy%5B2%5D=&im%5B2%5D=&id%5B2%5D=&iy%5B3%5D=&im%5B3%5D=&id%5B3%5D=&iy%5B4%5D=&im%5B4%5D=&id%5B4%5D=&iy%5B5%5D=&im%5B5%5D=&id%5B5%5D=&iy%5B6%5D=&im%5B6%5D=&id%5B6%5D=&iy%5B7%5D=&im%5B7%5D=&id%5B7%5D=&iy%5B8%5D=&im%5B8%5D=&id%5B8%5D=&iy%5B9%5D=&im%5B9%5D=&id%5B9%5D=&iy%5B10%5D=&im%5B10%5D=&id%5B10%5D=&iy%5B11%5D=&im%5B11%5D=&id%5B11%5D=&iy%5B12%5D=&im%5B12%5D=&id%5B12%5D=&iy%5B13%5D=&im%5B13%5D=&id%5B13%5D=&iy%5B14%5D=&im%5B14%5D=&id%5B14%5D=&iy%5B15%5D=&im%5B15%5D=&id%5B15%5D=&iy%5B16%5D=&im%5B16%5D=&id%5B16%5D=&iy%5B17%5D=&im%5B17%5D=&id%5B17%5D=&iy%5B18%5D=&im%5B18%5D=&id%5B18%5D=&iy%5B19%5D=&im%5B19%5D=&id%5B19%5D=&iy%5B20%5D=&im%5B20%5D=&id%5B20%5D=&monr1=6&dayr1=8&monr2=6&dayr2=15&iyr%5B1%5D=2010&filenamein=&plotlabel=&lag=0&labelc=Color&labels=Shaded&type=1&scale=&label=0&cint=&lowr=&highr=&istate=0&proj=Custom&xlat1=-90&xlat2=-55&xlon1=0&xlon2=360&custproj=Southern+Hemisphere+Polar+Stereographic&level1=1000mb&level2=10mb&Submit=Create+Plot
Smokey writes,
“You have to include the Antarctic.”
Sea ice around Antarctica is fine for now, the ice sheets not so much. From Geophysical Research Letters last fall:
“Increasing rates of ice mass loss from the Greenland and Antarctic ice sheets revealed by GRACE
I. Velicogna,
Department of Earth System Science, University of California, Irvine, California, USA
Jet Propulsion Laboratory, California Institute of Technology, Pasadena, California, USA
We use monthly measurements of time-variable gravity from the GRACE (Gravity Recovery and Climate Experiment) satellite gravity mission to determine the ice mass-loss for the Greenland and Antarctic Ice Sheets during the period between April 2002 and February 2009. We find that during this time period the mass loss of the ice sheets is not a constant, but accelerating with time, i.e., that the GRACE observations are better represented by a quadratic trend than by a linear one, implying that the ice sheets contribution to sea level becomes larger with time. In Greenland, the mass loss increased from 137 Gt/yr in 2002–2003 to 286 Gt/yr in 2007–2009, i.e., an acceleration of −30 ± 11 Gt/yr2 in 2002–2009. In Antarctica the mass loss increased from 104 Gt/yr in 2002–2006 to 246 Gt/yr in 2006–2009, i.e., an acceleration of −26 ± 14 Gt/yr2 in 2002–2009. The observed acceleration in ice sheet mass loss helps reconcile GRACE ice mass estimates obtained for different time periods. ”
http://www.agu.org/pubs/crossref/2009/2009GL040222.shtml
Nightvid Cole,
Ooh. I see. Scary bright red. Which, if you look closely, means freezing.
Anyway, since there’s been sniveling about the Antarctic, here is a paper on the Arctic.
Well, Smokey, at least we can be pretty sure the sea ice in the Antarctic will pretty much all melt away, as it does each year. http://arctic.atmos.uiuc.edu/cryosphere/IMAGES/seaice.recent.antarctic.png
Yawn
The Legend of Nightvid Cole is on Facebook
Dang, you’d think someone that smart would know how to do a short “href” HTML link, or could at least have stopped at http://tinyurl.com/ first. 😉
The Arctic one: http://tinyurl.com/29c4bth
The Antarctic one: http://tinyurl.com/2ufuj9b
Wow, the surface air temperatures in central Antarctica are down to -60° C and below. Someone better double-check with Hansen to make sure that’s included in the GISS global average temperature.
The Arctic surface air temperatures map is also cute. Just look at how cold Greenland is, so much deep-frozen glacial ice it just yanks down the air temps. It’ll be a shame when that all melts away and the Arctic area loses its main reservoir of cold in the summer. Surely the Arctic will be free of sea ice in summer after that happens!