By Steven Goddard
The topic this week is verification of data sources. NSIDC reports :
At the end of the month, extent fell near the level recorded in 2006, the lowest in the satellite record for the end of May
That sounds bad! Let’s see how 2010 compares with ten, twenty and thirty years ago :

Ice looks healthier than 10 years ago

Ice looks healthier than 20 years ago

Ice looks healthier than 30 years ago
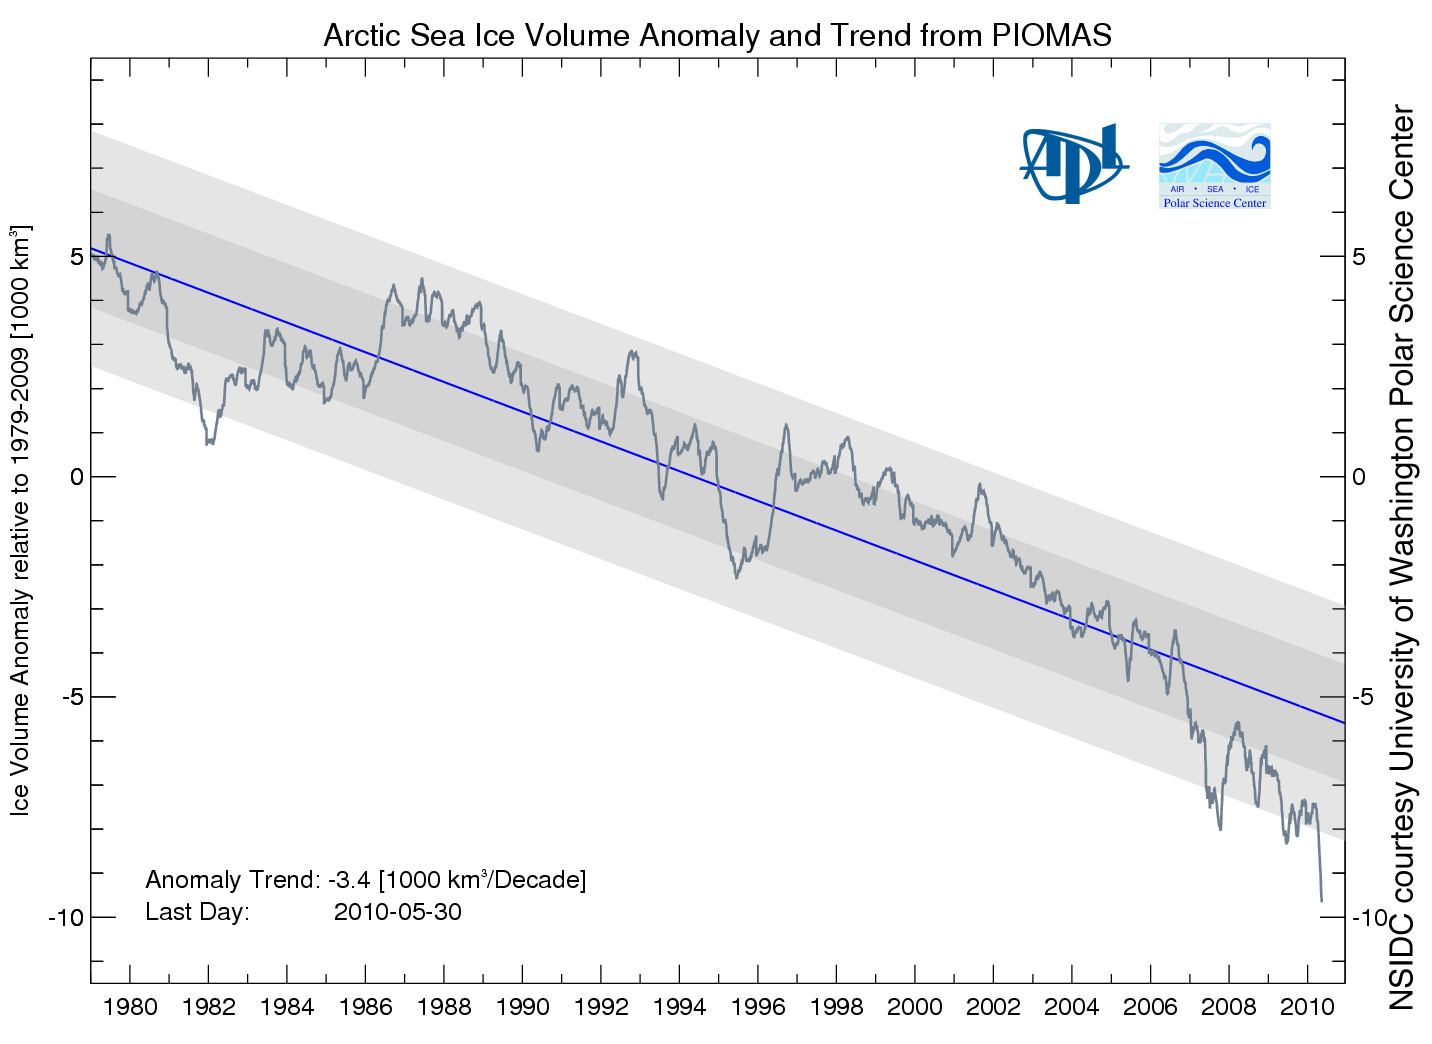
Then NSIDC discussed my favorite graph from PIOMAS, showing a record low anomaly of Arctic ice volume.

PIOMAS shows an anomaly nearly 50% greater than 2008. If that is correct, then surely we will have a record minimum this summer. However, the PIOMAS data seems inconsistent with PIPS2 data, which shows thicker ice covering a much larger area in 2010. My guess is that PIOMAS is looking at only a small region of the Arctic interior.
Next data source to look at are the Arctic Ice Concentration maps. UIUC has archived lower resolution maps since the start of the satellite record, such as the one below for June 11, 2010.

Their newer maps appear to show a lot more detail.
")
Note that the newer map shows a lot of low concentration ice in the Beaufort Sea (green, yellow, light pink.) Let’s see how that compares with a current satellite photo.

I must be missing something, because I don’t see much of that low concentration (green) ice in the satellite photo. The two videos below compare satellite vs new and old concentration maps. New comparison first :
The old concentration maps correlate much more closely with the satellite photo.
You can also see in the video below how erratic the bands of yellow and green are in the newer maps. They appear one day and disappear the next.
In the low colour version of the video, it appears that they may be having trouble differentiating between cloud cover and low concentration ice. We see large areas of open water switching to saturated ice overnight, and vice-versa.
It appears that the precision of the newer maps is much greater than their accuracy. Better to use a low precision map which is matched correctly with its accuracy.
Moving on, Barrow Sea Ice is starting to show first signs of thinning. By June 16, 2007 the ice had already broken up.
.
http://seaice.alaska.edu/gi/observatories/barrow_sealevel/brw2010/BRW_MBS10_overview_complete.png
Temperatures in the Arctic have continued below normal and below freezing for the last few weeks.
")
http://ocean.dmi.dk/arctic/meant80n.uk.php
NCEP is forecasting below freezing temperatures for much of the Arctic Basin during the next week.

This week, the sun reaches its highest point in the sky. Next week it starts its decline towards winter.
Now, the really interesting stuff. Arctic Basin sea ice volume (calculated from PIPS maps) remains close to the 2006 track, and well above the last three years

Area is slightly below 2006 and 2009.

Thickness is nearly identical to 2006 and 2007.

Conclusion : 2010 minimum extent is on track to come in just below 2006. With the cold temperatures the Arctic is experiencing, the likelihood of a big melt is diminishing.
NSIDC shows extent lower than 2007. The modified NSIDC map below shows where they believe the gaps are (in red.)

On the surface, this appears to disagree with my measurement above that Arctic Basin ice area is greater than 2007. The difference is that I am only considering regions that have perennial ice – i.e my PIPS calculations assume that there is no summer ice in Hudson Bay or the Barents Sea, and that they are a “don’t care” for estimating minimum extent. You can see in my PIPS ROI (Region of Interest) maps for June 14 below, that there is excellent agreement between PIPS and NSIDC. 2007 had less ice in the Chukchi and Laptev Sea, and more in the Beaufort Sea.

PIPS June 14, 2010

PIPS June 14, 2007
The modified NSIDC image below shows ice loss since June 3.

The modified NSIDC image below shows ice loss since early April.

And finally, the modified NSIDC image below shows regions which have below normal ice extent.

My analysis indicates the highest late summer extent since 2006. In discussing, please remember that the regions in red above normally have no ice in September. They don’t figure in to the summer minimum.
Interesting plenary talk by Professor David Barber at the very recent Oslo Science Conference, mainly focusing on the 4th International Polar Year. Dr. Barber, a Canadian, has been studying polar ice for the last 30 years by actually taking research vessels out into the ice. His talk, titled: “On thin ice” talks about how the multiyear ice was much more rotten then expected in 2009, that they were able to cruise at high speed through ice that they did not even expect to get through with their ship.
According to this “on the ground truthing” the satillite data are substantially overestimating the thickness and strength of sea ice in the arctic. Here is the link
http://video.hint.no/mmt201v10/osc/?vid=55
Has anyone heard at WUWT of the Southern Hemisphere?
(I believe AW is there right now).
CT has Nth Hemp sea-ice 1.1 million km^2 below averge.
CT has Sth Semp sea-ice 1.3 million km^2 ABOVE average.
So it appear world-wide sea-ice is above average.
I just noticed a post above referring to Antartic sea-ice.
It is said that everything you need to know about life, you learn in Kindergarten.
My compliments to Steven Goddard and R Gates for having learned to play so well together.
It is always a pleasure when intelligent people disagree while retaining thier mutual respect.
Regards,
Steamboat Jack (Jon Jewett’s evil twin)
R. Gates:
Your link to Ron Lindsy’s web pages provides an excellent summary of summer sea ice prediction.
End of May: 4.44 +/- 0.39 million sq km based on extent
End of May: 4.76 +/- 0.51 million sq km based on thickness
End of April: 5.12 +/- 0.42 (extent)
End of March: 5.05 +/- 0.45 (extent)
End of March: 4.95 +/- 0.52 (mean ice thickness)
End of March: 5.93 +/- 0.56 (ice concentration)
In other words, 2010 predictions range from a low of 4.44 to a high of 5.93, give or take half a million. Thanks for confirming that summer sea ice extent cannot be accurately predicted.
Steve Goddard:
If you look at daily arctic temperatures versus historical average it seems as though most days were above normal for 2010 (so far). Showing the daily value subtracted from the average daily would show this more clearly. This would suggest a trend toward lower ice extent this summer if one believed daily temperatures were a driving factor.
Perhaps it would be interesting if you would address the Plenary Lecture by Dr. David Barber at the Polar Science conference in Oslo. http://video.hint.no/mmt201v10/osc/?vid=55
Dr. Barber’s points cannot easily be refuted using fancy statistical tricks or graphical analysis. Good luck with this one. One note, do not attack Dr. Barber’s credibility, there is no one on this blog who has more expertise than him on this subject and I think even Goddard and Watts would have to confirm that. Furthermore, Dr. Barber wasn’t always a climate change proponent, he was originally a skeptic but finally he saw the truth.
Przemysław Pawełczyk says:
June 14, 2010 at 11:07 pm
You haven’t been looking at the right maps:
http://weather.unisys.com/surface/sst.html
Jim,
discussing antarctic sea-ice is a moot point. see http://www.skepticalscience.com/antarctica-gaining-ice.htm
why is Antarctic sea ice increasing? There are several contributing factors. One is the drop in ozone levels over Antarctica. The hole in the ozone layer above the South Pole has caused cooling in the stratosphere (Gillet 2003). This strengthens the cyclonic winds that circle the Antarctic continent (Thompson 2002). The wind pushes sea ice around, creating areas of open water known as polynyas. More polynyas lead to increased sea ice production (Turner 2009).
Another contributor is changes in ocean circulation. The Southern Ocean consists of a layer of cold water near the surface and a layer of warmer water below. Water from the warmer layer rises up to the surface, melting sea ice. However, as air temperatures warm, the amount of rain and snowfall also increases. This freshens the surface waters, leading to a surface layer less dense than the saltier, warmer water below. The layers become more stratified and mix less. Less heat is transported upwards from the deeper, warmer layer. Hence less sea ice is melted (Zhang 2007).
Ed Struzik wrote at Yale Environment 360 that until recently the Arctic was locked up in ice year-round. I wrote a comment that the Northwest Passage was sailed in 1903-1906 by Roald Amundsen and in 1940 and 1944 by Henry Larsen, but my comment did not make it through moderation.
http://www.e360.yale.edu/content/feature.msp?id=2281
BillD
“Rotten multi-year ice.” That is a new term. Where can I find a boat that cruises through four metre thick ice? Too bad the Titanic didn’t have that technology.
Jim says:
June 15, 2010 at 4:00 am
Yes, you have hit upon the key data point: The Global Sea Ice is above normal and rising.
Something that did not happen in most of 2007.
The forecast models are for a lot of the N. Hemisphere to be below normal temps well into November.
The Ice Panic Alarmists are pushing vaporous buttons.
What else is new?
Przemysław
Measured temperatures near the pole have been below freezing.
http://psc.apl.washington.edu/northpole/PAWS_atmos_recent.html
John Silver says: June 15, 2010 at 2:30 am
“Please don’t write “normal” when you mean “average (1979-2000)””
Please pass your comment onto NSIDC;
http://nsidc.org/about/contacts/
as they are responsible for misleading the public as to what “normal” is. Last week I noted that it was, “(misleadingly narrow due to NSIDC’s choice to exclude 2001 – 2010 data in order to make their Arctic chart look scarier/abnormal):”
http://nsidc.org/data/seaice_index/images/daily_images/N_stddev_timeseries.png
We’ve been down this road, and I believe that Dr. Walt Meier of NSIDC agrees, but thinks it it would cause too much confusion if they corrected their error now.
I am in complete agreement that a 21 year sample, or 31 years for that matter, in no way represents what the normal range of sea ice extent is for a 4.5 Billion year-old planet.
Steve,
This is slightly off topic yet may also have some contributing value.
Saskatchewan and Manitoba are close to the Arctic. Usually in the past they have had severe draughts yet this year, the basin is full of water. This is like 4 U.S. States growing fields underwater. This is flat land that grows mostly grains. The province beside it, Alberta was still recieving snow storms at the end of May.
Note how the low-concentration ice healed up between June 10 and June 13. Indicates a likely problem with the maps.
Steve from Rockwood
Does ice melt faster at -30C or -33C?
Is there some reason why a 3C temperature anomaly in January in the Arctic is relevant to forecasting summer extent?
I don’t see why minimum ice extent has to be the measure of arctic temperature.
There are any of several means by which ice can melt besides air temperature and sunlight, such as ocean currents and disruption of the ice sheet by the fleet of icebreakers that break up the ice every spring to open Russian and Scandinavian ports and shipping lanes. There are tours to the Pole. Nuclear ice breakers can make 10 knots through 8 feet of ice. There are ice breaking cargo ships. This breakage opens up more sea to sunlight and more ice area to water. Once old ice is broken and melts, it is new ice every year.
I think a better measure is the formation of new ice in the winter (max area less succeeding minimum area), which is at highs not lows.
Google “ice breaker” – lots of video available too.
Don B,
Amundsen completed a three-year voyage after THREE winters trapped in ICE. Although his chosen east–west route, via the Rae Strait, contained young ice and thus was navigable, some of the waterways were extremely shallow (3 feet, or 1 meter, deep) making the route commercially impractical. Henry Larsen took 27 months the first time in an ice fortified schooner.
On May 19, 2007, a French sailor, Sébastien Roubinet, and one other crew member left Anchorage, Alaska, in Babouche, a 7.5 m (25 ft) ice catamaran. The goal was to navigate west to east through the Northwest Passage by sail only. Following a journey of more than 7,200 km (4,474 mi), Roubinet reached Greenland on September 9, 2007, thereby completing the first Northwest Passage voyage made without engine in one season.
Slight difference in the amount of open water between the two eh? Ice-forified schooner and no engine catamaran…
As Stephen Wilde said (in other post), this seems to be the cause:
When the polar high pressure cells drift equatorward during a period of negative polar oscillations that allows more inflow of warm air into the polar regions at the same time as there is a greater flow of cold air to the mid latitudes.
Which it does not mean the earth is warming but the contrary.
I find it cheering news that so many here are convinced of the expertise of the esteemed Dr. David Barber, and are so highly recommending his presentation. After all, he decisively demonstrated the inaccuracies of satellites, specifically with their identifying as thick multi-year ice what was in reality rotten thin ice.
Thus if you accept that he is indeed an esteemed expert on Arctic sea ice, you logically should also accept that the satellite data is best not used when discussing Arctic sea ice as it has been decisively shown to be flawed and unreliable.
Also, based on the expertise of the esteemed Dr. Barber, one must logically conclude that Steven Goddard is likely correct about the “phantom thin ice” of the UIUC images, as both he and the esteemed Dr. Barber are in agreement that the satellites do get it wrong.
Cheering news indeed.
Robert says @4:44 am:
“Jim,
discussing antarctic sea-ice is a moot point…”
No, it is merely an inconvenient point to our friends visiting from RC. The Antarctic is gaining ice, and Robert doesn’t want to discuss that uncomfortable fact because it debunks the CAGW conjecture.
Three months until ice reaches minimum. Time goes by fast.
Steve,
I love it when you completely ignore the rebuttal points I made regarding the concentration the the Beaufort Sea, as well as Dr. Lindsay’s analysis of why the early season condition of ice in the Beaufort Sea, Kara Sea, and Barants Sea is one of the best predictors for late summer sea ice extent. Also, the fact that all three of these are well below their 30 year means just passes right over you, as you try to suggest that somehow the Arctic sea ice is in better shape than it was 30 years ago.
You said it will be a “few weeks” until there will be no reason to speculate about the accuracy of your predictions. Well, more like a few months, but whose to quibble about the bulk of the melt season.
And BTW, I’ve been rock solid at a 4.5 million sq. km. projection for minimum melt (based on IJIS/JAXA data) for many months (since March actually), and that’s well documented here on WUWT, so please don’t try to put any other words in my mouth or spin what I say.
In more important news, New Zealand scored with 30 seconds left to tie Slovakia 1-1. Something which actually affects people’s lives.
Robert says (at 6/15, 5:38): “Slight difference in the amount of open water between the two eh? Ice-forified schooner and no engine catamaran…”
Very interesting trip by Mr. Roubinet, and not one with which I was familiar. Kudos to him!
I think, though, that using Roubinet as an example weakens the argument that the ice is less now than in some past periods. Here is why I think that. Roubinet’s catamaran is quite a bit faster than a single hull gaff rigged sloop (which Amundsen had) and in fact has a VERY much shallower draft. Where as Amundsen’s ship needed between 7.5 and 12 feet of water, Roubinet’s catamaran needs between zero and 4 feet of water. Zero? How can a boat sail in zero feet of water?! Because Robinet’s catamaran is a combination catamaran and ice boat. It is equipped with blades like ice skates and can literally be sailed on ice when there is no water at all. By the way, perhaps 150 years ago, ice boats were the fastest means of transportation in the world. A well designed one (and I am not saying that this typifies Mr. Roubinet’s boat while in ice mode) will hit between 60mph and 100 mph. Fast!
Anyway, congratulations to Mr. Roubinet on a wonderful adventure, but his success does not in any way demonstrat that the Artic ice is unusually sparse these days.