By Steve Goddard

Guardian photo : Ann Daniels Enjoying The Warming Arctic
Yesterday, WUWT reported on a University of Melbourne study claiming that melting ice is behind the warming of the Arctic.
“Findings published in Nature today reveal the rapid melting of sea ice has dramatically increased the levels of warming in the region in the last two decades. The sea ice acts like a shiny lid on the Arctic Ocean. When it is heated, it reflects most of the incoming sunlight back into space. When the sea ice melts, more heat is absorbed by the water. The warmer water then heats the atmosphere above it.”
If this were true, we would expect to see that months with the most ice loss would also show the most warming. In fact, we see the exact opposite. As you can see in the graph below, most Arctic warming from 1979-present has occurred in the winter and spring, with very little warming during the summer.
")
By contrast, ice extent trends over that same time interval show that ice loss has occurred mainly during the summer. It appears that the relationship between warming and ice loss is inconsistent with the claims in the University of Melbourne study. Temperatures have increased the least during times of year when ice loss was the greatest.
")
April is the month which has warmed the most, a full seven months after September – the month of peak ice loss. There is very little variation in ice extent year over year during April – except for this year which is running well above any other recent years.

http://ocean.dmi.dk/arctic/icecover.uk.php
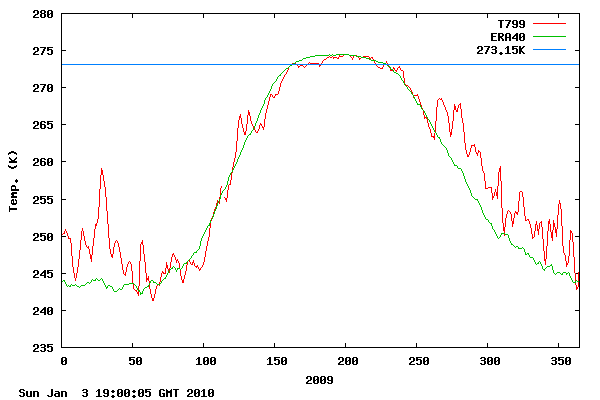
A couple of other familiar graphs showing the same issues can be seen below. Note in the DMI graph below that Arctic temperatures have not warmed at all during the summer in the central Arctic.

In the Cryosphere Today graph below, you can see that most ice loss has been during the summer, when there has been little or no temperature gain.

The scatter plot below shows Arctic temperature trends vs. the absolute value of ice extent trends, for all 12 months. Note that there is no meaningful correlation between temperature trends and ice loss. In fact, the months with the most increase in temperature seem to be the ones with little ice loss.

The article claims
” Strong winter warming is consistent with the atmospheric response to reduced sea ice cover.”
But this is inconsistent with the fact that there has been very little reduction in winter ice cover. The temperature of water under the winter sea ice is fixed by thermodynamics at -2C down to a depth of tens of metres, and does not vary from one year to the next. Furthermore, the rate of heat transfer through 2-5 meter thick 99+% concentration ice, is very low. NSIDC is currently showing ice extent right at the 1979-2000 mean, and above the 1979-2009 mean – yet temperatures in the Arctic have been well above the mean all through the spring. How is the heat escaping through all the thick, high concentration ice?

http://ocean.dmi.dk/arctic/meant80n.uk.php
The article also claims :
“reduced summer sea ice cover allows for greater warming of the upper ocean….The excess heat stored in the upper ocean is subsequently released to the atmosphere during winter.”
There is a major problem with that theory. The summer minimum occurs at the autumnal equinox when the Arctic is receiving almost no SW radiation, and that which is being received is well below the critical angle of water. By September, the shortage of insulating ice cover is actually causing a net loss of heat from the ocean. NSIDC explains it like this:
“In the past five years, the Arctic has shown a pattern of strong low-level atmospheric warming over the Arctic Ocean in autumn because of heat loss from the ocean back to the atmosphere. …. As larger expanses of open water are left at the end of each melt season, the ocean will continue to hand off heat to the atmosphere.”

In other words, loss of summer ice should produce atmospheric warming in the autumn, but not in the winter and spring when ice is cover is normal or near normal.
Two years ago, WUWT published this article after review by Walt Meier at NSIDC, Roger Pielke Sr. at CU, and Ben Herman at the University of Arizona. It explains why changes in ice cover probably are causing a net cooling effect. None of the reviewers had any substantive disagreements with the conclusions.
Conclusion: The University of Melbourne study claims are not supported by the available data. The authors seem to have jumped right into statistical analysis without proposing a physical mechanism that works. Heat flows across differences in temperatures, yet the winter water temperature under the ice is fixed at -2C. Thus elevated winter air temperatures should actually cause a reduction in heat flow out of the ocean. Whatever is driving increases in winter Arctic temperatures is not heat coming out of the Arctic Ocean, which is covered with insulating ice.
A more logical conclusion would be that the decline in ice thickness is associated with warmer winter temperatures.
If scientific reasoning were limited to the logical processes of arithmetic, we should not get very far in our understanding of the physical world. One might as well attempt to grasp the game of poker entirely by the use of the mathematics of probability.
– Vannevar Bush
I just don’t understand how any credible scientist can really believe that the earth’s climate system is so unstable.
Arctic ocean currents are key to North Atlantic temperature changes. It is an interesting fact (whether coincidence or causal correlation) the Geomagnetic field in the Arctic area has the same historical trend as the NA temperature.
http://www.vukcevic.talktalk.net/LFC16.htm
http://www.vukcevic.talktalk.net/LFC8.htm
“In other words, loss of summer ice should produce atmospheric warming in the autumn, but not in the winter and spring when ice is cover is normal or near normal.”
I shall assume the highlighted “is” is extra, rather than the “c” and the “is” before “normal” are mistakes.
Otherwise, another great job by WUWT’s new regular non-guest poster! (Hope you’re getting paid good for this gig.)
Nice post Steve. Thank you.
“[…] Whatever is driving increases in winter Arctic temperatures is not heat coming out of the Arctic Ocean, which is covered with insulating ice. […]”
Gosh! I thought it was obvious. All the thermometers spend the winter in Palm Beach. ;o)
Funny, how often even amateurs can debunk todays “scientific claims”.
Influx of warmer Atlantic water caused by AMO is sufficient enough for explanation. Positive feedback by ice loss is obviously not strong enough, since once the AMO switches to cold, the ice extent inevitably increases again.
http://blog.sme.sk/blog/560/195013/arcticamo.jpg
So the ice extent recovering is going to cause a net warming?
It’s worse than we thought.
/sarc off
Climatology definition: Effect is the driving factor behind the cause. This paper is keeping with the approved “Climatology practices” developed for the IPCC review process!
I should mention a couple more things.
1. Open water in the autumn is a negative feedback, because it causes the ocean to cool by radiation and diffusion to the air – which can’t happen when it is covered with ice.
2. When the open water freezes in the autumn, it exothermically releases ocean heat to the atmosphere, causing warming of the air and loss of heat from the ocean. Once again, this is a negative feedback because it reduces the heat content of the ocean.
If a smidgeon of CO2 can cause CAGW why not ice? LOL
I think Nasa’s SDO is going to shed more light on the subject than hacks needing to publish something, anything.
I am old fashioned. Before the CO2 epidemic, warming caused melting and not melting caused warming.
Nice post Steve, except I think your logic is flawed. Low summer ice means more warming of the water, and that heat is not released until later in the season. We don’t see maximum ice extent until March, (almost spring, and past March 21st this year as we all know). At some point in the fall and early winter, that excess heat that was absorbed during the summer would begin to release, raising temps in the fall and early winter. I honestly think the Melbourne study makes perfect sense, though your analysis is thorough, it is not looking at when the maximum sea ice extent actually occurs.
BTW, it looks like some day in the next week or so, arctic sea ice extent will be falling below the 2009 extent for the same date, and based on my projections, will likely stay below 2009’s level until we hit the summer minimum extent in September. That ice that you said was “10 feet thick” off of Barrow Alaska is only about 4 feet thick, and I think will indeed be melted away come August. Lots of open ocean N. of Alaska this summer, and on the other side of Arctic, the talk of Svalbard is “where’s the ice?”.
Note, the reason why the amplified warming occurs in autumn is because the heat the ocean gained in summer is released back to the atmosphere when the ice reforms. If the ocean was keeping all that heat it gained, the oceans under the sea ice would be warming substantially. There is some evidence that some of the heat is retained in the ocean, but most of it is released back out to the overlying atmosphere.
The reason you don’t see the warming in summer from the melting of ice is because the energy from the sun is used to melt the remaining sea ice and increase the sensible heat content of the upper ocean, limiting changes in surface and lower tropospheric temperature. The heat goes into the ocean and the ice, not out of. Thus, the premise of this blog is incorrect.
Increasing solar activity will show up strongest in monthly trends from the equinoxes, when aurora and solar storms are strongest. Increasing ice loss at the Autumn equinox would be expected, especially after a nightless summer. The Vernal Equinox warming will not be able to have such an impact on relative ice loss trends, simply due to so much more ice being there at that time of year.
Steve, if you look at this winters (DJF) 925 temperature anomalies and compare those with DJF sea ice concentration anomalies you will note the largest temperature anomalies are directly over the regions of the lowest ice concentrations. This is most likely a result of thinner/lower ice concentration ice than from advection of warm air into the region. You can get a figure of the DJF 925 temperature anomalies from NCEP and the sea ice concentration anomalies from NSIDC and see for yourself.
The issue remains a hot issue: thanks Steve. In the early part of last century the Arctic warmed suddenly since winter 1918/19. The warming was and remained highly pronounced during the winter season until 1940
http://www.arctic-heats-up.com/img/c1-p1_s.jpg , and in the Atlantic sector http://www.arctic-warming.com/hottopics/20080422/clip_image002.jpg , a clear indication that not sun ray/reflection was the cause but the ocean in general, and the West Spitsbergen Current in particular. The early Arctic warming was recently discussed here WUWT/04 Nov. 2009, http://wattsupwiththat.com/2009/11/04/arctic-warming-goes-with-the-floe and with figures available at http://www.arctic-warming.com/_FIN_Feb2010_WEB_CC_Arctic1919.pdf .
Trends can be useful, I would break it down and see which Autumn`s were warmer, and what I could correlate that to.
R. Gates,
The sun is high in the sky from mid-April to mid-August. During most of that time sea ice has not been reduced significantly. The losses have been primarily mid-August to mid-October, when the sun is getting low.
Have you seen today’s NSIDC graph?
http://nsidc.org/data/seaice_index/images/daily_images/N_timeseries.png
Ice doesn’t warm as it melts and warmer water in contact with the ice gives up heat and cools to melt the ice. That is why you have a relatively constant temperature in summer that does not change from year to year. In winter, the rate of heat loss to space is controlled by the thermal conductivity of ice and it’s changing thickness. The thinner the ice, the higher the skin surface temperature, thus a higher rate of heat lost to space. CO2 has no measurable effect on OLR in the Arctic (http://www.kidswincom.net/CO2OLR.pdf).
Well, as the ice melts it is PREVENTING the ocean from warming, not CAUSING the ocean to warm. The calories which WOULD cause warming of the ocean are used up in melting the ice. The only time the ocean warms is when there is no ice present. SOME of the arctic ocean does warm in this way during summer because most of the ice cover has been lost, and the available calories can go towards warming the surface water. For parts of the arctic which never become ice-free, the ocean doesn’t warm at all.
What you are missing; however, is that if melting ice caused a positive feedback (i.e. more warming than would otherwise be expected) then it would be an automatic tipping point, and there should be no arctic ice whatsoever.
I don´t see someone discussing the heavy fog in Arctic sea summer.
Does it have any effect on albedo?
If this is the quality of Nature’s papers and the quality of the peer review process they use, then I think publishing in Nature would put any researchers reputation at great risk? If I produced work like this I would not have any clients and despite my professional stamp my work would be ignored.
Steve, why not do some analysis of the winter ice motion for this year?
Look at the buoy data, or the ice motion data produced by various institutes. what you will find is that the Transpolar Drift Stream was much reduced, but ice flow out of Fram Strait was not below normal. Also, the Beaufort Gyre was much enhanced, leading to advection of old ice into the Beaufort and Chukchi Seas.
Sea ice that forms or drifts into the Beaufort Gyre may circulate around the Arctic for several years, accumulating snow and thickening each winter before exiting out of Fram Strait. Thus, a stronger Beaufort Gyre as observed during a negative AO phase should help to replenish the ice cover which may slow summer ice loss in this region. While this has been true in the past, more recent years have seen removal of ice transiting the Beaufort Gyre (i.e. the ice is more prone to melting out in the Beaufort Gyre in summer). In the late 1990s, ice began to melt in the southernmost stretch of the Gyre before completing the circulation. In summer of 2007, sea ice retreat was especially pronounced in the region encompassing the Beaufort, Chukchi, East Siberian, Laptev, and Kara Seas. 2007 saw the most positive Beaufort Sea High (BSH) from 1979-2008. A strong BSH in summer leads to positive air temperature anomalies over much of the western Arctic Ocean, favoring ice melt. While there is no obvious trend in the BSH for any seasons, the BSH has been positive for four of the past five years in summer. A positive BSH in summer favors a decrease in ice concentrations in the Beaufort and Chukchi seas through advection of ice away from the Alaskan coast and through advection of warm air into the region [e.g. Rigor and Wallace, 2004].
Ogi et al. [2004] suggest a linkage between winter and summer AO indicies, such that a negative AO in winter tends to be followed by a negative AO in summer. So…a stronger BHS again this summer would not be good news for that old and thicker ice advected into the Beaufort this winter.
Also, look at the buoy data. It shows very slow ice growth rates this winter.
BTW…the ice loss is most significant at the end of summer which makes sense since the heat is being input during the entire summer, accumulating to foster ice melt throughout the summer. You should look at the MODIS imagery from today and yesterday, and you will see that areas where NSIDC is still showing ice (i.e. Novaya Semlia) there really isn’t much ice at all there and it will be gone shortly (http://rapidfire.sci.gsfc.nasa.gov/subsets/?mosaic=Arctic)
Great debunk! Thanks!
From an Icecap publication I copied this quote:
“Goldberg said in 1977, there was a great climate shift in the Pacific Ocean, the temperature in Alaska increased by 3 degree C in one year. In 2008, it decreased 3 degrees back to normal which means the warm water is not going to the Arctic Ocean any more. “So when you hear the ice in Arctic Ocean is disappearing, it was because of this warm current flowing to the Arctic. Now it has stopped. So the ice is building up again. Very few seems to have understood this. They think it is the global warming that has melted the ice, but in fact, it is the warm current that melted the ice,” Goldberg said”.
http://www.iccap.us (third column, second article)
H.R.
Some mountain towns in Colorado leave their main water pipes above ground, because snow is a better insulator than dirt.
vukcevic says:
April 30, 2010 at 11:30 am
And what about these geomagnetic field changes caused by changes in the “solar wind”, forbush decreases,etc.?
BTW..here is a nice MODIS image of the Bering Sea
http://www.arcus.org/search/siwo
And here I thought that melting ice took energy input… 330-odd kJ/Kg IIRC
stevengoddard says: April 30, 2010 at 12:20 pm
Have you seen today’s NSIDC graph?
http://nsidc.org/data/seaice_index/images/daily_images/N_timeseries.png
Excellent! Now we are looking forward to a powerful Katla eruption that may possibly follow after Eyjafjallajökull eruption and earthquakes and then trigger the next (little?) ice age…
http://translate.google.co.uk/translate?hl=en&sl=is&tl=en&u=http://www.ruv.is/frett/skjalftavirkni-naerri-siglufirdi
Speaking of the Arctic, I am starting to think that I live there. This winter is about to pass it’s seventh month in Colorado, with no end in sight. I took this picture yesterday while cycling to work.
https://docs.google.com/Doc?docid=0AXKz9p_7fMvBZGR3ODJ3d3NfNjIzZGZxNGZ3aG0&hl=en
R. de Haan
I agree with Icecap about the PDO, and brought it up in a WUWT Q&A with Walt Meier in 2008. He didn’t believe it, but I think the idea is correct.
I want a magic predictamo-thingy like R. Gates has! I hope it works for lottery numbers too. It’s especially cool because it allows predictions based on feelings.
By the way, R. Gates, heat is released FAR more readily from open water than from under ice of any thickness. By that metric it is obvious that watching the Arctic ice cover is like watching a major portion of the global thermostat mechanism in action.
In our post-normal era, it’s the theory that drives the science, not the science that drives the theory. That’s how we’re getting so much objectionable science.
A couple of things to consider here:
1. The sea water is cold, close to 0 °C, so the air temperature near the open water, will stay not much about freezing during the summer anyway. So I think it would be more correct to look for changes in the sea temperature caused by the lower albedo.
2. It’s cloudy over open water in the arctic most of the time during summer anyway. Clouds should give a similar albedo. Even if there are few high clouds, a thin layer of fog just above the water is pretty common due to the cooling effect of the water especially at the very high latitudes.
useful stuff Steve – much appreciated, I agree – I can’t see the sun warming the ocean much after September 15th maximum sea ice loss because of the angle, and as the season turns, the exposed water will cool rapidly – I think the main temperature patterns are determined by winds, and these by whatever determines the shift (oscillation) of the high pressure/low pressure vortices and the strength of those winds, all of which affect currents below and clouds above – Arctic cloud increased by 14% from 1980 to 2000 and I think it then declined – and the strength and direction of the Beaufort Gyre is a crucial factor in the ice-dynamic – we have to look to what is driving the oscillations – and like Ulrich, I think it is likley solar and magnetic.
There is a major problem with that theory. The summer minimum occurs at the autumnal equinox when the Arctic is receiving almost no SW radiation,
Just a note here. They say “reduced summer sea ice cover”, this doesn’t imply that the ice is at it’s minimum. Having said that though, the annual extent bands narrow during the melt and I doubt the difference would add much to the ocean heat content. If it did then it should show up in the North Atlantic and it doesn’t.
North Atlantic
I would like to see the ice loss values for each December, January and February
compared to Sudden Stratospheric Warming events. The 1990`s only had 2 SSW`s.
http://www.appmath.columbia.edu/ssws/index.php
Enneagram April 30, 2010 at 12:41 pm
“And what about these geomagnetic field changes caused by changes in the “solar wind”, forbush decreases,etc.?”
Difficult to say but there appear to be a certain correlation (accidental or causal who knows?).
http://www.vukcevic.talktalk.net/LFC9.htm
R. Gates says:
April 30, 2010 at 12:04 pm
First, do you have a citation showing how much heat is released, and when it is released, from the warmer water? Because in other parts of the planet, the lag is usually on the order of a month or two. For example, the peak insolation in the Northern Hemisphere is in June. The warmest month, on the other hand, is July or August. Here’s the lag by latitude:

Note that further north, the lag is less. And nowhere is the lag three months.
Second, if what you say is true, what is causing the warming in April?
Third, if what you say is true, why is January warming so little?
Fourth, the real mystery is September and October. True, there is generally a lag in the peak of the energy release. But that only pushes the peak a bit later, it doesn’t mean no warming during the peak month. The month of greatest heat gain is not far down on the temperature list, because when the ocean warms it immediately begins to lose more heat. So why is September and October not warming? Is it your claim that the heat is absorbed in September but hardly radiates at all, stays hidden for three months, and then comes out when the area is covered with ice in December? I don’t think so …
Steve, nice post. I started one after seeing the article, because the claim looked bogus on the surface, it didn’t pass the laugh test. But your post is much better than mine was turning out to be.
Willis ,
Thanks. Much appreciated.
Vuk seems closer to the “primum mobile” with his relation to GMF. If this GMF also relates to other variables, then thay way would take us nearer to real causes and not just chatting on how much or little ice…
A rotating charged body will produce a dipolar magnetic field. Scientists discard this simple explanation because it is calculated for the Earth that the moving charge would have to constitute a current of a billion Amps, which implies a tremendously strong electric field at the Earth’s surface. But this simple electrostatic argument fails in a plasma environment. The electric field at the Earth’s surface reflects merely the difference in voltage between the Earth and its plasma sheath at the magnetospheric boundary with the solar wind. Like a bird sitting on a high-voltage transmission line, we are unaware of the electrification beneath our feet
Wallace Thornhill
Where is it the origin of climate?
kadaka,
I keep waiting for that big oil paycheck, but they are busy dumping all their oil into the Gulf of Mexico right now – as a thank you to Obama for opening up some offshore drilling last week.
They are talking as if the ocean under the ice was a closed system. The water circulates around the globe. But even when the water manages to get out and being exposed to open air, most likely that water will still be cooler than the air (assuming that the air is warmer than the ice (thus- the melting), the water would not give its “heat” up to the air. The air would actually be cooled down, else it violates the zeroth law of thermodynamics.
In the case of melting ice, again if ice was to give up its heat during the process it means that I could make hot tea by simply throwing a bunch of ice cubes in a cup… never seen that! It would gain violate the law of entropy.
Then, again… it’s not the first time that we see Miss Science being violated by global warmists.
“Ulric Lyons says:
April 30, 2010 at 1:19 pm”
Correction: major SSW`s.
http://www.geo.fu-berlin.de/en/met/ag/strat/produkte/northpole/index.html
LOL. Seriously. It took a moment for that photo of “Ann Daniels enjoying the warming arctic” to pop up as I was reading the headline and I did laugh out loud. Really appreciate the humor/sarcasm that is part of this site. Thanks Steve or Anthony for adding that perfect icing on this cake.
Now I guess I better read this article and the always informative and interesting comments.
MartinGAtkins says:
April 30, 2010 at 1:02 pm
Martin, you can look at the heating of Arctic SSTs here (http://www.arctic.noaa.gov/report08/ocean.html) from the retreat of the ice cover.
Yes, the Ocean does absorb the heat from the sun everywhere on the planet. What the study is looking at is the “change” in near surface atmospheric temperatures related to a decrease in sea ice (and hence an increase in open water). In the North Atlantic you don’t have this strong trend in more open water do you? But you do in the Beaufort, Chukchi, E. Siberian and Laptev seas.
Also, go to NCEP’s interactive web site and you can for yourself compute anomalies in latent and sensible heat fluxes, atmospheric water vapor, precipitable water content, etc. and see the heat transfer for yourself.
Good post Steven, I appreciate that you and others who post here take the time to stay on top of all this. Here’s what it looked like outside Carbondale, CO 1100hours on 4/29, at 6600 ft, a little higher than you:
http://i44.tinypic.com/vqifm0.jpg
R. Gates says:
April 30, 2010 at 12:04 pm
Nice post Steve, except I think your logic is flawed. Low summer ice means more warming of the water, and that heat is not released until later in the season.
I have no problem with the premise of the paper. The question is, is the heat gained by the ocean significant and is it long lasting. As I understand things the very low 2007 extent was caused primarily by wind dispersal. Certainly it took a long time for the extent to recover so it’s reasonable to assume that sea temperature retarded refreezing.
As more ocean was exposed during early refreezing it’s also reasonable to assume that there was an increased loss of heat gained during the previous summer. Indeed when the refreeze reached November it excelerated and caught up with the extent in previous years.
Willis Eschenbach says:
go to NCEP’s web pages and look at the sensible and latent heat fluxes for yourself. Remember the basic energy balance equation reads:
Net radiation = net solar + net longwave
The available net radiation is used to do work in the Earth-atmosphere system, i.e.
Net Radiation = sensible heat flux + latent heat flux + subsurface ground heat.
A book by Oke 1987 can provide you with the basics.
Willis,
You asked “So why is September and October not warming?”
Because there isn’t much solar energy being received and the radiative energy balance is strongly negative.
Interesting post.
I have a minor question, which I’m sure someone can sort out for me. The main objection against the paper seems to be “If this were true, we would expect to see that months with the most ice loss would also show the most warming. ”
I understand this if we assume that the transfer of energy at all time goes from the sea to the atmosphere, because an ice cover insulates. This assumption seems to be valid during winter, where we do see a strong warming, but how do we know that it is also valid during the summer months? Wouldn’t less ice cool the atmosphere, and warm the water during summer?
I’m no scientist, but when ice melts in my gin and tonic the temperature of the drink goes down.
What about soot?
mb
My main objection is that there is no conduit for heat to move from the Arctic Ocean to the atmosphere during the winter. The water is -2C for several tens of metres depth, and above is capped by ice. Any “excess” heat that is contained in deeper layers of the ocean has no mechanism to move vertically into the atmosphere.
The summer warming theory is based on the idea that seawater is less reflective than ice, and thus warms both the water and the air above. There is little landmass around to absorb incoming UV, so the atmosphere over ice remains cold all summer in the Arctic Basin.
Completely off topic, but typical –
It turns out, by the way, that oil rigs today generally don’t cause spills. They are technologically very advanced. Even during Katrina, the spills didn’t come from the oil rigs.
Barack Obama – April 2, 2010
Ray says:
April 30, 2010 at 1:37 pm (Edit)
Actually, Ray, much of the time the water is warmer than the air, and often is the cause of the melting. Consider ice in the spring, when the air temperature is say -10°C. The water under the ice is typically just below freezing, which for sea water is about -1.9°C. If the water warms slightly (remember there is a constant current running under the ice which may be bringing in warmer water), the ice will start to melt, even though the air temperature is well below freezing.
Another often unremarked fact is that ice is a pretty good insulator. If the water under the ice warms, the ice keeps that warmth from radiating to space, and thus keeps the system warmer. Ice keeping the system warmer … go figure. I don’t know if this is accounted for in the climate models, it may well be. But I don’t see it in the study.
Finally, the study doesn’t use actual data, but ERA reanalysis data. While reanalysis data is better than nothing, I wouldn’t place a whole lot of reliance on it …
w.
Willis Eschenbach says:
April 30, 2010 at 4:10 pm
Finally, the study doesn’t use actual data, but ERA reanalysis data. While reanalysis data is better than nothing, I wouldn’t place a whole lot of reliance on it …
As reliable as the DMI data that Steve uses then?
Gee Ann Daniels should cover up those lips.
brc says:
April 30, 2010 at 3:17 pm
I’m no scientist, but when ice melts in my gin and tonic the temperature of the drink goes down.
I think the G&T has confused the ‘temperature inversion’ level of ~4C in water with the temperature of ice formation in water (~0C). 🙂
Best regards, suricat.
More alarm on the effects of CO2 from one of the paper’s authors:
”
Says Melbourne-based climate expert Professor Ian Simmonds: “Progressively you are creating an environment which is going to encourage more intense cyclones. In terms of statistics they are becoming less frequent but more intense.’
Simmonds and Brazilian scientist Alexandre Pezza last year published a groundbreaking paper arguing global warming had contributed to the appearance of the first documented tropical cyclone in the South Atlantic.
”
I’d like to see their evidence !
This paper makes the classic mistake of assuming that statistical correlation implies causation. The strong statistical correlation between air temperature and sea ice coverage shown in Figure 2 could occur: a) because the trend towards reduced sea ice causes a trend towards higher temperatures (the author’s hypothesis), b) because the trend towards higher temperatures causes a trend towards reduced sea ice, or c) because both move in parallel with changes in a third phenomena, for example the AMO. (The Atlantic is a major source of energy input into the Arctic.)
What evidence does Dr. Screen offer to support his hypothesis that sea ice controls temperature? His only evidence is that the temperature increase is strongest at surface, a phenomena that wasn’t present in the ERA-40 data but is found in ERA-Interim data. (He also discusses two other alternative explanations. 1) Trends in cloud cover do not correlate with trends in temperature/sea ice. 2) A trend towards increased water vapor is present in the summer, when the trend towards increased temperature is weakest.)
Does Dr. Screen’s hypothesis make sense? It certainly doesn’t in winter, when the strongest temperature trend is observed. The methods summary indicates that “changes in sea ice cover were calculated by averaging sea ice concentrations over the Arctic Ocean (north of 70 degN)”. In winter, the only region in the Arctic north of 70 deg that is not consistently covered with sea ice lies between Scandinavia, Svalbard, Nova Zembla, and Greenland. Dr. Screen is asking us to believe that modest changes in ice coverage in this region (about 60 deg of latitude at 75 degN) manages to influence temperatures throughout the entire Arctic basin and produces a temperature trend of +2 degC/decade at 85 degN.
How does Dr. Screen explain why the temperature trend is much weaker in the summer when the trend in sea ice is much stronger? “The near-surface warming is modest in summer because energy is used to melt remaining sea ice and warm the upper ocean.” Where does this “energy” come from? It doesn’t come from the air, because Figure 1 shows only a weak trend (none of the dreaded “Arctic Amplification”) towards warming at the surface during the summer. And there is a trend towards less ice to melt and consume energy. Furthermore, the greatest warming trend in the spring and fall occurs at 85-90 degN, but the greatest trends in sea ice are occurring much further south during these seasons.
The worst aspect of the paper is the alarmist statement at the end of the abstract – which isn’t supported by any evidence or discussion in the paper: “The findings reinforce suggestions that strong positive ice–temperature feedbacks have emerged in the Arctic, increasing the chances of further rapid warming and sea ice loss, and will probably affect polar ecosystems, ice-sheet mass balance and human activities in the Arctic.” First, the Greenland ice sheet only melts in the summer, when the hypothesized influence of sea ice on temperatures is weakest and far south of the greatest change in temperature (north of 75 degC). The observed moister air could produce increased snowfall to negate melting. Second, there are no human activities and little, if any, ecosystem where the dramatic warming has been observed (north of 75 deg). Since the warming mostly occurs in the non-summer months, it is probably beneficial.
stevengoddard says:
April 30, 2010 at 3:36 pm
“The summer warming theory is based on the idea that seawater is less reflective than ice, and thus warms both the water and the air above. There is little landmass around to absorb incoming UV, so the atmosphere over ice remains cold all summer in the Arctic Basin.”
You mention UV, but UV penetrates ocean depth (and ice) to far greater depth than IR, and fractionated snow only diffuses UV. Thus, I assume that energy from UV will present with a large delay.
Why a large delay? Because IR penetrates 2-3 metres of ocean depth whereas UV penetrates to <700 metres of ocean, or ice, depth.
Let me correct that! The depths I quoted are for pure water and ice.
Best regards, suricat.
Typo in the main post:
“NSIDC is currently showing ice extent right at the 1989-2000 mean,”
Should be 1979.
[Fixed, thanx ~dbs]
You must be mistaken Steve. After all you are just depending on actual observations and simple physics while those real scientists in Melbourne probably have a brand new computer and a neat programme.
And I wonder why the Australian government has got cold feet over an ETS?
Observe that the Cryosphere Today graph is 3 years out of date. Anyone who visits there regularly will be familiar with the way the site keeps very nearly up to date on a daily basis in many of its data, while the elements showing the greatest efforts on their part to promote date from about 2007, coincidentally the year of record low sea ice extent.
A year ago I asked them directly why certain aspects of the site appear to show neglect or are arranged in a particular way, and why the southern hemisphere is given short shrift. The reply I received said, in part,
Given the seasonal progression of sea ice I can see why there is probably little interest among “users interested in climate change detection…” in updating this graph.
Obviously this article is merely displaying the “breathtaking ignorance”* of WUWT posts as per usual.
Please Anthony, keep it up – this sort of ‘ignorance’ is fantastic ammunition against all the HGW hysterics out there.
* http://climateprogress.org/2009/06/05/nsidc-director-serreze-death-spiral-arctic-ice-wattsupwiththat/
(last one got swallowed, poss because of a link in it)
suricat says:
April 30, 2010 at 5:22 pm
From my experience of ice, I would be extremely surprised if anything could get through 700 metres of the stuff. Half a mile? Come on….
In the winter, the weatherman around here always say “and 5 to 10 degrees warmer by the water” until lake Huron ices over; when the arctic ocean water is -4.5 degrees and the air temp is -40 degrees, a little open water is going to warm the air pretty fast. It’s actually pretty awe inspiring to see the lake steaming in the winter.
stevengoddard says:
April 30, 2010 at 3:48 pm
As was the language in use today as NOAA spoke of “leaking oil faster than was previously thought”.
So what happened, did the valve get put in backwards where on is off, global warming causes global cooling, and melting sea ice causes heat to be generated?
Maybe they should the yellow submarine back down there and tell them to turn the shutoff valve to the ‘other off’.
R. Craigen says: April 30, 2010 at 6:30 pm
“Observe that the Cryosphere Today graph is 3 years out of date. ”
http://arctic.atmos.uiuc.edu/cryosphere/IMAGES/seasonal.extent.1900-2007.jpg
Yes, it is most troubling that this chart is not kept current, thus obscuring the present arctic sea ice conditions and potentially misleading a casual reader. Perhaps we should email them at;
Requests about polar data to cryosphere-data@atmos.uiuc.edu
and Questions and/or comments about polar science to cryosphere-science@atmos.uiuc.edu
to see if we can get them to update this chart…
Are there long term trends in wind direction?
If the Earth, generally speaking, had winds blowing air from the equator to the poles, rather than from the poles to the equator, for an extended period of time this would make a bit of difference on temperature globally.
How about it, any good data on wind direction/speed in the ol’ climate database? No?
I am shocked something important was overlooked.
JER0ME says:
April 30, 2010 at 7:27 pm
suricat says:
April 30, 2010 at 5:22 pm
“”Why a large delay? Because IR penetrates 2-3 metres of ocean depth whereas UV penetrates to <700 metres of ocean, or ice, depth.""
"From my experience of ice, I would be extremely surprised if anything could get through 700 metres of the stuff. Half a mile? Come on…."
"Come on" nothin'! Read this!
http://books.google.com/books?id=C5kRs1z_CYoC&pg=PA56&lpg=PA56&dq=UV+absorption+of+water+vapour&source=bl&ots=bLYkuKb6z8&sig=ShuCKHswM8g8Axo3FbNG27gSi7w&hl=en&ei=7KqASrLnO8SMjAem5IH2CQ&sa=X&oi=book_result&ct=result&resnum=9#v=onepage&q&f=false
After you've read it you'll understand my caveat of 'pure'! Lab experiments are not the same as experiments in the field, they require logical extension. However, they do offer insight.
Best regards, suricat.
“In fact, we see the exact opposite.”
Seems to be a lot of that with global warming predictions.
Where is the famous ‘death spiral’ of Mr. Serreze? http://nsidc.org/data/seaice_index/images/daily_images/N_timeseries.png
jeff brown says:
Seems like you left out the quote of what I said … so I’m not sure what you mean. What am I missing?
stevengoddard says:
Sorry for the lack of clarity, Steve. I understand why the arctic cools in the fall. I was referring to the claim by R. Gates that
If R. Gates is right, the low summer ice (bottoming in September) should have caused warming that would be “released” in October and November, not December. My point was that we haven’t seen that, so R. Gates claim is very doubtful.
So, H2O’s phase change from solid to liquid is an endothermic process?
Whoda thunk it.
Phil. says:
April 30, 2010 at 4:40 pm
Steve used a host of data above, including DMI data. In this case, all of them seem to generally agree. I have posted my objections to the DMI data before. So I’m not sure what your point is here.
The DMI use the ERA reanalysis data as well, so I don’t place a lot of reliance on them either. As I said above, they may be the best we have … which ain’t sayin’ much …
However, DMI seem to screw even that up, because in many years there is a large jump between the last day of one year and the first day of the next. I don’t know why.
Dave F says:
April 30, 2010 at 10:48 pm
Not sure if this is a woosh, but there is lots of wind data at that most marvellous of resources, the KNMI database.
April 6, 2010
Cold snap causes late-season growth spurt
http://nsidc.org/arcticseaicenews/
” This was the latest date for the maximum Arctic sea ice extent since the start of the satellite record in 1979.”
suricat says:
April 30, 2010 at 11:38 pm
OK, fair enough to some extent, but I am seeing a figure of 100 m in ‘pure’ seawater (whatever that may be – as you say, it is difficult to find, although the author seems to have found some (I lost the name of the sea)).
Assuming this is correct, and I would probably only be able to read a page of that lot without nodding off, skimming that section did not mention ice apart from to lump it in with liquid water once. Assuming that the absorption is similar, and you had ‘pure’ ice, you may then go for 100m depth. I do not think that ice remains ‘pure’ in most circumstances outside of domestic ones. It cracks and ripples all possible ways. You can’t normally see through it AT ALL, let alone a few cm, except in rare circumstances. I know that is visible light, not UV, but deflection is deflection, and the wavelengths are very comparable.
“Dave F says:
April 30, 2010 at 10:48 pm
Are there long term trends in wind direction?”
Yes, a strong run of Major Mid Winter Sudden Stratospheric Warming events since 1998 (marked * );
http://www.geo.fu-berlin.de/en/met/ag/strat/produkte/northpole/index.html
extend that list here;
http://acdb-ext.gsfc.nasa.gov/Data_services/met/ann_data.html
The longer CT keeps those old graphs up to push their agenda, the greater will be skepticism of AGW. It just helps the skeptics cause so I’m all for them NOT updating the graphs. In fact, I would surmise that it is precisely for this reason that skepticism is growing day by day. I don’t think the MSM realizes this either…
Dave F;
Compare;
http://ocean.dmi.dk/arctic/meant80n.uk.php
to;
http://www.geo.fu-berlin.de/en/met/ag/strat/produkte/northpole/index.html
noting the month the SSW occurs.
Also can you see Canadian Warmings on the decline from the early 1990`s, but returning again since 2004/5.
Thanks Steve for another excellent and thought provoking post which debunks another piece of poor climate science.
I think a big factor which dictates the degree of summer melt, which contributes to the annual ice minimum, is the degree of cloud cover. This is a snippet from the NSIDIC site:-
“The most important characteristic of clouds in the Arctic is the summer stratus. From about mid-June to mid-September, the ocean area covered by sea ice is 80 to 90 percent covered with this cloud type. Summer stratus has important effects on the radiation balance of the surface.”
This indicates to me that TSI is also not a significant factor in the melt and we need to look at changes to strength, direction and temperature of ocean currents to account for variations in sea ice minimums. Wind strength and direction also play a significant role in the melt process. It would be interesting to find out if solar activity effects sea and air currents, although I suspect that the paucity of solid information about what happens in the Arctic basin would make this difficult?
paul jackson
Walt Meier at NSIDC explains :
If her mouth was really like that, I’d marry her. Every day would be a comedy show.
“Tenuc says:
May 1, 2010 at 5:14 am
It would be interesting to find out if solar activity effects sea and air currents,”
This has already been acheived. In mid 2007, I made a successfull forecast for a strong uplft in the solar signal, and the associated temperature uplift, from mid Jauary 2008. This coincided with a strong SSW. On this basis, from my weekly forecasts last winter, I expected a minor warming early December 2009, and a moderate warming from mid January 2010. This matches the results very well. I have also established that the Lunar position can pinpoint the few days that the SSW is most likey to occur at.
“Tenuc says:
May 1, 2010 at 5:14 am
This indicates to me that TSI is also not a significant factor in the melt”
I would suggest you look at solar wind velocity rather than TSI.
Study the values for December/January/February in recent winters;
http://www.solen.info/solar/coronal_holes.html
Willis Eschenbach says:
May 1, 2010 at 2:00 am
Phil. says:
April 30, 2010 at 4:40 pm
Willis Eschenbach says:
April 30, 2010 at 4:10 pm
However, DMI seem to screw even that up, because in many years there is a large jump between the last day of one year and the first day of the next. I don’t know why.
I think it’s because they only graph 360 days!
Willis Eschenbach says:
May 1, 2010 at 1:33 am
Willis, sorry I don’t know what you mean.
But anyway, let me ask you this. If there is a trend towards less sea ice in summer in the Arctic (which NSIDC and other institutions clearly show in their graphics). Then doesn’t that also mean a corresponding trend towards open water?
And if water absorbs more solar energy than the ice, what happens with that heat? Where does it go? Do you have evidence to show where it does?
How does water freeze? Where does the heat go? If you don’t want to believe the ocean is giving up it’s heat to the atmosphere before it refreezes, then what other explanation can you give?
Honestly the Nature paper isn’t all that noteworthy. It’s saying something we already know.
10% of global river discharge feeds the Arctic, changes in flow rate – yearly/monthly?
It all adds up.
The phase of the AO is also crutial; http://jisao.washington.edu/ao/
If I dared to look for a cylce, I would be looking at a 90yr cycle, positive from 1900, and negative from 1945, with strong +ve exceptions at very warm years like 1948/9, 1975/6 and the late 1980`s. And -ve exceptions in colder years like 1915, 1919, 1931, 1936, 1940/1/2 and 1947. This would project to the AO being in a positive phase till 2035, exceptions aside.
stevengoddard said on April 30, 2010 at 1:35 pm:
What big oil paycheck? You post here so often it is obvious Anthony has you on the payroll. Your own neglected site hasn’t seen an update since February, so clearly you are contractually obligated to offer such posts for publication on WUWT first with republishing on your own site not allowed (and Anthony buys everything to avoid the competition). We’ve noticed it no longer says “Guest post by” thus you’re now part of the team. (BTW Did you avoid any pesky IP rights clauses? It’d be a shame if WUWT Inc. had any claims against those fat royalty checks from your journal-published peer-reviewed papers.)
Oh, I expect we’ll see that increased off-shore drilling about the same time they start constructing those “clean safe” nuclear power plants that were promised during the election. Yup, that’ll happen any day now…
kadaka
payroll? contract?
ROFL – you have an active imagination. I get paid exactly the same amount for writing as I do for coaching rec soccer. Speaking of which, I am just back from another Arctic soccer match. Colorado is now into it’s eighth straight month of winter.
From stevengoddard on May 1, 2010 at 10:59 am:
ROFL – you have an active imagination.
Or I have merely just demonstrated how HTML could use not only a “sarcasm” tag but a “spoof” one as well… Although a simple method of denoting “not serious” could take care of up to 90% of all internet conflicts. Which could remove up to 95% of the internet’s potential for amusement thus on practical grounds it shall never be done.
I think some may find this excellent research article of interest. It’s pretty technical, but nicely summarizes some of the interrelated issues going on with AGW, sea ice, N. Hemisphere circulation, warming, etc:
http://www3.interscience.wiley.com/cgi-bin/fulltext/122665675/PDFSTART
I found this sentence from the conlcusion, very interesting:
“The most important conclusion of this and several recent papers is that the loss of summer Arctic sea ice can have an impact on larger Northern Hemisphere atmospheric circulation.”
But please read the whole article, and at least some of you who are still open minded might realize that things are a lot more complicated than they seem, and that the reduction of sea ice can have broader impacts than those discussed here, namely that the warming of air temperatures at other times of the year (other than peak insolation) can can be indirectly related to more open water through changes in atmospheric circulation patterns. The result of these changes would mean that temperatures could be higher at any time of year, and looking for some direct linear or immediate coorelation misses the more subtle interconnections of sea temperatures and atmospheric circulation patterns.
File LFC16 has been now updated with more information.
http://www.vukcevic.talktalk.net/LFC16.htm
“Ulric Lyons says:
May 1, 2010 at 8:57 am
This would project to the AO being in a positive phase till 2035, exceptions aside.”
What really bothers me is not loss of Arctic ice, but cold Northern Hemisphere winters.
Deterministic seasonal forecasts for the next 20 years anybody? I jest not.
One more thing…this is a great site to monitor during the melt season, to watch the sea ice melt inch by inch near Barrow AK:
http://www.gi.alaska.edu/snowice/sea-lake-ice/Brw10/
Had anyone else noticed that none of the good data/monitor/weather/climate sites are from the UK, and the really misleading ones are from Switzerland?
Is it appropriate to simply compare months within a year (see first 2 bar graphs)?
Is this only considering seasonal effects?
Would it be more appropriate to compare temperature anomalies between times of equal ice extent (including various lag times and possible adjustments for seasonal effects) over many years?
(I am posting this for a second time, delete if the first posting was actually successful)
Is it appropriate to simply compare between months within a year (see first 2 bar graphs)?
Is this is only considering seasonal effects?
Would it be more appropriate to look for relationships between temperature anomalies (also consider time lags and seasonal corrections) and time points having equal ice extent using many years of data?
jeff brown says:
May 1, 2010 at 8:34 am (Edit)
You seemed to be responding to something I had said … but you didn’t say what it was you were responding to. You had said:
What did I say, that you were replying to by telling me to “go to NCEP’s web pages and …”
w.
Ulric Lyons says:
May 1, 2010 at 8:57 am
“This would project to the AO being in a positive phase till 2035, exceptions aside.”
“What really bothers me is not loss of Arctic ice, but cold Northern Hemisphere winters.
Deterministic seasonal forecasts for the next 20 years anybody? I jest not.”
Here’s a broad forecast of temperatures for the next 100y based on our somewhat sketchy, proxy-ridden temperature history. This is based on solar activity and long-term weather quasi-cycles. However, because deterministic chaos drives our weather systems it can only show broad relative temperatures, also the timing is not exact. As long-term weather is self similar at all time scales, I expect the temperature within the next 100y will still oscillate up and down, but it will be cooler overall than we experienced in the previous century.
1410-1500 cold – Low Solar Activity(LSA?)-(Sporer minimum)
1510-1600 warm – High Solar Activity(HSA?)
1610-1700 cold – (LSA) (Maunder minimum)
1710-1800 warm – (HSA)
1810-1900 cold – (LSA) (Dalton minimum)
1910-2000 warm – (HSA)
2010-2100 (cold???) – (LSA???)
My prediction is that there will be an overall cooling during the next 25y compared to the last 15y temperature plateau and this will occur mainly during the NH winter. The Arctic sea ice will return to the levels seen forty years ago – the Antarctic sea ice will have a slight decline. NH farmers will revert to traditional ‘cold temperate zone’ short season crops pushing up the price of grain – swede for dinner anyone?
However. I don’t envisage any winter skating on the Thames or frost fairs, as our health and safety concious government will never let them happen!
Thanks for the link to the solar wind data, Ulric, I’ll have a play with the numbers tomorrow.
In these Annual Zonal Mean Time Series maps; http://www.cpc.ncep.noaa.gov/products/stratosphere/strat-trop/
the N.H temperature anomaly (T anom) series shows some very long lasting +ve anomalies occurring Jul/Aug/Sep at lower altitudes, from 1998 onwards, and also in 1989-91.
Tenuc says:
May 1, 2010 at 4:24 pm
Chaos means change, there are a couple of us who understand what causes these changes in weather and climate. Piers`s SWIP`s are very accurate for predicting weather events worlwide, and are determined purely by predicting spikes in solar activity. I collect the regional data for these forecasts.
My temperature forecasts, also based on the solar signal, are formed from the ability to hindcast through 350yrs of CET and explain most monthly anomalies, and the cause of all the coldest N.H. winters in the last 1500 years, such as when the two times the Nile froze, and the several times the Euphrates froze.
Timing for temperature forecasts can very accurate, within a couple days, quite often.
Ask Gabe who runs climaterealist.com, he has been badgering me for months to put my forecasts on my own section on his site, as he has been so impressed by them.
If you are interested as to how I do it, all I will tell you now, is that its very similar to how Kepler used to do it, but I have not studied his methods.
“
wobble says:”April 30, 2010 at 11:29 am
I just don’t understand how any credible scientist can really believe that the earth’s climate system is so unstable.
“Weebles Wobble but they don’t fall down!”
httpv://www.youtube.com/watch?v=qq0OQBdIhsc
R. Gates says:
Thanks for a most interesting site, R. Gates. I was surprised to see that as of today (May 1) the ice there is still thickening. It’s presently at 1.32 metres.

w.
Willis,
Right you are. I posted this site in response to Steve Goddard’s comment that the ice in the area was at least “10 feet thick” and so he could believe that there would be open ocean this summer in the area. Of course there will be open ocean as the melt season hasn’t hit Barrow yet, and this 4 ft of new winter ice will melt very fast…but you’ll have to wait until June and July to see how fast.
Nature: “When the sea ice melts, more heat is absorbed by the water. The warmer water then heats the atmosphere above it.”
Goddard: “If this were true, we would expect to see that months with the most ice loss would also show the most warming. In fact, we see the exact opposite.”
What Goddard implies is that if more area is ice free and warming faster, then the most ice-free time of year should have experienced a greater warming over the years . Verbally, this argument “sounds logical” and “convincing”. Unfortunately even brief consideration of the physics refutes it.
The reason that September open ocean shows less of a temperature change than April ice cover is that the ocean has a much larger mass to absorb the solar energy than the atmosphere and the surface of the ice, and a much greater heat capacity per pound. Consequently all that extra solar energy absorbed only produces a small increase in the open ocean temperature in summer.
Water has a heat capacity of 1 Btu per pound, roughly twice that of ice and four times that of air. This means that the same amount of energy absorbed by a mass of water will inherently produce significantly less temperature increase than the same mass of ice or air. (The UAH temperature data are atmospheric temperatures.)
Secondly, obviously ice is not liquid. Sunlight striking the ice surface mainly warms only the surface of the ice because the ice does not mix and heat transfers by slow conduction rather than by fast convection. In contrast, sunlight directly penetrates water down to 100-200 meters, directly warming to that depth (mostly near the surface). In addition, the water mixes, so that heat is distributed efficiently throughout the top 100 meters of ocean by convection. Therefore the amount of sunlight at the April equinox warms the lower atmosphere and a small amount of ice at the surface, whereas the same amount of energy at the September equinox is distributed into air and a much greater mass of water.
Therefore, when you combine the much greater mass of water plus air heated by the sun in the open ocean (Sept) vs. the much smaller mass of ice/air on an ice sheet (April), divided by water’s greater heat capacity and therefore smaller “sensitivity” to energy input, and divided by ice’s lower absorptivity, it is still possible to have a higher year-over-year temperature increase in April than in September based on very simple laws of physics.
The problem with Goddard’s logic is that UAH atmospheric temperature DOES NOT EQUAL energy absorbed. It equals energy absorbed divided by mass and heat capacity and is thus comparing apples with elephants. Even within that graph, the mechanism producing temperature in April is different from the mechanism producing temperature in September, so temperature alone only tells part of the story. Because the September open ocean condition is physically dividing energy absorbed by a much larger number of both mass AND heat capacity (vs April ice) to physically arrive at temperature, the temperature increase comes out lower in September than in April, EVEN THOUGH three times more energy is absorbed by the ocean in September than by the ice in April.
Regrettably for Mr. Goddard, this shows that he does not seem to have even a basic understanding of the physics of climate change, and yet half the people commenting on his blog regard him as if he’s some kind of scientific authority. It also shows the great risk of drawing wrong conclusions from the thoughtless application of statistical methods. There is a REASON why PhD scientists, like medical doctors, have to spend 8 or 10 years or more on higher education and training. Surely you would not hand a blogger a scalpel and say “go study for a few hours and then fix my heart attack”. For the very same reason, neither should we put our complete trust in bloggers’ analyses of climate change!
Steve,
In re April 30, 3:36 PM: To points…
You say “there is no conduit for heat to move from the Arctic Ocean to the atmosphere during the winter”.
But there is. The surface of the ice is extremely cold in winter. Inevitably this draws heat out of the ice and cools the underside of the ice, causing more fresh water to freeze out of the ocean onto the underside of the ice sheet. The ocean temperature remains relatively constant because the ice will freeze at a near constant temperature. Seawater densified by the freezing out of fresh water sinks, exposing the bottom of the ice sheet to more “fresh” sea water. Of course, the heat transfer from the ocean is dramatically reduced in the winter because there is no evaporation and because of the insulating effect of the ice.
You also said: “There is little landmass around to absorb incoming UV, so the atmosphere over ice remains cold all summer in the Arctic Basin.”
Never thought about increased effect of UV in the Arctic or Antarctic due to “ozone hole” effects. Wonder what that does??
However, ice has a high albedo – it reflects lots of the sunlight that hits it, not just UV but all frequencies. Fresh snow is even more reflective. Water has a low albedo – it absorbs most of the radiation that hits it. So ice effectively gets three or more times less energy than the arctic ocean at the exact same latitude. (It may interest your readers to know that at the summer solstice, the poles receive the most incoming daily solar radiation of any place on the planet at any time of the year, even more than the equator! The south pole receives even more than the north pole because the Earth is closer to the sun in December than July. Nevertheless, the ice remains frozen thanks to low air temperature because so much of that light is reflected back into space by snow and ice. )
Also, ice is like land in the desert. You may have heard that it gets very cold in the desert at night even though it may be scorching during the day. That is because the air is very dry and there is very little water vapor (greenhouse gas) to block the radiation trying to leave for space, and also because dry ground doesn’t hold much heat and cools down very rapidly. (It’s low heat capacity, and lack of water, is also why its temperature gets so high during the day.) Similarly, it will get very cold at night on an ice sheet if there are no clouds. Unlike the desert, the ice surface doesn’t heat up too much during the day because it reflect so much more light back into space. In contrast, the summer Arctic ocean is warmer than the ice to start with, courtesy of its lower albedo, and it has more water vapor above it than the ice, thanks to liquid water being both present and above freezing, so it has more of a greenhouse effect above it at night, and it has a large flowing, convecting heat sink tens of meters deep so that its surface temperature changes much less from day to night.
From R. Gates on May 2, 2010 at 12:15 am:
Right you are. I posted this site in response to Steve Goddard’s comment that the ice in the area was at least “10 feet thick” and so he could believe that there would be open ocean this summer in the area.
That comment seems to be at a different article, can’t find it here. But in any case…
This site?
So to counter a comment about “10 feet thick” ice, which would sure seem to indicate multi-year and/or pack ice, you point to where they are monitoring acceptably-stable landfast first-year ice?
Excerpts from: Jbar on May 2, 2010 at 9:21 am
My, such a strong statement in that first part! You should have highlighted it, that would have saved some people the trouble of wading through the rest of your long comment.
His blog? Has all of two posts on it with only two comments, both at the latest post. One is commenting on the local weather, the other briefly mentions something not in the post.
Oh, we’ve discussed here about such “thoughtless applications” many times, when reviewing the work of Michael Mann, James Hansen, many other prominent climate scientists. It’s quite amazing how they have gotten by with screw-ups that big for so long. Maybe they can audit some stats courses and figure out how to get things right.
Well then, until we have confirmation that you have such an advanced education in climate science, by your own words you are unqualified to comment about how wrong or right Steven Goddard’s work with regards to climate science actually is. Thus until such confirmation is provided, your critiques have no value and can be ignored.
Good bye!
Kadaka, I suggest you read Jbar’s two posts in detail. They explain why Steve Goddard’s conclusions in this blog post are invalid. I don’t know where you live, but living in CO mountains I can tell you that even though the solar input is maximum in June, temperatures here don’t really get warm until July and August, well past the solar maximum and in September, temperatures can be just as warm as in June despite the sun being lower in the sky than in June. Think about why that is and then tell me how Steve Goddard’s conclusion:
“If this were true, we would expect to see that months with the most ice loss would also show the most warming. In fact, we see the exact opposite.
can possibly be valid.
jeff brown says:
May 2, 2010 at 3:04 pm
I can’t answer for Steve. But as you point out, we see a good temperature rise by June, with the max temp a month or so after the peak insolation.
So we should see the same thing with ice loss, with warming in September and more warming in October and November.
Perhaps you could point that out in the data …
Willis, if you go to NCEP’s interactive web pages, you can plot anomalies in near surface air temperature (I recommend 925 mbars), or you can also plot anomalies for the entire atmospheric column. If you do this for say seasons (SON-autumn, DJF-winter, MAM-spring, JJA-summer), you will see the season of the most warmth. I looked at the anomalies for the last 5 years relative to a 1979-2009 mean since the satellite data record is the most accurate and I focused on 60-90N, but you can use any latitude bands. I would attach images here if I knew how to do that. But their web site is very easy to use.
Spring-time warming is likely a result of atmospheric circulation changes and cloud cover. Winter-time warming should be mixture of atmospheric circulation changes and some reduction in the winter ice concentrations (note the differences in vertical structure of the warming signal for autumn compared to winter and spring).
This is why I believe there is an autumn amplified warming signal related to loss of summer ice.
kadaka (KD Knoebel) says:
May 2, 2010 at 1:03 pm
“Thus until such confirmation is provided, your critiques have no value and can be ignored.
Good bye!”
That’s a bit harsh kadaka. There’s a lot of viable dialogue there. Wouldn’t it be better to sort the ‘chaff from the wheat’ by discussion?
Best regards, suricat.
suricat said on May 2, 2010 at 5:08 pm:
That’s a bit harsh kadaka. There’s a lot of viable dialogue there. Wouldn’t it be better to sort the ‘chaff from the wheat’ by discussion?
Best regards, suricat.
Perhaps, but the repetitive nonsense gets annoying. And visually that was just one long spewing, with the obligatory “You’re an uneducated moron, you do not possess the sacred knowledge only many years of study will yield!” stuck in there. Thus there sure didn’t seem to be an attempt at honest dialogue in there.
So, cut to the chase. You make the appeal to authority, state how only those with the long training in the sacred climatology tradition may speak of climatology, then show you have that training or sit down and shut up. Well, you can parrot what a climatologist said, but no analysis allowed as you’re not qualified.
This is a valid and logical approach to take, and if commentators are going to seriously challenge someone else’s logic then they should stick to their own logic first and foremost. That’s only fair.
From jeff brown on May 2, 2010 at 3:04 pm:
(…) Think about why that is and then tell me how Steve Goddard’s conclusion:
“If this were true, we would expect to see that months with the most ice loss would also show the most warming. In fact, we see the exact opposite.
can possibly be valid.
Gee, let’s see now…
First we go back to Dr James Screen’s statement in the press release:
Item 1: On the straight reading, sea ice reflects most of the incoming sunlight back into space when it is heated. So unheated or cooling sea ice doesn’t reflect like that? He should have worded that better if he was not implying such.
Item 2: When the sea ice melts, as in right then as it is occurring, more heat is absorbed by the water. He said “when,” not “after,” there is no time lag indicated in the wording. Thus, as Steve Goddard worded it, ““If this were true, we would expect to see that months with the most ice loss would also show the most warming.” His statement is valid.
You have pointed out there is a time lag between maximum solar input and the most warmth. Mr. Goddard has pointed out the same thing, and shown how much longer the lag is, which comes from the ice having to melt first before the water temperatures can go up. You in the Colorado mountains and I in central Pennsylvania have a shorter lag as basically we only have to wait until the oceans in the Northern Hemisphere warm up. Even Jbar, deep in the many words, is pointing out there is a lag.
So we all agree there is a lag. By the wording supplied by that scientist, there is no lag. So basically we have all agreed that scientist is wrong.
BTW, from Jbar on May 2, 2010 at 9:21 am:
The incoming sunlight will be at a very shallow angle to the surface. When it hits the water, provided the angle is great enough that the light doesn’t reflect off it, due to the differences in the indexes of refraction it will enter the water at a steeper angle. Even then the angle is still rather shallow, to achieve a vertical penetration of 100-200 meters the sunlight would have to travel quite a bit further than 100-200 meters through the water.
I’m not exactly sure what definition Jbar is using for “directly penetrates,” but offhand it seems that would have to be some mighty clear water for light to travel that far. Thus his statement and reality, to me at least, do not seem to be in agreement. If you can find something that supports his statement then please post it. Then I may explore the other little bits of what he’s said that I am finding questionable. 😉
jeff brown says:
May 2, 2010 at 4:18 pm
Well, I just wandered all around the NCEP web site and couldn’t find any such page … could you provide a URL?
Thanks,
w
JER0ME says:
May 1, 2010 at 4:08 am.
“OK, fair enough to some extent, but I am seeing a figure of 100 m in ‘pure’ seawater (whatever that may be – as you say, it is difficult to find, although the author seems to have found some (I lost the name of the sea)).”
Probably the ‘Sargasso’, it has less particulates, but is also full of weed.
100m is what you see, but I see more like ~300-400m to extinction in a realistic scenario at the Arctic (healthy discourse for the inclusion of particulates). Let’s not forget that salinity, gas absorption and phase change (between ice and water) doesn’t alter the reactance of H2O to EM radiation to any marked degree.
“Assuming this is correct, and I would probably only be able to read a page of that lot without nodding off, skimming that section did not mention ice apart from to lump it in with liquid water once.”
While I’ll admit that it took several reads by me to partly understand the data, I persisted. My conclusion was that deep ocean energy was increased via a ‘window’ of blue vis and UVa spectra, initialised by water and ice per se (where atmospheric conditions and insolation permit). There’s a graph describing ice absorption on page 70, figure 2.15. This almost mimics its liquid water counterpart.
“You can’t normally see through it AT ALL, let alone a few cm, except in rare circumstances.”
You wouldn’t expect coherence, only a level of illumination at a specific spectral band that proves the transmission of energy.
Just a word on the Arctic ocean/atmosphere interface. Ocean ice cover is a radiative barrier to IR ocean warming, a barrier to convection at ocean surface and, thus, greatly prohibits ocean surface evaporation. I can’t see any scenario where this will ‘not’ affect cloud albedo and surface temperature. More ice, less cloud, raised surface temperature and less ice, more cloud, lowered surface temperature. Then take into account ocean currents, it’s not surprising that Arctic ice cover seems to be cyclical.
Sorry for the delayed response, just noticed your last post. 🙂
Best regards, suricat.
The normally accepted limit for photosynthesis is ~650 feet. In open ocean water the light level drops to ~1% of surface value at ~200m.
Phil. says:
May 3, 2010 at 8:12 am
“The normally accepted limit for photosynthesis is ~650 feet. In open ocean water the light level drops to ~1% of surface value at ~200m.”
Perhaps I’m reading the data that I linked to wrongly?
Page 63, figure 2.13. I see the blue spectral band of the VIS spectrum as dropping to ~10^-2 (~100 metres), with UVa ascending the graph. Thus, at ~100 metres depth a power rating of 1 w/m^2 at the surface becomes 0.5 w/m^2, or is subjected to a 50% attenuation. At ~200 metres the power rating only drops to 25% of the surface value.
Am I reading the graph correctly? To save you searching back up the thread, here’s another link:
http://books.google.com/books?id=C5kRs1z_CYoC&pg=PA56&lpg=PA56&dq=UV+absorption+of+water+vapour&source=bl&ots=bLYkuKb6z8&sig=ShuCKHswM8g8Axo3FbNG27gSi7w&hl=en&ei=7KqASrLnO8SMjAem5IH2CQ&sa=X&oi=book_result&ct=result&resnum=9#v=onepage&q&f=false
Best regards, suricat.
Willis, sure go here:
http://www.esrl.noaa.gov/psd/cgi-bin/data/composites/printpage.pl
from there you can also link to daily composites as well as time-series analysis. Have fun!
jeff brown Reur May 1, 2010 at 8:34 am
I’ve noticed that some of your wording is remarkably similar to that in a comment of nom de blog Wildred on an older WUWT thread as in item [2] below. Since there has been no response from Wildred, and you at least have similar interests, I thought I’d repeat my reply comment here:
Hi Kadaka…
to address some of your points:
1) First we go back to Dr James Screen’s statement in the press release:
“The sea ice acts like a shiny lid on the Arctic Ocean. When it is heated, it reflects most of the incoming sunlight back into space. When the sea ice melts, more heat is absorbed by the water. The warmer water then heats the atmosphere above it.”
Item 1: On the straight reading, sea ice reflects most of the incoming sunlight back into space when it is heated. So unheated or cooling sea ice doesn’t reflect like that? He should have worded that better if he was not implying such.
When the sea ice is covered by snow it will reflect 80-90% of the incoming solar radiation back out to space. So this is the case early in the melt season. As the snow melts, the grain sizes become larger and reduce the reflectivity of snow (say around 70%). When the snow melts off, and the bare ice is exposed the surface albedo is around 50-60%. During advanced states of melt, melt ponds lower the albedo even further, to say 40%. It’s not so much about the heat of the ice, as it is the physical characteristics of the actual grains. Small grains (like in dry new snow) reflect nearly 90% of the incoming solar radiation, the larger the grain size, the lower the reflectance.
2) Item 2: When the sea ice melts, as in right then as it is occurring, more heat is absorbed by the water. He said “when,” not “after,” there is no time lag indicated in the wording. Thus, as Steve Goddard worded it, ““If this were true, we would expect to see that months with the most ice loss would also show the most warming.” His statement is valid.
This is when the ice has disappeared and the ocean is what is now absorbing the sun’s energy instead of the ice. You can look at NSIDC’s web pages and look at trends in ice concentration (go to their sea ice index web pages). All summer months (and spring for that matter) show negative trends in sea ice concentration. This either implies (1) a decrease in sea ice (i.e. more open water), or (2) more melt ponds on the surface of the ice (that the passive microwave algorithm mistakes for open water instead of ice). If you were to download the NSIDC sea ice concentration data sets and compute for yourself the incoming solar radiation per pixel in the sea ice grid, you could compute for yourself the amount of absorbed solar radiation (assuming constant values of albedo for ice or open water). Note, you can compute the incoming solar radiation as a function of latitude and time of day for a first draft. The actual incoming solar radiation at the surface is of course modified by the atmosphere, but it’s a good place to start.
3) So we all agree there is a lag. By the wording supplied by that scientist, there is no lag. So basically we have all agreed that scientist is wrong.
In the actual paper I don’t think the wording was wrong, but in the press release maybe. That shows more the problem of communication of science by journalists than anything else. And I believe journalists with their alarmists headlines are one of the major problems in effectively communicating science.
jeff brown says:
May 3, 2010 at 7:12 pm
Thanks, Jeff. For me, I prefer observations (you know, facts) to computer model results. And since that site has nothing but computer model results, I fear that it doesn’t help us.
Which is likely why Steven Goddard’s MSU satellite data shown in the head post shows something different from the computer model results that you referred to above … and when computer models and observations disagree, I know which one I pick.
On the other issue, you say:
Yes, less ice means more open water. And yes, that will absorb marginally more solar energy … but little of the energy in the Arctic is from absorbed solar energy. Remember that in September at 80°N, the sun is only 10° above the horizon, so differences in albedo matter very little. Most of the energy is from infrared radiation and from heat transported in from the tropics. And the ice doesn’t change those, in fact, ice is a better absorber of IR than water … and a good chunk of the Arctic energy is coming from IR. So the net change is not all that great.
In addition, more open water means more energy loss via radiation, conduction, convection, evaporation and transportation. All of these cool the surface, and reduce the effect that you discuss.
Next, more evaporation means more snow, and the albedo of snow is much higher than that of ice. It also covers the ground, and greatly increases the albedo of the ground.
What is the net of all of these effects? I don’t know … but it certainly is not as simple as you imply, that less ice = a significant amount of additional heat.
Alright jeff brown, let’s go through your post.
My Item 1, as worded by the scientist, as the ice is heated it reflects most of the incoming solar radiation back into space. In reply, you supplied a discourse on how when the ice is heated it will reflect decreasing amounts of incoming solar radiation, mentioning how unheated or cooling ice (has small-grain dry new snow) reflects the most. To me, that sure sounds like you just contradicted the scientist’s own words.
Item 2, as worded by the scientist more heat is absorbed by the ocean when the sea ice melts, no time lag indicated. While the ice is melting the ocean is absorbing more heat. In reply you ignore that wording issue and indicate there is a time lag, to wit: “This is when the ice has disappeared and the ocean is what is now absorbing the sun’s energy instead of the ice.” To me, that sure sounds like you have just confirmed the problem with the wording.
At the end you say: “In the actual paper I don’t think the wording was wrong, but in the press release maybe. That shows more the problem of communication of science by journalists than anything else.” The major problem with that being that Dr James Screen’s own statement is what is being discussed. Thus we are examining a problem of communication of science by a scientist, with you essentially providing the assumption that the scientist really did mis-word a statement about his own work, rather than correctly wording what his results were.
And I believe journalists with their alarmists headlines are one of the major problems in effectively communicating science.
And on this we do have agreement.
suricat says:
May 3, 2010 at 3:04 pm
Phil. says:
May 3, 2010 at 8:12 am
“The normally accepted limit for photosynthesis is ~650 feet. In open ocean water the light level drops to ~1% of surface value at ~200m.”
Perhaps I’m reading the data that I linked to wrongly?
Page 63, figure 2.13. I see the blue spectral band of the VIS spectrum as dropping to ~10^-2 (~100 metres), with UVa ascending the graph. Thus, at ~100 metres depth a power rating of 1 w/m^2 at the surface becomes 0.5 w/m^2, or is subjected to a 50% attenuation. At ~200 metres the power rating only drops to 25% of the surface value.
The introductory part of the book is missing so I’m assuming that the coefficient given is the decadic absorption coefficient i.e.:
Absorption=10^-(a*depth in m)
therefore in the blue a≅10^-2 and d=200m A=10^-2.
HTH
Phill.
Thanks for your help, but your post didn’t pass all the ‘translation’ tests (what may be a vital symbol is missing).
Nevertheless, it seems that you consider the graphic to represent ‘depth to total absorption’ (path to extinction). As an engineer, I don’t understand why people use this measure, as the path to extinction has a log dependency on the strength of the source (also depending on what is considered to be the ‘extinction amplitude’). Thus, it varies with both the strength of the source and the extinction value. I would normally work with distance to a 50% attenuation of ‘the signal’, as the term offers greater scope for interpolation purposes.
It took me ages to find online data of ‘that window’. Guess I need to keep looking for something that’s more verifiable. 🙂
BTW, what does ‘HTH’ mean? Is this the acronym of your given name, or something else? My pseudonym here of ‘suricat’ was first generated at the (now defunct) C4 Eve forum where everyone was advised not to use their given name, so I used an old nickname that I was given whilst I was in Belgium. I’ve continued using it for recognition purposes, but my given name is Ray Dart. Perhaps I’ll post with that in the future, but it means altering so many different site details, so I’m reluctant to do so and may only add this as a suffix. Again, thanks for your help. 🙂
Best regards, suricat (Ray Dart).
Phil.
Please excuse my stupid bad spelling of your online identity.
Best regards, suricat (Ray Dart).
suricat says:
May 4, 2010 at 4:21 pm
Phill.
Thanks for your help, but your post didn’t pass all the ‘translation’ tests (what may be a vital symbol is missing).
Nevertheless, it seems that you consider the graphic to represent ‘depth to total absorption’ (path to extinction). As an engineer, I don’t understand why people use this measure, as the path to extinction has a log dependency on the strength of the source (also depending on what is considered to be the ‘extinction amplitude’). Thus, it varies with both the strength of the source and the extinction value. I would normally work with distance to a 50% attenuation of ‘the signal’, as the term offers greater scope for interpolation purposes.
No I regard it as the absorption coefficient, which forms part of the exponent in the expression for absorption.
Since the symbols apparently didn’t show up for you I’ll try to express it in words.
The absorption is given by ten raised to the power -(a*depth)
BTW, what does ‘HTH’ mean?
Sorry, too much texting, ‘Hope that helps’.
[snip] Repeated use of the d-word.