By P Gosselin
No late summer Arctic ice melting in 20 years!
Why are the climate ambulance chasers now way out in Nepal, grabbing at straws? The reason is because there’s little weather action anywhere else that would support the alarmist climate narrative – not even the Arctic.
Typically this time of the year you’ll find them chasing huirricanes in the Atlantic basin, or hollering doomsday warnings way up in the Arctic.
August 27 Arctic sea ice extent
Strangely, the alarmists have been mysteriously abesent from the North Pole region for many years now. Al Gore’s warning (citing experts) of an ice free Arctic by 2013 never materialized. Here’s the August 27 Arctic sea ice extent since 1990:

Chart by NTZ. Data source: Meereisportal
The data show that late-summer Arctic sea ice (August 27) has remained stable over the past two decades!
The post-2007 trend slope is only -0.01 million km²/year, a significant deceleration compared to the rapid loss rate of -0.105 million km² per year observed between 1990 and 2006. In a nutshell, Arctic sea ice late summer minimum has been stable for 20 years!
Record low burned area in Europe
And espite all the screaming from the media about Europe’s hot and dry summer, and raging forest fires, the data show very calm and encouraging conditions in terms of burned area for 2026 over Europe:

Source: GWIS
The reality is that burned area across Europe this summer has remained at a record low, and will likely remain on track to finish far below normal as rain sweeps over Europe again. These are inconvenient news for climate alarmists.
Low Atlantic cyclone activity this year
Also the hurricane season isn’t cooperating.
The next chart depicts the comparison of the 2026 Atlantic Accumulated Cyclone Energy (ACE) –which tells us how frequent and strong hurricanes have been– against historical averages and notable El Niño analog years through late August.

Chart by NTZ. Data source: https://tropical.atmos.colostate.edu/Realtime/index.php?loc=northatlantic
2026 Atlantic cyclone energy has been only 11% of normal activity.
Now you know why the climate ambulance-chasers have all gone to Nepal.
Just remember:
Polar bears don’t need the sea ice, it’s the seals that need the ice.
A further elaboration. The seals need spring Arctic sea ice for their whelping season. Polar bears get about 75-80% of their total annual caloric intake during the seal whelping season. Nobody ever said there wouldn’t be spring Arctic sea ice. The whole polar bear thing was based on fundamentally wrong polar bear biology from the beginning.
The polar bears and sea ice simply refused to disappear as experts predicted.
I guess Big Oil bribed them into existence somehow.
And seal population? – “all four seal species have large, healthy populations ” – arctic report card 2024
Either arctic sea ice is not needed and its disappearance highly beneficial,
or the arctic sea ice decline(and its end by 2014 – Nobel Laureate Al Gore)
is based on the trick by starting at its peak extent in 1978/1979 and ignoring the previous satellite(Nimbus) data since 1964
I would advise climate “experts” to stay away from prediction markets.
This was discussed last January here at WUWT
Poor polar bears. When Al Gore was born there were 10,000 of them, now there are only 25,000 of them.
Record-low 2025 and 2026 ice extents restore Arctic winter sea-ice decline
“Recent analyses have suggested that the decadal rate of Arctic winter sea-ice extent decline weakened in the early 2020s, with 20-y trends becoming statistically insignificant. Here we show from more up-to-date observations that the exceptionally low 2025 and 2026 ice extent winters reversed this picture, with sea-ice extent during the growth and peak phases returning to record lows and 20-y decline trends becoming significant again. Further analysis of CMIP6 model analogues shows that the observed 2025 decline was unusual but physically plausible under comparable Arctic warming, and is more consistent with ongoing winter sea ice reduction than with a return to values seen in the early 2020s.”
NTZ doing what NTZ does best: cherry picking like it’s an Olympic sport.
No wonder pages like this exist:
https://www.desmog.com/climate-disinformation-database/
DeSmog is certainly the place to go to for climate malinformation. !
Funded by far-left billionaire globalists.
Current Arctic sea ice extent is above that of 2007, 2011, 2012, 2015, 2016, 2019, 2020, 2023, 2024, and 2025…. and basically right on the 19 year average.
High Arctic had its coldest year in decades.
Arctic sea ice is also in the top 5% or so of the last 10,000 years.
The recovery from the EXTREME highs of the LIA have, unfortunately, ceased.
And using 6 chimps to do their modelling.. dumb.. but probably better than using climate scientists.
Don’t believe your lying eyes. Please refer to the modelling. Sea ice should be down coz climate change.
Yeah, there may be room for improvement in the modeling in this specific instance:
[“24] Observations indicate a downward trend in September Arctic sea ice extent from 1953–2006 that is larger than any of the IPCC AR4 simulations, and current summer minima are approximately 30 years ahead of the ensemble mean model forecast.“
https://agupubs.onlinelibrary.wiley.com/doi/full/10.1029/2007GL029703
Which, of course, ends in 2006 just prior to the summer time stabilization lasting 20 years now
And started at an extreme maximum in 1979 not far down from the extent of the LIA.
.. and is still way above MWP levels of sea ice extents.
Having the Arctic chock full of sea ice most of the year is not good for anyone or anything.
Nobody with any scientific nous gives one hoot what climate models say. They are nonsense, and have always been nonsense.
There is no stabilization during winter.
Cherry picker!
Yes, Pierre Gosselin is a cherry picker.
Reality denier.
Correction: High Arctic had record-breaking cold in 2026🥶
Correction accepted 🙂
😁
Lower even than 2012? 😉
Further analysis of CMIP6 model analogues shows that the observed 2025 decline was unusual but physically plausible under comparable Arctic warming, and is more consistent with ongoing winter sea ice reduction than with a return to values seen in the early 2020s.”
So only Winter ice extent? If warming were occurring, why no decline in Summer? What happened to the ice-free Arctic we were promised?
“What happened to the ice-free Arctic we were promised?”
Don’t worry. It’s coming.
How does this summer compare to summer ice levels 125,000 years ago
There were long periods earlier in the Holocene when the Arctic was “ice free” ie less than 1 Wadham.
At the moment it is probably in the top 5% or so of the last 10,000 years.
Why do you ask?
How do you know an Ice Free Summer isn’t a natural occurrence during all interglacial periods over the last 880,000 year repeating Glaciation-Interglacial cycle?
What makes you so sure it isn’t?
It was warmer during prior optimums for starters. Don’t believe me! Just look at the data!!
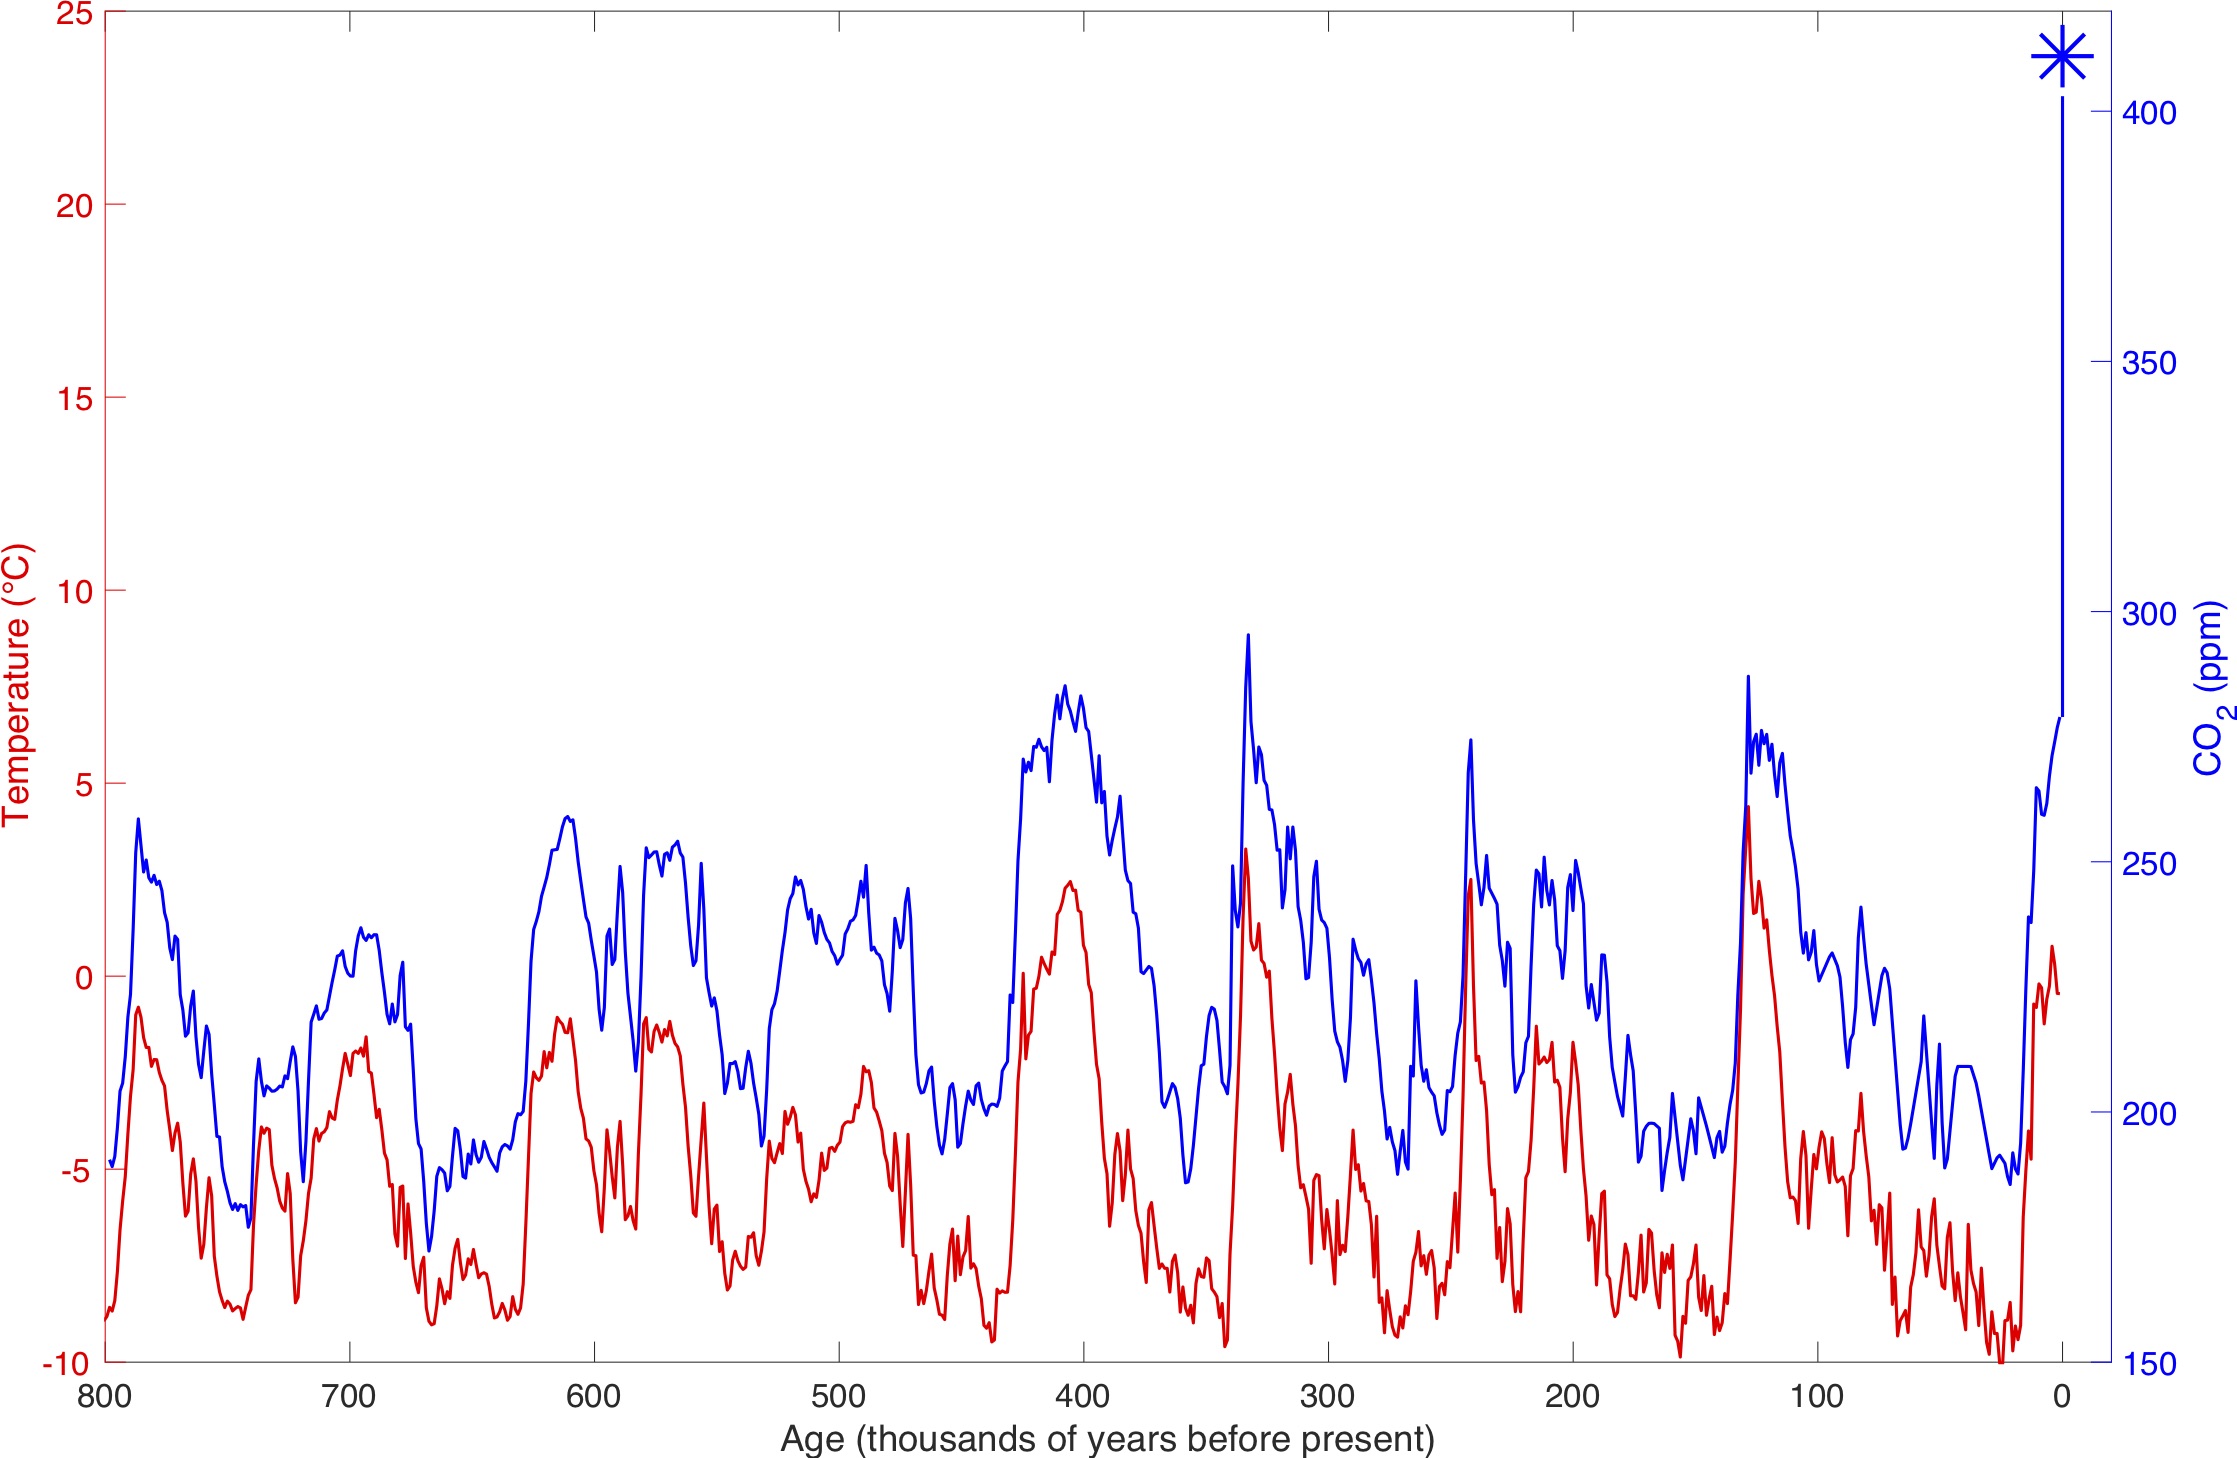
Ya know, looking at that chart, if CO2 drove temperatures in lock step (like it kinda indicates prior to CO2 jumping from 280ppm to over 425ppm) then shouldn’t the Red Temperature line be up at the 20°C level?
I wonder what happened to something so lock step over the last 800K years?
Indeed. If temperatures were a function of CO2, they would change before CO2. In fact, T changes before CO2. The inescapable conclusion is that CO2 is a function of T.
Correction: . If temperatures were a function of CO2, they would change
beforeAFTER CO2.
Sincere apologies.
I never posited that Ice Free Arctic Summers were anything But Natural
Never said it wasn’t!
Biomarkers show the Arctic was often close to ice free during much of the Holocene.
But nowhere near that now.
“But nowhere near that now.”
Just possibly because there is ~ 40 W/m^2 less June insolation now than was the case at the height of the holocene thermal max.
[snip ~ctm]

.
You are now saying that insolation is a factor in temperatures? I thought you maintained that CO2 was the control knob.
Current Arctic sea ice extent is in the top 5% or so of the Holocene.
Speaking to you from a location in Michigan that was covered by a mile thick sheet of ice some 25,000 years ago, the climate here was quite consistent summer to winter, but was significantly constrained, and a bit cool.
What happened to the ice-free Arctic we were promised?”
You weren’t ….
Just a certain Prof. Wadhams projecting and giving a personal opinion on the basis of a trend over too-short a time.
Wadhams was so stupid he got a unit of ice area named after him.
Climate model outputs are totally meaningless, because they don’t apply to any real physics of the Earth’s atmosphere.
It wasn’t just Wadhams. Your super climate scientist Al Gore and others also predicted an ice-free Arctic. Good of you to admit, though, that climate scientists commonly give personal opinions on the basis of a trend over too-short a time.
It’s called Climate Science Du-jour.
Numerous scientists, organizations, and public figures have predicted ice-free Arctic summers, with timelines shifting from as early as 2013 to broader windows between the 2030s and 2050.
Key Predictions and Timelines
No he didn’t. In fact, he said “Seeing an essentially ice free Arctic Ocean in summer by 2016 is extremely unlikely.”
No he didn’t. What he said is that 2016 is the earliest possible date that it could happen based only on extrapolation and warned readers that “Simple extrapolation from hindcasts sheds little light on the problem” of when the Arctic will actually go ice-free. And the earlier claim of 2016 from Al Gore turned out to be fake news.
The only scientist I’ve been able to verify who actually made an early prediction to the media was Dr. Wedhams in an interview with The Guardian. Other scientists criticized his prediction as not being consistent with the evidence at the time. And Wedham’s himself was giving a different prediction to the scientific community than the one he gave to the media.
https://thegwpf.org/a-brief-history-of-arctic-angst/
That was Al Gore’s prediction. He falsely attributed it to Maslowski. Of the matter Maslowski said “t’s unclear to me how this figure was arrived at. I would never try to estimate likelihood at anything as exact as this.” Refer to the citation above.
He didn’t say that. Here are his exact words immediately following the 2007 melt season.
Yep. He’s made other predictions not supported by the consilience of evidence as well.
Well I’m impressed, he used “consilience of evidence” in a sentence.
Yep, it will be here in 2056, and when it isn’t in 2056 it will be ice free in 2086.
If you clap your hands, Tinkerbell won’t die.
We are ahead of schedule in that area. It is looking like 2050 give or take a few years is the latest estimate of when the first essential ice-free (< 1e6 km^2 of extent) summer may occur. That is down from the 2100 or so estimate the IPCC originally gave.
LOL.. mindless estimates from people who are just making agenda driven guesses.
Utterly meaningless.
Arctic sea is FAR above the extent it has been for most of the last 10,000 years.
During much of the first 2/3 of the Holocene biomarkers show there were regular periods where sea ice dropped below 1 Wadham
LIA, and around 1979 were periods of extreme high Arctic sea ice anomaly.
The Arctic has not yet recovered back to more normal Holocene levels, and doesn’t look like doing it any time soon.
With your ability to see decades into the future you could be a millionaire on the Stock Market.
“Climate Disinformation Database” sounds like a
repositorysuppository for Climate Alarmism talking points!Tricky things, trends.
It is well known that “extremes at endpoints” tend to be heavily “weighted” when calculating trends, often leading to counter-intuitive results.
The last two “exceptionally low” sea-ice extents in winter had a “significant” effect on the twenty-year trends … who’s “cherry-picking” now ?
What would happen to those “significant” 20-year statistics if the Arctic sea-ice extent “reverted to the (recent) mean” next winter (/ March 2027) ?
Whinning about cherry picking while citing a site that does nothing but.
The irony, it burns.
right about now some warmunist will claim you are cherry picking the data by picking the starting date of your series.
completely oblivious to the obvious fact that it represents the most recent 20 years.
makes me laugh and puke every time
told ya
The problem isn’t really the start date, heme212. There is good evidence that Arctic sea ice decline paused for roughly 20 years.
But that pause appears to be over, or at least largely confined to the summer months, because the decline in winter sea ice extent has resumed.
Had NTZ (or you) actually checked the data, you would have known that.
Though I wouldn’t be surprised if Pierre Gosselin was already aware of it.
So, you are claiming all those climate scientists who claimed lower sea ice extent was a problem were lying to us? In case you weren’t aware of it, every year the lowest sea ice extent occurs in the summer. That means your “winter sea ice” is completely irrelevant and your comment is complete nonsense.
And it was only a dip for one year to a level a bit below 2017.. 2026 maximum is slightly higher, and if the current season continues as it is, 2027 will be higher again.
Average has barely moved, neither has the minimum.
Yeah, I imagine those conclusions are difficult to accept for someone who has made confident cooling predictions based on Arctic sea ice behavior:
https://www.drroyspencer.com/2026/08/uah-v6-1-global-temperature-update-for-july-2026-0-48-deg-c/#comment-1750863
No wonder you only mention the summer minima, both in the linked comment and in your comment here.
Maybe, when reality inevitably falsifies that prediction, you’ll finally be willing to acknowledge that you got it wrong.
Nice try at changing the subject. We’re discussing YOUR silly claim for which you have provided no logic to support. Once again, how can no change in minimum sea ice be irrelevant while minor changes in sea ice levels 4-5 times higher be a problem?
PS. My prediction will either fail or not within the next few years. Let’s see how that works out. I’m thinking you are going to be very disappointed …. again.
BTW, my theory explains why the only change is in winter sea ice.
No one is saying it is irrelevant.
But the continued decline in winter sea ice extent is also relevant information and should be presented alongside it for proper context.
The important point is that a short term pause or slowdown in the decline of summer sea ice does not necessarily indicate that global warming has ceased.
Internal variability can affect the trajectory of Arctic sea ice over shorter periods, and that context is worth mentioning. My criticism is simply that this article did not provide that broader context.
“ I’m thinking you are going to be very disappointed …. again.”
If you say so. There is no point in trading barbs. We can simply watch what happens over the next few years and see whether your claim holds up.
That said, it is worth remembering that you have made specific predictions about this before, and they did not turn out as expected. In December 2020, you wrote:
“Richard M says:
December 4, 2020 at 9:21 AM
Barry,
Your question is actually easy to answer. The satellite data starts during the -AMO which then became positive in the 1990s. It is still positive today. The satellite data (and Arctic sea ice levels) match that trend very nicely.
However, correlation is not enough. We need to see what happens when the AMO goes negative. That should happen relatively soon (within 7 years?).
My own personal guess is the PDO will go negative in 2021 or 2022. The AMO will go negative in 2024. This will start a period of cooling that will negate much of the warming we’ve seen since the 1990s by the time we reach the mid 2030s.
Maybe that will return climate science back to reality and the oceans can be studied to determine just how long the Modern Warm Period will last.”
https://web.archive.org/web/20210125051727/http://www.drroyspencer.com/2020/12/uah-global-temperature-update-for-november-2020-0-53-deg-c/#comment-564288
You were correct about your PDO prediction, but incorrect about your AMO prediction – it has remained positive over the past 5 years.
As for your global cooling prediction, we haven’t reached 2030s yet, so that specific endpoint cannot be falsified at the current time. But the trajectory through 2026 is very much not what you’d expect from a cooling reversal.
It is looking very much like the AMO transition has already started which makes my “within 7 years” still accurate and in 2020 I couldn’t know the Hunga-Tonga warming effect would show up. That likely delayed the AMO transition.
In 2026 we have El Nino gumming up the works. However, that didn’t stop the high Arctic from having its coldest summer on record. Since 2027 is likely to see a La Nina develop, that will provide a clearer picture. Of course, the full transition could take a decade just like it did last time 1996 – 2007.
You clearly aren’t terribly bright. If the decline in Arctic sea ie is confined to Winter, by definition it means the Arctic will NEVER become ice-free.
People are waking up to the lies of alarmists like you.
The decline is occurring in all months of the year.
The present slowdown during the summer months is a temporary interruption of the ongoing long term reduction.
It is not a cessation of sea ice loss.
See this: https://www.nature.com/articles/s41467-025-63520-0
The graph above shows you are badly misinformed. !
There is basically no trend in any of the yearly maximum, yearly minimum or daily average values.
The decline is happening in all month of the year
But not in August. See graph above.
The present slowdown during the summer months is a temporary interruption of the ongoing long term reduction.
You have no idea what the future holds.
“But not in August. See graph above.”
The graph above shows that the decline is occurring in August.
Huh? Are you looking at the same graph as me? Arctic sea ice extent on Aug 27 2006 was 5 million sq km. Sea ice extent on Aug 27 2026 is 5 million sq km.
Yes, I’m looking at the same graph as you. The difference is that I’m looking at the complete record from the beginning.
That is important as well.
Glad you don’t dispute my assertion that there is zero difference in ice extent on Aug 27 2006 and on Aug 27 2026.
You are correct in that Arctic sea ice is decreasing in winter due to increasing solar radiation.
The Earth’s orbit took a closer path around the sun after aphelion July 6, 2026 this year, which will increase solar radiation this fall and winter.
The closer path around the sun will cause this fall and winter to be warmer than normal.
Can you explain why no research is being done on the variations in the Earth’s orbit that cause a major impact on the Earth’s climate?
Can you explain why climate scientists don’t do any anomaly on the solar radiation at Earth distance to compare with the Earth’s global temperature anomaly?
Why do climate scientists withhold research on the variations in the Earth’s orbit and solar radiation?
Are climate scientists deliberately withholding this research so as not to lose the research grants for their research?
Victor, sea ice has been declining during the aphelion months as well. Clearly, something other than orbital configuration is at work.
Greenhouse gases.
Is it greenhouse gases or changes in the Earth’s orbit that are causing the Earth’s temperature to increase after aphelion July 6, 2026 this year?

If it is due to greenhouse gases, how much have greenhouse gases increased after aphelion July 6, 2026 to cause this temperature increase?
The models say it is due to CO2, therefore it is due to CO2. Real science requires one to ignore any data that goes against what the models predict.
Following your post about the Chan et al (2026) paper concluding that “20-y decline trends becoming significant again” I checked the NSIDC 20-year trends for the Arctic (see graph attached below).
For all months the twenty-year trends were always negative.
NB : This actually surprised me. My (increasingly unreliable) memory had the notion the twenty-year trend for at least one month had “touched the zero line”, but when I “actually checked the data” it turned out to be a “hallucination” on my part. Live and learn …
Arctic sea-ice continues to decline on that particular timescale, but the rates are highly variable during the 21st century (so far).
The twenty-year trends for the “winter” months (December + January + February, or “DJF”) fell from 1998 to 2011/2012, to around -60,000 km² per year, and have since risen again (but remain negative).
It is actually the “spring” months (MAM) have been the most constant since 1998, the trends for the “summer” months (JJA) go down and back up again but the wildest swings are for September (the annual minimum month) and October.
Being pedantic … who, me ?!? … the winter month “declines” never actually “resumed” because they never went away (/ turned positive), they just got stronger (more negative) and then weaker again.
Any “pauses” in the (monthly) data were limited to the “the (20-year) trend was no longer statistically significant” variety.
Starting URL for NSIDC sea-ice data : https://noaadata.apps.nsidc.org/NOAA/G02135/north/
Monthly data can be found in the ./monthly/data/ subdirectory (1 text / CSV file per month).
NB : The ./daily/data/N_seaice_extent_daily_v4.0.csv file was timestamped “30-Aug-2026 10:49” when I accessed it, and contained (daily) values up to yesterday (the 29th, NSIDC are very quick when it comes to processing the “raw” satellite data and making it available to the public).
I used the average from the 30th of July to 29/8/2026 as a “preliminary estimate” for the “August 2026” monthly value. With an offset of only 2 days it should be “close enough for government work” …
Calculating the 20-year trends for each month gave me the attached graph.
To me, at least, it raises more questions than (immediate and simplistic) answers.
It is the months of July, August, September and October that deviate.
What is the reason for these months to deviate during the period 2000-2030?
Good observation.
Redoing the colour coding as “three sets of 4 months” rather than “four sets of 3 months / meteorological seasons” gave me the attached graph.
You are definitely onto something there, I’m just not sure what, precisely …
Good question.
I have no idea, but I suspect it is for a combination of factors rather than “the (singular) reason”.
PS : My graphs only go up to 2025/6. For twenty-thirty you will need to consult a fortune teller.
If October follows the same trend, it will be back to the starting point around 2030.
A while ago I experimented with a graph that has 2 month long annual windows on solar radiation at Earth distance.
Could it be varying solar radiation from year to year for different months that affects the ice expansion?
I have a graph with 2 pre and 2 post 2 month long annual windows.

It shows that there are different variations in solar radiation from year to year.
feel free to cherry pick this
And let’s not forget that the Russians now have several very large nuclear powered ice -breakers with heated hulls, that they are using to keep the transport route along their northern shore open as long as possible.
Only “man-made” warming up in the Arctic.
In answer to the question about why the catastrophists flocking to Nepal…desperate to hang that crisis on the Climate Change hook…
That’s the way catastrophists always operate…
Is Greta Thunberg anywhere near Nepal..?
No..?
Can’t believe all the typos.
Arctic sea ice is closely tied to the AMO
That somewhat erratic cycle will be heading back down soon, and Arctic sea ice extent will increase..
Will be fun watching the antics of the sea ice worriers.! 😉
Perhaps the forest fire data will be homogenised in order to crank it up a bit.
You have to understand that CO2 heat is Ninja Heat. It can vanish into the deep oceans, and then reappear when you least expect it. It also can transform itself into weather, especially extreme or weird weather. I suspect CO2 heat is just biding its time in the Arctic. You never know when it will pop out and then boom, there goes the ice. You just wait.
“the alarmists have been mysteriously abesent”
check your spelling!
I find it interesting, that during the winter of 2012, we were reminded by the “experts” that the winter maximum was virtually irrelevant. That was after a relatively high winter max of sea ice. Of course, that winter max was followed by the lowest summer minimum on record, at which point all hell was unleashed by the media. And of course, all the focus we were then told should be on summer minimum. Since then, as this article correctly points out, summer minima have stabilised……but “hey presto”….. now, we should be focusing on the decline in winter max – in other words, the 180 degree opposite to what was considered the more important focus in 2012.
Personally, I’ve always observed the amount of area under the mean line for the whole year, rather than on just max or min. In that respect, it has to be acknowledged that there is indeed a slow decline in ice area, even by comparison with 2012.
“is indeed a slow decline in ice area, even by comparison with 2012.”
Sorry, but the graph posted here shows basically no change in the daily sea ice average.
https://wattsupwiththat.com/2026/08/29/end-of-august-arctic-sea-ice-extent-hasnt-fallen-in-20-years-official-data-show/#comment-4234891
The Canadian government had better take notice of these numbers before it devotes billions to expanding the port of Churchill on Hudson Bay because it believes global warming will reduce the extent and duration of ice on the waterway. It hopes to construct freighters with special reinforced bows to smash through the reduced ice levels that are supposed just around the corner except there’s no guarantee of this being permanent or more likely just a short-term occurrence as the graphs seem to indicate.
For shipping, it is the minimum sea ice they need to drop in extent… and that isn’t happening.
Maximum sea ice is always impassable, so a minor one or two year dip is totally irrelevant.
Extent can be a misleading parameter, 100sqkm with 100% coverage is an extent of 100sqkm,
100sqkm with 15% coverage is also an extent of 100sqkm.
The flat trend in extent could be the result of less ice distributed over a larger area.
The results have shown that the oldest ice has almost completely gone and the current ice is mostly less than 2 years old.
According to NOAA, current Arctic sea ice extents is above 2007, 2011, 2012, 2015, 2016, 2019, 2020, 2023, 2024, 2025.
Every month has been pretty close to zero trend since at least 2007.