Polar Sea Ice Changes are Having a Net Cooling Effect on the Climate

A guest post by Steven Goddard

One of the most widely discussed climate feedbacks is the albedo effect of polar sea ice loss.  Ice has a relatively high albedo (reflectance) so a reduction in polar ice area has the effect of causing more shortwave radiation (sunlight) to be absorbed by the oceans, warming the water.  Likewise, an increase in polar sea ice area causes more sunlight to be reflected, decreasing the warming of the ocean.  The earths radiative balance is shown in the image below.  It is believed that about 30% of the sunlight reaching the earth’s atmosphere is directly reflected – 20% by clouds, 6% by other components of the atmosphere, and 4% by the earth’s surface.
Radiation & Climate Slide
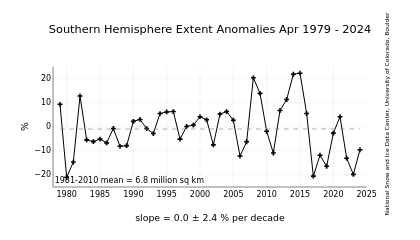
We all have heard many times that summer sea ice minimums have declined in the northern hemisphere over the last 30 years.  As mentioned above, this causes more sunlight to reach the dark ocean water, and results in a warming of the water.  What is not so widely discussed is that southern hemisphere sea ice has been increasing, causing a net cooling effect.  This article explains why the cooling effect of excess Antarctic ice is significantly greater than the warming effect of missing Arctic ice.
Over the last 30 years Antarctic sea ice has been steadily increasing, as shown below.
https://i0.wp.com/nsidc.org/data/seaice_index/images/s_plot.png?w=1110

December is the month when the Antarctic sun is highest in the sky, and when the most sunlight reaches the surface.  Thus an excess of ice in December has the maximum impact on the southern hemisphere’s radiative balance.  In the Antarctic, the most important months are mid-October through mid-February, because those are months when the sun is closest to the zenith.  The rest of the year there is almost no shortwave radiation to reflect, so the excess ice has little effect on the shortwave radiative (SW) balance.

This has been discussed in detail by Roger Pielke Sr. and others in several papers.
So how does this work?  Below are the details of this article’s thesis.

1.  As mentioned above, the Antarctic ice excess occurs near the December solstice when the sun is highest above the horizon.  By contrast, the Arctic ice deficiency appears near the equinox – when the sun is low above the horizon.  Note in the graph below, that Arctic ice reaches it’s minimum in mid-September – just when the sun is setting for the winter at the North Pole.  While the September, 2008 ice minimum maps were dramatic, what they did not show is that there was little sunlight reaching the water that time of year.  The deviation from normal did not begin in earnest until mid-August, so there were only a couple of weeks where the northern hemisphere SW radiative balance was significantly impacted.  Thus the water in most of the ice-deficient areas did not warm significantly, allowing for the fast freeze-up we saw during the autumn.
The 2008 peak Arctic ice anomaly occurred near the equinox, when it had the minimum heating effect on the ocean.
https://i0.wp.com/www.ijis.iarc.uaf.edu/seaice/extent/AMSRE_Sea_Ice_Extent.png?resize=520%2C325
By contrast, the peak Antarctic ice anomaly occurred at the December solstice, when it had a maximum cooling effect, as shown below.
https://i0.wp.com/nsidc.org/data/seaice_index/images/daily_images/S_timeseries.png?resize=520%2C416
2.  The next factor to consider is the latitude of the ice, which has a strong effect on the amount of solar insolation received.  Arctic sea ice is closer to the pole than Antarctic sea ice.  This is because of the geography of the two regions, and can be seen in the NSIDC images below.
https://i0.wp.com/nsidc.org/data/seaice_index/images/daily_images/N_daily_extent.png?w=1110
https://i0.wp.com/nsidc.org/data/seaice_index/images/daily_images/S_daily_extent.png?w=1110
Antarctic sea ice forms at latitudes of about 55-75 degrees, whereas most Arctic ice forms closer to the pole at latitudes of 70-90 degrees.  Because Antarctic ice is closer to the tropics than Arctic ice, and the sun there reaches a higher angle above the horizon, Antarctic sea ice receives significantly more solar radiation in summer than Arctic sea ice does in its’ summer.  Thus the presence or absence of Antarctic ice has a larger impact on the SW radiative balance than does the presence or absence of Arctic ice.
At a latitude of -65 degrees, the sun is about 40 degrees below the zenith on the day of the solstice.  Compare that to early September negative anomaly peak in the Arctic at a latitude of 80 degrees, when the sun is more than 70 degrees below the zenith.  The amount of solar radiation hitting the ice surface at those maxima is approximately 2.2 times greater in the the Antarctic than it is in the Arctic = cos(70) / cos(40) .
The point being again, that due to the latitude and date, areas of excess Antarctic ice reflect a lot of SW radiation back out into space, whereas deficient Arctic ice areas allow a much smaller quantity of SW radiation to reach the dark surface of water.  Furthermore, in September the angle of incidence of the sun above the water is below the critical angle, so little sunlight penetrates the surface, further compounding the effect. Thus the Antarctic positive anomaly has a significantly larger effect on the earth’s SW balance than does the Arctic negative anomaly.
3.  The next point is an extension of 2.  By definition, excess ice is further from the pole than missing ice.  Thus a 10% positive anomaly has more impact on the earth’s SW balance than does a 10% negative anomaly.
4.  Due to eccentricity of the earth’s orbit, the earth is 3% closer to the sun near the December solstice, than it is during the June solstice.  This further compounds the importance of Antarctic ice excess relative to Arctic ice deficiency.
All of these points work together to support the idea that so far, polar ice albedo feedback has been opposite of what the models have predicted.  To date, the effect of polar albedo change has most likely been negative, whereas all the models predicted it to be positive.  There appears to be a tendency in the climate community to discount the importance of the Antarctic sea ice increase, and this may not be appropriate.
0 0 votes
Article Rating
367 Comments
Oldest
Newest Most Voted
Inline Feedbacks
View all comments
Art
January 10, 2009 9:49 pm

What do you make of this story from Science Daily:
“Scientists Refute Argument Of Climate Skeptics”
http://www.sciencedaily.com/releases/2009/01/090109115047.htm

January 10, 2009 9:59 pm

It would be interesting to see if the trend in Antarctic sea ice follows one of the components of the Milankovitch cycles. EG. more / less daylight hours per year at the poles.
Just some more cycles governed by our fellow planets.

Alan Wilkinson
January 10, 2009 10:32 pm

The case made in the Science Daily article seems a fatuous attack on a straw man even if the statistics are correct which seems dubious.
I have never heard any credible argument that the climate is random. Obviously there are drivers – the scientific disputes are over identifying and quantifying them.
The study seems to prove absolutely nothing, except perhaps that the most vaguely tenuous link to AGW will get you funding and a publication.

January 10, 2009 10:52 pm

So in the Antarctic we have land surrounded by sea ice, and in the Arctic we have sea ice surrounded by land.
No wonder I get polar bears and penguins confused.

philincalifornia
January 10, 2009 10:54 pm

Art (21:49:29) :
What do you make of this story from Science Daily:
“Scientists Refute Argument Of Climate Skeptics”
———————-
Infantile

Diogenes
January 10, 2009 10:55 pm

It is correct to say that reflectivity increases dramatically with increased angle of incidence, however, as I understand it there is no critical angle for light travelling through air being reflected off water because the ratio of refractive indices is >1.
I would be curious to see the graph of reflectivity w.r.t. latitude and season used by the GCMs, it must be tremendously complex……. or maybe they just don’t bother with such things.

coaldust
January 10, 2009 11:00 pm

Art (21:49:29) :
A quick read of the article reveals the following:
“The GKSS Research Centre asks: is it an accident that the warmest 13 years were observed after 1990, or does this increased frequency indicate an external influence?”
“…it is extremely unlikely that the frequency of warm record years after 1990 could be an accident and concluded that it is rather influenced by a external driver.”
We are supposed to assume that the driver is CO2, I guess. But the article does not name the driver as CO2 because it is just a statistical model. Therefore, the title of the article is hogwash. They have refuted nothing. All they have succeeded in doing was proving that something changed and caused the temperature to rise. Must that something be CO2? No, it could be a number of things.
Perhaps the oceans. Maybe the sun. Or lack of large eruptions spewing earth cooling particles into the upper atmosphere. Maybe something else we know nothing about.

Raven
January 10, 2009 11:10 pm

Art,
The study is meaningless because it presumes that climate would have been stable without some ‘external driver’. It also presumes that the measurements of temperature after 1990 do not have any warming bias when compared to measurements before 1990.
Just another example of biased media spinning a story in a way that is not supported by the facts.

evanjones
Editor
January 10, 2009 11:29 pm

How about the “Big 6” oceanic -atmospheric cycle flipping from cold phase to warm, one by one, from 1976 to 2001? Eh?
And now the PDO has gone cold.
Anyone notice a pattern, here?

Philip_B
January 10, 2009 11:41 pm

Interesting. Much is made of loss of Arctic ice as proof of GW, but the gain in Antarctic ice is studiously ignored.
There are 2 issues here.
1, is the gain and/or loss of ice evidence for GW? ie an effect of climate change.
2, is the gain and/or loss of ice as a primary driver of climate? ie a cause of climate change.
The media and warming proponents focus almost exclusively on 1, while we should be worrying about 2.
There is good evidence that even during the current interglacial, Antarctica has continued to acummulate ice (Antarctic ice sheet, not sea ice).
If this is true, and it can be hard to navigate through the myths and outright disinformation put out by the Warmers, it means we are not in a relatively stable cycle of glacial/interglacial phases. Rather, Earth passed a cooling tipping point a few hundred thousand years ago and we a sliding (pun intended) toward an icerink Earth.

jorgekafkazar
January 10, 2009 11:43 pm

I think another factor in Arctic heat balance is that although sea water has an albedo of almost zero, when the azimuth angle is high, the albedo approaches 0.80, compared to 0.82 for ice under some conditions. (~above, re critical angle) Note, too, that the emissivity of sea water is approximately 1 minus the the albedo (1 minus zero). That is, open sea water essentially radiates to the winter (night) sky as a black body. Ice would act as an insulator under these conditions. The tendency to restore Arctic ice in winter is very high, no matter what happens in the summer. Sell that kayak!

Richard111
January 10, 2009 11:45 pm

This quote from link by Art (21:49:29):

It then goes on to claim agreement with IPCC that CO2 is the cause!!!!!

crosspatch
January 10, 2009 11:51 pm

For some reason Antarctica has been ice covered for 12-14 million years, long before the Arctic was ice covered. There has been ice at the North pole for only about the last 2 million years or so. Off hand, I would say that the South pole is more important a factor in maintaining Earth’s overall balance of temperature than the North pole is. If we had a large land mass at the North pole, even something the size of Greenland, Earth would probably be a *lot* colder than it is now.
We probably depend on the Arctic ocean absorbing what heat it does in order to provide a climate that is habitable in places like North America and Europe.

The Engineer
January 11, 2009 12:18 am

“Scientists Refute Argument Of Climate Skeptics”
Desperate nonsense.
No reasonably intelligent “Denier” ever said there wasn’t a warming trend.
We just said that CO2 wasn’t responsible for ALL the warming.

January 11, 2009 12:22 am

I find all these articles more and more worrying. It seems that everything the IPCC and the AGW alarmists have been telling us has been wrong and that all the indications are that the feedbacks are currently negative and that we are in for a hell of a cooling. No more talk of volcanoes as well please.

January 11, 2009 12:50 am

Art (21:49:29) :
What do you make of this story from Science Daily:
“Scientists Refute Argument Of Climate Skeptics”

The chart shows Hadley temps from 1850 to present. So the farther we get away from the end of the LIA, the warmer it gets. Except for weather variations, of course.

AnonyMoose
January 11, 2009 1:17 am

“Dutch take to skates as cold snap freezes canals”
“… Anticipation is growing for the “Elfstedentocht” or “11 Cities Tour,” a national event where speed skaters race along a 200-km (120-mile) course beginning and ending in the northern city of Leeuwarden.
This year marks the 100th year since the race began and if held, the tour would be the first in over a decade. …”

el gordo
January 11, 2009 1:28 am

evanjones
PDO has entered its cool phase, ENSO is neutral and there are no sunspots. The pattern we can expect is 20 years where there will be more La Ninas than El Ninos. It will be damp and cool in Australia.
During this period icebergs in the southern ocean will increase in number and move further north, as they have done over eons of time. It will all become patently clear within a few years that the AGW faithful have fallen for their own propaganda.

Daniel Taylor
January 11, 2009 1:42 am

This is off topic but I just couldn’t resist.
Fox News has a story about Google searches causing global warming. http://www.foxnews.com/story/0,2933,479127,00.html
I would laugh if the global warming crowd had no power or influence in our world, or impact on our policies. That’s how ridiculous all of this has become. But unfortunately they are driving energy policy, and driving our living standards into the ground.
It’s chilly this winter so I’m thinking of leaving my computer on all night running a macro which submits random searches to Google from a dictionary, one per second. Think that will help? 😉

J.Hansford.
January 11, 2009 1:55 am

Good points Coaldust….. I’ll add another reason… A change due to interpretation of the data by climate “scientists”.
That could account for their conclusions derived from HadCrut data… After all Anthony Watts is showing that the sites for gathering Climate data are not complying to the standards set down for them, many sites across the globe have shut down, and the record was never meant to determine 100ths of a degree ….
… I wonder if they had just used satellite data, whether or not they would get the same results???

Rhys Jaggar
January 11, 2009 2:00 am

An excellent exposition full of insights. Many thanks for a superbly provocative thought-provoking discussion.
I trust that if for some reason at the height/depth of the PDO phase we have just entered that arctic ice is very high and antarctic ice very low that discussions will return to this, as that scenario might be a significant contributor/trigger to potential warming………

J.Hansford.
January 11, 2009 2:02 am

As for the Antarctic, all anybody hears is that the Ice shelves are cascading into the sea and breaking away, to go spinning off into climate chaos, that the Antarctic pennisular is melting… etc… blah, blah
One never hears that the sea ice is at historic highs…. Or that the temperature over the Antarctic land mass is showing cooling.

King of Cool
January 11, 2009 2:13 am

Very clean and clinical, but how do you adjust for the dirty soot factor?
http://www.climate-skeptic.com/2008/06/polar-bears-and.html
The SH sea ice anomaly has been steadily trending down since Mar 2008 and appears to much closer to 0 here than shown in above:
http://arctic.atmos.uiuc.edu/cryosphere/IMAGES/current.365.south.jpg
The Cryosphere Today also state that observed N. Hemisphere sea ice area is almost one million sq. km below values seen in late 1979 and S. Hemisphere sea ice area is about 0.5 million sq. km above that seen in late 1979, PARTLY offsetting the N. Hemisphere reduction (not a “significantly greater” cooling effect).

Julian Flood
January 11, 2009 2:24 am

Re coaldust (23:00:23) :
quote it could be a number of things.
Perhaps the oceans. Maybe the sun. Or lack of large eruptions spewing earth cooling particles into the upper atmosphere. Maybe something else we know nothing about. unquote
It could be dust spread on the ice. It could be smoothed, surfactant and oil-spill polluted water not producing as many clouds as usual. It could be smoothed water having reduced albedo during insolation. It could be smoothed water having less emissivity during darkness. It could be plankton blooms lowering albedo…
So, five things it might be. Add in your sun and eruptions (oceans is a bit general), that’s seven things it might be. Surely there must be more? Oh, yes. CO2. Eight.
JF

Adam Gallon
January 11, 2009 2:41 am

as another spin on the “Arctic Ice is Disappearing” roulette wheel, Pen hadow is off to measure the actual thickness of the Arctic ice.
http://www.catlinarcticsurvey.com/
“The Catlin Arctic Survey
The Catlin Arctic Survey is an international collaboration between polar explorers and some of the world’s foremost scientific bodies. It seeks to resolve one of the most important environmental questions of our time:
How long will the Arctic Ocean’s sea ice cover remain a permanent feature of our planet?”
Not quite a completely loaded question, but at least they’re doing some science on the way and no 600 tonne ship ploughing after them!

January 11, 2009 3:06 am

Currently one of the most effective ways to refute the Science Daily/alarmist crowd is to cast a vote for a real science site: WUWT: click
The AGW promoters will squeal like stuck pigs, but more people will begin to pay attention to what skeptics are saying.
[Right now the combined number of votes for WUWT and Climate Audit — another true science site — have surpassed 50% of all votes cast in the “Best Science” category. The more votes we get, the harder it will be to spin the result as a “popularity contest.” One person’s popularity contest is another person’s “consensus.” It is becoming increasingly clear that the AGW emperor has no clothes.]

Les Francis
January 11, 2009 3:35 am

Smokey, at the end of the poll the AGW alarmist crowd will claim that WUWT is not a science blog. (that’s already been n mentioned has it not?)

J. Peden
January 11, 2009 4:12 am

Art, regarding the Science Daily article, ditto to philincalifornia’s term, “infantile”, to describe the contents of the article. Likewise, infantile readers are mainly supposed to merely repeat the article’s headline. In other words, it’s a classic propaganda piece, aimed at a specific audience: “The Monkeys know it’s true because they always say it’s true.”
“The GKSS Research Centre asks: is it an accident that the warmest 13 years were observed after 1990, or does this increased frequency indicate an external influence?”
Right off the bat, who in their right analytical mind would ever call any valid warming or cooling trend an “accident”? Or, for that matter, any period of non-trend “not an accident”?
This misapplied term, “accident”, itself is specifically intended by the authors to be loaded in order to imply all by itself that any trend must be due to an “external” = “unnatural” [= man-made or perhaps Space Alien?] interference And it also refers only to a statistical model of temperature trends which falsely presumes that essentially no significant Earthly temperature trends are caused by “natural” forces, and it also falsely implies that essentially no significant Global trends have ever existed in the Earth’s history! At least, that is, prior to Man’s presence [or perhaps only due to the actions of Space Aliens prior to Man’s existence?], which is the subtext of the article and which the “infantile” readers are supposed to absorb.

M White
January 11, 2009 4:14 am

OT
Wind energy supply dips during cold snap
http://www.telegraph.co.uk/earth/energy/windpower/4208940/Wind-energy-supply-dips-during-cold-snap.html
“But sources in the energy industry say that the lack of wind has caused the country’s wind farms to grind to a halt when more electricity than ever is needed for heating, forcing the grid to rely on back up from fossil fuels or other renewable energy sources. “

January 11, 2009 4:35 am

Les Francis (03:35:33),
The Weblog Awards committee has placed WUWT in the same science category as RealClimate. If the warmist losers want to be poor sports about their lack of votes, they need to take their sour grapes complaints to the Weblog Awards people.

January 11, 2009 5:07 am

Mike McMillan
The smoothed Hadley readings back to 1850 in the science daily report
http://www.sciencedaily.com/releases/2009/01/090109115047.htm
look much less impressive when compared to unsmoothed Hadley records back to 1660
http://cadenzapress.co.uk/download/menken_hobgoblin.jpg
They would look even less impressive if we could trace it back through history to the Holocene optimums
TonyB

DaveE
January 11, 2009 5:18 am

Daniel Taylor (01:42:52) :
This is off topic but I just couldn’t resist.
Fox News has a story about Google searches causing global warming. http://www.foxnews.com/story/0,2933,479127,00.html
Seems like a damned good way to stop people informing themselves & turning the MMCC tide.
Stop internet traffic! Do it for the kids!
DaveE.

Jasper Ponte
January 11, 2009 5:29 am

Is there a difference in cloud cover between the Artic 80 deg in September and the Antarctic 65 deg in December? If so, would it enhance or weaken the effect described in the article? And to what extend?

Steven Hill
January 11, 2009 5:29 am

Extra, extra, read all about!!
“lack of wind has caused the country’s wind farms to grind to a halt when more electricity than ever is needed for heating, forcing the grid to rely on back up from fossil fuels or other renewable energy sources. “
Bunch of clowns and their wind energy…….

January 11, 2009 5:36 am

This is awesome stuff! I would love to know what the alarmists have to say on this one!
Ecotretas

Sekerob
January 11, 2009 5:38 am

Maybe Steve missed some elements like IR down welling, even when the sun is below the horizon. Maybe he missed why the Antarctic was predicted to be cooler, Ozone hole, Narrower but stronger AV. Maybe he missed that snow at Antarctica would actually increase and mitigate SLR. Maybe he missed that the net SIA is currently 945,000 below 79-00 mean. Maybe he missed that the surface of snow and snow-off days particularly on the Northern Hemisphere over a much greater area than the summer/winter flux at the Antarctic is missing. Maybe Steve missed that Man added GHG’s account physically and demonstrably 1.6 watts to the heat retention capacity, whilst the sun mean flux only account for 0.2-0.3 watts per square meter. Nice theory, [snip-way over the line ~ charles the moderator taking a break from vacation in the SH]
PS What about those huge ABC’s in Asia and over the Indian? Would those account for the mitigating cooling? 0.6C it says.

John W.
January 11, 2009 6:42 am

Art (21:49:29) :
What do you make of this story from Science Daily:
“Scientists Refute Argument Of Climate Skeptics”
http://www.sciencedaily.com/releases/2009/01/090109115047.htm

To understand the problem with their approach, remember that the “average” value of a sine wave is 0.
In this case, climate is deterministic and the result of multiple cyclical processes, some of which may not have been identified. Their approach, however, rests on the unstated hypothesis that climate is forced by CO2, which they have, again implicitly, falsified to something along the lines of “climate is a random process” (“it is extremely unlikely that the frequency of warm record years after 1990 could be an accident”).
I’d also like to know what model they used for the Monte Carlo run. (I’m assuming that the way it was presented, “Monte-Carlo-Simulation,“ was a result of garbled translation.) This gets into the entire area of what constitutes an accurate constructive simulations. For example, did they use one that accurately backcasts the data used to develop it? If not, their sim is useless.
“is it an accident that the warmest 13 years were observed after 1990, or does this increased frequency indicate an external influence?” Someone correct me if I’m wrong, but isn’t this statement false, as addressed numerous times on this site?
I think they should go back to University and take some statistics courses.
Or, since the average depth of they Gulf of Mexico is 3 feet, they could wade from Tampa to Galveston.

Christian Bultmann
January 11, 2009 6:44 am

To the link by Art (21:49:29)
The best statistical methods don’t help when the data they are apply to are faulty
The external driver for the frequency of warm years is Hanses.

Sekerob
January 11, 2009 6:50 am

PS trend 60,000 km square annum off at Arctic and 25,000 km square plus at Antarctic, implying that the Antarctic Sea Ice cooling weight is exceeding a factor of 2.4.
The Arctic as mentioned has 945,000 km square less currently where the Antarctic has 162,000 km square more. That ratio is even more significant.
http://arctic.atmos.uiuc.edu/cryosphere/iphone/iphone.currentarea.series.html
Currently the Baltic and the Seas near Vladivostok are ominously iceless. Their cover and latitude seems significant to me. Explanations?

TerryS
January 11, 2009 6:51 am

Art (21:49:29) :
What do you make of this story from Science Daily:
“Scientists Refute Argument Of Climate Skeptics”

First of the title of the article by itself indicates the bias. The title clearly implies that if you have not accepted the AGW hypothesis then you are not a scientist. Since they are presumably refuting theories by scientists who are not on the AGW bandwagon then they should at least do them the courtesy of calling them “Climate Skeptic Scientists”.
Secondly the quote below is from the article:

Between 1880 and 2006 the average global annual temperature was about 15°C. However, in the years after 1990 the frequency of years when this average value was exceeded increased.

That quote alone tells me the quality and depth of the so called refutation.
There is plenty of evidence of the cyclical nature of climate caused by things such as the PDO and NAO, if you dont believe this then have a look at the AGWers excuses for the current 10 years trend. Because of this cyclical nature their research is in fact flawed since they have based it on the premise of climate being non-cyclical. i.e. This years temperature bears no relationship to last years. This is a false premise.

M White
January 11, 2009 6:57 am

Carbon footprint of Britons for few days ‘bigger than annual footprints of poorest’
http://www.telegraph.co.uk/earth/earthnews/4210332/Carbon-footprint-of-Britons-for-few-days-bigger-than-annual-footprints-of-poorest.html
“The charity are lobbying the Government to help Britons reduce their carbon footprints by increasing the amount of energy from renewables and improving efficiency, while also helping those in the developing world to improve lifestyles through low carbon energy.”
Build more windmills????

Bruce Cobb
January 11, 2009 7:00 am

Julian Flood (02:24:13):
It could be dust spread on the ice. It could be smoothed, surfactant and oil-spill polluted water not producing as many clouds as usual. It could be smoothed water having reduced albedo during insolation. It could be smoothed water having less emissivity during darkness. It could be plankton blooms lowering albedo…
So, five things it might be. Add in your sun and eruptions (oceans is a bit general), that’s seven things it might be. Surely there must be more? Oh, yes. CO2. Eight.

Julian, climate is not a random walk. If you will study the history, you’ll see that the warming of the 20th century is in no way out of the ordinary. Yes, of course man can and does have some small impact, mostly regional in nature. Yes, of course we should be concerned about pollution (which does NOT include C02), and try to limit it as much as possible. But, hitching concern about pollution to the AGW bandwagon is a huge mistake, and one that environmentalists will surely rue.
As for volcanoes, sure they have an effect, temporarily lowering temps somewhat when there are more, or bigger ones than normal, and I suppose the argument could be made that if there were fewer, smaller volcanoes in a certain time period, it would allow temps to rise a bit more during a warm trend, or cool a bit less during a cool trend. So what? The evidence now is we’re cooling. The oceans having switched to their cool phase PDO would seem to be the primary reason, however ultimately, it is the sun which determines which way our climate heads, and as of now, it looks to be heading “south”.

Steven Goddard
January 11, 2009 7:08 am

Answering a few questions –
Cryosphere Today measures ice area, whereas NSIDC measures extent. The key points of this article are that the timing of the anomalies and the latitude of excess/missing ice are what effects the SW budget. If the North Pole were ice free on Sept 21, it would have essentially no impact on the SW budget, because there is no direct sunshine. Measured at June 21, there has been very little loss of Arctic ice. The losses have been seen late in the summer, towards the equinox, when they have minimum effect.
Ice thickness has almost no impact on the SW balance. The light reflects off the surface.
The Science Daily article seems to be stating the obvious. If you accept the temperature data they are using, the earth is warming. Anyone can see that from looking at the graph. No need for Monte Carlo analysis to reach that conclusion.
I have no idea why Antarctic sea ice has been increasing and won’t speculate. I’m just pointing out how the observed trend affects the SW balance.
Re: Wind energy supply dips during cold snap
WUWT was among the first to point this out on Jan. 1
http://wattsupwiththat.com/2009/01/01/an-opportunity-for-europe-in-2009/#more-4766

Bill Marsh
January 11, 2009 7:23 am

Art,
I read the Science daily article and I agree with the other posters. It is a classic ‘strawman’ attack. The term ‘accident’ is horribly loaded (and horribly unscientific I might add. It implies that the ‘skeptics’ (whomever they may be) argue that the the climate system is random and proceed to show that it is not. Well of course it isn’t random, its a complex, non-linear, chaotic system. Chaotic systems are not random, in fact, I don’t think there are any natural ‘random’ systems, they are all deterministic. The problem with chaotic systems is that, unless you know the precise value of every variable and the exact functioning of every process in the system at time t0, you cannot skillfully predict the state of the system at time t+1 (or any other period for that matter. I don’t think any climate scientist can tell you with a straight face (with possibly one or two exceptions) that we know all the variables and the functioning of all the processes that affect earth’s climate, so we can’t reliably predict its future state.
The sad thing is that most likely now ‘natural’ climate effects will be forever branded as ‘random’ and since these gents have ‘proved’ climate changes are not ‘random’, the climate changes we are experiencing are not ‘natural’, hence they must be man made.

Editor
January 11, 2009 7:27 am

The Science Daily article says:

… estimated that it is extremely unlikely that the frequency of warm record years after 1990 could be an accident and concluded that it is rather influenced by a external driver.

Gee, I thought that part of the science was settled. One thing that pricks up my ears is what warmists compare from past to present to make their point. In 1999 it was easy to say 1998 was the warmest year on record, now they’re saying the past 10 years is the warmest decade on record, and here they’re reaching back 18 years.

“Our study is pure statistical nature and can not attribute the increase of warm years to individual factors, but is in full agreement with the results of the IPCC that the increased emission of greenhouse gases is mainly responsible for the most recent global warming“, says Zorita in summary.

Can we recall his degree and send him back to school? I think I’ll add this to my list of stupid quotes. I only have a couple (_my_ standards are high), but I think this qualifies.
Newcomers to the thread – don’t bother reading that article.

M White
January 11, 2009 7:39 am

Another Arctic expedition in 2010
Northern Pole of Inaccessibility
http://news.bbc.co.uk/today/hi/today/newsid_7809000/7809290.stm
http://news.bbc.co.uk/1/hi/england/berkshire/7808276.stm
“For the first leg of the journey Jim will lead a team of trained novices to reach the Geographic North Pole, leaving the last landfall of Canada in February 2010. Having reached this he will continue alone and without re-supply to the Arctic Pole a further 269 miles into the very centre of the Arctic Ocean”
http://www.ice-warrior.com/ArcticPole.htm

A.Syme
January 11, 2009 7:50 am

The Catlin Arctic Survey looks like an interesting project. It should give some hard evidence on ice thickness. The problem I see is that ti heeds to be done every year so that trend lines can be established. The sponsoring outfit is a hardcore warmer in philosophy, but they may end up documenting the dawn of the new ice age!

Pamela Gray
January 11, 2009 7:53 am

re: the Arctic expedition. Any scientist worth anything at all understands that if you have preconceived ideas about what you are looking for, you will find it. Science is subjective and relative to the degree that bias is present. Science is objective and absolute to the degree that bias is absent. I believe the scientists on their way to measure ice depth and concentration will report subjective and relative data. I guess there is no such thing as the null hypothesis anymore.

paminator
January 11, 2009 8:04 am

This is an excellent post!
I think another point for this excellent posting by Steven Goddard is how heat loss is increased from open ocean compared with ice-covered ocean due to the existence of convective heat loss from the open ocean’s surface. The radiative and convective heat losses from open Arctic oceans will result in rapid ice formation.
Diogenes (22:55:57) : “I would be curious to see the graph of reflectivity w.r.t. latitude and season used by the GCMs, it must be tremendously complex……. or maybe they just don’t bother with such things.”
You are correct that the reflectance does not have a critical angle, and rapidly approaches R=100% at very shallow incidence angles. It is indeed complicated by the fact that the ocean surface, especially in the southern oceans, is not a specular reflector. There are surface topological features that are large relative to a wavelength of light. That makes the prediction of surface absorbance (the parameter that we really care about) dependent on surface roughness, water droplet size and density above the surface, foam, etc.
jorgekafkazar (23:43:57) :
I looked up some data on the emissivity of ice versus open water, and they are very similar and high (effectively blackbody sources in the IR). Ice is also a poor thermal insulator, having a thermal conductivity not much different from liquid water. Ice can also be a poor reflector of short-wave radiation, depending on air inclusion size and density. However, ice allows snow to build up as a top cover. Snow has very good insulating properties, and a high reflectance. The interesting result of snow-covered ice over water is the freezing rate of the underlying water will slow or stop as the thermally insulating snow cover reduces heat loss to the atmosphere.

Allan M R MacRae
January 11, 2009 8:11 am

Art (21:49:29) :
What do you make of this story from Science Daily:
“Scientists Refute Argument Of Climate Skeptics”
http://www.sciencedaily.com/releases/2009/01/090109115047.htm
Reading the Abstract, it appears the authors used Hadcrut Surface Temperatures (ST). Although Hadcrut is probably better than GISS ST, both ST datasets exhibit a strong warming bias (ref. McKitrick and Michaels recent paper, etc.).
I suggest the authors should have used UAH or RSS Lower Tropospheric (LT) temperatures. These LT temps also show a warming trend, which has peaked and started to decline and now approaches 1979 LT temperature levels, when the satellites were launched.
A switch of the Pacific Decadal Oscillation to cool phase will probably result in further average cooling, unfortunate for humanity.
For a plot of LT’s, see
http://icecap.us/index.php/go/joes-blog/is_this_the_beginning_of_global_cooling/
This plot uses a 6th order polynomial fit and ends in mid-2008.
Roy Spencer has an up-to-date plot using a 4th order polynomial fit, at
http://www.drroyspencer.com/latest-global-temperatures/
Neither of these polynomial fits is predictive, but combined with the PDO shift and other factors such as solar inactivity, the probability is for more cooling.
Raw UAH LT monthly data is available at
http://vortex.nsstc.uah.edu/data/msu/t2lt/tltglhmam_5.2

DaveM
January 11, 2009 8:13 am

So, in light of all this, just what can we take away from this article?
http://english.pravda.ru/science/earth/106922-0/
I am naturally suspicious of the source, but on further research I find that the article has the same sort of basis in “fact” as does anything coming from the AGW crowd… One can only hope they are wrong. I’m in the “bring on the global warming” crowd! 😉

shadyplants
January 11, 2009 8:16 am

Off post but very interesting. It seems that Exxon have started the move from the Dark Side and are now seeing the light.
“The boss of ExxonMobil, the world’s largest oil company, has called for a carbon tax to tackle global warming, marking a volte-face by the firm once described by Greenpeace as Climate Criminal No 1. Assailed from all sides by scientists and a new cadre of US politicians, led by the President-elect, Barack Obama, the landmark concession by Rex Tillerson represents a nod to realpolitik after years when the company denied the existence of man-made global warming.
Exxon had already dropped its funding of lobby groups which deny the science of climate change and begun to take a softer public line, but even Mr Tillerson admitted that propounding a carbon tax had stuck in the craw until recently.

For the whole story click here. http://www.independent.co.uk/news/world/americas/oil-giant-comes-in-from-the-cold-1297558.html
For the statement from the horses mouth read here_http://www.businesswire.com/portal/site/exxonmobil/index.jsp?ndmViewId=news_view&ndmConfigId=1001106&newsId=20090108006153&newsLang=en

Pamela Gray
January 11, 2009 8:18 am

Just an observation. Ice melts faster in slightly warmer water than it does in slightly warmer air. I think the combination of water temperature and wind could be a major double whammy to sea ice melt patterns and would venture to state the null hypothesis that ocean currents and wind patterns do not show predictable melt patterns along the sea ice edge. I state it thusly to back up my earlier statement regarding finding what you are looking for. Were I to pursue this line of research, I would perform a statistical study on daily ocean current temperatures and wind pattern data compared to sea ice edge melt data in order to determine what, if any, correlations exist.
Why is this so hard for AGW scientists to grasp? It is basic research design and I see it where? In not a single AGW-sponsored media published report or study have I seen even basic research on all the variables thought to be associated with Arctic sea ice melt. Is that because there are such studies but they can only be found in obscure journals and are never trotted out by AGW scientists for public news? Truly, if AGW scientists want me to believe that CO2 is the cause of sea ice retreat, show me the study with data on all the variables associated with sea ice melt and that demonstrates that CO2 is the strongest predictor.
This trip to the Arctic me thinks is another publicity stunt and not true research.

jack mosevich
January 11, 2009 8:25 am

Slightly OT: Here is a link to a PRAVDA (the Truth) article about an impending ice age.
http://english.pravda.ru/science/earth/106922-earth_ice_age-0

Steven Goddard
January 11, 2009 8:26 am

DaveM,
I think what you can take away from the Pravda article, is that most Russians aren’t worried about global warming. That has been more or less the official line in Russia.

jack mosevich
January 11, 2009 8:27 am

Sorry: didn’t notice that DaveM posted the link already

Bruce Cobb
January 11, 2009 8:29 am

WRT “climate is not a random walk”, I should have put that in quotes – David Archibald said that (I seemed to remember it from somewhere, and should have simply googled it).

Steven Goddard
January 11, 2009 8:38 am

Re: critical angle
The discussion of critical angle pertains to open water near the North Pole close to the equinox, where the water is relatively still – not the Antarctic where there is excess ice covering the water.

Allan M R MacRae
January 11, 2009 8:50 am

RE:
http://english.pravda.ru/science/earth/106922-earth_ice_age-0
SOME GLOBAL COOLING PREDICTIONS (UP TO 2007 – SINCE 2008 THESE HAVE BECOME TOO NUMEROUS TO INCLUDE)
I believe that human influences on climate are minor compared to natural influences.
I also believe that global warming is much less threatening to humanity than global cooling.
Several credible parties are now predicting that global cooling will start by 2020 or sooner (see below). These predictions come from nine different scientific researchers/organizations including NASA and the Russian Academy of Sciences, and are derived from two scientific bases:
1. Studies of cycles, such as various Solar Cycles (Hale, Gleissberg, etc.) and climate cycles (Pacifac Decadal Oscillation, etc.).
2. Studies of solar physics and current solar activity trends.
Wouldn’t it be truly ironic if our society wasted hundreds of billions of dollars in a futile fight against global warming, only to conclude in the very near future that it is getting much colder, and we are not at all prepared for it, and we have squandered our scarce capital and resources to prevent a global warming crisis that did not exist?
Hope I’m wrong…
Best regards, Allan
_____________________________________________________________________
Excerpt from:
Kyoto hot air can’t replace fossil fuels September 1, 2002; Allan M.R. MacRae; Calgary Herald
Over the past one thousand years, global temperatures exhibited strong correlation with variations in the sun’s activity. This warming and cooling was certainly not caused by manmade variations in atmospheric CO2, because fossil fuel use was insignificant until the 20th century.
Temperatures in the 20th century also correlate poorly with atmospheric CO2 levels, which increased throughout the century. However, much of the observed warming in the 20th century occurred before 1940, there was cooling from 1940 to 1975 and more warming after 1975. Since 80 per cent of manmade CO2 was produced after 1940, why did much of the warming occur before that time? Also, why did the cooling occur between 1940 and 1975 while CO2 levels were increasing? Again, these warming and cooling trends correlate well with variations in solar activity.
Only since 1975 does warming correlate with increased CO2, but solar activity also increased during this period. This warming has only been measured at the earth’s surface, and satellites have measured little or no warming at altitudes of 1.5 to eight kilometres. This pattern is inconsistent with CO2 being the primary driver for warming.
If solar activity is the main driver of surface temperature rather than CO2, we should begin the next cooling period by 2020 to 2030.
___________________________________________________________
Other Excerpts, in chronological order:
In 2003, Dr. Theodor Landscheidt wrote a paper predicting serious global cooling: “Analysis of the sun’s varying activity in the last two millennia indicates that contrary to the IPCC’s speculation about man-made global warming as high as 5.8° C within the next hundred years, a long period of cool climate with its coldest phase around 2030 is to be expected.” http://mitosyfraudes.8k.com/Calen/Landscheidt-1.html
In 2005, Piers Corbyn predicted cooling by 2040:
On the 2nd February 2005, he gave this presentation to the Institute of Physics Energy Management Group. It contained the following:
In the next 5 or 10 years warming is likely to be maintained as a transpolar shift occurs. This will be followed by the magnetic pole moving away from the geographic pole, a decrease in solar activity, a southward shift in the Gulf stream and considerable world cooling by 2040 AD.
http://julesandjames.blogspot.com/2005/05/trying-to-bet-on-climate-with-piers.html
In 2006, NASA predicted that “Solar Cycle 25, peaking around the year 2022, could be one of the weakest in centuries”. http://science.nasa.gov/headlines/y2006/10may_longrange.htm
Global cooling could develop on Earth in 50 years and have serious consequences before it is replaced by a period of warming in the early 22nd century, a Russian Academy of Sciences’ astronomical observatory’s report says. http://www.mosnews.com/news/2006/08/25/globalcooling.shtml
–MosNews, 25 August 2006
The Kyoto initiatives to save the planet from the greenhouse effect should be put off until better times. The global temperature maximum has been reached on Earth, and Earth’s global temperature will decline to a climatic minimum even without the Kyoto protocol.
http://www.mosnews.com/news/2006/08/25/globalcooling.shtml
–Khabibullo Abdusamatov, Russian Academy of Science, 25 August 2006
If you look back into the sun’s past, you find that we live in a period of abnormally high solar activity. Periods of high solar activity do not last long, perhaps 50 to 100 years, then you get a crash. It’s a boom-bust system, and I would expect a crash soon. http://www.newscientist.com/unpwlogin.ns
–Nigel Weiss, University of Cambridge, 16 September 2006
Sunspot numbers are well on the way down in the next decade. Sunspot numbers will be extremely small, and when the sun crashes, it crashes hard. The upcoming sunspot crash could cause the Earth to cool.
http://www.newscientist.com/unpwlogin.ns
–Leif Svalgaard, Stanford University, 16 September 2006
*****************************************************************************
An 8th prediction of cooling from China in 2007:
THE COMING GLOBAL COOLING?
World Climate Report, 16 March 2007
http://www.worldclimatereport.com/index.php/2007/03/16/the-coming-global-cooling/
An article has appeared in a recent issue of Meteorology and Atmospheric Physics with a curious title “Multi-scale analysis of global temperature changes and trend of a drop in temperature in the next 20 years.” … …”Despite the increasing trend of atmospheric CO2 concentration, the components IMF2, IMF3 and IMF4 of global temperature changes are all in falling”… …”the effect of greenhouse warming is deficient in counterchecking the natural cooling of global climate change in the coming 20 years. Consequently, we believe global climate changes will be in a trend of falling in the following 20 years.”… …”The global climate warming is not solely affected by the CO2 greenhouse effect. The best example is temperature obviously cooling however atmospheric CO2 concentration is ascending from 1940s to 1970s. Although the CO2 greenhouse effect on global climate changes is unsuspicious, it could have been excessively exaggerated. It is high time to re-consider the global climate changes.”
Reference
Zhen-Shan, L. and S. Xian. 2007. Multi-scale analysis of global temperature changes and trend of a drop in temperature in the next 20 years. Meteorology and Atmospheric Physics, 95, 115-121.
********************************************************************************
And a 9th prediction of cooling from Finland
Timo Niroma:
http://personal.inet.fi/tiede/tilmari/sunspots.html
Alert note 31.10.2007 – A probable new Dalton minimum.
According to my theory about Jovian effect on sunspots, based on facts measured since 1700 and estimated since 1500 (Schove)
– The Jupiter perihelion and sunspot minimum never coincide and the nearing perihelion will slow the rise of the height of sunspot cycle, as happened to the cycle 23 and will happen still more dramatically to cycle 24.
– The Gleissberg cycle has almost reached its lower limit, which is 72 years.
— In fact this low it has not been ever after the Maunder minimum.
— So it must go up, the short cycles of the 20th century has created a debt that must be paid.
Now the next Jovian perihelion is in late March in 2011. I predict that the length of the cycle 23 is in the range of 12.2-13 years. This means a minimum earliest in October 2008 and latest in July 2009 (I use the minimum of 1996.6). This means that the cycle 24 is very low, in the range of 40-70, or a Dalton level. This means that the maximum will be reached only in 2014. All this means there will be a cooling for decades, probable one Gleissberg or nearly 80 years. (A sidestep: The rise of the CO2 in atmosphere from 0.03 to 0.04 % does not have any meaning in this play. The rise should be to more than 1 % to affect the complicated feedback system of Earth if the last 200 million history of Earth is used as a proxy of what has happened yesterday.)
Assuming that the last 500 years in solar behaviour can be used as a proxy for the normal behaviour of the Sun, the estimated probability of the first prediction is .91 and for the latter .96, making the total probability of this prediction to be true as 87%. (A sidestep: I’m a statistician and this is a statistical study, but a remark for those, who urgently for years have asked me about the physical reason: I find the Svensmark theory (2006) of cosmic rays oscillating to the rhythm of the Sun’s magnetic field as most promising. The CERN investigations in 2008 probably will settle the issue.)

tim c
January 11, 2009 8:53 am

You should all check out drudges link to pravda next ICE AGE!
http://english.pravda.ru/science/earth/106922-earth_ice_age-0

Ron de Haan
January 11, 2009 9:01 am

The world is on the brink of an ice age:
http://english.pravda.ru/science/earth/106922-0/

Syl
January 11, 2009 9:03 am

Les Francis (03:35:33) :
“Smokey, at the end of the poll the AGW alarmist crowd will claim that WUWT is not a science blog.”
Heh. Well, RC shouldn’t talk–[snip]
REPLY: I don’t like such suggestions, and I deleted this comment. However, I don’t want to fall into the sorts of comments that RC has allowed about myself and Steve McIntyre see http://www.climateaudit.org/?p=4814
– Anthony

edriley
January 11, 2009 9:05 am

This is my first posting on any blog.
I really enjoy this one and extend my thanks to Mr. Watts for his work.
I’m not sure where this post belongs; my apologies if it is in the wrong place.
I’ve noticed the new Mauna Loa CO2 data is out and the older data has been revised. I understand from other posts on this blog that it is a normal process for them to adjust the data.
The new trended data shows a decline from January 08 to December 08, from 385.07 to 385.03 ppm. Looking at their historical numbers, it appears random whether January data typically reports higher or lower than December data. If this January reports level or declining, then the global CO2 levels will have declined from one year to the next.
REPLY: Welcome Ed, I’ve been waiting for this to shake out a bit before posting on it. There will be a thread soon. – Anthony

Pierre Gosselin
January 11, 2009 9:17 am
January 11, 2009 9:20 am

shadyplants — Re ExxonMobil
ExxonMobil has done a lot of very interesting things lately, indeed, all along. Rex Tillerson is an impressive and amazing man. Rex was a couple of years ahead of me in undergrad, and we had some classes together.
As the largest and most profitable major oil company on the planet, they are the very best at much of what they attempt. It is instructive to observe their actions, particularly their research and their capital spending.
In research, ExxonMobil developed a high-strength steel that allows less steel to be used compared to earlier steels. They also developed a novel plastic membrane that will advance batteries for hybrid vehicle use. They also announced recently a novel synthetic rubber that holds air pressure with a thinner layer of material; this allows truck tires to be thinner and lighter thus reducing fuel requirements in trucking. Green things, IMHO.
On the capital investment front, they have invested, and are investing, heavily in LNG plants and the ships to transport LNG. They see the future, and it is natural gas.
ExxonMobil produces a very instructive document, their Energy Outlook. In my view, this should be required reading for all thoughtful people. It can be found at
http://www.exxonmobil.com/Corporate/energy_outlook.aspx
One key point about an integrated oil company is that the highest value-added, or profitability, comes from petrochemicals and lubricants, but not from gasoline. Therefore, it would suit ExxonMobil just fine for the demand for gasoline to decrease.
Full disclosure: I am not an employee of ExxonMobil nor have I ever been employed by them. ExxonMobil is not a client, and I currently do not own any stock. I previously owned some stock for brief periods.
Roger E. Sowell
Marina del Rey, California

Pierre Gosselin
January 11, 2009 9:42 am

Concerning Exxon / Tillerson etc.,
like T. Boone Pickens, the gas industry has quickly learned that there’s real gold in them thar windmills – especially for the natural gas industry.
Because wind energy output fluctuates so wildly, its installed capacity has to be backed up by natural gas turbines 1:1. That’s right! For every KW of installed wind power, there’s got to be 1 KW of gas-fired capacity as back-up.
That means when the wind blows, the gas-fired generators will simply sit their and do nothing (except cost consumers a lot of money). And when the wind turbines stop on windless days, the gas turbines will have to fire up to pick up the slack.
Just think of the money GE is going to make selling BOTH wind and gas turbines, sall ubsidised by the guv, and all at the consumers’ expense of course. Now Exxon is out to capitalise on all the increased wind-driven gas consumption, and of course get a share of all the nice subsidies that are about to be forked out to the wind industry too.
All of this is going to cost the consumer a big bundle. As I said there’s gold in them thar mills! (Though, not for the consumer).

Pierre Gosselin
January 11, 2009 9:46 am

It just doesn’t get any better. Exxon takes subsidies to build more windmills, so that it can sell more natural gas down the road.
For the consumer, we PAY the government to install a system that is going to require we PAY more in the future! Brilliant!
Basically it’s paying your doctor to make you sick, so that you can pay him later to cure you.

Pierre Gosselin
January 11, 2009 9:53 am

The whole thing is just a big bloody scam.
And as long as we have so many stupid, idiotic, clueless, duped masses out there, these things are just going to keep happening.

Richard Sharpe
January 11, 2009 9:53 am

Hmmm, a quick look at the Arctic Sea Ice Extent graphs suggests that Arctic Sea Ice thinks it has gotta do some catching up.

Richard Sharpe
January 11, 2009 9:54 am

I should have added: Go baby ice!

KuhnKat
January 11, 2009 9:58 am

Anthony:
Mauna Loa posts .24 yearly rise in co2 for 2008, the smallest since recording began in 1959!!!
http://www.esrl.noaa.gov/gmd/ccgg/trends/
Hopefully they fully checked these numbers before posting!!

Chris V.
January 11, 2009 9:59 am

The graph in the opening post showing the “Southern Hemisphere Extent Anomalies December 2008” has a trend of 1.1 +/- 2.5% per decade.
The error bar (+/-2.5%) is larger than the trend itself (1.1%)
The real trend (with 90% confidence?) could be anywhere from +3.6% to -1.4%.
My statistics are a little rusty, but doesn’t that mean that you can’t say (with any statistical certainty) whether the S. Hemisphere ice trend is positive or negative?
Compare the S. Hemisphere with the N. Hemisphere Ice extent:
http://nsidc.org/data/seaice_index/images/n_plot.png
The N. Hemisphere trend is -3.3% +/- 0.7. I’m guessing that trend is statistically significant.

Steven Goddard
January 11, 2009 10:00 am

Interesting article about Greenland reportedly came out today.
http://www.google.com/hostednews/afp/article/ALeqM5jT2vWIgQBz7SF1lsG4MvVuAZJaDQ
Massive Greenland meltdown? Not so fast, say scientists
PARIS (AFP) The recent acceleration of glacier melt-off in Greenland, which some scientists fear could dramatically raise sea levels, may only be a temporary phenomenon, according to a study published Sunday.
Researchers in Britain and the United States devised computer models to test three scenarios that could account for rapid — by the standards applied to glaciers — melting of the Helheim Glacier, one of Greenland’s largest.
Two were based on changes caused directly by global warming: an increase in the flow of water that greases the underbelly of the glacier as it slides toward the sea, and a general thinning due to melting.
If confirmed, either of these explanations would point to a sustained increase in runoff over the coming decades, fueling speculation that sea level could rise faster and higher than once thought.
The stakes are enormous: the rate at which the global ocean water mark rises could have a devastating impact on hundreds of millions of people living in low-lying areas around the world.
But a team led by Faezeh Nick of Durham University in Britain found that neither of these scenarios matched the data.
“They simply don’t fit what we have observed,” said colleague and co-author Andreas Vieli in an interview.

George Bruce
January 11, 2009 10:02 am

Shadyplants:
I guess with Exxon switching sides, we now will be justified in accusing all AGW wonks of being paid stooges of Big Oil…….

DaveE
January 11, 2009 10:03 am

Allan M R MacRae (08:50:37) :
Wouldn’t it be truly ironic if our society wasted hundreds of billions of dollars in a futile fight against global warming, only to conclude in the very near future that it is getting much colder, and we are not at all prepared for it, and we have squandered our scarce capital and resources to prevent a global warming crisis that did not exist?
Hope I’m wrong…
I hope so too!
Unfortunately, it’s likely that you’re not. I’m not sure about a coming ice age but cooling is definitely on the cards & after preparing for warming, something we won’t be prepared for.
DaveE.

Caleb
January 11, 2009 10:03 am

To edriley (09:05:09) :
If you look back at the “Midwinter Report Card” posting on this site you’ll notice that Kum Dollison (14:44:12) provided a link to Mauna Loa “raw data” which indicated there was no rise in CO2 levels between November and December.
Such a flat-lining of CO2 levels during winter, when they ordinarily rise, would be “unprecedented.”
Likely the data will be “corrected,” however too much “correcting” makes people get suspicious. Next thing you know people will be heading up to the top of Mauna Loa with their own little testing kits, to double-check and verify the data. (After all, when McIntyre headed up into the hills to double-check on the Bristlecone Pine data, the results were an eye-opener.)
In any case, I eagerly look forward to Anthony posting on this subject.

Squidly
January 11, 2009 10:06 am

This is off topic but I just couldn’t resist.
Fox News has a story about Google searches causing global warming. http://www.foxnews.com/story/0,2933,479127,00.html

I’m sorry, but I am losing my sense of humor for this sort of nonsense. It used to be novel, it has become annoying. Keep in mind, there are those that will actually believe this garbage.

Ken
January 11, 2009 10:19 am

Art (21:49:29) :
What do you make of this story from Science Daily:
“Scientists Refute Argument Of Climate Skeptics”
A lot of good responses to your question, however
let me ask you a question Art;
Art, what do you make of the story??????????

Arn Riewe
January 11, 2009 10:22 am

Several comments on the article:
“Scientists Refute Argument Of Climate Skeptics”
The AGW machine is working overtime to come up this this stuff. First of all, the headline is disingenuous. I don’t recall any “skeptic” of claiming that the recent warming is any “accident” as implied by the article. Second, the headline implies moral relevancy – “we’re the real scientists and you’re not”.
The whole premise of the article is moot. The final periods of an increasing trend are going to be statistically higher than previous periods. DUH!
Finally, the last paragraph is inherently contradictory with itself and shows what I consider scientific dishonesty:
“Our study is pure statistical nature and can not attribute the increase of warm years to individual factors, but is in full agreement with the results of the IPCC that the increased emission of greenhouse gases is mainly responsible for the most recent global warming“, says Zorita in summary
Shame on you Zorita! Did you have to put that in to get published or just to get the next grant!

January 11, 2009 10:24 am

Squidly
Stop posting this stuff as I then have to read it causing signifacant carbon emissions. So you are directly responsible for causing catastrophic global warming.
TonyB

John
January 11, 2009 10:34 am

To Art (first post, asking about Science Daily article):
http://www.sciencedaily.com/releases/2009/01/090109115047.htm
It is likely correct that man-made emissions have had some effect on rising temps since 1990. The two questions are:
1. How much?
2. What are the drivers?
The satellite graphics on WUWT this past week suggest a linear trend of about 1.3 to 1.5 degrees C per century. No so bad, certainly not a climate catastrophe, unless it were to accelerate.
What are the drivers? A major driver not much discussed is the shift from “global dimming” (occurring up to about 1990), followed by “global brightening.” This refers to the fact that up to 1990, less sunlight penetrated to the earths surface over time. After 1990, the opposite occurred. Note that the Science Daily article uses 1990 as a start point.
Most articles I’ve read about the subject suggest that the fall of the FSU and eastern European communist countries, with the massive shut down of very dirty industry, caused a very substantial reduction in sulfates in the atmosphere. Sulfates have direct cooling effect (in dry air, they are whitish) and an indirect cooling effect as well (the help form clouds via cloud condensation nuclei). It appears that about 1/6 of the reduction in sulfate is from the US acid rain program, about 1/6 from the similar Western European program, and about 2/3 from the fall of the FSU. Chinese increases in SO2 emissions leading to sulfate formation are less than the decreases just described.
For more, google “solar dimming” and “solar brightening,” or “global dimming and brightening.”
So we have at least three major candidates for the recorded warming: increases GHGs, decreased sulfates, and natural (solar?) influences.
It is complex to sort them out, it is obvious to say. But sort them out we must. The IPCC and others include sulfates in their models — but the question is, have the people who wrote the Science Daily article tried to parse out the effects separately, or are they implying (by not discussing sulfate) that it is all due to GHGs?

January 11, 2009 10:36 am

Pierre Gosselin — steady, there, steady!
The engineers are on it, so no need for 1-to-1 gas turbine backups for wind power. Or for wave or solar power, for that matter.
Energy storage is a hot topic with great interest and funding for research. Sandia National Lab has a good site on their efforts, see
http://www.sandia.gov/ess/
There are at least four technologies under study and various stages of deployment: compressed air, pumped water hydroelectric, batteries, and flywheels.
Besides, all of this will be just a curious footnote to history, once the hydrogen from sunshine technology has matured. Artificial photosynthesis, whereby sunshine splits water into hydrogen and oxygen, then the hydrogen is piped to a conventional power plant, is the ultimate technology.
Artificial photosynthesis should make everybody happy, at least those who have sufficient sunshine to split the water. No CO2. No toxics. No drilling. No byproducts, just water vapor. Sustainable.
[ WAY off topic, Anthony, I know. But, I wanted to inject a ray of sunshine into this discussion! — Roger ]
Roger E. Sowell
Marina del Rey, California

Brendan
January 11, 2009 10:40 am

Also on Drudge – my all time favorite…
Revealed: the environmental impact of Google searches
http://technology.timesonline.co.uk/tol/news/tech_and_web/article5489134.ece
And the best comment:
People,
Please think of Mother Gaia
Use Dogpile to search, it queries multiple search engines.
Nosmo, Harrisville PA, USA
Good advice to ward off that global cooling!
I loved another of the comments that google only uses friendly hydropower to run its servers. Unless google built the dams, they are only using power that would have normally been there. Another suggests that google may not have its own server farms. Hahahaha! The ignorance has left me in complete despair. We are all doomed. As the dodos said in the movie “Bring on the Ice Age!!!”

Brendan
January 11, 2009 10:42 am

Oops. I see squidley posted a similar article. I still think the comments on the telegraph web site make for great entertainment though…

crosspatch
January 11, 2009 10:50 am

“Very clean and clinical, but how do you adjust for the dirty soot factor?”
I believe at the North pole, soot would impact most by increasing radiation in winter. If the ice darkens in winter, it would radiate even more heat than it otherwise would. As there is much more ice (and therefore more soot) in winter, the impact of increased radiation in winter might more than offset an increase in absorption in summer. Particularly as ice area decreases in summer and the soot is a decreasing factor as the summer progresses.

Richard deSousa
January 11, 2009 10:51 am

A little off topic: So the Russian scientists are predicting a new ice age is imminent. That would explain their combative behavior regarding energy and their natural gas reserves. May be they are doing the Europeans a service by making the Europeans change their silly belief the earth is going to melt from the heat. If indeed the Russian scientists are correct, Europe and the US better start thinking about increasing our use of carbon based energy or nuclear power before it’s too late and we are beset by a new ice age.

J. Peden
January 11, 2009 10:51 am

Again, just to try to make the AGW horse die so that then all we’d be doing here is “beating a dead horse”, as to the Science Daily article, which says:
“The GKSS Research Centre asks: is it an accident that the warmest 13 years were observed after 1990, or does this increased frequency indicate an external influence?”
If the Earth was indeed in a significant “Global Warming” trend, regardless of the cause, why would anyone be surprised that the most recent years were among the most warm?
And if the Earth had been in a “Global Warming” trend, then started to cool, why would anyone be surprised that the immediately cooling years involved with the changing trend were still among the most warm?
And, more generally, why would anyone want to rush off in a virtual panic to effect an alleged “cure” to an alleged “disease”, which was not only worse than the disease or even a bona fide disease all by itself, but also which was then allegedly addressing a condition – GW – which perhaps doesn’t really exist, and when what instead exists is a genuine disease-producing condition – Global Cooling – to which the alleged GW “cure” can only contribute by reducing the Energy needed to inhibit GC’s adverse effects?

Squidly
January 11, 2009 10:54 am

TonyB,
I was replying to the original poster, but to your point, I agree .. 😉
Oops, sorry, I boiled another gallon of tea! (have to read article to appreciate)
– Squidly

crosspatch
January 11, 2009 11:02 am

“Exxon had already dropped its funding of lobby groups which deny the science of climate change”
Climate always changes and always has and always will. Without “change” we would have never had a Holocene Optimum (climate much warmer than today), Younger Dryas (much colder than today), Roman Warm Period and Medieval Warm Period (somewhat warmer than today) or Little Ice Age (somewhat colder than today).
Climate always changes. The question is exactly how much change humans have on that. As far as global climate is concerned, I am fairly convinced at this point that our impact is somewhere close to zero in a global scale.

Squidly
January 11, 2009 11:03 am

Brendan,
I was actually replying to the original poster of the article.
I should really take this opportunity however to clarify my original response. I am not dissing the posting of those kinds of articles here. I rather enjoy a chuckle now and then. However, I am dissing those that write bogus crap like that. I am beginning to lose patience as there is so much of that kind of garbage floating around, and I know of people that will actually believe the stuff. Hence, it simply fuels more of the hysteria. Keep posting them here though, I like the humor of it (I’m sure others here do too).
– Squidly

JimB
January 11, 2009 11:12 am

“And, more generally, why would anyone want to rush off in a virtual panic to effect an alleged “cure” to an alleged “disease”, which was not only worse than the disease or even a bona fide disease all by itself, but also which was then allegedly addressing a condition – GW – which perhaps doesn’t really exist, and when what instead exists is a genuine disease-producing condition – Global Cooling – to which the alleged GW “cure” can only contribute by reducing the Energy needed to inhibit GC’s adverse effects?”
You ask why?
Money.
JimB

Editor
January 11, 2009 11:13 am

DaveM (08:13:39) :

So, in light of all this, just what can we take away from this article?
http://english.pravda.ru/science/earth/106922-0/

1) The next Ice Age appears to be on schedule. Rather, the cycles of the
previous ice ages remain in place. This is hardly news.
2) AGW proponents need to look at geologic time scales. This is hardly news.
3) Russian nationalistic propaganda remains in place. The first time I heard Radio Moscow on Dad’s shortwave radio around age 12 taught me more about propganda than anything I learned in school. I still remember the superior tone of voice as the announcer compared superior Russian factory output to America’s. For example, the article goes out of its way to praise Milankovich. I was a bit surprised to see Carl Sagan describes as famous, but I guess he’s not a threat.
4) I wish a paper version was available in supermarket check out lanes. Life isn’t the same without tabloids like “World News Weekly” and the others that gush over UFOs. Here we have photos of a suicidal chicken, photos of a “Hellish hairy sea monster” (what _is_ that, anyway?), and a photo of a nano-scale toilet. This is great stuff!

Steven Goddard
January 11, 2009 11:26 am

Chris V
If you look at the Antarctic ice data since 1990, it is a statistically significant upwards trend.
http://nsidc.org/data/seaice_index/images/s_plot.png

Edward Morgan
January 11, 2009 11:27 am

Isn’t it just that the Antarctic is more sensitive to the sun’s downward turn because it is nearer land which loses heat quicker. Keep thinking, Ed.

Editor
January 11, 2009 11:37 am

On the original topic (has a post ever been taken over this badly?)
Somehow it never registered with me that
1) the NH ice edge is much closer to the pole than is the SH ice edge.
2) the relative minima are out of phase.
I guess I don’t quite understand why either minimum occurs when it does. The NH minimum makes sense to me as I’d expect the region to remain in melting conditions after the summer solstice. The SH pattern seems odd. Perhaps thanks to its much greater size and less ice movement than in the Arctic the higher sun angle can track the ice edge. As soon as the sun heads north, there’s not enough heat to counter the cold from the south and the ice edge rushes back.

Editor
January 11, 2009 11:41 am

Roger Sowell (10:36:54) :

Artificial photosynthesis should make everybody happy, ….
… I wanted to inject a ray of sunshine into this discussion

You are hereby banned from posting for the next five (5) minutes for bad punnery. 🙂

Paul Shanahan
January 11, 2009 11:45 am

Brendan (10:40:12) :
Also on Drudge – my all time favorite…
Revealed: the environmental impact of Google searches
http://technology.timesonline.co.uk/tol/news/tech_and_web/article5489134.ece

I personally like the irony of posting an article on the web about the “bad” CO2 effects of using the web…

Brian Macker
January 11, 2009 11:46 am

“Scientists Refute Argument Of Climate Skeptics”
What’s a “climate skeptic”. Someone who doesn’t believe in climate? Does anyone fit that category.

January 11, 2009 11:49 am

Ric Werme —
*grin*

January 11, 2009 11:54 am

This may deviate a bit from the subject but I wonder if anyone has studied the degree to which space satellites and debris may refect energy into space?

January 11, 2009 11:57 am

Allan M R MacRae (08:50:37) :
SOME GLOBAL COOLING PREDICTIONS (UP TO 2007 – SINCE 2008 THESE HAVE BECOME TOO NUMEROUS TO INCLUDE)
I have heard this blog being referred to as “The cold weather and astrology blog”.

Edward Morgan
January 11, 2009 12:04 pm

Leif’s admitted the connection, the truth at last.
Leif said “I have heard this blog being referred to as “The cold weather and astrology blog”
Lighten up, Ed.

Edward Morgan
January 11, 2009 12:14 pm

Pierre Gosselin,
Your not alone. Don’t give in, Ed.

Joel Shore
January 11, 2009 12:18 pm

Terry S says:

Because of this cyclical nature their research is in fact flawed since they have based it on the premise of climate being non-cyclical. i.e. This years temperature bears no relationship to last years. This is a false premise.

That is not correct. They did not assume each year’s temperature is independent of the last. They tried various different autocorrelations. See here for more discussion: http://tamino.wordpress.com/2009/01/10/taint-likely/

jae
January 11, 2009 12:23 pm

Steven Goddard: Great post! So straightforward and clear!
Art, #1: The study says:
“Between 1880 and 2006 the average global annual temperature was about 15°C. However, in the years after 1990 the frequency of years when this average value was exceeded increased.”
Duh! I think most folks assume we are still coming out of the Little Ice Age, and wouldn’t that fully explain the interpretation of the statistics provided in that study?

January 11, 2009 12:26 pm

Leif, did you really say:
Sunspot numbers are well on the way down in the next decade. Sunspot numbers will be extremely small, and when the sun crashes, it crashes hard. The upcoming sunspot crash could cause the Earth to cool.
http://www.newscientist.com/unpwlogin.ns
–Leif Svalgaard, Stanford University, 16 September 2006

January 11, 2009 12:27 pm

wattsupwiththat (12:15:40) :
if you are referring to WUWT (couldn’t be sure)
I was.
I get a chuckle out of such angry labels coming from RC.
Yeah, there are many angry folks out there.
Politics and religion and agenda-mongers have found ways of channeling and exploiting that anger. Science has not figured out yet how to do this.

E.M.Smith
Editor
January 11, 2009 12:35 pm

nobwainer (Geoff Sharp) (21:59:08) :
It would be interesting to see if the trend in Antarctic sea ice follows one of the components of the Milankovitch cycles. EG. more / less daylight hours per year at the poles.

If I remember my Milankovitch correctly, the limiting factor leading to a new ice age is the retention of north polar snow & ice during the summer. Antarctic snow & ice is always present, and arctic snow & ice is always present in winter. What varies is the summer snow & ice in the arctic.
Now this thread has the interesting point that the snow & ice accumulation in the summer in the antarctic may also be important. Since this is in phase with Milankovitch cycles, it would reasonably be so. (Both poles are getting less sunshine as the polar tilt becomes less). It may be that the antarctic provides a little ‘kick’ that helps the arctic stay frozen over in summer that leads to glaciation.
What I also find interesting is that the AGW folks are just worried sick over the loss of summer sea ice in the arctic and desperately want the arctic to stay covered all summer long… exactly the conditions that put you into an ice age glaciation… IF we ever have persistent ice cover over the whole arctic through the summer, start looking into that vacation home in Ecuador 😉

EW
January 11, 2009 12:36 pm

I don’t quite get the reason for Zorita’s and von Storch’s study about the lack of randomness of the last most warm years and even less the title of the link in ScienceDaily.
Sceptics usually point out that climate and temperatures were never constant, always changing. And the discussion is about the cause of recent changes, to which the cited study doesn’t add anything new.
About the cold weather – a remark from a recent article about the current gas crisis in Europe. The writer calls the recent European January temperatures (-10 to -25 Celsius) “unseasonally cold”. Well, I was born in 1950 in the heart of Europe and I would definitely not call such temps “unseasonal”. Having -10 to -15 C in January isn’t anything extraordinary (although pretty annoying for me, an old lady). Maybe the writer of the article was born after the chilly 60-70’s…

DaveM
January 11, 2009 1:00 pm

Ric Werme 11:13:38
LOL! Quite agree. You must have missed the mutant human like creature given birth to by a dog! Me, I’m stocking up on long johns.

Edward Morgan
January 11, 2009 1:03 pm

Tom in Texas your link is dead it would be good to see this. Ed

January 11, 2009 1:05 pm

Tom in Texas (12:26:52) :
Leif, did you really say:
“The upcoming sunspot crash could cause the Earth to cool.
http://www.newscientist.com/unpwlogin.ns

We have discussed that here before [with Ambler IIRC]. The quote is out of context [twice]. I was talking with Stuart Clark [who wrote the article] and the discussion was about if coming low solar activity would have a climate effect. My answer to him was a response to his hypothetical “If sunspots have a big effect would low solar activity mean cooling”, and the answer is clearly “yes”. The “if” has conveniently been left out [then and in later quotes]. Maybe someone could find the article back.

Frank Lansner
January 11, 2009 1:11 pm

Hi steve and thanks for nice article!
Theres no doubt that when arctic ice have been on retreat, the new ice in the fall seems to explode in extend, probably due to heat loss from open arctic sea. Also, the nes ice is much whiter, higher albedo, than old ice, so its just no so easy to get rid of that arctic ice.
K.R Frank

January 11, 2009 1:12 pm
kkstewart
January 11, 2009 1:12 pm

This is the first time that I have encountered WUWT. After reading 100+ comments, I didn’t see anyone refer to another poster as an idiot, Nazi, etc., or insult their religion, intelligence, race, nationality or (perceived) political leanings. WHAT’S UP WITH THAT?
Is this just good moderation, or have I encountered a community of people that can think and discuss things civilly and rationally with a common goal of seeking to find out what is true?
Nah, I just saw Rod Serling off to the side, smoking a cigarette, and saying something about “For your consideration…”
-Kris

Reply to  kkstewart
January 11, 2009 1:53 pm

kkstewart
Anthony does not tolerate abusive behavior between posters and the community here accepts that. The team of moderators occasionally has to steer the ship back on course, but by and large, the community that exists here knows both that they should behave respectfully and see it as an advantage as well in forming a better community.
jeez aka charles the moderator

Pierre Gosselin
January 11, 2009 1:21 pm

Compressed air?
pumped water hydroelectric?
batteries?
flywheels!?
LOL!
Keep dreaming – these are yet additional energy conversion stages, i.e. which lead to yet more considerable losses, on top of the already inefficient wind technology.
Why don’t you calculate how many elevated ponds, batteries, flywheels, air tanks will be needed to buffer a couple of windless days? There’s a report coming out soon that takes a look at all these systems. Conclusion: ASTRONOMICALLY INEXPENSIVE AND UNRELIABLE. (The report will be out in February, and cannot comment beyond that).

Richard M
January 11, 2009 1:22 pm

Art,
Re: “http://www.sciencedaily.com/releases/2009/01/090109115047.htm”
Is this peer reviewed? I would think this kind of PEER REVIEWED paper should become the poster child for skeptics whenever anyone throws out peer review as a defense for CAGW. The article is pure nonsense. Others have already shown major flaws that should have been caught in any reasonable peer review.

E.M.Smith
Editor
January 11, 2009 1:22 pm

Pierre Gosselin (09:46:42) :
It just doesn’t get any better. Exxon takes subsidies to build more windmills, so that it can sell more natural gas down the road.

And don’t forget that the mandated CO2 sequestration means that the coal burners (Exxon competition) must collect the CO2 and dispose of it. This means Exxon can be subsidized in enhanced oil extraction via CO2 injection. They get PAID to enhance oil production by their competition. Gotta love it.

Chris V.
January 11, 2009 1:36 pm

Steven Goddard (11:26:12) :
Where does that graph say the trend is statistically significant?
You can plot a best-fit trend line through any data- but that doesn’t mean it’s a statistically significant trend.
The error bar for the slope indicates the real trend could be positive or negative (within whatever confidence level they’re using).
It seems to me that you can’t say whether the trend is positive or negative with any confidence.
Am I missing something? Maybe one of the statistics experts can chime in here. Leif?

Terry Ward
January 11, 2009 1:43 pm

kkstewart (13:12:30) :
You’re welcome. 😉
Confidence breeds civility. The opposite doesn’t.

Edward Morgan
January 11, 2009 1:53 pm

kkstewart,
The nature of the debate cannot be fully brilliant as you describe but it does pretty well. I am only interested in what you are, true scientific discovery which leads for me to positive humanitarian steps. Forewarned is forearmed. RoboMod does step in every now and then but that’s just his programming you can’t blame him for that. Most of this is truth searching, lots of it is on the way there and some of it is bizarre. Enjoy and keep solving. Ed

January 11, 2009 2:11 pm

Pierre Gosselin (13:21:20) :
“Compressed air?
pumped water hydroelectric?
batteries?
flywheels!?
LOL!”
Au contraire, Pierre! You may not be familiar with just how this works, nor the critical importance of energy storage in a renewable (intermittent) energy world.
And yes, as an engineer, I am intimately familiar with the physics of energy conversion. As an attorney, I work with clients to further their goals of commercializing energy storage systems. Cannot comment much more on that, as that information is privileged.
But, what is in the public domain I can speak to. And yes, I would agree with you that no energy storage system can make the wind blow more or the sun shine more, so the total KWH generated will not go up. But, consider this. When the wind does blow, perhaps at night, the power generated can be stored for later use when power demand is high.
Once these systems are installed, with perhaps four or five days of energy production without wind or sun, the economics of renewables improves dramatically. There probably is an optimum number of days storage, but I don’t know anyone who has worked that out.
Energy storage systems allow the renewable generation to become a load-follower, selling power at its highest price.
I look forward to reviewing the report you refer to.
Roger E. Sowell
Marina del Rey, California

Reply to  Roger Sowell
January 11, 2009 2:21 pm

Pumped water hydro is already in widespread use.
In 2000 the United States had 19.5 GW of pumped storage capacity, accounting for 2.5% of baseload generating capacity. PHS generated (net) -5.5 GWh of energy[3] because more energy is consumed in pumping than is generated; losses occur due to water evaporation, electric turbine/pump efficiency, and friction.
In 1999 the EU had 32 GW capacity of pumped storage out of a total of 188 GW of hydropower and representing 5.5% of total electrical capacity in the EU.

Editor
January 11, 2009 2:23 pm

I went through a simplified calculation and got some weird numbers. Please confirm this independantly before claiming that we’ve disproven Gore/Hansen. Here are the calculations…
According to the map at http://atlas.nrcan.gc.ca/site/english/maps/archives/5thedition/environment/climate/mcr4076 (Anthony, please check that the URL isn’t split) the average daily “global” radiation on a horizontal surface in the Canadian mid-arctic is between 8 and 9 megajoules. let’s call it 8.64 megajoules to make the calculation easier. Given 86,400 seconds per day, that averages out to 100 joules/second = 100 watts.
Compare that with black body heat loss. Assumption… ice and water are, for all intents and purposes, perfect black bodies. Take the Stefan-Boltzmann equation, which gives radiated energy rate in watts per square metre as ( 5.6704 / 10^8 ) * T^4 where T is temperature in degrees K. Open water at 5 C (278.12 K) radiates 339.3 watts per square metre. Ice at -20 C (253.12 K) radiates 232.8 watts per square metre. I.e. the insulating effect of ice at -20 C blocks more energy loss than energy absorbed by open water, even if water has an albedo of zero. At -40 C, which often happens in the Arctic winter, the radiation loss from ice is 167.5 watts per square metre, i.e. less than half the loss from open water at 5 C.
Counter-intuitive as it seems, a large Arctic icecap causes global warming, which will tend to melt the icecap. A reduced, or non-existant Arctic icecap causes global cooling, which tends to create/increase the Arctic icecap. Thus we have a stable system, rather than a Gore/Hansen “tipping point”. This also explains…
1) Why ice ages didn’t result in a permanent “snowball earth”.
2) Why, even when extreme conditions produced a “snowball earth”, the climate recovered and the ice went away
3) Why it was possible for an Arctic icecap to form in the first place, given that there wasn’t one during most of earth’s paleohistory.

Chris V.
January 11, 2009 2:46 pm

Steven Goddard (11:26:12) :
According to the NSIDC:
“The interval indicates that we are 95% confident that the “true” slope or trend line is between the values given. If the interval includes zero, we cannot reject the hypothesis that there is no trend in extent for that month.
http://nsidc.org/data/seaice_index/interpretation.html#linearregression
For the S. Hemisphere ice extent anomalies, the null hypothesis (0% slope) can not be rejected. Which, I think, means the trendline is not statistically significant (at the 95% confidence level).
If the trend of the S. Hemisphere ice extent is not statistically significant, then you can’t conclude that “the effect of polar albedo change has most likely been negative.”
Once again, statistics is not my bag- am I missing something?

January 11, 2009 2:50 pm

As of right now, WattsUpWithThat and Climate Audit combined have now received over 51% of the total votes in the “Best Science” category.
We can get at least one more vote in for WUWT before the polls close. Please help us make it a strong finish: click
Thanks!

Allan M R MacRae
January 11, 2009 3:30 pm

Roger Sowell (10:36:54) :
“Pierre Gosselin — steady, there, steady!
The engineers are on it, so no need for 1-to-1 gas turbine backups for wind power. Or for wave or solar power, for that matter.”
Hi Roger,
Pierre Gosselin is technically correct re the need for (nearly) 100% backup of wind power by conventional electric power generation. From my earlier post on another thread:
The biggest problem I see with wind power is the “substitution capacity”, the percentage of conventional power generation that can be permanently retired when new wind power is put into service. This number is typically less than 10%.
The best report I’ve found on this subject is:
E.On Netz Wind Power Report 2005, Germany
http://www.eon-netz.com/Ressources/downloads/EON_Netz_Windreport2005_eng.pdf
Simply, the wind often does not blow when we need the peak power – so we need a ~same-size conventional power station over the hill, spinning and ready to take over when the wind dies… …the fact that wind power varies as the cube power of the wind speed is a further problem – power variations in the grid due to varying wind speed can cause serious grid upsets, even shutdowns.
Just one such blackout in a cold winter could have devastating results – for a preview, look up a sampling of the mortality stats during the Ontario-Quebec Ice Storm of a decade ago.
http://www.phac-aspc.gc.ca/publicat/ccdr-rmtc/99vol25/dr2517ea.html
Storage of electricity is much easier said than done.
One interesting idea for electricity storage is a “super battery”, consisting of many plugged-in electric cars. This should be possible in a decade or two.
Wind power is supposed to work well in conjunction with (excess) hydro power, but I have not seen this clearly demonstrated.
I have studied this subject and in conclusion I am yet not a fan of wind power.
Regards, Allan

Steven Goddard
January 11, 2009 3:31 pm

Chris V,
Please read again what I wrote – carefully this time.
If you look at the Antarctic ice data since 1990, it is a statistically significant upwards trend.
http://nsidc.org/data/seaice_index/images/s_plot.png

Alan S. Blue
January 11, 2009 3:50 pm

I’ll just jump in on the ‘pumped water hydro’ line.
Hydroelectric power generation can reach exceedingly high efficiency ratios. Pumping can also be very efficient. It depends on what type of pump or turbine you’re using exactly. But 85% or so is possible with a fairly run-of-the-mill effort. (Under laboratory conditions you can exceed 95%, but you tend to have problems making the widget larger due to mechanical issues like vibration.)
This is a quite reasonable number in comparison to the competition for methods of storing energy. (Batteries really, really suck.) Note that you’re also going to send this energy down the high voltage power lines, which completely suck.

January 11, 2009 4:09 pm

Leif Svalgaard (13:12:07) :
Leif Svalgaard (13:05:11) :
Maybe someone could find the article back.
http://www.newscientist.com/article/mg19125691.100-global-warming-will-the-sun-come-to-our-rescue.html?full=true

Another interesting statement from the same article.
Svalgaard warns: “If the Earth does cool during the next sunspot crash and we do nothing, when the sun’s magnetic activity returns, global warming will return with a vengeance.”
I have read this before and wondered.

Brendan
January 11, 2009 4:32 pm

My enjoyment of the google power usage article was all for the irony of it. Google is the group that says its motto is “Do no evil…” except when you can help the Chinese send some of their refusniks off to the organ farms.
I have worked on one of the largest pumped storage plants ever created – Helms Power Plant, in the PG&E system. It was built to take the excess energy Diablo Canyon Nuclear PP pushed out at night. An equivalent facility would be almost impossible to build now. There are good areas for it, but you couldn’t get it through CEQA or any other major environmental regulatory path without it being tied up for decades in court. Environmentalists hate dams, and thats what you need for pumped storage…
I’d write more on the rest, but efficiency isn’t the problem. Its economics, as I’ve written here before. Have to go – the little girl wants her daddy…

Chris V.
January 11, 2009 4:35 pm

Steven Goddard (15:31:19) :
Oh- since 1990.
But your opening post says the antarctic ice has been steadily increasing over the last 30 years, not since 1990.
And the graph you provided shows the ice extent trendline for the last 30 years.
What’s the trend and the error bars since 1990? And have you done the calculations to show that the antarctic albedo-cooling is greater than the arctic albedo-warming?

Edward Morgan
January 11, 2009 4:55 pm

Leif explain please the nobwainer extract above. Did you say as you are quoted as in the article?
Svalgaard warns: “If the Earth does cool during the next sunspot crash and we do nothing, when the sun’s magnetic activity returns, global warming will return with a vengeance.”
Ed.

Les Francis
January 11, 2009 5:18 pm

E.M.Smith (13:22:31) :
Pierre Gosselin (09:46:42) :
It just doesn’t get any better. Exxon takes subsidies to build more windmills, so that it can sell more natural gas down the road.
And don’t forget that the mandated CO2 sequestration means that the coal burners (Exxon competition) must collect the CO2 and dispose of it. This means Exxon can be subsidized in enhanced oil extraction via CO2 injection. They get PAID to enhance oil production by their competition. Gotta love it.

A byproduct of natural gas is condensate. it is the heavy component that comes up a gas well. This is a very high profit commodity and companies such as ExxonMobil benefit handsomely from this product. At one stage just a couple of gas fields made up a rather large proportion of EM’s yearly turnover and profit and most of this was from condensate not the natural gas.

kkstewart
January 11, 2009 5:35 pm

ATTITUDES AND UNDERSTANDING AT MY STATE UNIVERSITY:
I am a graduate student and a public school science teacher. In the fall 2008 semester, I took a class in meteorology, and in geology. My professor in the meteorology class is a staunch believer in AGW. He states that the jury is in. There is no longer any doubt that we are destroying the planet with CO2 emissions. He advocates for immediate and sweeping laws and treaties to reduce CO2 emissions by 50-80%, and that to largely replace fossil fuels with alternative sources is completely doable and absolutely essential. Part of the class requirement was to bring in articles about meteorology and climatology for the class to evaluate and discuss. This professor told me that I may not bring in any articles that discounted AGW, because that is “fringe science” and that the consensus on AGW is already fully established. He also believes that there should be massive class action lawsuits by the countries that will be affected by rising sea level and drought against the oil companies and CO2 producing countries.
I must say that I highly respect this man’s intelligence and knowledge (which are both considerable), and that he is truly a nice guy, but I do not understand his dogmatic adherence to the AGW theory, and his unwillingness to even discuss the matter.
Now my Geology professor, OTOH, is a cantankerous, ornery old curmudgeon, and, I might add, one of the most brilliant scientists I have ever known. He told us in no uncertain terms that AGW is a “crock of sh##.” I would make smart-ass remarks in class, and he would threaten to come over and “stomp me into the floor”. Since he is ex Special Forces, I think he probably could have done it too (even though he is at least 70 years old), but in reality, I think that he was amused, and respected that I had the guts to hassle him. But I digress…..
Word-of-mouth among the(undergraduate) university students (like in my chemistry class), was that most of the science professors were pretty skeptical of AGW.
Of particular interest, my meteorology class consisted of almost all K-12 science teachers. When I brought up the mechanism of greenhouse effect in class, all of them knew that the “heat” was somehow “trapped” or “reflected” by greenhouse gasses, but NO ONE in the class had any idea of the mechanism of radiation-absorption-re radiation.
So rather than regale you with my astute and fascinating reflections apropos my observations of what people know and think about climate change in the University, I would like to hear your thoughts.
-Kris

January 11, 2009 5:44 pm

kkstewart:
I would suggest keeping your head down until you have some kind of tenure or seniority. In the mean time, keep reading this site so you’re up to speed on the current science.
When you have the same job security as your meteorology professor, as Captain Picard would say: “Engage!”
Oh, and one other thing: Vote!

crosspatch
January 11, 2009 5:54 pm

“I have read this before and wondered.”
Well, temperatures started falling while we were still in cycle 23’s solar maximum.
Temperature behavior seems to be tied more to PDO/ENSO though a deep solar minimum will probably have an additional impact.
If we have an exceptionally cold PDO combined with a “Daltonesque” minimum, things might get pretty cold. Toss a major volcanic eruption on top of that sometime in the next decade and it could get interesting.

Mike Bryant
January 11, 2009 6:02 pm

Svalgaard warns: “If the Earth does cool during the next sunspot crash and we do nothing, when the sun’s magnetic activity returns, global warming will return with a vengeance.”
Yup, if someone hid you and put a mask on you, i bet you would be ready for vengeance when you were let loose, too…

Wondering Aloud
January 11, 2009 6:05 pm

kkstewart
I share your pain. I’ve been there.
There is so much pressure both financial and social to be a “good guy” that it takes enormous courage to publicly disagree. It seems to me that a lot of the old timers, especially the ones who don’t have to worry about getting grants to stay employed, seem to be openly skeptical. While the younger ones are either true believers or pretend to be.
If your meteorology prof really thinks that the jury is in on all these issues then frankly he does not understand scientific method. I don’t know what he was teaching but science doesn’t exist with that type of attitude.

kkstewart
January 11, 2009 6:08 pm

Smokey:
You are probably right about keeping my head down. The Meteorology professor (The AGW true believer) is my Academic Adviser, and I still have to take three more classes from him. He is also the one that evaluates my Master’s Research Project.
Actually, I am not teaching right now. I am licensed for high school science, but am taking the year off to get my MSc.
The purpose of my previous post was to relate the attitudes toward AGW that I observed in academia last semester.

January 11, 2009 6:41 pm

crosspatch (17:54:50) :
“I have read this before and wondered.”
What I meant by that is I wonder what the “and we do nothing” comment referred to.
What can man do about a quiet or active sun, not much….maybe Svalgaard was referring to Co2?
And also that the leaves the door open to the possibility of decent temperature change based on the Sun.

January 11, 2009 6:42 pm

meant to say he leaves grrrr….

jcbmack
January 11, 2009 6:56 pm

Of course CO2 is not responsible for all the warming, we have methane and water vapor as well. We do not deny that there are cooling years or even transient cooling trends longer than the aforementioned. I do not think we are anywhere near a cataclysmic point in time from warming alone, despite the current increasing in forces in many hurricanes, increased drought frequency and weather anomalies; prior to industrialization in the planet’s history, we have had plenty of famines, droughts and floods. I do not argue with these facts. I do want to point out, however, that skin cancer, lung cancer, current weather anomalies have reached proportions that were not previously realized in human history and the warming looks to be the warmest in the last 100,000 plus years. (the thirty year trend)
Also thermohaline circulations, artic ice sheet changes in the southern Antartic do not explain away warming or strongly evidence that warming is overcome by cooling in the trend analysis.
I found this post thought provoking as a blog post, but inadequate in data and evidence as a thesis. I look forward to seeing more details and compelling evidence.

Chris V.
January 11, 2009 7:08 pm

kkstewart (17:35:33) :
If your meteorology professor said that plate tectonics was “a crock of —“, what would you say?
If your biology professor said that the big bang was a “crock”, what would you say?
If your physics professor said evolution was a “crock”, what would you say?
Out of curiosity, what’s your geology professor’s specialty? Geology covers a lot of ground…

AnonyMoose
January 11, 2009 7:11 pm

“He also believes that there should be massive class action lawsuits by the countries that will be affected by rising sea level and drought against the oil companies and CO2 producing countries.”
The UNFCCC and Kyoto would give them money without lawsuits, from the developed countries which sign.

TJ
January 11, 2009 7:11 pm

Svalgaard warns: “If the Earth does cool during the next sunspot crash and we do nothing, when the sun’s magnetic activity returns, global warming will return with a vengeance.”

Svalgaard also repeated assures us that even during the Maunder Minimum the change in luminosity of the sun was so small, and based on all of the models, insignificant, that it contributed in no way to the LIA. So I would say, if the earth cools during a sunspot crash, then the models are clearly wrong, and we have no idea whether AGW will return “with a vengeance.”
Also, I don’t think that scientists dismiss the importance of a growing Antarctic ice shelf. I believe that there is a popular theory that ice ages begin with cooling of the southern ocean as the shelf expands, absorbing more CO2, starting ice age.
It is pretty clear that if the planet’s climate is unstable, which it is on millennial scales anyway it has more of a tendency in the past few million years to dive into ice ages than to warm.

Editor
January 11, 2009 7:22 pm

kkstewart (17:35:33) :

So rather than regale you with my astute and fascinating reflections apropos my observations of what people know and think about climate change in the University, I would like to hear your thoughts.

I think you should ask your geology professor why he thinks your meteorology professor is such an AGW supporter. After a stream of invective and suggestion that you ask your meteorology professor yourself, he might come up with a reasonable answer. (Again – don’t ask him “Why is Dr. M such an AGW supporter,” ask “Why do you think Dr. M is such an AGW supporter?”)
The answer will probably include that in geologic timeframes the Earth has had much higher CO2 concentrations and didn’t self-destruct. Geologists think in a very different timeframe than meteorologists. Heck, the jet stream wasn’t even discovered until World War II and decent global temperatures only go back to 1979 when the Pacific Decadal Oscillation flipped warm.
Read ( http://members.iinet.net.au/%7eglrmc/2007%2005-03%20AusIMM%20corrected.pdf ) or watch ( http://www.youtube.com/watch?v=FOLkze-9GcI ) geologist Bob Carter’s reports. There’s a good chance your geology professor will say similar things and then rant about how much more weather he’s seen than your meteorology professor has.
Ah yes, reminds me of the day my high school Chemistry teacher tried to harass me while I was finishing up yesterday’s homework before class started…. I told him if he had been to the Christmas concert last night (I did the lighting for it) he might be in a better mood today.

January 11, 2009 7:22 pm

Edward Morgan (16:55:37) :
Svalgaard warns: “If the Earth does cool during the next sunspot crash and we do nothing, when the sun’s magnetic activity returns, global warming will return with a vengeance.”
You have to read the full article and see what the general drift of Clark’s points were. He quoted several authors [Solanki, Haigh, …] that speculated that AGW was perhaps half of the effect and solar the other half [quibble if it was 30% or some other number close to 1/2]. In that context and if that was true, then indeed a low solar cycle would temporarily mask the AGW, which would, of course, if nothing was done to ameliorate AGW, come back with a ‘vengeance’ once strong solar cycles returned. My input to the article was the prediction that solar activity would be low and my agreeing to the above hypothetical. I would certainly not claim credit for predicting the present cooling as following from my prediction of a low cycle.

January 11, 2009 7:27 pm

TJ (19:11:18) :
So I would say, if the earth cools during a sunspot crash, then the models are clearly wrong,
It could just be coincidence as there is a lot of natural variability in the system. This is one of main gripes, that people make too much of single occurrences,

VG
January 11, 2009 7:36 pm

NCEP/NCAR still ain’t prepared to compare past snow cover with whats happening now. They simply remove the historical record LOL http://moe.met.fsu.edu/snow/ unless they can explain of course…

Brendan
January 11, 2009 7:41 pm

Chris V –
My heat transfer advisor says that the theory of IR absorption is “unfounded” (he would never say crock of anything… too English). By the way – radiation heat transfer is one of the major areas that he has specialized in.

Brendan
January 11, 2009 8:02 pm

IR by CO2. That’s what you get when you type out a comment in a hurry. His exact comment was that he had reviewed the relevant literature and theories, and that based on his knowledge, that what has been advertised is unfounded.

kkstewart
January 11, 2009 8:09 pm

Ric Werme:
I am afraid that you have lost me here.
“I think you should ask your geology professor why he thinks your meteorology professor is such an AGW supporter. After a stream of invective and suggestion that you ask your meteorology professor yourself, he might come up with a reasonable answer. (Again – don’t ask him “Why is Dr. M such an AGW supporter,” ask “Why do you think Dr. M is such an AGW supporter?”)”
My Geology professor does not know, nor is acquainted with my meteorology professor. I attend a large university.
I related only what my professors said to me. “Dr. M” himself told me that he is such a AGW supporter. The Geology professor told the class independently of anything that I ever suggested that AGW is a crock.
Ric, I am not sure what you are getting at. I would be happy to elucidate if you might tell me what you are asking.

January 11, 2009 8:38 pm

Chris V. (19:08:39) :

kkstewart (17:35:33) :
If your meteorology professor said that plate tectonics was “a crock of —”, what would you say?
If your biology professor said that the big bang was a “crock”, what would you say?
If your physics professor said evolution was a “crock”, what would you say?

Chris V.: If Al Gore said globaloney is gonna getcha, what would you say?

Chris V.
January 11, 2009 8:39 pm

Brendan (19:41:27) :
What part of the theory does he think is unfounded? Does he think that CO2 doesn’t absorb IR?

J. Peden
January 11, 2009 8:45 pm

jcbmack:
I do want to point out, however, that skin cancer, lung cancer, current weather anomalies have reached proportions that were not previously realized in human history and the warming looks to be the warmest in the last 100,000 plus years. (the thirty year trend)
Increased “proportion” skin cancer <– Sun exposure, primarily – possibly including Sun intensity.
Increased “proportion” lung cancer <– Inhaled tobacco product exposure, primarily, having nothing to do with CO2.
Please ask yourself first, what do these facts have to do with your other [very dubious] assertions?

George E. Smith
January 11, 2009 8:46 pm

“” Diogenes (22:55:57) :
It is correct to say that reflectivity increases dramatically with increased angle of incidence, however, as I understand it there is no critical angle for light travelling through air being reflected off water because the ratio of refractive indices is >1.
I would be curious to see the graph of reflectivity w.r.t. latitude and season used by the GCMs, it must be tremendously complex……. or maybe they just don’t bother with such things. “”
Aint necessarily so.
You have to consider whether the surface is an “optical” surface as calm water is at a small scale, or whether it is diffuse scattering.
The high grazing incidence reflectivity is generally a property of optical surfaces only.
for water witha visible light refractive index of 1.333, the normal incidence reflectance is ((1.333-1)/(1.333+1))^2 = 0.02; 2% For non normal incidence the reflectance is partially polarised and you have to use the full Fresnel polarisation formulae. For the polarisation component having the electric vector in the plane of incidence, the reflectance diminishes with angle reaching zero at the Brewster angle; which is arctan (n), which is 53.12 degrees for water or very close to one radian. That is the incidence angle at which your polarised glasses give the maximum extinction of surface reflections from water.. The other component with the electric vecor perpendicular to the plane of incidence, has the same 2% at normal incidence but it slowly increases as you approach the Brewster angle, being slightly more than doubled at the 53 degree angle for water.
The result is that the total reflectance off water, is almost constant at 2% up to the Brewster angle, and then both polarisation components exhibit
steeply increasing reflectance reaching 100% at 90 degree incidence.
The overall result is that for a diffuse light source refelcting off water, the total surface relectance ia bout 3% over the total 90 degree incidence cone.
Given that water is 73% of the earth’s surface, the ordinary Fresnel reflection off the water should account for a fairly fixed component of earth albedo, of 2.2%.
So if total earth surface reflectance of solar energy is 4%, that means that land ias well as snow and ice only account for about 1.8% of total earth surface contribution to albedo; which is why I believe that polar ice contribution to variations in earth albedo, is highly overrated.
Now the above water calculation is what applies to optical surfaces of which water is just about the only natural example on earth.
Snow, and to a lesser extent sea ice are anything but optical surfaces, infact snow tends to trap a lot of incident light and other solar energy components, which effect depends critically on the age of the snow. Freshly fallen snow can have a fairly high reflectance, but after just a few hours, the reflectance drops considerably, usually because the surface morphology of the snow changes as a result of surface melting. Once the snow becomes “icy” on a sall scale, the surface becomes optical (on a small scale) and much of the light is propagated into the interior of the snow, bouncing around so that Total Internal Reflectance traps a large portion of it. So aged snow isn’t all it is cracked up to be as a refelctor, and contributor to earth albedo.
The surface illuminance of the snow under direct saunlight is extremely high, and becasue of the small scale structure of the surface it is a diffuse scattering surface, so at almost any angle of view, snow looks extremely bright viually in direct sunlight, which is why it is an eye hazard.
But as I have said, as a contributor to the earth’s albedo, abnd to variations of that, it is somewhat overrated.
Once sea ice melts, it is true that the sea now becomes an absorber rather than a reflector, but remember that the latent heat required to melt the sea ice comes out of the water it is floating on, so ahuge amount of ocean water is cooled when the sea ice melts, which is why the arctic ocen sea level has been found to be falling at 2 mm per year. That may stop if the recent meltback of the arctic ice diminishes, and starts building back up again.
However, once the sea ice does melt leaving open water, the evaporation can increase, leading to an increase in precipitation of more snow, on surrounding lands.
It seems plausible to me that the recent increases in snow cover in the northern hemisphere, could be a direct result of the 2007 extreme meltback liberating a lot of water vapor in a region that is usually very low humidity.
The spectral reflectances of all kinds of terrestrial materials, including snow and ice, as well as rocks and all kinds of bio materials; have been widely measured, and can be found in “The Infr-Red Handbook” produced for the Department of The navy. Such information is crucial to military systems development.
I am not at my office desk, at the moment, so I can’t look upo some typical values for you right now.
By the way; the Arctic is normally consdered to be the area north of +60 degrees, and the Antarctic, that south of -60 degrees; and there is more land in the Arctic, and more water in the Antacrtic; which must be why they don’t have polar bears in the Antarctic; too much water so they all drowned eons ago.
I would look to cloud modulation as a source of albedo variations, rather than snow and ice cover.

Alan Wilkinson
January 11, 2009 8:56 pm

Chris V, if so many meteorologists skeptical of AGW are discounted because they are not climate scientists, how come a meteorology professor is not similarly discounted in your eyes?

George E. Smith
January 11, 2009 8:59 pm

“” coaldust (23:00:23) :
Art (21:49:29) :
A quick read of the article reveals the following:
“The GKSS Research Centre asks: is it an accident that the warmest 13 years were observed after 1990, or does this increased frequency indicate an external influence?”
“…it is extremely unlikely that the frequency of warm record years after 1990 could be an accident and concluded that it is rather influenced by a external driver.” “”
Another red herring. This is like saying that some of the highest altitudes on earth are found up in the mountains.
Everybody knows that that we have had a warming period with some relatively high temperatures since cooler times in the mid 1970s and stopping around 1995, followed by a short plateau, and now a general falling trend.
Any 8th grade high school science student can explain to us, that when you have a maximum reached in a temperature graph, that the highest temperatures will tend to be clustered around that maximum.
So when are these people going to get a life; and stop reporting the obvious, as if it were a scientific mystery.
30 years from now, when the climate reaches a minimum temperature globally, and starts a new warming phase; the same idiots will be telling us that the last few years have been some of the coolest on record. !
Enough already, it is time to return control to the adults.

J. Peden
January 11, 2009 9:12 pm

kkstewart:
This professor told me that I may not bring in any articles that discounted AGW, because that is “fringe science” and that the consensus on AGW is already fully established.
The Prof. is obviously threatened by contrary or critical thought on the topic of AGW, and probably on other matters as well.
Otherwise, he’d be able to easily handle “fringe science” and arguments confronting AGW on the question of what’s wrong with AGW hypotheses, its “science”, and its alleged “cure”.
You are dealing with someone who is very insecure and needs group approval or even group dictation as to what he “thinks” – potentially involving literally everyone. So if you threaten his groupthink bubble, you are going to pay for it by way of an irrational, punishing response. He has already essentialy delivered a personal threat to you as to his response, should you question his Dogma.
It’s your problem to figure out what you should do with your situation.

Editor
January 11, 2009 9:28 pm

kkstewart (20:09:41) :

Ric Werme:
I am afraid that you have lost me here.
“I think you should ask your geology professor why he thinks your meteorology professor is such an AGW supporter. After a stream of invective and suggestion that you ask your meteorology professor yourself, he might come up with a reasonable answer. (Again – don’t ask him “Why is Dr. M such an AGW supporter,” ask “Why do you think Dr. M is such an AGW supporter?”)”
My Geology professor does not know, nor is acquainted with my meteorology professor. I attend a large university.

Sorry – I was assuming that the two professors knew each other, so never mind. It’s still worthwhile checking out the Bob Carter links, though.

Jeff Alberts
January 11, 2009 9:28 pm

kkstewart (13:12:30) :
This is the first time that I have encountered WUWT. After reading 100+ comments, I didn’t see anyone refer to another poster as an idiot, Nazi, etc., or insult their religion, intelligence, race, nationality or (perceived) political leanings. WHAT’S UP WITH THAT?

It’s certainly [snip]!

Jeff Alberts
January 11, 2009 9:40 pm

Aww come on! I didn’t say anything snip-worthy!
REPLY: I know, but it was all in jest (he originally said “it was not for lack of trying”) and just too good of an opportunity to pass up – Anthony

Jeff Alberts
January 11, 2009 9:41 pm

Smokey (14:50:51) :
As of right now, WattsUpWithThat and Climate Audit combined have now received over 51% of the total votes in the “Best Science” category.

I just find RealClimate’s position
TRULY
HILARIOUS!!!

Allan M R MacRae
January 11, 2009 9:50 pm

Good evening all,
Sorry to be off-topic again, but this is interesting.
Someone else may have posted this news re ML CO2 here or elsewhere – thank you. I read it somewhere today.
Interesting CO2 data from Mauna Loa – dCO2/dt is near-zero over the past 12 months (December 2007 to December 2008): 383.9 to 384.1 ppm
Annualized Mauna Loa dCO2/dt has “gone negative” a few times in the past (calculating dCO2/dt from monthly data, by taking CO2MonthX (year n+1) minus CO2MonthX (year n) to minimize the seasonal CO2 “sawtooth”.)
These 12-month periods are (Year-Month ending):
1959-8
1963-9
1964-5
1965-1
1965-5
1965-6
1971-4
1974-6
1974-8
1974-9
Has this not happened recently because of increased humanmade CO2 emissions, or because the world has, until recently, been getting warmer?
I noted in a paper published one year ago that dCO2/dt changes contemporaneously with “average” global temperature, and CO2 lags temperature by ~9 months.
I do not have the time to update my spreadsheets, but this major decline in dCO2/dt seems reasonable, given the recent cooling.
For those who are interested, see my paper and spreadsheet at:
http://icecap.us/index.php/go/joes-blog/carbon_dioxide_in_not_the_primary_cause_of_global_warming_the_future_can_no/
Best regards, Allan
CO2 data from Mauna Loa:
ftp://ftp.cmdl.noaa.gov/ccg/co2/trends/co2_mm_mlo.txt
year, month, year.xx, CO2 ppm at Mauna Loa
2007 1 2007.042 382.91
2007 2 2007.125 383.87
2007 3 2007.208 384.51
2007 4 2007.292 386.38
2007 5 2007.375 386.54
2007 6 2007.458 385.98
2007 7 2007.542 384.35
2007 8 2007.625 381.85
2007 9 2007.708 380.73
2007 10 2007.792 381.15
2007 11 2007.875 382.38
2007 12 2007.958 383.9
2008 1 2008.042 385.37
2008 2 2008.125 385.69
2008 3 2008.208 385.91
2008 4 2008.292 387.16
2008 5 2008.375 388.57
2008 6 2008.458 387.88
2008 7 2008.542 386.39
2008 8 2008.625 384.14
2008 9 2008.708 383.07
2008 10 2008.792 382.98
2008 11 2008.875 384.11
2008 12 2008.958 384.11

Allan M R MacRae
January 11, 2009 11:52 pm

I updated one graph of Mauna Loa dCO2/dt vs. Global Average LT temp anomaly.
Appears to be a 6-7 month time lag of CO2 after UAH LT temperature, using Mauna Loa CO2 (instead of 9 month lag using Global CO2, as in my paper).
The December 2008 CO2 reading corresponds to the May-June 2008 LT “low”.
Regards, Allan

Pierre Gosselin
January 12, 2009 12:41 am

Dear Mr Sowell,
Again, I can only advise you to take a few minutes and to use your engineering talents and calculate the scale of a storage infrastructure that would be needed to buffer a couple of windless days, should wind energy someday provide 10 or 20% of USA’s electrical need.
I’ll tell you right now that the biofuel proponents had the same hopes, dreams and visions – until they collided violently with reality. Today we all know the folly of biofuuels: deforestation, food shortages, absurd inefficiency and civil unrest, and that all caused by a biofuel industry that is only in its infancy!
In Europe, utilities are indeed backing up wind energy capacity with gas-fired turbines ONE TO ONE. There’s a reason for that. There’s no other technically or economically feasible way. I’ll be sure to send you a link to the report I mentioned once it is available. Things are looking great for natural gas, indeed.
I guess I should be a little more patient with people, as new ideas often look too good to be true. But the test is always economics. And wind and solar, and biofuels too, fail it BIG TIME. Fools’ Gold always looks real – until you weigh it yourself.
I suspect in about 20 years people will wake up and realise what a folly, like the mass housing projects of the 60s, this really is. Instead of dotting the landscape with 30-storey housing projects, we’re now doing the same with part-time operating windmills.

Sekerob
January 12, 2009 2:00 am

There was a note to say that the (mean / interpolated) values had erroneous propagated from November to December. Only on the publicly facing website. Anytime a value is completely out of whack or is same as month before one needs to consider an error is on hand. Nothing new, but for some it’s worth to create a whole blog topic to milk it and get more hits on the site. More hits, more revenue 😀

Editor
January 12, 2009 4:56 am

Brendan (16:32:27) :

I have worked on one of the largest pumped storage plants ever created – Helms Power Plant, in the PG&E system. It was built to take the excess energy Diablo Canyon Nuclear PP pushed out at night. An equivalent facility would be almost impossible to build now.

I visited the pumped storage facility near Yankee Rowe (I think that’s the right name, and I think it was one of the first commercial nukes). They pumped water from the Connecticut River to a hill top reservoir and generated power during the day.
To do the same with wind would require a much bigger storage facility because it would have to hold several days to a couple week supply. Being a hilltop reservoir it was mostly out of sight, I think the area we even open to hiking and picnicing.

John
January 12, 2009 5:33 am

To Leif Svalgaard: I’m not clear on why we would want to go so far as to say that if solar cooling does come, that we can feel certain that warming will later return with a vengeance.
The satellite records for the past 3 decades show a trend of about 1.3 to 1.5 degrees C per century. This record includes the warming induced by GHGs, the warming induced by reducing sulfates since about 1990 (global brightening), any feedback effects from increased GHGs, and whatever solar trends have been going on in the last 30 years. It also includes, as per the first article today, whatever trends there are in El Nino. And it also includes black carbon emissions.
Don’t you have to separate out these influences? And if and when you do, given how small the temperature trend is, even with El Nino, global brightening, black carbon, I would guess that the feedbacks are far smaller than in the IPCC models. If the feedbacks are neutral, then a doubling of CO2 by itself produces about 1 decree C of warming.
So if there is a reasonable chance that this line of analysis is accurate, then how can we feel any degree of certainty that warming will return “with a vengeance”?
And isn’t it true that the feedbacks to CO2 increases are (1) the most important reason for the large IPCC temperature projections, and (2) are the least understood parts of the models (esp. clouds)?

Pierre Gosselin
January 12, 2009 5:48 am

Ric Werme,
And you’ve alluded to yet another drawback: Pumped storage facilities are limited by topography. I think implementing this in the Great (flat) Plains could be difficult.

Burch Seymour
January 12, 2009 6:23 am

” What is not so widely discussed is that southern hemisphere sea ice has been increasing, ”
I was cleaning up in the basement and happened into an old issue of Popular Science mag – February 1997. The cover shows a Zodiac motoring past a large ice-something (berg, glacier) and the cover story.. “Antarctic Meltdown? Controversial New Evidence for a Changing Climate.”

TJ
January 12, 2009 7:22 am

So I would say, if the earth cools during a sunspot crash, then the models are clearly wrong/i,
It could just be coincidence

– Lief
Touche -TJ

January 12, 2009 8:25 am

John (05:33:42) :
why we would want to go so far as to say that if solar cooling does come, that we can feel certain that warming will later return with a vengeance.
First, there is no certainty [this is implicit in almost any statement about this]. Second, you have to see it within the context of the article that assumed [or suggested] that the warming was half [and increasing] AGW and half solar. Under those assumptions a return of high solar activity could reasonably be considered [and likely be advertised] as a ‘vengeance’.
The satellite records for the past 3 decades show a trend of about 1.3 to 1.5 degrees C per century.
or 13-15 degrees C per millennium. It is not advisable to extrapolate outside the length of the record, if you don’t know what causes the trend.

kkstewart
January 12, 2009 8:27 am

J. Peden:
“You are dealing with someone who is very insecure and needs group approval or even group dictation as to what he “thinks” – potentially involving literally everyone. So if you threaten his groupthink bubble, you are going to pay for it by way of an irrational, punishing response. He has already essentialy delivered a personal threat to you as to his response, should you question his Dogma.”
J., I think that you have hit the nail on the head on that one.
Parenthetical, besides my interest in science, I am very interested in what people think, why they think it, and how that affects what they do. Don’t get the idea that I am a fan of “Psychology” as it is currently practiced, because I am not. This relates to Climate Change in that I am looking for differences between the personalities and world views of the adherents and skeptics of AGW.
I find my Meteorology prof (the AGW supporter) quite likable, and I think that he would be wounded at the very suggestion that he had “essentially delivered a personal threat.” He is fun to engage in discussions, and other students have told me that “he loves a good argument, but make sure he ultimately wins.” I have argued with him in class about other topics, and we have both enjoyed the sparring, BUT… I do proceed with caution for fear of insulting in front of the other students.
Now my Geology prof is not a warm cuddly guy at all, but I find him rather delightful, in spite of the fact that he is pig-headed, and would piss me off regularly. The difference with this guy is that if I told him that he was full of sh$$ in front of the class, I doubt that he would never retaliate in even the most subtle manner, nor would he lose a moment’s sleep over it. I NEVER argued science with him in class, because this old bastard is so good, that it would be like showing up to a gang fight with a Nerf bat. So, therefore, I restrained my self to a little judicious heckling.
Actually on the last day, when I brought my voluminous take-home-final-from-hell to his office, I mentioned the heckling, and he told me that he had enjoyed it.
BTW, I learned so much in that geology class that it literally changed the way I see the world.

Phil.
January 12, 2009 8:38 am

Philip_B (23:41:42) :
Interesting. Much is made of loss of Arctic ice as proof of GW, but the gain in Antarctic ice is studiously ignored.

There’s a good reason for that, it isn’t happening.

Edward Morgan
January 12, 2009 9:23 am

Leif, So it seems like you’ve got some doubt on the subject. Am I right? This really changes everything you’ve said that I’ve read. Was it for money? Were you pressured? Why didn’t you say what you say on here? Have you recently had a revelation? I feel a bit hard done by here as you basically flatly threw out everything I’ve said when you actually have some unanswered doubt? Where there is doubt there is room for discovery. Ed.

January 12, 2009 9:32 am

Edward Morgan (09:23:19) :
Am I right?
It seems that you have not read or comprehended anything of what I posted. Repeating my posts doesn’t seem worthwhile.

Edward Morgan
January 12, 2009 11:27 am

Leif, I did read your stuff carefully it just doesn’t add up for this reason.
New Scientist is an important magazine what was the point of your comment in line with the hypothetical.
Most of the readers of New Scientist will reckon you believe solar radiation can play a significant part in climate while most of the readers on here will reckon you don’t. Surely if the sun doesn’t do much then your true opinion would have been far more important than anything else said in the article? People would need to know. Ed

Not sure
January 12, 2009 11:36 am
January 12, 2009 11:40 am

Edward Morgan (11:27:14) :
People would need to know.
I think you are placing too much importance on my opinion. I have said numerous times that:
1) it has not been demonstrated to my satisfaction that the variations of solar activity and irradiance the past several hundred years result in more than, say, 0.1C variation of the temperature.
2) the Sun has varied a lot less over that time than commonly thought.
Many people [even Anthony on point 1 – after all this blog is about climate not about the Sun] may disagree with this, but that does not preclude my comments on the matter.

Edward Morgan
January 12, 2009 12:00 pm

Leif, Thanks for your response. I’ll let New Scientist know so that their readers don’t get a false impression I mean after all its a minor difference in understanding for them.
Question; Mr Scientist. Bears are making a comeback in England, how do you think this will effect the future?
Answer; There will be skirmishes with Bears and people will have to arm themselves.
Thank-you very much for your important opinion. New Scientist

January 12, 2009 12:09 pm

Edward Morgan (12:00:21) :
I’ll let New Scientist know so that their readers don’t get a false impression
I’ll look forward to New Scientist publishing your letter and having them set their readers straight.

Edward Morgan
January 12, 2009 12:44 pm

Of course I won’t bother as it is more honest as it stands. By a beautiful twist of fate. Ed

January 12, 2009 1:10 pm

Edward Morgan (12:44:17) :
Of course I won’t bother as it is more honest as it stands.
So you were being dishonest about your intention…
Danish proverb: ‘a thief thinks everybody steals’
By a beautiful twist of fate.
Your twisted view here does you a disservice. There are times where it pays to listen to people rather than projecting your own wishes.

January 12, 2009 1:15 pm

E. M. Smith:
“And don’t forget that the mandated CO2 sequestration means that the coal burners (Exxon competition) must collect the CO2 and dispose of it. This means Exxon can be subsidized in enhanced oil extraction via CO2 injection. They get PAID to enhance oil production by their competition. Gotta love it.”
It gets better! Recently Dow in Freeport, TX, announced construction of a hydrogen plant using petroleum coke as the starting material, with complete CO2 capture for later sales. Oil drilling/production companies purchase the CO2 for injection into their wells to stimulate oil flow. There are carbon offsets to boost the cash flow. The CO2 remains sequestered in the oil field. As CO2 sequestering is not yet required in Texas, Dow’s primary incentive is replacing naatural gas (expensive) with pet-coke (very inexpensive).
I don’t think the oil companies will get paid to take the CO2. Rather, the CO2 will be sold at a market price. Some oil companies will shut down their CO2 generators and realize some savings, presumably. The market for CO2 may be going down, though, so maybe that is a commodity that could be shorted.
Also, oil companies have their own furnaces that produce CO2, especially in refineries. They will be likely to capture and re-use their own CO2, not helping out a competitor!
Roger E. Sowell
Marina del Rey, California

January 12, 2009 1:49 pm

Pierre Gosselin :
“Dear Mr Sowell,
Again, I can only advise you to take a few minutes and to use your engineering talents and calculate the scale of a storage infrastructure that would be needed to buffer a couple of windless days, should wind energy someday provide 10 or 20% of USA’s electrical need. ”
Good advice. Already done, by lots of serious engineers and businessmen. Also, good points by all that there are few locations suitable for pumped storage hydroelectric, and building more runs into serious opposition.
To illustrate the importance some rather sober and serious people attach to this, there is a multi-day conference in Austin, TX next week on wind power and storage systems. See:
http://www.utcle.org/conference_overview.php?conferenceid=829
Re: biofuels, I agree if you are referring to ethanol. My car is dual-fuel capable with E85, and I refuse to buy any. But, there is a much better argument for biodiesel. Have a look at the Jatropha tree.
And I agree that it is mostly about economics. I have some experience in economics, especially for world-scale energy projects. I have performed a couple of dozen detailed feasibility studies including financing options for multi-billion dollar projects thus far in my career. Sometimes the problem is that people do not think in sufficiently large scale. ExxonMobil recognizes this, and one result is a new generation of LNG tankers that are much larger than any ever built. Where economies of scale exist, bigger is much better.
Europe has different challenges than the U.S., but nothing insurmountable. There are certain geographic and geologic differences, such as no large land expanses such as the desert southwest in the U.S. Technologies must always suit the application, and IMHO one size does not fit all.
You may be right that all this renewable energy talk is nonsense. I disagree, as I know that it is happening, with men of sound judgement and prudent investing standards. As with global warming (or is it cooling?) we must wait and see. I am not waiting, though. I am one who is making it happen.
Btw. Even ExxonMobil, no fan of renewables, predicts that biodiesel will comprise 7 percent of transportation fuels in 2030. That is up from less than one percent today.
Stay tuned, sports fans. This is about to get interesting!
Roger E. Sowell
Marina del Rey, California

Edward Morgan
January 12, 2009 2:03 pm

Leif, I thought of not writing to them afterwards. I would have written to them but I then realised what people thought to that article is more correct for me. If you don’t you write to them. You can’t expect me with my view to do that. And of course you were the one who said it. So put the gallows away.
In judgement I feel the thief comment is a little out of place. In honesty I don’t know why you say what you say and I do suspect you are making it up. That’s where I’m at. Now of course I am trying really hard to get it right for potentially all sorts of great all inclusive reasons that I care passionately about and have felt deeply all my life. Go find my contradictory article.
With the twist of fate thing. I was pleased in the end to think you have helped people wonder about the effect of solar cycles with your New Scientist piece. I assure you if I agreed with you and I’m looking for the truth. I wouldn’t have said it. The real problem is the gap from me to the land of the Wizard of Oz. Ed

maksimovich
January 12, 2009 2:53 pm

Some Danish physicist have another perspective
http://www.physorg.com/news151003157.html

crosspatch
January 12, 2009 3:39 pm

“Have a look at the Jatropha tree. ”
The problem with growing any crop is that the amount of land available for cultivation of anything is limited. To increase the production of something, production of something else must decrease or habitat not currently being cultivated must be modified. While that tree is touted as not competing with food crops, I maintain that is true only while it is not widely cultivated. If cultivation would expand on an industrial scale and if said cultivation were profitable, it would displace less profitable crops. Even if currently uncultivated land were placed into production of it, it would likely greatly change the natural habitats where it is planted.
Converting an area with little vegetation where local species have adapted to the environment to wholesale production of this plant could be catastrophic to what is one of the most delicate ecosystems on the planet. Desert ecosystems are extremely vulnerable to even the slightest change because they exist on the margins of sustaining life in the first place.
Once the trees are planted, increasing seed production would be the first order of business. We would soon see irrigation and fertilization and eventually complete change in the local ecosystem. If it proves very profitable, production would begin to move to more conventional crop locations where it would begin to displace food crops. Exchanging foor for a poisonous oil that can not be used for any other purpose seems somewhat dangerous.

crosspatch
January 12, 2009 3:43 pm

A very effective method of CO2 sequestration would be to pulp waste paper and use it to fill old coal mines. Basically putting the carbon right back where you got it from. Coal would be mined and burned. The CO2 absorbed by trees, turned into paper used in the economy and then buried back into the coal mine where the CO2 came from. That would give a positive use of the CO2 before it is sequestered.

crosspatch
January 12, 2009 3:54 pm

I guess the bottom line is that I believe fossil fuels are more environmentally friendly than the jatropha tree. Nuclear with recycled fuel even more friendly. No need to destroy thousands of acres of desert habitat with nuclear and no CO2 emissions.

Edward Morgan
January 12, 2009 4:24 pm

maksimovich thanks for that article. Sounds spot on. Cheers, Ed.

Martin Lewitt
January 12, 2009 5:05 pm

Leif,
Solanki had an earlier correlation type analysis that claimed to prove that the Sun could account for no more than 30% of the recent warming. The problem with it was that it didn’t take into account climate commitment due to the thermal inertia of the oceans. Solanki’s later work showed that solar activity plateaued at one of its highest levels in the last 8000 years circa 1940, after increasing over most of the 19th and early 20th centuries. So once it dips solar activity is unlikely to return to current levels for quite some time.
TJ indicated that you have concluded that that the solar luminosity differences even at the maunder minimum would not be enough to explain the cooling. Have you considered that UV varies by a much greater amount and has nonlinear impacts through stratospheric chemistry? Have you considered particle fluxes from the solar wind? Have you considered that GHGs couple to the climate quite differently from solar, with solar penetrated 10s of meters into the oceans, while GHGs impact on the ocean in the top few microns? All the non-paleo model independent analyses of climate sensitivity are based on aerosols and solar, not on GHGs, so in this nonlinear system climate sensitiviy GHGs may be quite different.
John,
Solar activity does not have to have an upward trend to account for some of the recent warming. The aerosol event that is hypothesized to have contributed to the mid century cooling (global dimming?) and then cleared up during the 80s (global brightening) just allowed the impact of the high level of solar forcing to return with a vengence (to paraphrase Leif).
Jcbmack,
Far from being the warmest in the last 100000 years, the recent warming is not clearly higher than the Medieval Warm Period, keep in mind the undercertainties. It is almost certainly cooler than the Holocene optimum which occurred in the last 10,000 years.

Ron de Haan
January 12, 2009 5:37 pm

crosspatch (15:54:57) :
“I guess the bottom line is that I believe fossil fuels are more environmentally friendly than the jatropha tree. Nuclear with recycled fuel even more friendly. No need to destroy thousands of acres of desert habitat with nuclear and no CO2 emissions”.
You are right.
The introduction of carbon fuels saved the whales that were caught for a.o lamp oil from extinction.
Carbon fuels are the engine of our economies and we can’t function without them.
There is no energy supply problem because there is enough.
The world’s major problems are over fishing, habitat destruction and food security.
The moment we use food stocks or land to produce fuel we start killing people and species.
CO2 is NO PROBLEM, AGW does not exist.
The real threat to humanity is the corrupt United Nations, the mislead, corrupt and stupid politicians, the crooked bankers and scare mongers like Gore and Hanson who screw science and public trust spreading BS.
The return of our old winters, the internet with sites like WUWT eventually will cope with this problem.
And if a new Dalton/Maunder Minimum arrives this chapter in our history will be closed forever.
It would be nice if it happens in Gore’s life time.
Just the idea that this AH almost made President of the USA is hard to imagine.

January 12, 2009 7:11 pm

Edward Morgan (14:03:34) :
I was pleased in the end to think you have helped people wonder about the effect of solar cycles with your New Scientist piece.
If I have, it was not intentionally. I was pointing out the logical consequence of assuming that AGW and solar activity were both important drivers. One can do that [especially since that was the basic premise of the piece] without accepting that that are.
Martin Lewitt (17:05:50) :
solar activity plateaued at one of its highest levels in the last 8000 years circa 1940, after increasing over most of the 19th and early 20th centuries.
Except that solar activity has not been increasing fro the past 200 years. Solar cycle 23 was not more active than cycle 13 and cycle 11 was more active than cycle 22.
TJ indicated that you have concluded that that the solar luminosity differences even at the maunder minimum would not be enough to explain the cooling. Have you considered …
I think that when conditions are equal, the results are equal. The solar wind and magnetic field during the Maunder minimum was no less than at current minima.
Solar activity does not have to have an upward trend to account for some of the recent warming.
Sounds almost like CO2 does not have to have a downward trend to account for the recent cooling. Or: Solar activity does not have to have a downward trend to account for the recent cooling. Throw enough different variables in the stew and you can get anything you want out.

J. Peden
January 12, 2009 7:19 pm

I find my Meteorology prof (the AGW supporter) quite likable, and I think that he would be wounded at the very suggestion that he had “essentially delivered a personal threat.” He is fun to engage in discussions, and other students have told me that “he loves a good argument, but make sure he ultimately wins.” I have argued with him in class about other topics, and we have both enjoyed the sparring, BUT… I do proceed with caution for fear of insulting in front of the other students.
My 19 year-old daughter has recounted this same dynamic in class, except that she does’t give a shit about what these [lesser than] morons think. Why should she?

Martin Lewitt
January 12, 2009 7:46 pm

Leif,
Climate commitment due to the thermal inertia of the oceans is not just another variable. The mixing layer takes decades and the deep ocean centuries to reach equilibrium. Of course the forcings change long before that can happen. This is one of the things I think the models get right. When you store heat into the oceans you don’t have to get much more than a storage rate and the heat capacity of water right, to get the commitment in the ball park.
When you compare cycle 23 to 13 and 22 to 11 are you considering the isotopic proxies or just the sunspot data, what is your reasoning? I haven’t looked at the Solanki papers in awhile, I could be recalling them incorrectly. I new to this blog, if there is a paper or another entry, I’ll be happy to look at it. — thanx

January 12, 2009 8:18 pm

My views on nuclear power are already on record on WUWT a few days ago, on the Accuweather-Bastardi post.
To crosstalk, re Jatropha trees (or any other bio-diesel plant)
I respectfully disagree, and here is why. Firstly, it is not necessary for the Jatropha trees to infringe on food crop land, when they can replace other trees that have no obvious positive qualities. I worked years ago in Brazil where this was done quite successfully, although their trees are hybrid Eucalyptus. The company is still in business, thriving in fact, and it is Aracruz. Where I worked they had cleared trees and brush over approximately 70,000 acres and planted their Eucaplypus. The trees grow around one foot per month, and are harvested after only 7 years. Then they are processed onsite into pulp destined for ultra-high grade paper. A similar thing can be done with Jatropha as far as replacing indigenous trees.
see http://www.aracruz.com
Secondly, I agree that it is unwise to use crop land for growing fuel, but that point is so widely recognized there is a push to develop bio-fuel plants that will grow on marginal land. I also do not agree that the desert is fragile and must be protected. The key is adequate fresh water. As was pointed out many years ago, the limiting element for growing bio-fuels is water, and after that, land. Deserts are farmed with great success not only in California, also Arizona and New Mexico. One can see the farms from airplanes, they appear as giant green circles.
For the non-U.S. readers, I am of course aware that not all countries have land for discretionary use. Many countries are much more densely populated than the U.S., as I very well know from having visited or worked in many. But, where water is available, it may well be advantageous to replace existing forests with trees that yield bio-diesel.
Roger E. Sowell
Marina del Rey, California

Tom G(ologist)
January 12, 2009 8:40 pm

Phil: “I find all these articles more and more worrying. It seems that everything the IPCC and the AGW alarmists have been telling us has been wrong and that all the indications are that the feedbacks are currently negative and that we are in for a hell of a cooling. No more talk of volcanoes as well please.”
Keep your eye on Yellowstone. It has become very active in the past 6 weeks and if it erupts at 1/100th the magnitude of its last big blast, Mt. St. Helens will look like a popped corn kernel in comparison.

January 12, 2009 9:31 pm

Martin Lewitt (19:46:17) :
When you compare cycle 23 to 13 and 22 to 11 are you considering the isotopic proxies or just the sunspot data, what is your reasoning?
I compare the sunspot numbers [and not just the proxies that are harder to calibrate]. Some of the evidence can be found here:
http://www.leif.org/research/AGU%20Spring%202007%20SH54B-02.pdf
http://www.leif.org/research/De%20maculis%20in%20Sole%20observatis.pdf
and most recently here:
http://www.leif.org/research/Napa%20Solar%20Cycle%2024.pdf
at this meeting Luca Bertello from Mount Wilson Observatory told me after my talk that they have just finished digitizing all the Ca II K-line spectroheliograms since 1915. From that data they have calculated a monthly Ca II K-index which is a very good proxy for the modern sunspot number and for F10.7. We have analyzed Luca’s data and they show the same jump in 1945, so there is now little doubt that the sunspot record must be revised. We are writing a joint Letter to Astrophysical Journal on this result. It is becoming clear that there really has not been a progressive change in solar activity the past 300 years. The solar maxima in 1778 and 1787 were likely higher than in 1957, consistent with the 14C production rate at that time: http://www.leif.org/research/14C.png

January 12, 2009 9:32 pm

Martin Lewitt (19:46:17) :
When you compare cycle 23 to 13 and 22 to 11 are you considering the isotopic proxies or just the sunspot data, what is your reasoning?
I compare the sunspot numbers [and not just the proxies that are harder to calibrate]. Some of the evidence can be found here:
http://www.leif.org/research/AGU%20Spring%202007%20SH54B-02.pdf
http://www.leif.org/research/De%20maculis%20in%20Sole%20observatis.pdf
and most recently here:
http://www.leif.org/research/Napa%20Solar%20Cycle%2024.pdf
at this meeting Luca Bertello from Mount Wilson Observatory told me after my talk that they have just finished digitizing all the Ca II K-line spectroheliograms since 1915. From that data they have calculated a monthly Ca II K-index which is a very good proxy for the modern sunspot number and for F10.7. We have analyzed Luca’s data and they show the same jump in 1945, so there is now little doubt that the sunspot record must be revised. We are writing a joint Letter to Astrophysical Journal on this result. It is becoming clear that there really has not been a progressive change in solar activity the past 300 years. The solar maxima in 1778 and 1787 were likely higher than in 1957, consistent with the 14C production rate at that time: http://www.leif.org/research/14C.png

crosspatch
January 12, 2009 11:00 pm

Roger Sowell:
I think you brought up a good point but what I am attempting to do here is carry it forward to what would happen if it were successful.

I respectfully disagree, and here is why. Firstly, it is not necessary for the Jatropha trees to infringe on food crop land, when they can replace other trees that have no obvious positive qualities.

That is fine but what is going to force people to only plant them in such circumstances? If there is money to be made, good money growing fuel, people are going to plant these things all over the place. American farming is done on an industrial scale. We don’t have peasants with a few acres that are willing to grow something that might get them a few dollars a year. We would grow those things in rows with automated harvesters. If you look at the natural habitat of those trees, they seem to grow pretty well in marginal soil. In marginal soil they produce one crop of nuts. In better soil they will grow multiple crops of nuts per year. Guess what that farmer is going to do? And when he is done, that land isn’t going to look anything like it was when it started.
My point is that nothing is without consequences. Yes, we can probably grow a lot of these trees on scrubland that is now grazing cattle. But where are the cattle going to be grazed? There is very little private land that us unused for something and to put something new into production, something else will have to be moved out of the way and if the new thing makes more money than, say, hay or corn, people are going to stop planting hay and corn and plant fuel. People are going to want to plant a crop that makes them more money.

I also do not agree that the desert is fragile and must be protected.

This is where emotion comes into the equation for me. I do a fair bit of desert camping and have relatives that live in the desert where I travel often. I love Nevada and Utah and Arizona and New Mexico and Southern California. Joshua trees make me smile. They feel like old friends. The spring carpet of flowers, watching a single thunderstorm move across the land. To see all that ruined with row upon row of these things worries me. Do you realize how much those things will shade the ground? Sagebrush and creosote bush might be “useless” to you but I wouldn’t want to see them destroyed. In fact, I would rather see the dams out west pulled down and replace them with nuclear power, too. Putting that much shade on the ground would kill the native life and you would end up with grass and all sorts of other stuff growing out there. You would completely change the ecosystem. For what? For the amount of energy a couple of nuclear plants could produce and power electric trains and cars instead? I’ll take the nukes.
Look at it like this: More oil naturally seeps naturally into the Pacific off of Coal Oil Point in California in one year than leaked from all offshore drilling activity in North America over the entire decade of the 1990’s. Before we drilled off the coast of California, the beaches in Santa Barbara were polluted with naturally seeping oil. The beaches were covered with tar. I have a friend who is 90 years old who lived there then. Offshore drilling is the best thing to happen to that environment.
Drilling a hole in the ground and pulling out oil for several years has much less environmental impact that growing biofuels. With today’s drilling technology, you can drill several wells in several different location from one spot. You no longer need a field of rigs.
If there is big money to be made growing fuel, people will do it and they will do it on a major scale and I am afraid that the net result would be destruction of habitat, more deforestation, and changes in land utilization that ultimately result in lower food production if the fuel crop brings more cash than a food crop.
I don’t see biofuels as being particularly necessary or environmentally friendly.

crosspatch
January 12, 2009 11:13 pm

Another way to look at the problem:
How many of those nuts would it take to produce in one year the amount of energy produced by one nuke plant? How many trees would that take? How much land area would it take to grow that many trees? What is the footprint of one nuke plant?
How many of those nuts would it take to produce in one year the amount of energy produced by the average oil well ( I know, varies greatly). How much land area to produce that? How much land area does one well take up? There is one in the middle of Oklahoma City airport between runways (or was) that takes up about the same amount of space as two or three parking places.
And why exactly do you want biofuel? For what purpose do we need it? To reduce CO2? For what reason? And we couldn’t possibly grow enough of those trees to be a reasonable replacement for oil on anything more than a thimble full in an ocean. Do you know how much oil we consume in a day? 20,680,000 barrels per day in 2007. How many square miles of these trees would it take to put a measurable dent in 20+ million barrels *each day*?
We are talking enormous costs for little gain.

Ron de Haan
January 12, 2009 11:38 pm

Burch Seymour (06:23:34) :
” What is not so widely discussed is that southern hemisphere sea ice has been increasing, ”
“I was cleaning up in the basement and happened into an old issue of Popular Science mag – February 1997. The cover shows a Zodiac motoring past a large ice-something (berg, glacier) and the cover story.. “Antarctic Meltdown? Controversial New Evidence for a Changing Climate.”
Burch,
This only proof over what extend of time humanity is enduring AGW Propaganda.
I am afraid you have been seriously “brainwashed”.
Here is some therapy:
1. A picture of a Zodiac motoring past a large Ice Berg is no proof of a melting icecap.
2. Global Warming does not exist.
3. There has been NO raise in temperature on the SH
4. Antarctica Ice Mass has been growing during the warming (0.6 degree Celsius over a period of 22 years) on the NH. The same goes for the icecap of Greenland.
5. All reports on disappearing ice caps and drowning Polar Bears are plain HOG WASH
6. You can find all sound scientific arguments in the archive of this web site and http://www.icecap.us
Start reading and heal yourself.
You can do it.
Disclaimer:
Reading Popular Magazines without verifying the claims made in regard to climate, CO2 and AGW is “dangerous” since 1980.

January 13, 2009 1:26 am

Leif Svalgaard (21:32:58) :
The solar maxima in 1778 and 1787 were likely higher than in 1957, consistent with the 14C production rate at that time
If we look at the past 300 yrs it has been one of the highest in regard to angular momentum in maybe the last 7000 yrs. In my research I noticed with increased angular momentum you can get two outcomes.
1. Greater chance of grand minima and longer grand minima.
2. Stronger solar cycle strength, there have been no high performers during low angular momentum.
The angular momentum was lower in 1780-90 than 1950-60, so this one will be interesting to watch.
http://landscheidt.auditblogs.com/files/2008/12/ultimate_graph2all.jpg

John
January 13, 2009 5:36 am

Leif Svalgaard (08:25:58) :
Leif, with regard to your response to my comment:
The satellite records for the past 3 decades show a trend of about 1.3 to 1.5 degrees C per century. (comment)
or 13-15 degrees C per millennium. It is not advisable to extrapolate outside the length of the record, if you don’t know what causes the trend. (response)
I take it that your point is that you wouldn’t extrapolate the current trend for 3 decades (or for the last 100 years) because future conditions will be different. Therefore, your implicit position may be that the climate models give us the best tools, imperfect though they are, to have a sense of what future temperatures will be.
My point, though, going back to my first post, was that the current temperature trends contain the data we need to properly calibrate the model. In other words, rather than taking climate models with their uncertainties and wide ranges as the word of God, we need to see if we can fit the different climate influences to the reality of the data before us.
How much of the warming to date, combining all the information we have on GHGs, sulfates, black carbon, El Nino trends, and solar trends, is attributable to each? That is why I took the rate of warming today, and asked that we calibrate our models to that rate — not because I believe we can extrapolate today’s trend linearly.
Your thoughts?

January 13, 2009 5:39 am

nobwainer (Geoff Sharp) (01:26:46) :
http://landscheidt.auditblogs.com/files/2008/12/ultim
just shows that there is no correlation at all. It stands as the clearest observational refutation of the angular momentum idea.

January 13, 2009 5:56 am

crosspatch:
I disagree with almost everything you wrote. Insufficient time now to go into details, but just a couple of thoughts: please explain how electric power from a nuke will provide energy for long-haul trucks, cross-country trains, and airplanes.
Another basis for disagreement: if everyone throughout history held your position of “no changes – I like it the way it is NOW” then where would we be? Where would the farms be, and how would we grow food? Where would houses be, or would we all live in trees? Where would the refineries and factories be, that provide virtually everything we have and use, from clothes to cars to gasoline to medicine and laptops?
Los Angeles, Las Vegas, Phoenix, Tucson, Salt Lake City, and many more were just desert once, too. Somehow the world survived their transformation into cities.
Roger E. Sowell
Marina del Rey, California

January 13, 2009 6:25 am

John (05:36:08) :
I take it that your point is that you wouldn’t extrapolate the current trend for 3 decades (or for the last 100 years) because future conditions will be different. Therefore, your implicit position may be that the climate models give us the best tools, imperfect though they are, to have a sense of what future temperatures will be.
No, I did not imply that the models give us the best tools. They may be completely worthless. The way forward is to see how well the models predict what is going on. e.g. run the models with data up to year N, predict the situation for N+1, 2, 3, … and compare. I understand from anecdotal evidence that the result is not what the models predict,
How much of the warming to date, combining all the information we have on GHGs, sulfates, black carbon, El Nino trends, and solar trends, is attributable to each?
Lean and Rind has answered that question [using what they consider to be the best data available – one could quibble with that but show me better data]. Here is their result: http://www.leif.org/research/LeanRindCauses.pdf
One criticism of their analysis might be that the PDO is not included, but the other factors seem to be covered reasonably well [perhaps with a too large solar forcing – using the Wang et a. 2005 TSI].

January 13, 2009 6:31 am

John (05:36:08) :
asked that we calibrate our models to that rate
As I understand it, the models are not calibrated, but are claimed to be based on physics: you put in the equations and the initial data, then calculate what happens. To my knowledge, the observed trend over time is not fed back into the model for calibration or adjustment.

Martin Lewitt
January 13, 2009 6:43 am

Leif,
Thanx, it looks like you are resolving some of the “poorly understood” solar variation that needed to be explained. Your argument for less attribution of the recent warming to solar assumes that the decrease in the earths geomagnetic dipole field does not have significant impact on the coupling of solar variation to the climate. Absent evidence and a mechanism, that is a reasonable assumption.
But your period of comparison after removing the trend, also influences your conclusion of no secular trend in solar activity incease over the last 165 years. First though, consider that removal of the trend increases the possible significance for solar vis’a’vis aerosol attribution of cycle 20. If one considers cycle 20 a cooling event and draws a horizonal line someplace through it on your 14C graph, most solar activity back to 1500 falls significantly below it, and one might conclude that there actually were secular trends if one started at cycles 12 or 14, or 1810, 1700 or 1500. If we consider the intregrals even with the more active periods you have reconstructed, the recent solar activity is encountering an ocean far cooler than the equilibrium for this level of activity. In a sense the maunder minimum had a significant impact on the ocean state, resulting in a long tail. Earlier warm periods still argue that we are too dismissive of forcings other than greenhouse gasses. I am assuming you are accepting of the climate commitment work of Meehl, et al, and Wigley, et al.

January 13, 2009 7:10 am

Leif Svalgaard (05:39:53) :
just shows that there is no correlation at all. It stands as the clearest observational refutation of the angular momentum idea.
Or perhaps that you dont understand the graph.
Perhaps you could tell me your understanding along with where you think it falls down?

crosspatch
January 13, 2009 8:51 am

“To my knowledge, the observed trend over time is not fed back into the model for calibration or adjustment.”
And that disconnect between the models and the reality is puzzling to me. And why someone would cling so tenaciously to the model output as the difference between the models and the observations widens over time is even more puzzling. And when certain observations are “adjusted” in a way that seems to make that disparity disappear and the most divergent stations (rural) removed wholesale from the observation data, it gives the appearance of being downright crooked.

January 13, 2009 9:27 am

Martin Lewitt (06:43:58) :
assumes that the decrease in the earths geomagnetic dipole field does not have significant impact on the coupling of solar variation to the climate. Absent evidence and a mechanism, that is a reasonable assumption.
There are two different aspects:
1) did the Sun vary
2) did the Earth vary
The evidence is that the Sun didn’t, and we know that the Earth did. There will be people that assume that the latter has a climate connection, e.g. http://www.physorg.com/news151003157.html
Earlier warm periods still argue that we are too dismissive of forcings other than greenhouse gases.
It is clear that climate varies without greenhouse gas forcings. It is not clear that this variation is solar related, because the solar variations are too small to have significant impact. This does not stop people from saying, “hey, yesterday there were no sunspots and lo and behold it snowed in London”.

January 13, 2009 9:30 am

nobwainer (Geoff Sharp) (07:10:53) :
“just shows that there is no correlation at all. It stands as the clearest observational refutation of the angular momentum idea.”
Or perhaps that you dont understand the graph.

To make the graph more understandable, plot the data in an X-Y scatter plot, with X being, say, Rmax and Y being Angular momentum.

crosspatch
January 13, 2009 9:33 am

“I disagree with almost everything you wrote.”
No problem, I enjoy discussions more when there is actually a little dialog than a big “amen” session 🙂 I won’t get angry and call you rude names or anything. Maybe someday we can discuss it over wine and cheese.
“Insufficient time now to go into details, but just a couple of thoughts: please explain how electric power from a nuke will provide energy for long-haul trucks, cross-country trains, and airplanes.”
I am glad you raised that point. Let me take the easy one first. Our incoming President wants to build large infrastructure projects to get the country moving economically and put people to work. If I might be so bold to make a suggestion, an intercontinental high speed electric rail system rivaling the Interstate highway system and powered by nuclear energy would be a great asset to the country. The system should be designed, like the Interstate system, with no at-grade crossings and limited interconnection. It should be designed for long haul, high speed use. Freight and passenger transport costs would not be tied to the cost of oil. If the oil got cut off for some reason, we could still move freight and people coast to coast. The system should be initially designed for 100MPH travel with an eventual goal of 200MPH when fully completed.
Our railroad system is backwards. The rail companies own the road and in many cases the people own the rolling stock. It should be the other way around like the highway system. The people should own the line of communication with private rolling stock. What if UPS had to build all of their own private roads to deliver packages and what if they let others use them but gave their own trucks priority on those roads? What if everyone always had to pull over and let a UPS truck by. Would we have a FedEx? FedEx would have to build their own roads, and that gets really inefficient. While I am not calling for nationalizing the railroad lines, I am calling for building a new set of fast routes owned by the people that all the companies could use just as all companies can ship goods on the highways, all shipping lines can use ports and all airlines can use airports and the air traffic corridors. The reason the railroads are in such bad shape is that we have the still in a 19th century economic model. If the railroads were free from road maintenance, they could concentrate on rolling stock. New companies could get in the business, more competition and lower costs would bring prices down to move freight. At certain points on these lines would be large freight and passenger transfer stations where containers could be loaded off/on trucks or ships on/off trains.
Along this rail grid would also be a necessary power distribution grid. You could allow various jurisdictions along the route to connect to this grid. They could buy power when they need it or supply power when they have a surplus. The engineering of high speed rail through rugged territory would require the building of world class tunnels and bridges. All of it would operate on nuclear energy with recycled fuel. Locomotives are electric anyway. They simply use a diesel or turbine to drive a power plant that produces electricity for the traction motors. It is a simply matter to build a system that takes the electricity directly from a third rail, for example or even inductively couple it.
Planes might someday be able to operate on hydrogen which could be generated with excess power from nuclear plants. But overall, planes are probably dinosaurs as oil becomes more scarce unless we change the fuel anyway. And we aren’t going to grow enough “biofuel” to power airliners and still eat at the same time. that 20 million barrels was only for the US. World consumption is something closer to 45 million barrels every day. Now we are talking close to 2 billion gallons of oil every day.
Long haul trucks will probably remain fuel based but if we had a national rail system, you might see more freight operators switching to using rail for long haul transport and use trucks only for shorter runs from the cargo ports to the final destination greatly cutting the consumption of fuel. With a system I have described, UPS could get their own locomotives and rolling stock without having to build and maintain the road, just like they currently do with trucks and planes.
“if everyone throughout history held your position of “no changes – I like it the way it is NOW”
Apparently I didn’t make myself understood and that is my fault. I am not against change at all. I am against that particular kind of change because I see it as having an enormous cost with no real benefit. The kinds of biofuels that I think are feasible are things like the algae-based research. This would be grown in tanks, can operate 24×7, don’t rely on weather based fruit production and the output isn’t seasonal. It would provide a steady supply of fuel day in and day out without a huge footprint of land to support it, without a huge requirement for machinery, labor, processing, etc. The plants basically produce crude oil that can be refined using our existing infrastructure. That is a biofuel technology I can fully support. I can not support something that would potentially take thousands of square miles to produce oil that is susceptible to fire, blight, frost, nematode infestation, variable production quantity/quality, etc.
We are going to need to preserve the land for food production. I can grow tomatoes around an oil rig, I can graze cattle in an oil field. I can’t graze cattle in a field of these trees. And what happens when the local animals try to eat a fallen nut from those trees and are poisoned but have nothing else to eat because the natural vegetation is now “weeds” and is destroyed? It just doesn’t seem to be environmentally friendly on an industrial scale.
I support the idea of renewable sources where they make sense. I don’t support the notion of renewable just for the sake of renewable at the cost of destruction of habitat by other means. How much energy will it take to fertilize, irrigate, harvest, and process that crop? Current crop biofuels are a net loss. They take more energy to produce than they provide causing an increase in fossil fuel consumption for every gallon of them that you burn. You would have a smaller fossil fuel footprint by simply burning gasoline.

Martin Lewitt
January 13, 2009 10:02 am

Leif,
I don’t dismiss the AGW hypthesis, it is plausible, but nearly all the observational climate sensitivity evidence is based upon solar or aerosols and is assumed to apply to GHGs. In a nonlinear system where these are coupled in different ways, I don’t think equal sensitivities is entitled to be the null hypothesis.
The case for AGW might be stronger if the all the AR4 models did not have correlated positive surface albedo biases that globally and annually averaged to over 3W/m^2 (Andreas Roesch), if the models were not 30 years behind the climate in the Arctic melting (Scambos) and if all the models didn’t fail to reproduce the amplitude of signature of the solar cycle found in the observations (Camp and Tung, plus a later paper that I can’t recall at the moment). Evidently models “matching” the climate incorrectly and “matching” each other to within a factor of two, and having documented correlated biases against solar forcing is considered good enough to achieve “very likely” (90%) confidence. This ignores the precipitation and cloud issues that probably dwarf these other errors. I understand that most were arguing for more than 90%, and that 90% was a compromise.
I think the models are remarkable achievements, but need another decade or more of development (3 to 4 year development cycles, bad but not nuclear fusion at least) . Our best hope for resolving attribution earlier is an extreme solar cycle in this modern instrument era.

TJ
January 13, 2009 10:53 am

“because the solar variations are too small to have significant impact. ” -Leif
Why? Because the climate models say so and the climate models think of everything. There is no possible way that they are wrong, and you guys are just going to have to get used to the idea that the computer models know way more than you do and nothing that they “know” is wrong. Every time observation disagrees with them, it is solely due to chance.

January 13, 2009 11:10 am

Martin Lewitt (10:02:43) :
nearly all the observational climate sensitivity evidence is based upon solar or aerosols and is assumed to apply to GHGs.
I don’t think the climate sensitivity are in the models at all. To my knowledge, the models integrate the equations [the ‘physics’] with a time step on the order of minutes [which is why they require supercomputers], so the sensitivity should come out of the model result rather than being put in. The main reason for the models not reproducing the solar cycle [and also the main reason the climate doesn’t] is that the cycle changes are completely drowned out by the daily, seasonal, and orbital changes. This http://www.leif.org/research/Erl76.png shows the variation through the year of the TSI for the past solar cycle. There are 12 curves [one for each year]. They all fall on top of each other except for the vary small wiggles you see occasionally. The maximum is near January 4th and the minimum near July 4th. The solar cycle variation of 1 W/m2 should be compared to the 90 W/m2 annual cycle. The models do have this variation of TSI built in. An interesting question is: what would happen to the model output if one changed the annual cycle? E.g. by a factor of two [or more]. I have posed this question to some of the modelers, but they have not reacted to it [one answer I got: “we are too busy”].

January 13, 2009 11:29 am

Leif Svalgaard (11:10:20) :
The models do have this variation of TSI built in.
I want to elaborate on this a bit. The models are constructed to include all the physics we know about and judge to be relevant [admittedly, some are ‘parameterized’ because we cannot calculate the ‘microphysics’ well enough, e.g cloud formation]. The radiative input is taken from [actual or average] the solar irradiance correctly modulated by distance [90 W/m2] and solar activity [1 W/m2], so should be treated correctly [no parameterization needed]. The sensitivity of the calculated climate to these variations is thus something that can be calculated from [almost] first principles and do not depend on our having derived it empirically. A crucial test [as I alluded to] would be to vary the radiative input. Crank up the solar cycle by a factor of ten and see how the modeled climate reacts. This has not been done [AFAIK]. I don’t know why not. It should be easy to do.

January 13, 2009 11:47 am

TJ (10:53:03) :
“because the solar variations are too small to have significant impact. ”
Why? Because the climate models say so and the climate models think of everything.

No, the models do not say so. See my latest posts on this. We can put the models to the test on this. The reason for my statement is that the changes in the energy involved are too small. Imagine that we moved the Sun further away but kept the overall TSI not due to solar activity [e.g. TSI at solar minimum] the same [in a thought experiment we can do anything]. We keep the output [at the Sun] due to solar activity the same as it is. By this device we can make the influence of solar activity on the overall solar output as small as we want [we can also make it bigger by moving the Sun closer]. At some point, it is clear that the impact of the ever decreasing solar activity fraction becomes negligible. So, it is all about the energy of the solar activity fraction compared to the whole. One can estimate the effect of the observed fraction if one has an appropriate physical mechanism. Such estimates fall short compared to the actual variability of the climate. Now, one could postulate or speculate that unknown or poorly known mechanisms amplify the effects, but that is not science, that is speculation. Sometimes speculation is useful and sometimes is even proven correct, but the [usual remote] possibility of this is not enough cause us to embrace every speculation and act upon it.

crosspatch
January 13, 2009 11:47 am

“A crucial test [as I alluded to] would be to vary the radiative input. Crank up the solar cycle by a factor of ten and see how the modeled climate reacts. This has not been done [AFAIK]. I don’t know why not. It should be easy to do.”
Don’t most models have a variable for particulates/aerosols? Could that be used as a proxy for solar changes? Might increasing the “aerosols” in the model result in an impact similar to a reduction of solar output?

Martin Lewitt
January 13, 2009 11:53 am

Leif,
I believe the climate simulations use only 4 to 6 time steps a day, and parameterize their surface interactions using “white sky” albedos. They aren’t all “high top” (stratsphere) models yet, and some still apply solar forcing smoothed of all cycles. I don’t think just solar insolation will be responsible for the coupling. The 5 to 7% variation in the UV over the course of the cycle has significant impact on stratosphere chemistry, especially producing ozone which is a greenhouse gas. The models underrepresent the precipitation increase observed in the recent warming by a factor of three. The models usually spin up their oceans to the years somewhere between 1850 and 1880 and then assume them to be in equilibrium then. Of course, there may already be an energy imbalance since the actual oceans were spun down so long by the maunder minimum.
So models that have documented biases against solar, maybe 4 times larger than the 0.8W/m^2 energy imbalance (Hansen’s figure for 1998) that they are supposed to attribute, are being tuned and parameterized to match the recent warming. They are matching the missing energy somehow, perhaps with increased sensitivity to GHGs, given that they are increasing and solar isn’t during the recent warming. Their projections are even worse, as in out decades they will catch up with the earlier temperate zone snow melt (in the observations) and with the arctic melting, adding the missing energy what every warming trend they were following anyway. That probably explains the mid-21st century temperature excursions in the projections.
The “physics equations” solved in the models will be the fluid flow and mass balance equations. All the other physics from radiative transfer, to albedo to clouds and precipitation to sea ice and snow melt, etc. are parameterized.

January 13, 2009 12:27 pm

Martin Lewitt (11:53:37) :
I believe the climate simulations use only 4 to 6 time steps a day,
We will have to disagree on this. I know [having directly asked Gavin Schmidt] that the time step is of the order of minutes. The models have a much higher degree of sophistication than your post admits. A good introduction to the subject is Jacobson’s ‘Fundamentals of Climate modeling’ Cambridge Univ. Press, 2nd ed., 2005. As a small example I quote from page 262 [about how to calculate the temperature and moisture in vegetated soil]: “T is found by solving iteratively a foliage energy balance equation that considers a net solar flux at the top of the foliage, a net thermal-IR flux at the top of the foliage and at ground level, and sensible and latent heat fluxes of the top of the foliage and at ground level”.
There are, of course, several models in existence with various resolution in time and space. Some models are deliberately simplified to see if they can capture the essential features. Clearly, models have made great strides and will continue to do so, as they have a long way to go. One should not consider them as ‘oracles’ in any way.

January 13, 2009 12:45 pm

crosspatch (11:47:32) :
Don’t most models have a variable for particulates/aerosols? Could that be used as a proxy for solar changes?
The models use the ‘actual’ solar changes, not proxies. For the future, predicted solar changes or ‘scenarios’ can be used.
There is not just ‘one’ variable for aerosols. Variables that are considered include sea spray [the most common aerosol BTW], soil dust, pollen, spores, volcanic outgassing, natural biomass fires and anthropogenic sources such as fossil-fuel combustion and wind uplift of soil over eroded land. Many of these sources are not precisely known and are often parameterized and are hard to predict, but does depend on the model result e.g. on moisture. But again, scenarios can be made, e.g. for the effect of volcanoes.
What I’m trying to say is that the best models are very sophisticated. They still don’t do well enough to be trustworthy, but progress is being made. There is also a difference between weather models and climate models. In the latter, some suppression of weather effects occur.

January 13, 2009 12:57 pm

Leif Svalgaard (12:27:23) :
M. Jacobson’s ‘Fundamentals of Atmospheric Modeling’, 2nd ed. 2005. Typo.

Martin Lewitt
January 13, 2009 1:40 pm

Leif,
You’re right, it looks like AR4 timesteps are in the 15/day to 15 and 30 minutes. My bad.

January 13, 2009 1:53 pm

Martin Lewitt (13:40:15) :
You’re right, it looks like AR4 timesteps are in the 15/day to 15 and 30 minutes. My bad.
Models improve all the time. Still a long way to go, though. And I really think they should try to vary the solar input and make a plot that shows how much warming/cooling as a function of solar variability they predict. Why they don’t is a puzzle.

DennisA
January 13, 2009 2:08 pm

“Polar sea ice changes are having a net cooling effect on the climate” – A current look at the ice coverage shows extensive sea ice all across the Arctic and all the way down to the south of Greenland, (the southern tip is outside the Arctic Circle, compare with this map of the Arctic here: http://www.athropolis.com/map2.htm)
http://arctic.atmos.uiuc.edu/cryosphere/NEWIMAGES/arctic.seaice.some.000.png
On the western side of Greenland the North West Passage is totally solid.
Svalbard is currently ice bound on three sides and Franz Josef Land is totally ice bound, also shown in these current ice charts:
http://iup.physik.uni-bremen.de:8084/amsr/Svalbard_nic.png
http://retro.met.no/images/image_000128_1231858879.jpg
http://retro.met.no/images/image_000130_1231858918.jpg
I was wondering what sort of temperatures we would have to realise in order to melt this lot in the next five years?
http://www.yr.no/place/Norway/Svalbard/
Resolute- minus 34C
Churchill – minus 30C
Barrow – minus 25C
Pevek,
Russia – minus 45C

crosspatch
January 13, 2009 2:31 pm

“scenarios can be made, e.g. for the effect of volcanoes.”
Forgive me for my ignorance but I am wondering about difference in magnitude of solar radiation reaching the surface between something like a Pinatubo event vs the change in TSI between now and, say, 1980.
I hear that changes in solar radiation aren’t much and shouldn’t have much impact. Just out of pure curiosity, I am wondering how these variations in solar radiation compare to changes caused by volcanic events, or maybe even power plant emissions. I seem to remember a while back some model or another said one source of warming might be due to increased transparency of the atmosphere due to improved emission control of power plants and reduction of other pollutants.
And I am not asking anyone to get that information for me, simply pointing me in a direction where I can dig it out myself would be fine.

Gary H
January 13, 2009 5:02 pm

“Ice has a relatively high albedo (reflectance) so a reduction in polar ice area has the effect of causing more shortwave radiation (sunlight) to be absorbed by the oceans, warming the water. Likewise, an increase in polar sea ice area causes more sunlight to be reflected, decreasing the warming of the ocean. ”
Ah, but would not the immediate effect of one exceptionally cold year of new ice re-formation and extended snow cover (Canada was 100% covered for X-mas day) result in a complete immediate cancellation of the existing year over year increasing effects of open water that we had experienced. In other words, in the Arctic – where the effect has had the opportunity to continue to feed upon itself year after year, here – could not this come to an abrubt end; therefore, the cooling effect from this one part of the puzzle can set in almost immediatley. It leads then – ice cools faster than water warms.

January 13, 2009 5:32 pm

Leif Svalgaard (09:30:26) :
To make the graph more understandable, plot the data in an X-Y scatter plot, with X being, say, Rmax and Y being Angular momentum.
If you understood the theory you would know that you cant use an X-Y scatter plot.

John
January 13, 2009 7:17 pm

To Leif Svalgaard (06:25:22)
Leif, thanks for bringing up the Lean et al study — this is beginning to be the kind of calibration I had in mind.
With regard to their data inputs, you suggest the possibility of a quibble, and indeed there is a reasonable quibble to be made, namely that they fail to use decreasing sulfate levels post 1990. In contrast, Streets, DG et al (GRL, 2006, “Two-decadal aerosol trends as a likely explanation of the global dimming/brightening transition”) show a marked decrease in total global aerosol optical depth post 1989, driven primarily by reductions in sulfate, first in the FSU and Eastern Europe, then to a lesser extent in the US and Western Europe. The increases in Asia are not great enough to cancel these decreases. Other studies make similar findings. See Fig. 3 in Streets et al.
Additionally, I don’t see that Lean et al include the effects of black carbon on Arctic sea ice and glaciers; few studies do. Those that do include this effect find the effect is large: Mark Jacobsen (Stanford) published a paper on the subject in 2004, and among several other recent papers, there is also Flanner, MG et al (JGR, 2007, “Present-day climate forcing and response from black carbon in snow”). Scientific American wrote the following article about the results of Flanner et al:
http://www.sciam.com/article.cfm?id=impure-as-the-driven-snow
To the extent that Lean et al failed to recognize that sulfate was declining post 1990, and didn’t include black carbon effects on Arctic sea ice, warming in recent decades then gets attributed in their regressions to something else. That something else is largely GHGs. If they had included proper recognition of these two non-GHG forcings, their modeled GHG forcing would have been lower.
I agree with your point about the PDO.

January 13, 2009 7:56 pm

nobwainer (Geoff Sharp) (17:32:05) :
If you understood the theory you would know that you cant use an X-Y scatter plot.
Nonsense, you can always make a scatter plot. If need be you can make the symbols for the data points of different color or shape. For example, you can make the points that don’t fit a different color [red], and then explain why all the red points are out of whack. If your only support is eye-balling, you’ll have a hard time convincing anybody.

Pierre Gosselin
January 14, 2009 3:09 am

M Sowell
“I disagree, as I know that it is happening, with men of sound judgement and prudent investing standards.”
When one looks at the extravagant subsidies offered for renewable energy sources by governments, you’d have to be a FOOL not to invest! Guaranteed profits and success! Full protection from competition…compliments of the US government! All paid for by the duped taxpayers.
And for what?
To save the planet from global warming, when in fact it is cooling. Sorry, but is just doesn’t get more folly than that.
Renewalbes are competitive only when massively subsidised. Without the huge massive subsidies, the renewable industry collapses in an instant.

Alan Chappell
January 14, 2009 4:35 am

Rodger E Sowell
re your “the Engineers are on it”
Having lived in Italy for more than 25 years and being an engineer I have yet to see a windmill in Italy, I hope that the trend continues, Italy has for decades been using excess energy to pump water into man-made lakes as high as possible in the mountains, when a demand for more energy is called for the water in the lakes is released into pipes which in turn drive turbines at the lowest point possible, the water is then collected in another lake to await an energy excess to be pumped back up to the high lake, all that water makes for good fishing, water sport, camping, natural beauty as the man said, wind turbines are a bottomless pit, we had trouble at work with a new model truck, the EU licensing authority said that it had to much drive-by noise, I asked one of the inspectors if he had stood 500 meters away from a wind turbine?

January 14, 2009 5:00 am

Leif Svalgaard (19:56:11) :
Nonsense, you can always make a scatter plot. If need be you can make the symbols for the data points of different color or shape. For example, you can make the points that don’t fit a different color [red], and then explain why all the red points are out of whack. If your only support is eye-balling, you’ll have a hard time convincing anybody.
A scatter plot is a waste of time, its a weak attempt at changing the subject. I am still waiting for an answer to my original question:
“Or perhaps that you dont understand the graph.
Perhaps you could tell me your understanding along with where you think it falls down?”

Phil.
January 14, 2009 7:42 am

DennisA (14:08:44) :
I was wondering what sort of temperatures we would have to realise in order to melt this lot in the next five years?

In a normal summer about 75-80% of that lot will be gone by september.

January 14, 2009 9:01 am

nobwainer (Geoff Sharp) (05:00:56) :
A scatter plot is a waste of time, its a weak attempt at changing the subject. I am still waiting for an answer to my original question:
“Or perhaps that you dont understand the graph.”

I think you have wasted more time trying to avoid such a plot than it takes to make one. And I can answer: “I don’t understand the graph, because you have not discussed it”. What I see by just looking is that there is no correlation.

crosspatch
January 14, 2009 10:45 am

“I disagree, as I know that it is happening, with men of sound judgement and prudent investing standards.”
If ADM thought they could make money processing that bean, they would already have the processing plants under construction and farmers would be clamoring for seed. Farming is a business.
It will be what it is. If it is cost efficient to produce it, it will be produced.

Burch Seymour
January 14, 2009 10:58 am

Ron de Haan (23:38:46) :
“Start reading and heal yourself.”
Hi Ron,
I read this site every day. You missed my point, or perhaps I was too terse. I was simply pointing out that the prediction made in the 1997 article did not come to pass. That’s why I quoted the line stating that souther hemisphere ice has been increasing, not decreasing. I’m old enough to remember when the consensus was a new ice age and millions of starving people etc etc.
-Burch

January 14, 2009 11:41 am

Pierre Gosselin (03:09:03) : re the subsidy argument.
Some perspective on subsidies:
No doubt, there are some subsidies. Many, many, industries have subsidies. AKA tax breaks. Farming, to name just one. Nuclear power plants get massive subsidies. Chrysler was bailed out a few years ago. Now many companies on Wall Street got massive subsidies — or is it bail out money? Yet some companies were allowed to fail…the Fed playing favorites?
As a matter of fact, the California tax credits (subsidies) for many renewables expired in 2008 – but there is a carryover provision for some of them.
Currently, California has 26 different tax credit categories for individual tax payers. There are also 24 tax credit categories repealed this year. Very few of them are in renewable energy.
Countering the state’s elimination of tax credits, there are more Federal tax credits thanks to Congress and President Bush.
Perhaps you are not in favor of a patent or the patent system, either? That gives the inventor the exclusive right to make and sell his invention for 20 years! Not very competitive, is it? Copyrights also give authors exclusive rights for much longer than a patent! The copyright exists for life of the author plus 70 years! Not very competitive, is it? (there is also a form of copyright that lasts for 95 years, another for 120 years). Trademarks can last virtually forever…not very competitive, is it?
And I do not believe it (tax credit) is at all motivated by saving the planet from global warming. More likely economic, as in trying to reduce dependency on foreign oil. And btw, we do not send $700 billion annually overseas to unfriendly nations to purchase oil. Nowhere near that.
Now, where the true save-the-planet thinking occurs is in California, with their AB 32 Climate Warming Solutions Act of 2006, as I have commented on before in WUWT.
The governments have frequently dabbled in incentives, tax credits, subsidies, tax breaks, and giveaways of many forms. Welfare is one. Food stamps another. College funding is another. Some say the trucking industry was unfairly subsidized when the government built the interstate highways, to the disfavor of the railroads. Others say nope, the railroads were given land grants to build their tracks, so it works to balance out.
Subsidies are nothing new. Why should anyone be unhappy with those particular subsidies for renewables, but not the others?
Roger E. Sowell
Marina del Rey, California

January 14, 2009 11:57 am

Alan Chappell — re wind power
From World Wind Energy Association:
“By the end of the year 2008, 120 Gigawatt of wind power capacity were installed worldwide, after 94 Gigawatt by the end of 2007. Already today wind provides more than 1,5 % of the global electricity consumption and the wind industry employs half a million people. Currently, 80 countries are using wind energy on a commercial basis, with the main shares in Germany, USA, Spain, China and India which still account for three quarters of the global wind installations.”
I cannot comment on what Italy is doing and why. I worked there off and on on consulting assignments, from Milan down to Taranto and in Sicily. But from the above statement, and I have not confirmed its accuracy, 80 countries are in the wind-power game. Perhaps Italy has insufficient wind resources? Perhaps Italy has adequate base-load power and pumped-hydro resources? The geography of Italy is likely unique, with a mountain range running down the middle of the entire country, and the Alps across the northern portion.
My “engineers are on it” statement refers to the energy storage problem.
Roger E. Sowell
Marina del Rey, California

Will
January 14, 2009 12:09 pm

The percentage breakdown for the energy balance has to be highly variable depending on the season. For more than 6 months there is no incoming radiation and outgoing IR continues at a constant rate until ice capped. (The graphic appears to apply only to an open water scenario). After September there will be a lot of heat off open water sent off to the outer planets never to return. So, on balance, which has the more negative energy input, sea ice albedo or outgoing IR?
Can anyone suggest where I can get the plot points for ’79-’00 (ant)arctic ice extent averages?

crosspatch
January 14, 2009 1:41 pm

“By the end of the year 2008, 120 Gigawatt of wind power capacity were installed worldwide,”
Beware of these “capacity” figures as wind capacities were found to be overstated by more than 2x from reality recently in the UK. The figures being presented as generating potential from the turbines are fantasy. Lets see how much power was actually generated from them for the year, not what their potential “capacity” is. I believe you will find actual generation was much below their “capacity” to generate.

crosspatch
January 14, 2009 2:02 pm

They all seem to be proud of their “capacity” numbers but has anyone seen any actual generation figures? Every single article and paper I have seen shows nothing but theoretical capacity numbers. I haven’t seen anything that shows actual generation numbers. Believe me, every utility knows exactly how much actual power they have generated from wind, but none of them seem to be very proud of that number as none of them publish it, instead publishing only their “capacity” increases, not actual generation numbers.
The weather in the UK has kept the wind generation greatly under capacity this winter with calm days reducing output and ice buildup causing units to be taken offline. It would greatly surprise me that with 120 Gigawatts if more than 40 gigawats were actually generated.
It also appears that some articles on production are simply using the stated “capacity” to figure TWh generated rather than using actual metered output of real power generated.
In short, I don’t think anyone knows how successful or unsuccessful wind has been.

Jeff Alberts
January 14, 2009 3:33 pm

crosspatch (10:45:12) :
It will be what it is. If it is cost efficient to produce it, it will be produced.

Or if it’s heavily subsidized…

philincalifornia
January 14, 2009 4:38 pm

Roger Sowell (11:57:09) : wrote:
Alan Chappell — re wind power
I cannot comment on what Italy is doing and why. I worked there off and on on consulting assignments, from Milan down to Taranto and in Sicily. But from the above statement, and I have not confirmed its accuracy, 80 countries are in the wind-power game. Perhaps Italy has insufficient wind resources? Perhaps Italy has adequate base-load power and pumped-hydro resources? The geography of Italy is likely unique, with a mountain range running down the middle of the entire country, and the Alps across the northern portion.
My “engineers are on it” statement refers to the energy storage problem.
Roger E. Sowell
Marina del Rey, California
______________________________________________________
Interestingly Roger, although it is not my field,I can give you a very specific and up-to-date answer on that very question as it relates to Tuscany. I had the good fortune to be part of a U.S.-Tuscany Trade Mission to Pisa and Florence last month. I spoke with many decision makers over there regarding my own field (Biopharma) and the biofuel field, in which I’m also peripherally involved.
The decision-maker/dignitaries in government there told me specifically (and we actually had personal interpreters for the conversation, which was way cool) that their main focus is on geothermal, and they are not going to put up wind turbines in Tuscany because they do not want such ugliness in their countryside. Straight from the horses mouth so to speak.

January 14, 2009 5:03 pm

philincalifornia — kinda what I suspected, given the incredible beauty and history of the landscape.

January 14, 2009 6:42 pm

Leif Svalgaard (09:01:07) :
And I can answer: “I don’t understand the graph….
Thats a whole lot different to “just shows that there is no correlation at all. It stands as the clearest observational refutation of the angular momentum idea.”
But let me explain. The angular momentum trend is somewhat crudely constructed by taking the angular momentum figures from Carl’s graph at each peak and trough. I assumed 2.0E+47 as the centre point and calculated from that point. With angular momentum a high figure can be just as good as a low figure, its about the extremes and one reason why a scatter plot is difficult.
http://landscheidt.auditblogs.com/files/2009/01/ssbscmax2.jpg (ignore the dots for now)
What we are left with is a rough angular momentum plot (which could be improved) but none the less shows a trend we can match with sunspot cycles and their modulation. It shows a background “driver” and what must be kept in mind is the inertia involved which also makes a scatter plot difficult. SC21 & SC20 were less active than the angular momentum suggests because of the sudden drop in SC20 (inertia was lost) and is perhaps the same reason why a cycle directly after a “grand minima” cycle suffers very low activity, even though that cycle has very high angular momentum. This is observed in all grand minima.
SC12 was a victim of the reduced momentum happening at the tail end of SC11. But the general trend is stronger angular momentum around grand minima tailing off to a low point before rising to the next high point and more grand minima. J+S are the main engine with N+U providing boost as well as taking away momentum (critically at times of grand minimum, N+U can add or take away momentum in successive cycles). In the past you have criticized this theory saying the 14C records dont show a regular grand minima pattern every 179 yrs in the 11000 yr record. Angular momentum does not always have the same modulation strength every 179 yrs and is controlled by the positions of J+S as the meet N+U which change slightly on each occurrence but is not random and follows a trend.
There is new information on what possibly “triggers” a grand minimum event which can be read in Ian Wilson’s paper at http://landscheidt.auditblogs.com and I can explain that at another date if your interested.
http://landscheidt.auditblogs.com/files/2008/12/ultimate_graph2all.jpg

January 14, 2009 6:49 pm

nobwainer (Geoff Sharp) (18:42:46)
SC21 & SC20 were less active than the angular momentum suggests
that should read “SC21 & SC22 were less active than the angular momentum suggests”

Edward Morgan
January 14, 2009 7:41 pm

nobwainer, that’s very interesting stuff above thanks. What does your name mean if you don’t mind me asking I’ve never heard that before? Cheers, Ed.

January 14, 2009 8:20 pm

nobwainer (Geoff Sharp) (18:42:46) :
“And I can answer: “I don’t understand the graph….”
Perhaps I should have said that I don’t understand why you think the graph shows any correlation. Even with your explanation, it makes no sense at all. F. ex. there are references to ‘inertia’ . could you explain what that means. Probably something else than http://en.wikipedia.org/wiki/Inertia

January 14, 2009 10:23 pm

Edward Morgan (19:41:32) :
Hi Ed, nobwainer was just a silly name coming from the term “no brainer” meaning not having to think. But judging by Svalgaards response Even with your explanation, it makes no sense at all I might have to simplify my theory even further. If no one can understand it, its pointless.
Leif Svalgaard (20:20:56) :
“Inertia” could apply in many ways, the Sun during grand minima slows its production of sunspots (which is not understood yet). Some theories and observations suggest angular momentum can change the rotation speed of the Sun (Ian Wilson 2008 -Does a Spin–Orbit Coupling Between the Sun and the
Jovian Planets Govern the Solar Cycle? or Javaraiah 2003). What ever happens there is a slowdown of some form (i dont want to argue this position) which going on past sunspot history as well as proxy data it shows we do NOT get a sudden rise in sunspot activity coming out of grand minima , but a more gradual rise suggesting it takes time to recover.

January 14, 2009 10:39 pm

nobwainer (Geoff Sharp) (22:23:03) :
“Inertia” could apply in many ways, the Sun during grand minima slows its production of sunspots (which is not understood yet).
It looks to me as simply meaning that the theory breaks down and you invent that term as a euphemism.

Pierre Gosselin
January 15, 2009 1:25 am

Roger Sowell,
Thanks for the reply.
You answered pretty much with “Everybody else does it! So why not wind and solar”. That’s as bad as an argument as one could possibly come up up with. You’ve lost the argument.
First of all, we are not talking about “some” subsidies for solar and wind and biofuel. They are massive. These subsidies mean only a very select few people will benefit, and the rest of us will have to pay forthe subsidies, and then pay more for energy. A total folly. The consumer gets nothing for the subsidy, except higher costs.
The subsidies for oil, gas and nuclear may exist, but they are nowhere near as much as those for renewables. And there are good reasons for supporting them::
1. They are much more competitive.
2. They deliver a nice even constant and reliable supply.
3. They are available in abundance.
4. They require very little space.
Concerning wind and solar, we all like to talk about “installed capacity”.
But the difference between installed capacity and actual output, when there is output, is huge. Do you know what percentage of installed capacity is actually put out?
You’d be surprised.
The wind and sun don’t always blow or shine. Rarely are they present in amounts that allow the turbines or panels to put out their “rated capacities”.
Often wind turbines are generating at only a small fraction of their “rated capacity”. And what about gas, oil, nuke or coal-fired plants? They routinely operate at 90+% of their rated capacity!
So please tell me the precentage for wind or solar. I wonder if you know.
And I am familiar with intellectual property rights. You’re suggesting they are uncompetitive? Sorry, but I think only a complete business fool would share such an opinion. Just think about it for a couple of moments, please.
Again, solar and wind have to be backed up by gas-fired plants 1:1! FACT!
Why not just run them full time, do away with the ugly and expesnive wind and solar, thus saving us huge amounts in subsidies, and thus provide consumers with affordable power? I’m still waiting for an answer.

Pierre Gosselin
January 15, 2009 1:38 am

Crosspatch:
“I haven’t seen anything that shows actual generation numbers….”
Some of these numbers will be publshed soon. And you are right…the numbers are truly embarassing. Only complete business fools (i.e. governments) could justify such investments. Well, actually they couldn’t, and so that’s why they ivented the AGW scare story. Buy it, or you’ll die!
That’s the only way they could sell this technology.
It’s the greatest Fraud in the history of human civilisation.

January 15, 2009 1:43 am

Leif Svalgaard (22:39:25) :
It looks to me as simply meaning that the theory breaks down and you invent that term as a euphemism.
Is that the best you can do? If you cant offer something reasonable why bother with a response. While its good to have someone to challenge your idea’s and keep you straight, sometimes that can also quash others and tends to become a one man show. Like others on this blog I find your continued negative comments and sometimes rude and personal attacks as a distraction from what this blog is about. Perhaps you could use your knowledge in more constructive ways and learn that there is more out there than what you have learned so far.

E.M.Smith
Editor
January 15, 2009 4:54 am

Btw. Even ExxonMobil, no fan of renewables, predicts that biodiesel will comprise 7 percent of transportation fuels in 2030. That is up from less than one percent today.
Roger E. Sowell

Just after some bright guy figured out that they could take animal and plant fats and oils and send them through the already existing hydrogenator or hydro-treater at the refineries, the oil companies discovered that biodiesel was a good thing 😉
They get a straight alkane + propane rather than the methylester + glycerine of the transesterfication process. More efficient in some ways. Better low temperature performance (basically it’s just regular Diesel).
Right after I read that I dumped my Biodiesel maker stock. How can a small company that needs special hardware compete with a giant guy that can just dump it through hardware they are already amortizing for something else…

Charles Higley
January 15, 2009 5:05 am

“Scientists Refute Argument Of Climate Skeptics”: If you stay away from the cities, the rise from 1975 on becomes less than the previous rise. So . . . the problem is?
Regarding solar energy and the Arctic:
I surely have not had a chance to read all of the comments, but solar radiation appears to have little to do with Arctic melting and its energy balance. It has been long recognized that it is warm air from lower latitudes which causes the summer melt.
Solar radiation at its peak at 17% after traveling through the thickness of atmosphere due to its low angle and also due to its low angle its distribution is 17% of vertical sunlight per meter. That puts it a 2.9%. And if it hits water or ice, there is a significant reflection. If it hits water, the heat from the absorbed radiation is lost almost immediately to evaporative cooling. Most of the year the Sun is too low or missing all together to do anything. The numbers above are for the peak of the summer and represent the maximum. The idea that the Arctic will suddenly go balmy is balmy.
The big melt of 2007 was a perfect storm of wind patterns blowing sea ice OUT OF the Arctic where it melted elsewhere, a large bolus of warm water was pumped into the Arctic basin by the North Atlantic Oscillation and there was even sea floor volcanic and geothermal activity on the Arctic Ocean floor. The ice this Fall grew at about a 30% faster rate than the previous Fall.
The Sun has little to do with the Arctic directly. I read a report that the Arctic Rim land-based monitoring sites have found that the Arctic has done little, if not cooled, in the last several decades. Many do not know that the Northwest Passage was open a few years right after 1900 and several years in the 1940’s. In the former, they were able to take sailing ships through. 2007 was the first time since then that it was open.

E.M.Smith
Editor
January 15, 2009 6:04 am

crosspatch (15:39:31) :
“Have a look at the Jatropha tree. ”
The problem with growing any crop is that the amount of land available for cultivation of anything is limited. To increase the production of something, production of something else must decrease or habitat not currently being cultivated must be modified.

Yes but… In India, they are planting Jatropha along the railroad right of way. They figure they will get enough production from the right of way to power the rail road. They had to tend and weed the right of way any way, but did not grow crops on it, just weeds and weedkiller… Similar stories abound. It is also widely used as a fence. Cattle don’t like it. The farmer gets a second crop *and* a fence *and* keeps the sacred cows from eating his main crops. It works.
I saw a study of ‘depleted’ land in India that showed some large portion of their motor fuel needs could be met by planting Jatropha on land considered too poor and depleted for food crops. Over time this improves the soil enough to return it to food production(!). (Leaves & seed meal build tilth and roots fix nitrogen. Birds in trees add phosphate 😉 It was something like 20% of the crop land at the time…
Even if currently uncultivated land were placed into production of it, it would likely greatly change the natural habitats where it is planted.
Another ‘yes but’. It grows in low rain, depleted soils (nitrogen fixer) so often what is being ‘changed’ is pretty dismal land… There is no shortage of scrub foothills in California with an attempt at grass pasture scattered scrub oaks and one or two cows per hectare… Not exactly pristine wilderness.
Desert ecosystems are extremely vulnerable to even the slightest change because they exist on the margins of sustaining life in the first place.
IIRC it doesn’t produce well in hard desert. More like the low water scrub just before the desert.
We would soon see irrigation and fertilization and eventually complete change in the local ecosystem.
Not as much as you would think. It is a nitrogen fixer, so no added nitrogen. Drought tolerant plants often don’t like too much water added! And many places have not water for irrigation. But in all cases a plantation is decidedly NOT the same as a wild land.
If it proves very profitable, production would begin to move to more conventional crop locations where it would begin to displace food crops.
Not much, at least in the USA. It isn’t very cold hardy…tropical and semi-tropical only. And the high value crops in warm places like California are not at much risk. Parts of West Texas and New Mexico might be usable. The icky parts 😉
Exchanging food for a poisonous oil that can not be used for any other purpose seems somewhat dangerous.
It isn’t. The oil is not exactly lethal. The other name of the plant is the physic nut for its medicinal uses. One is eaten to clean the pipes… There are reputatedly some varieties that lack that property and are cooked and eaten in Mexico.
The oil can be used for many other purposes (soap, lamps), just not for cooking. Kind of like castor oil, the seeds of which are very lethal. The pressed seed cake is used for fertilzer. It’s risk is no more than rhubarb (poison leaves), parsnips (poison leaves), potatoes (toxic skin if left in the sun, toxic leaves), tomato (toxic leaves), etc. Heck, even kidney beans are toxic! Every Christmas a few people get slow cookers and decide to make chili with their tried and true recipe – then learn that kidney beans need to reach boiling to breakdown the toxin… off to the doctors…
I could see it replacing some of the paper tree plantations and sugar cane or cotton in the south. Maybe. But a more likely solution would be algae. Much more production per acre.
The reality is that each climate zone has a best fit crop, so any biofuels solution will involve many different plants, not just a single magic plant… And yes, there is enough land to do this. I ‘did the math’ once and it was something like a 100 mile high by 1000 mile stripe for the USA for cellulosic ethanol. Algae shrinks that to more like 100 x 100 miles. Much better.
And yes, I’d love to see the median and margins of our interstate planted with things other than weeds…
DOOIF or UK:DOO is the ticker for D1 Oils, plc. a company that is promoting Jatropha. They are based in the UK and are doing genetic improvement too. It’s more of a 3rd world tropical solution though.
http://www.d1plc.com/agronomyEnergy.php
(Sometimes I think you could mention anything, like even cattle carcasses, and I’d think of a stock ticker… Oh Dang! Darling DAR… I need to think up a better outrageous example… )

E.M.Smith
Editor
January 15, 2009 6:26 am

Roger Sowell (05:56:00) :
crosspatch:
I disagree with almost everything you wrote. Insufficient time now to go into details, but just a couple of thoughts: please explain how electric power from a nuke will provide energy for long-haul trucks, cross-country trains, and airplanes.

It’s doable, but not electric for the trucks and airplanes… For trains, we actually had a long haul train that was electric for quite a while. They were just about to electrify the final gap when someone decided to scrap it. It’s common in Europe. It would be expensive to electrify, but not hard.
Any carbon source can be turned into motor fuels. You can use nuclear process heat to do this. Then about 3/4 of the fuel energy comes from the nuke. VW engineers cooked this up after the ’70s oil embargo. They used coal, but one could just as easily use wood, trash, whatever as the carbon source. Make producer gas, run it to methanol. If you want gasoline, run that through the Mobil zeolite catalyst.
Yeah, the rest of crosspatch posting left me a bit glazed…

E.M.Smith
Editor
January 15, 2009 7:02 am

Crosspatch:
And why exactly do you want biofuel? For what purpose do we need it?

My primary interest is that it lets small rural communities become energy independent and lets individual farmers tell the whole world power structure to go get bent (oil company, haulers, government, you name it.) If I can grow my own oil, squeeze it in my own press, and use it in my own tractor, well, that’s a good thing. This is being done in rural India. You can even buy electric generators set up to run on such oils today for about $1500/kW.
A secondary interest is that it provides yet another lever to use against OPEC. (I’d rather use CTL, but hey, you use what you can…)
A minor point is that biodiesel actually burns cleaner and smells nicer.
And we couldn’t possibly grow enough of those trees to be a reasonable replacement for oil on anything more than a thimble full in an ocean. Do you know how much oil we consume in a day? 20,680,000 barrels per day in 2007. How many square miles of these trees would it take to put a measurable dent in 20+ million barrels *each day*?
http://www.jatrophacurcasplantations.com/?gclid=CO-bs6TpkJgCFRHxDAodC3jYnw
Claim a 10+ tonne / hectare oil yield. While D1 claims 192,000 ha headed for 300,000 real soon now planted.
http://www.d1plc.com/agronomyPlanting.php
I’ll let you go through all the hectares to acres and tons to bbl conversion because I’m feeling sleepy right now…
As to how much “we” can grow in the USA, I think the fact that it can only survive a light frost, and even then yields plunge, make it at best a niche crop in the USA (Especially if the “whole place is frozen” that we’ve been having holds up… a couple of weeks ago I lost 2 small avocado trees to unexpected cold… now freeze warnings in Florida? Maybe San Diego would work … )
Depends on if you are that farmer in Kenya, or Ceylon, or India, or… paying through the nose for OPEC oil in US dollars with crushing local taxes.

Adam Gallon
January 15, 2009 7:07 am

All this talk about the effect of the planets on the solar cycle, reminds me of the “Jupiter Effect”, predicting dire consequences from the planetary alignment of March 1982.
That was a pile of foetid Dingo’s kidneys, Wiki (OK, not the most reliable reference work ever) notes a source citing a tidal effect of 0.04mm on the Earth’s crust.
There were no major earthquakes, ‘Frisco didn’t get swallowed up as the San Andreas opened up and Yellowstone didn’t blow.
This whole theory has more akin to Astrology than any science and is best left to the inside back cover of the magazines abandonned in Drs’ surgery waiting rooms.
Wind power may have its place on a small scale, but as a viable way of producing siginifcant power on a commercial scale, it’s a non-starter, be it on land or sea.
One estimate of the electricity produced for the UK during the calm, very cold and dark New Year period, is 0.5%.
Our dear Prime Minister wants 20% of our electrical power to come from windmills built in the North Sea, by 2012, this is to comply with an EU directive.
The way this will be achieved isn’t explained. It will require the erection of 2 of these giants per day.
There’s only one vessel in the world that’s capable of transporting these devices.

E.M.Smith
Editor
January 15, 2009 7:09 am

Lets try this again, but with the italics right…
Crosspatch:
And why exactly do you want biofuel? For what purpose do we need it?

My primary interest is that it lets small rural communities become energy independent and lets individual farmers tell the whole world power structure to go get bent (oil company, haulers, government, you name it.) If I can grow my own oil, squeeze it in my own press, and use it in my own tractor, well, that’s a good thing. This is being done in rural India. You can even buy electric generators set up to run on such oils today for about $1500/kW.
A secondary interest is that it provides yet another lever to use against OPEC. (I’d rather use CTL, but hey, you use what you can…)
A minor point is that biodiesel actually burns cleaner and smells nicer.
And we couldn’t possibly grow enough of those trees to be a reasonable replacement for oil on anything more than a thimble full in an ocean. Do you know how much oil we consume in a day? 20,680,000 barrels per day in 2007. How many square miles of these trees would it take to put a measurable dent in 20+ million barrels *each day*?
http://www.jatrophacurcasplantations.com/?gclid=CO-bs6TpkJgCFRHxDAodC3jYnw
Claim a 10+ tonne / hectare oil yield. While D1 claims 192,000 ha headed for 300,000 real soon now planted.
http://www.d1plc.com/agronomyPlanting.php
I’ll let you go through all the hectares to acres and tons to bbl conversion because I’m feeling sleepy right now…
As to how much “we” can grow in the USA, I think the fact that it can only survive a light frost, and even then yields plunge, make it at best a niche crop in the USA (Especially if the “whole place is frozen” that we’ve been having holds up… a couple of weeks ago I lost 2 small avocado trees to unexpected cold… now freeze warnings in Florida? Maybe San Diego would work … )
Depends on if you are that farmer in Kenya, or Ceylon, or India, or… paying through the nose for OPEC oil in US dollars with crushing local taxes.

January 15, 2009 7:57 am

nobwainer (Geoff Sharp) (01:43:37) :
Perhaps you could use your knowledge in more constructive ways and learn that there is more out there than what you have learned so far.
I’m always willing to learn and I learn something every day, but I also have a good filter. And your ideas simply do not get past the filter. I often review scientific papers for various journals and I have reviewed your [and other’s] ideas as I would have reviewed such papers. If you were to write them up into a paper and submit the paper to a reputable journal, you would find similar [or harsher] criticism. A reviewer would often request a different or additional plot if one you supply is not clear enough. Refusal of such a request would often lead to rejection of the paper. The author sometimes feels the rejection as an attack, but forgets that the onus is on him to make his ideas clear. My request of a scatter plot falls in that category. Even if the relation is not simple, by using different colors or symbols, the ideas can be expressed graphically and analyzed statistically. If you send me a email with the values that go into your graph, I would be glad to make the plot for you.

January 15, 2009 11:40 am

Pierre Gosselin (01:25:32) :
“Roger Sowell,
Thanks for the reply.
You answered pretty much with “Everybody else does it! So why not wind and solar”. That’s as bad as an argument as one could possibly come up up with. You’ve lost the argument.”
Apologies if my answer was interpreted that way. Not at all my intent. Let me take another crack at it.
Firstly, not “everybody else does it.” Far from it. Only 80 countries, out of what, 190 something in the world (number keeps changing…) Less than half, I would say.
I cannot answer for, nor fully fathom, the reasons behind why governments invest their money in many ventures, including wind and solar. California mandated (I keep using California as example only because I live here and am more familiar with it) solar roofs on public buildings — with no requirement for an economic analysis. They could have a simple payout of 50 years and it would not matter. By decree, it shall be done.
Private investors have better things to do with their money than put it into a 50-year payout project. T-bills at 3 percent and sold at par are safer, and better than that.
Governments do try to use subsidies, tax credits, rebates, give-aways, to guide private investment to things that the government deems beneficial, but would otherwise not be done. The process is no doubt riddled with problems; I am not here to defend the government’s decisions. Sometimes the special interest group with the most funding, the best experts, and the most persuasive spokesman can obtain government funding — and it is all a sham.
But to the wind and solar, they are not all boondoggles. Have you ever spent time on a west Texas ranch, and watched the windmills (water pumps, not power-generating) turn for hour after hour, day after day? I have. We were bored as pre-teens, and spent summer after summer on a ranch like that. Those windmills never stopped spinning. Same on other trips, not just summers.
How about driving along I-15 north of San Diego, and look at the scrub trees along the freeway? Notice anything? There are no branches on one side of the trees, and the trees are bent in the opposite direction. What does that tell you? Perhaps the wind is fairly strong, and consistent?
Or, have you been sailing off the coast of Corpus Christi, in south Texas, and enjoyed the incredibly steady and stiff wind? One can drive to the beach in Corpus, enjoy a picnic on the sand, and watch the ultra-light gliders, some powered, hover motionless for hour after hour. What kind of wind allows them to do that? These are not one or two days per year, either. This is day after day after day.
I am sure others have similar eye-witness accounts of stable wind areas.
Now specifically to your question on wind efficiency, or generation as a fraction of nameplate capacity. I have seen numbers reported as 40 percent in Spain, 33 percent for West Texas, 25 percent in California, and hard numbers from California wind energy association for 2006 of 19.7 percent.
So, no, I am not at all surprised. I assist investors with the economics and legal aspects of their projects. The fact is, and this may surprise you, that no one designs a wind project for 100 percent utilization. What is done is to over-build the capacity so that when the wind is strong and stable, much power is generated (around 99 percent capacity for those few hours). Then, when the wind decreases, the generators drop off-line even though the blades are still spinning.
You seem to be under the impression that wind energy is a waste of time and money. As I have written before, many sober and serious people do not agree with you. Their money is invested, and that money is growing. You can join the game, too. There are no restrictions on who can invest, so it is not limited to just a few people as you state. You can also invest in stocks of companies in the wind energy business. There are plenty of green funds around.
You also wrote, “And I am familiar with intellectual property rights. You’re suggesting they are uncompetitive? Sorry, but I think only a complete business fool would share such an opinion. Just think about it for a couple of moments, please.”
I am not sure what you are getting at by that. Intellectual property is one of the areas in which I practice law. And yes, they are by design and by intent uncompetitive. They provide an exception to the anti-trust laws. Every lawyer knows this. The U.S. Constitution, Article I, Section 8, provides that “Congress shall have the power…To promote the progress of science and useful arts, by securing for limited times to authors and inventors the exclusive right to their respective writings and discoveries;” Note the words “exclusive rights.” And, the words “writings and discoveries.” These refer to copyrights (writings) and patents (discoveries). Anyone trying to exclude others without an appropriate copyright or patent, for example, would be in serious hot water.
You also wrote: “Why not just run them full time, do away with the ugly and expesnive wind and solar, thus saving us huge amounts in subsidies, and thus provide consumers with affordable power?” — referring to fossil and nuclear power plants.
Actually, nuclear power costs around 25 to 30 cents per kwh for a new nuke. Even the older ones in operation cost around 10 to 15 cents per kwh. Wind energy costs around 7.5 cents per kwh. Which would you prefer to pay? Some solar installations that use thin films are now producing power at around 5 cents per kwh. And, if you want to argue that my cited costs for nuclear are far too high, that their actual cost to produce power is 2 or 3 cents per kwh, be careful. That does not include their cost of capital. As cheap as nuclear fuel is, wind is cheaper. Wind is free. Have a look at Severance’s paper on nuclear power plant costs. And, even as cheap as coal is, or natural gas is, wind is cheaper.
And look at subsidies this way. The government pays a small amount up front, projects get installed with private money, and taxes flow to the government on several levels. Among these are sales taxes for the equipment, income taxes on the salaries for the jobs created, property taxes on the real estate with improvements, and state and federal income taxes on the profits from the enterprise. This flow of taxes reduces your taxes, or keeps them lower than what they would be otherwise.
Just one man’s opinion, with some facts thrown in for good measure. You are free of course to disagree.
Roger E. Sowell
Marina del Rey, California

Pierre Gosselin
January 15, 2009 11:40 am

E.M. Smith
If biofuel is so great, then why are all the subsidies needed?
Also, more than half of the energy yielded is needed to plant, transport, handle and process the raw material into an end-product. This does not include distribution and marketing the end product! More than half gets used to make it.
And let’s not forget the massive use of fertilisers and the implications on global food prices with 800 million people go to bed hungry every day.
UN Expert Jean Ziegler called biofuels, and rightly so: “a crime against humanity”.
I rest my case.

January 15, 2009 12:07 pm

E.M. Smith,
“It’s doable, but not electric for the trucks and airplanes… For trains, we actually had a long haul train that was electric for quite a while. They were just about to electrify the final gap when someone decided to scrap it. It’s common in Europe. It would be expensive to electrify, but not hard.”
Agreement from me, as to the technical viability (no physics violated), just the cost/benefit is not there for long-haul trains electrified. A third-rail system would never be allowed due to liability concerns, (not that you said it would, but I think another commenter on one of these postings recommended it). The overhead system would work, but the costs are very high. The high-speed rail under consideration for California would use the overhead system, or catenary. But, replacing the entire U.S. rail structure with a catenary system would likely not be cost effective. I have not run the numbers, but it seems that with a likely ceiling on oil price of $80 (2008 dollars), and diesel fuel for trains never rising much above today’s levels, it just will not happen.
Physics first, then economics. As I read that you are an economist, you certainly know that alternatives are almost always available. As prices increase, other alternatives become viable. With oil, that is certainly true. Shallow oil wells, deeper oil formations, deep-sea oil formations, tar-sands, shale oil, coal-to-liquids, gas-to-liquids, organic waste-to-liquids, all have their break-even price. As I wrote earlier, the Saudis know all this and will do all in their power to keep selling their oil, and not allow these alternatives to become economically viable.
If the Russians ever get their game together on oil, as they appear to have done with natural gas, it will be even longer before we see alternatives or synthetic crude in wide use.
Roger E. Sowell
Marina del Rey, California

Rick
January 15, 2009 12:27 pm

Wind is free? How bout the huge transmission problems/costs? Same with solar, but add the compicated, yet delcate constant cleaning required there. Neither has yet nor is likely to be profitable on their own in the near future.

Tim Clark
January 15, 2009 1:08 pm

Pierre Gosselin (11:40:40) :
E.M. Smith
If biofuel is so great, then why are all the subsidies needed?
Also, more than half of the energy yielded is needed to plant, transport, handle and process the raw material into an end-product. This does not include distribution and marketing the end product! More than half gets used to make it.
And let’s not forget the massive use of fertilisers and the implications on global food prices with 800 million people go to bed hungry every day.
UN Expert Jean Ziegler called biofuels, and rightly so: “a crime against humanity”.
I rest my case.

Your argument would be credible if one doesn’t consider that only 5% of the energy used to make electricity is actually utilized by the end producer due to conversion inefficiencies, grid/ substation heat loss, etc. Also, biofuels are efficiently manufactured from soybeans, which require very little fertility augmentation. As for the hungry masses, Lyndon Johnson stated in 1965 that “We will eliminate poverty in our lifetimes.” $12 Trillion later we have more poverty now than then.

Richard Sharpe
January 15, 2009 1:18 pm

Roger Sowell says:

Actually, nuclear power costs around 25 to 30 cents per kwh for a new nuke. Even the older ones in operation cost around 10 to 15 cents per kwh. Wind energy costs around 7.5 cents per kwh. Which would you prefer to pay? Some solar installations that use thin films are now producing power at around 5 cents per kwh.

Hmmm, does that include the cost of the storage facilities to store energy for those times when the sun is not shining and the wind is not blowing? How about places like Alaska and Northern Canada with vastly reduced sun shine periods during winter?
Otherwise the comparison is a little like selling snake oil, n’est pas?

E.M.Smith
Editor
January 15, 2009 2:16 pm

Pierre Gosselin (00:41:29) :
I’ll tell you right now that the biofuel proponents had the same hopes, dreams and visions – until they collided violently with reality. Today we all know the folly of biofuuels: deforestation, food shortages, absurd inefficiency and civil unrest, and that all caused by a biofuel industry that is only in its infancy!

There are some issue here, but first: I don’t think biofuels are the be-all and end-all. They ‘have issues’, but not as stated above.
1) Existence proof.
Brazil has a well done working biofuels program. 8:1 energy gain. Quite profitable. Fits well inside the ag sector. (Recent land conversions to ag use have had to do with the growth of soybean planting in Brazil for animal feed, not alcohol, so don’t hang deforestation on the wrong cause… It’s the COWS and their 10:1 feed conversion “efficiency”… )
2) Exactly what food shortages came from biofuels?
The rice shortage had nothing to do with biofuels. It had a great deal to do with the contamination of foundation seed stock used in America with a GMO gene from a Bayer test plot. That was not caught before the seeds were widely planted. THAT then resulted in the entire US crop being banned in many countries as an import. Take a major exporter off line, rice ‘shortage’… That then resulted in the civil unrest.
The corn used for biofuels is not human food, it’s field corn. The only one made ‘hungry’ by using it for alcohol would be a chicken somewhere, but in return a COW was fed more: they are fed the DDG – Dry Distillers Grain – after the fermentation. Yes, egg & chicken prices went up, DDG feed costs went down. Cherry picking your cost impacts? And at no time was there a shortage of chickens and eggs in the market… Don’t confound price impacts with supply quantities. (During this time I traded into CALM, the largest egg maker around. It has a seasonal component too, peaking at Easter… but stayed away from beef and pork – ticker COW.)
3) Corn efficiency is not biofuels efficiency.
While the use of corn kernels for biofuel is low efficiency (about 1.3:1 gain, though they don’t account for the DDG and other values well, so that gain is biased low) that is because it was a political decision not a technical one to support corn; it is not an indictment of biofuels. Look at sugar cane and biodiesel (especially from used cooking oil) as far better examples. Look at algae as a stunning one. Look at the high gain sorghum that is entering production. Look at the Rentech use of trash (i.e. old paper and yard waste) in a FT system. Look at the D1 Oils use of Jatropha in the tropics. The list goes on… Corn ethanol is a biofuel, but biofuels are not corn…
I could go on, but I won’t ( I HEARD that muttered ‘thank God’!!)
IMHO CTL, GTL, and nuclear are better choices, but biofuels (ex corn kernels) are OK.

E.M.Smith
Editor
January 15, 2009 2:38 pm

crosspatch (15:43:13) :
Coal would be mined and burned. The CO2 absorbed by trees, turned into paper used in the economy and then buried back into the coal mine where the CO2 came from. That would give a positive use of the CO2 before it is sequestered.

Why bother? Grow the trees, make the paper, feed the waste paper to a ‘coal’ burning plant avoiding the new coal & CO2, grow the trees with that recycled CO2,…
This is what is being done today with trash burners & trash to liquids folks who have to make money on the deal. Much less digging, hauling, etc. costs.

January 15, 2009 3:46 pm

Rick and Richard Sharpe, re wind-power, and renewables in general.
As a wind farm owner would look at the numbers, he generates perhaps 100,000 kwh on a given day, with his 20 MW installed capacity. He sells it to his local utility company for, let’s say, between 12 and 15 cents per kwh. The government pays him an additional 1.5 cents per kwh. After paying all his costs, labor, property taxes, maintenance, principal and interest on any loans, interest on bonds he may have had to issue to finance the project, and dividends he must pay to preferred stock holders, his costs add up to 7.5 cents per kwh. He paid absolutely zero for energy, as the wind is free.
Depending on whether he built and paid for connection lines to the utility or the utility did, he must add those costs in. So, let’s just say he gets the low end of the power price, at 12 cents. Government pays him 1.5, so his revenue is 13.5 cents, his costs are 7.5 cents, and he chalks up 6 cents per kwh as his earnings before income taxes. He pays his income taxes, likely 45 percent or so, and gets to keep around 3 cents per kwh.
For 100,000 kwh per day, that works out to $3,000 per day. Not too bad, considering he already paid the bank for his loans. He likely uses that to buy more wind turbines.
As I said, the wind is free. No charge for the energy input to the system.
From the utility standpoint, they pay the wind farm owner 12 cents for the power he produced. They back down their generating plants to compensate for his power, and save their incremental costs for fuel, chemicals, water, and less wear and tear on equipment. Those costs work out, depending on which plant is backed down, and the price of the fuel, to around 3 cents up to 8 cents per kwh. The utility will normally back down its most expensive power, perhaps a Rankine-cycle gas-fired power plant with an efficiency of around 45 percent.
So, using a 45 percent power plant efficiency, and $5 natural gas, the utility pays the wind farmer 12 cents, reduces his own costs by 4 cents, and re-sells the power to a customer for 12 cents. The utility just made a profit of around 4 cents per kwh, which after taxes is around 2 or 2.5 cents. That is around $2,000 per day, for doing nothing!
When natural gas was around $12 this last summer, the utility’s cost was around 9 or 10 cents for each kwh reduction. The utility’s profit in that scenario was around 5 to 6 cents for every kwh of wind power purchased.
It can get even higher, if the utility is backing down a peaking gas-turbine that has only about 20 percent efficiency. Then, the utility may be saving 20 cents per kwh, if natural gas is at $12.
Does this make it any clearer why MW of wind-generated power is growing by around 30 to 35 percent each year? Utilities pray for wind. Go, wind, go!
Notice that a utility will not (usually) back down a nuclear plant when wind power is purchased, because their incremental cost of nuclear power is about 2 or 3 cents per kwh. Why back down the nuke, when you can double or triple or quadruple your profits by backing down a gas-fired Rankine plant?
The same analysis holds true for solar, wave-power, geothermal power, or any other renewable power. The individual costs of production may be different, as I wrote earlier thin film PV is reported to generate power at around 5 cents per kwh.
Now, as to the Canadian darkness, and other more northerly regions where solar is not economic, or perhaps the wind does not blow, all I can say is that no country has an equal distribution of natural resources. Japan, for example, has very little natural resources except coastline. They have managed and are managing quite well.
Btw, there is a published study of installing massive wind turbines on the Aleutian Islands off Alaska, then transmitting the power to the lower 48 via new cryogenic underground transmission lines. Those guys are thinking big, as in Egyptian pyramids big, or Three Gorges Dam big. But the available wind power up there is awesome.
Roger E. Sowell
Marina del Rey, California

E.M.Smith
Editor
January 15, 2009 3:56 pm

crosspatch (09:33:34) :
If I might be so bold to make a suggestion, an intercontinental high speed electric rail system rivaling the Interstate highway system and powered by nuclear energy would be a great asset to the country.

I fully agree, but I must point out the vast quantity of land, especially desert land, that would consume. Unless you re-use the existing RR right of ways, you are talking about a lot of land. 20,000 miles x (any usable width) is large. And therein lies the rub. Either you confiscate the existing right of way rights or you duplicate something very large and expensive.
The system should be initially designed for 100MPH travel with an eventual goal of 200MPH when fully completed.
Add 100 mph, please!
Planes might someday be able to operate on hydrogen which could be generated with excess power from nuclear plants.
Fuel tank is way too large. It’s much easier to make Jet-A from coal or even trash. Rentech has already done this and the fuel is provided to the USAF. They are in the middle of certifying all their aircraft to run on this synthetic fuel. The ‘problem’ is already solved. No fleet change issue either.
http://www.rentechinc.com/pdfs/Rentech+MSW+Release+3.11.08.pdf
Think of it as your paper idea, but with the paper turned into jet fuel… THIS is the kind of biofuels process that has no impact on land use (other than reducing land fills…)
Long haul trucks will probably remain fuel based […]
Um, you ought to look into ‘intermodal’. Most long haul freight is already put on trains with trucks for short haul. Watch a freight go by. See all those containers that get set back on a truck bed at the other end? It’s already a solved problem. Some long haul trucking still exists for special purposes, small volumes, or fast delivery.
Synthetic fuel production is easy enough that motor fuels will be with us for a long time to come.
We are going to need to preserve the land for food production.
The big issue in agriculture has been the need to restrict production to maintain prices. The notion that we are running out of land is broken.
I can grow tomatoes around an oil rig, I can graze cattle in an oil field. I can’t graze cattle in a field of these trees.
Have you ever lived on a farm? This sounds like city talk!
There is a nice isolation area around drilling rigs so that the crap from them doesn’t crap up the farm and the pesticides don’t poison the guys running the drill rig. And you don’t graze your cattle in a tomato field either. So? Cattle are cattle and vegetable fields and orchards have no cattle in them.
It is much better to pen the animals and feed lot them anyway (from a productivity point of view). And if you are worried about quantity of food (food shortages) you don’t want cattle anyway. They are horridly wasteful of land and feed. (10 lbs of feed per pound of beef. Chickens are 3:1)
To put cattle in the same breath with a desire to avoid food shortages is just backwards.
And what happens when the local animals try to eat a fallen nut from those trees and are poisoned but have nothing else to eat because the natural vegetation is now “weeds” and is destroyed? It just doesn’t seem to be environmentally friendly on an industrial scale.
NO farm is ‘environmentally friendly’. They look nice on post cards, but they are NOT a place for furry friends to make a home. That ‘local animal’ if found in a nice peach orchard will be killed so fast it won’t have time to cool off before it’s in the dinner pot or buried full of toxins. Do a google of ‘rodent control’ or ‘bird control’ on farms. Farms are intended to murder invading animals as fast as they can. (As a child, I did my share of ‘pest control’ on local farms… We had to be careful about when, though, since there were times when the dirt was lethal due to ‘fumigation’ with methyl chloride IIRC)
Please, if you are a city slicker, let go of the notion that farms are critter friendly non-toxic places. Their purpose (not always achieved) is to kill any competing species other than the crop.
How much energy will it take to fertilize, irrigate, harvest, and process that crop? Current crop biofuels are a net loss.
Nope. Corn is a 1.3:1 net gain. Not much, but a gain. Others are much better. Cane is 8:1 gain. Jatropha is a soil builder and that is one of it’s biggest features; “depleted’ over farmed land is recovered to a productive state by the nitrogen fixation and seed cake waste fertilization regime. Woody species can make up to 54 tons / acre. No way 54 tons of fuel are used on an acre of trees…
Please spend a bit more time looking at the agronomy pages from a decent ag school before making statements about farms and crops. Please.
http://vric.ucdavis.edu/
http://www.pfaf.org/index.php
http://www.hort.purdue.edu/newcrop/
http://www.jeffersoninstitute.org/pubs/amaranth.shtml
are samples of the kinds of things you ought to be looking at if you are interested in farms, farming, and crops.

Edward Morgan
January 15, 2009 4:06 pm

Leif, Nobwainer’s (landscheidt) inertia theory is. Please criticise WHERE this is wrong.
A curve ball spinning (the sun) with a peanut (jupiter) attached it with a rubber band that is about to come to its furthest point from the baseball. This as you can clearly see reduces the speed of the spin because the vector is more away than round.
Thank-you factual friends. Don’t let them pressure truth its still there. Ed.

Richard Sharpe
January 15, 2009 4:18 pm

Roger,
Your analysis is great, but what happens when:
1. We need to add additional capacity? We actually have to build new base-load capacity, because we cannot rely on wind.
2. When the wind capacity out there exceeds that of all the less efficient stuff.
3. What are the risks? Say some large percentage of the wind operators get lazy? Are they regulated in the same way that the big power generation companies are? We lose 20% one day and the distribution company takes a long time to bring new power on-line?

Richard Sharpe
January 15, 2009 4:24 pm

Hmmm, Roger, aren’t you also double dipping, in the sense that the cost of electricity to the generating company includes depreciation on the equipment they have (because it has to be replaced sometime) and the labor costs of their employees.
Even though the equipment is idle, it still costs them something.

E.M.Smith
Editor
January 15, 2009 4:24 pm

Pierre Gosselin (01:25:32) :
Again, solar and wind have to be backed up by gas-fired plants 1:1! FACT!
Why not just run them full time, do away with the ugly and expesnive wind and solar, thus saving us huge amounts in subsidies, and thus provide consumers with affordable power? I’m still waiting for an answer.

Gas: Capital costs low, fuel costs high
Wind: Capital costs high, fuel costs low
Optimized profit: Run wind when possible, gas when not.
Same reason we use gas as peak load and nuclear as base load instead of just running everything on gas or nuke. Just substitute “nuke” for “wind” in the above and you have what we do now (though the nuke variation has a cap on total nuke based on the need to run it as close to 100% capacity as possible.)
Standard linear programming optimization stuff. Econ 1B I think it was… or was it Econ 13?…

January 15, 2009 5:06 pm

Edward Morgan (16:06:59) :
Leif, Nobwainer’s (landscheidt) inertia theory is. Please criticise WHERE this is wrong.
This has been done by many people. Particularly well and recently by De Jager: http://www.leif.org/research/jagerversteegh-20063.pdf
You request is like this: Aristole’s theory [heavier bodies fall faster than lighter bodies]. Please criticise WHERE it is wrong.

E.M.Smith
Editor
January 15, 2009 5:29 pm

Pierre Gosselin (11:40:40) :
E.M. Smith
If biofuel is so great, then why are all the subsidies needed?

Not all biofuels are subsidized. But, to the point: The energy markets are not competitive. OPEC is a monopoly and the ‘oil majors’ are an oligopoly. Utilities are generally regulated monopolies (and often monopsonies as well). So you want just one player to be subject to competition from large government supported monopolies and oligopolies?
Any discussion of subsidies and supports in the energy business rapidly gets bogged down in the discussion of monopoly power, regulatory burden, and un-competitive markets. The theory is that the biofuels subsidy is a countervailing force to the monopoly / monopsony distortions. Personally, I’d rather address the monopoly power directly, but I’m not running for election and looking to get money…
Also, more than half of the energy yielded is needed to plant, transport, handle and process the raw material into an end-product. This does not include distribution and marketing the end product! More than half gets used to make it.
No such statements can be valid. You have some specific biofuel in mind to make these claims or you are making up numbers. Neither is a valid approach.
Each biofuel has vastly different production characteristics. They range from corn, at a 1.3:1 net gain (worse than your claim) to sugar cane at 8:1 (better than your claim) to trash-to-liquids that are, by definition, infinite:1 since you must PAY the site to take the trash (‘tiping fees”) and the energy to run the place comes from the trash. (The energy input to make the trash in the first place gets attributed to the first use, since the trash was headed to a land fill…)
And let’s not forget the massive use of fertilisers and the implications on global food prices with 800 million people go to bed hungry every day.
More broad generalizations that are out of touch with agronomy practices… Sigh. I grew up in farm country raising cows, rabbits, the odd chicken; working in peach orchards, walnut orchards, rice fields. Went to an ag school. Sometimes I forget that most people don’t have that background…
I can only assume that you are talking about US intensive corn culture. Yes, it uses lots of fertilizers. Fertilizers are available in infinite quantities. (Nitrogen is taken from the air. Phosphorus is mined, but never leaves the planet. Ditto potassium.) There is nothing wrong with using them. (There is a problem if so much is used that it runs off into the local water system wasting the money you spent to buy them…) So what? Make more.
The much better biofuels are based on different agronomy systems. My favorite example of a ‘green’ biofuel is Jatropha (already discussed, but I will repeat a bit). The oil is pressed from the seed. The seed meal is returned to the soil adding tilth, nitrogen, and other nutrients. The leaves are added to the soil. It fixes nitrogen from the air so no “nasty” synthetic nitrogen is needed. At the end of a couple of years some truly horrid degraded by prior bad farming practices land becomes very rich productive farm land. This can then be used to make more food for people, not less, and the jatropha gets replanted on the next degraded bit of land.
Think of it as a legume crop rotation to rebuild damaged soils where the cycle time is a couple of decades. It’s a good thing, both for the land and for food production.
World hunger has NOTHING to do with biofuels production (and very little to do with any agricultural production.)
The world can produce far more food than it does. The major issue in agriculture is over production leading to price collapse. (I had to spend more months studying price supports in Ag Econ than I care to remember…)
World hunger has EVERYTHING to do with political power, political manipulation, religious wars, and economic disenfranchisement.
If you try to solve the wrong problem you make things worse, not better. An example? In Darfur, the folks had stable food until the north decided to have a religion driven war on them. In Sudan, the same thing. Food is not allowed to reach the south since they are not of the chosen religion. And I would just love to see someone try to explain that it is a shortage of food production that leaves folks hungry in America…
UN Expert Jean Ziegler called biofuels, and rightly so: “a crime against humanity”.
I rest my case.

“UN Expert”? I rest my case … (If ever there were a poster child for political boondoggles leading to starvation… can you say “oil for food”…)

Edward Morgan
January 15, 2009 5:38 pm

Leif, Nobwainer’s (landscheidt) inertia theory is. Please criticise WHERE this is wrong.
If I’m continually spinning on a computer chair and I set a horse off walking in one direction and unbeknown to him he has a rope tied to his waist the other end is attached to the chair pole. When the horse reaches the end of the rope I and the chair are pulled towards the horse and the spin slows down because the forces are more now towards the horse and not the spin direction than they were.
This is analagous to the sun (chair) spinning and jupiter and the centre of mass of the solar system (horse) lined up creating a peak for the sun in the centre of mass/jupiter direction leading to a minimum in its spin. Basically the force away is peaking at that point in the cycle creating the greatest slow down. These changes are in reality very small. This seems to coincide with enhanced activity. Faster rotation with decreased activity.
Thank-you factual listening friends. Don’t let them pressure truth its still there. Ed.

Edward Morgan
January 15, 2009 5:40 pm

Leif, Tell me what bits are wrong and why, break its logic down. Ed

Edward Morgan
January 15, 2009 5:51 pm

Nobwainer, Isn’t your name because you don’t need no brain to criticise Leif. Because even if we were all dead he’d still be wrong. Ed

Allan M R MacRae
January 15, 2009 6:10 pm

Update today on CCNet from statistician Timo Niroma (see my above post of Jan 11 at 8:50 for his 2007 note):
Below is a modified excerpt of the report I sent in early January to climatesceptics at Yahoo. I have also renewed my alert on my website http://personal.inet.fi/tiede/tilmari/sunspots.html
The sunspot 1009 reigned from 10th to 12th December having a sunspot number between 12-14 and had a maximum area of 50 ppm. It just overrided the sunspot numbers of August and September, but were below of all other month’s sunspot number in 2008. It was only the fourth decent sunspot group from the cycle 24. The previous five ones from January 2008 had only been a 1-2 day specks and the previous cycle 23 reigned until July 2008. The Sun then hibernated in August-September.
The cycle 24 groups in October-November lasted 6 to 8 days each and had a ppm(max) of 70 or 80, so this show in December was very modest. Compare the 1799 numbers below, when Dalton had already begun. This is what to wait from 2009 to achieve at least Dalton level. If the Sun does not in 2009 achieve these levels we are on Penn-Livingston line (“sunspots will vanish in 2015”) that ultimately leads to a new Maunder Minimum, an ultimate cold in the 1600’s . The first part of January 2009 shows that the second solar hibernation during the on-going minimum is here.
But at the moment I still believe that the Dalton road (the minimum in 1800-1820) is more probable, but in a half year we will know. The course is still the 210 year cycle (a known solar cycle), but not for long, if the Sun will not awake. It also means, that the cycle 24 will be very low, that we can be sure about. So times will be colder regardless of the coming superminimum type. Gleissberg cycle hit bottom in 2005 which means lenghtening cycles, which in the past have ment colder times.
So it’s time again to make a comparison looking 210 years back just to the beginning of the Dalton minimum (month spotnumber / month spotnumber):
FULL TEXT at http://personal.inet.fi/tiede/tilmari/sunspots.html
Timo Niroma

E.M.Smith
Editor
January 15, 2009 6:19 pm

Richard Sharpe (16:18:53) :
1. We need to add additional capacity? We actually have to build new base-load capacity, because we cannot rely on wind.

At the risk of actually bringing this alt-energy debate back to the topic of weather ;-0
We can rely on the wind. It’s a statistical reliance, but just as real as any other. There is no time when the wind is zero everywhere in the USA. It just isn’t. Yes, you overbuild the capacity to allow for wind outages, just like you overbuild nuclear and coal to allow for maintenance outages.
In some places, like west Texas, the probability of the wind stopping is far less than the probability that it is blowing (expecially if my Uncle is talking 😉 Does anyone have a link to a historical wind distribution and duration chart, site, data? (Hey! Real weather stuff!)
This is only a problem of inter-regional transmission, not wind reliability. It can be solved with good interties (like the Pacific DC Intertie)
http://en.wikipedia.org/wiki/Pacific_DC_Intertie
For places like England, wind outage it is a much stronger case. They would need to have an intertie to the continent (and cooperation from the French…)
I don’t know what the actual answer would be, but the analysis is fairly straightforward. I would guess that the overbuild needed is probably about 30% when all is built out. Maybe only 15% if much of it is in the wind corridor that is the east side of the Rockies.
2. When the wind capacity out there exceeds that of all the less efficient stuff.
I don’t see any problem here. Less efficient stuff regularly gets replaced with more efficient stuff.
3. What are the risks? Say some large percentage of the wind operators get lazy? Are they regulated in the same way that the big power generation companies are? We lose 20% one day and the distribution company takes a long time to bring new power on-line?
Fictional. When a nuke scrams today it is far worse. Loss of 1,000 MW instantly. Can you say ‘solved issue’? The wind dies down far more slowly than a nuke scrams. The peaking plant is brought on line for a while even if it’s not peak hours. The hydro plant gets a call to open the sluices …

January 15, 2009 6:26 pm

Edward Morgan (17:40:05) :
Tell me what bits are wrong and why, break its logic down.
As you said yourself “These changes are in reality very small”. And indeed they are and that is where it breaks down. They are about 1000 times smaller than the other forces acting on parts of the Sun. The break in the ‘logic’ is the belief that a rabbit can stop a speeding truck. Perhaps it does take a certain amount of brain to realize that, so this may be a test of that.

January 15, 2009 6:29 pm

Allan M R MacRae (18:10:01) :
So it’s time again to make a comparison looking 210 years back just to the beginning of the Dalton minimum (month spotnumber / month spotnumber)
With this 210-year cycle, and Jose’s 179-year, and Landscheidt’s 166-year cycle, there should be enough cyclomania to go around to fit anything at all.

January 15, 2009 6:47 pm

Richard Sharpe (sorry, I don’t know how to make things in italics yet)
“What happens when 1. We need to add additional capacity? We actually have to build new base-load capacity, because we cannot rely on wind.”
Currently, that is a valid point, but not for long. Energy storage is a reality where pumped storage hydroelectric systems exist or can be built. Other systems are in R&D, including batteries, capacitors, compressed air, and flywheels. Sandia Labs has a good site on this, look for energy storage systems. Wind with storage will be base-load compatible within a few years, or it will be peak load on demand.
“2. When the wind capacity out there exceeds that of all the less efficient stuff.”
By this, I take it you mean when sufficient wind power is generated that the utility must reduce its highest cost (and least efficient) generating plants all the way down to zero, or off-line. Well, with energy storage, that is not a problem. Until then, there are studies that indicate a modern utility system can tolerate approximately 20 to 30 percent of its production as intermittent power, from solar, wind, or waves. We are currently around 1.5 percent wind energy in California, so there is a ways to go before the system starts to creak. But the time the wind reaches 25 percent of total, the energy storage will be solved. I can’t write much about how or when, as I am involved in that area and confidentiality rules apply to me.
In any event, a large utility has many power plants, and each can be reduced a little or a lot so not very many are actually brought to zero. Plus, there are some gas-turbine combined cycle plants that can be brought up to full capacity in a few minutes, some reports I read indicate 30 minutes.
Plus, the more wind power sites that exist, over a wide area, the less likelihood that it will all stop at once. So, more MW in more areas is a very good thing.
“3. What are the risks? Say some large percentage of the wind operators get lazy? Are they regulated in the same way that the big power generation companies are? We lose 20% one day and the distribution company takes a long time to bring new power on-line?”
It depends on which utility, and what state. Currently, California has almost all the generating plants separately owned and operated from the utilities, these are called IOUs or Investor Owned Utilities. These are private companies that own the power generating plants. The big regulated utilities also have some plants, for example the nukes, and the hydro.
Here is a site that likely will answer a lot of your questions:
http://www.calwea.org/bigPicture.html
“Hmmm, Roger, aren’t you also double dipping, in the sense that the cost of electricity to the generating company includes depreciation on the equipment they have (because it has to be replaced sometime) and the labor costs of their employees.
Even though the equipment is idle, it still costs them something.”
Well, the generating equipment will likely not be idle, see above as to only 1.5 percent wind power currently. The reduced operating load tends to extend its lifetime, so replacement date is stretched further out into the future. I think you actually mean wear and tear, not depreciation, as depreciation is a financial term and really has little to do with replacement decisions. Also, the labor cost is a fixed cost, and we don’t really foresee sending operators home while a big generating plant is shut down due to the windmills generating power. As I said, up until about 20 percent or so wind power, the utility just throttles back the high-cost plants.
All this is predicated on what happens during the day, as some utilities, like California, have about a 2:1 ratio for peak demand in the afternoon, compared to lowest demand each night. They do cycle some plants off at night, then start them up the next day.
Different power plant designs have shorter or longer startup times, with gas turbines very short, gas-fired steam plants (Rankine cycle) a bit longer, coal-fired plants a bit longer, and nukes, well, lets just say they don’t ever want to shut those down and restart. Major headaches. There are also life-expectancy issues with shutting down and restarting any thermal system that gets very hot, so when and if power plants are shut down temporarily while wind provides the power, there is some reduced life expectancy for the fossil-fired plant.
The California Energy Commission has lots of papers online that discusses much of this.
see http://www.energy.ca.gov/
Roger E. Sowell
Marina del Rey, California

Allan M R MacRae
January 15, 2009 7:49 pm

Leif Svalgaard (18:29:59) :
Allan M R MacRae (18:10:01) :
So it’s time again to make a comparison looking 210 years back just to the beginning of the Dalton minimum (month spotnumber / month spotnumber)
With this 210-year cycle, and Jose’s 179-year, and Landscheidt’s 166-year cycle, there should be enough cyclomania to go around to fit anything at all.
Hi Leif, and Happy New Year!
With all the bases covered, one of these predictions might even be correct! Then we’ll have to decide whether it was just a random shot in the dark, or if there was a scientific basis.
Of course then same might be said of you and Hathaway re SC24 🙂 (Joke – Easy now!)
I asked Tim Patterson in 2002 when the next cooling cycle would start, and he guessed 2020-2030, based on his paleoclimatology research and the Gleissberg Cycle. Maybe we’re a few years late…
I’ve tried to make sense of these cyclical analyses, without much success. Others believe they have reached some understanding of the statistics and the processes involved – time will tell.
All this is of considerable academic interest to me, but my core conclusion remains unchanged: Climate change is naturaland cyclical and CO2 is an insignificant driver of global warming.
I think it is safe to conclude that the sensitivity of Earth’s temperature to CO2 is insignificant.
Further, we cannot even say for certain that humankind is causing the increase in atmospheric CO2 – it is possible that this too is largely natural.
The AIRS CO2 animation is worth watching, at
http://svs.gsfc.nasa.gov/vis/a000000/a003500/a003562/carbonDioxideSequence2002_2008_at15fps.mp4
Best, Allan

January 15, 2009 7:57 pm

Allan M R MacRae (19:49:11) :
Climate change is natural and cyclical
I would not disagree with that, except for downplaying the ‘cyclic’ bit. I don’t think there is strict cyclicity, just that it ‘goes up and down’.

the_Butcher
January 15, 2009 8:00 pm

The Sea Ice extent is lining up with 2004 now.
Interesting to see if it passes the 2008 on the next month (Feb).
http://www.ijis.iarc.uaf.edu/seaice/extent/AMSRE_Sea_Ice_Extent.png

January 15, 2009 8:10 pm

Edward Morgan (17:38:12) :
Did you check out the Jager report that is supposed disprove the angular momentum theory. If anything it supports the theory and is weak commentary at best.
some excerpts:
The acceleration, i.e. the force per gram of matter is then found to be a inert = 5 × 10⁻⁷ cm s−2, which is nearly 20 times the tidal acceleration. This result by itself justifies Jose’s approach, but it does not quantitatively address the mechanism of solar variability, nor the polarity reversals.
Jager fails to understand the mechanics of angular momentum and picks an average figure from Jose’s work, calculates the acceleration then compares it to the tachocline level, which he thinks is too small a magnitude to effect the Sun (how would he know). Was he cherry picking when he chose the tachocline and not the centre? and he assumes that acceleration is the only possible effect from angular momentum. The biggest effect on the Sun is when angular momentum is at its lowest.
The mechanism of solar variability IS addressed and my graph is one example. Others have addressed the polarity reversals through the highs and lows of angular momentum or most aligned days of J+V+E, but even it it was discovered to be a totally internal mechanism it should not exclude other actions that can control variability or grand minima.
They are too small by a very large factor to be able to cause the observed accelerations. Therefore they cannot significantly influence the solar dynamo unless a completely different hypothesis is forwarded that would, first, invalidate the present dynamo theory
So one theory has to be disproved before another can be right….poor logic.
Conversely, it must be noted that the present dynamo theories, although well
describing the periodicities and the polarity reversal of solar activity, are NOT yet able to quantitatively explain the 11- and 22-year cycles, nor the other observed quasicycles. Therefore quantitative explanations need to be found for the quasi-cyclic behavior of solar activity.

Nor can the dynamo theories explain the modulation flow of the sunspot cycles or get anywhere near predicting grand minima events or cycles like SC20. Jager fails to mention the perfect correlations of angular momentum with the Dalton, Maunder, Sporer, Wolf, Oort and also the Medieval Warm Period which was a period of low disturbance and also the perfect correlation in the actual grand minima modulation. I challenge anyone to disprove that fact.
If thats the best science can do to discredit planetary influence I would say we have a long way to go.

January 15, 2009 10:20 pm

nobwainer (Geoff Sharp) (20:10:40) :
Was he cherry picking when he chose the tachocline and not the centre? and he assumes that acceleration is the only possible effect from angular momentum.
DeJager assumes that the reader knows a bit of physics. For anything to have effect there must be forces at work, and force is proportional to acceleration [Newton’s 2nd law]. The tachocline was picked because that is where the sunspot dynamo works, but he also shows that this choice is not critical. At the center the accelerations are zero anyway.
If thats the best science can do to discredit planetary influence I would say we have a long way to go.
there is some truth to that. 52% of Americans [or some number like that] do not understand or believe evolution or that the Earth is not just 6000 years old. Science also has a long way to go to reach these people. I fear that in all these cases, science may not get there.

E.M.Smith
Editor
January 15, 2009 10:40 pm

Roger Sowell (18:47:54) :
Richard Sharpe (sorry, I don’t know how to make things in italics yet)

Easy. Put: OPENAGLE i CLOSEANGLE in front of what you want to italisize. To end the italic range put OPENANGLE SLASH i CLOSEANGLE. See the list of hypertext tags just above the text entry form for an example. You can also see how to make things bold with a ‘b’ or block quoted with a ‘blockquote’.

January 15, 2009 11:43 pm

E.M. Smith
Thanks!

Edward Morgan
January 16, 2009 4:25 am

Leif, Of course a rabbit can’t move a freight train, is this analogy accurate enough though? Why does the sun move in a pattern consistent enough to link some of its movement with Jupiter and the centre of mass of the solar system. The sun and Jupiter are in a kind of balance connected with their masses so why can’t certain more conjunctive positions of the planets (more mass in one direction at that point) move slightly the centre of gravity of the solar system (one sun radii lets say) its not that much but enough it stands out to me to cause different effects on the sun including slowing its spin. I mean do you not agree that Jupiter and the planets when aligned move the sun at all and that the sun moves around the centre of the mass of the solar system? Ed

Tim Clark
January 16, 2009 5:58 am

E.M.Smith (18:19:10) :
(especially if my Uncle is talking 😉

That trait appears to be familial and obviously reccurs in each succeeding generation.
Does anyone have a link to a historical wind distribution and duration chart, site, data? (Hey! Real weather stuff!)
Climatic Wind Data for the United States
Abstract: Wind data in this summary were extracted from the NCDC’s Edited Local Climatological Data publication (C00128), Air Force and Navy climatic briefs, and other sources. The total period of this summary is 1930- 1996, though the period of record (POR) for which wind data is summarized varies for individual locations, and may begin and end at any time during the 1930- 1996 period. Wind summaries from a total of 321 stations from all U.S. states are presented. The wind elements summarized by month and overall annual values include prevailing wind directions (given in compass points), mean wind speeds, and either peak gusts (in miles per hour), fastest-mile, or highest 5-second winds. Peak wind types may be combined to reflect the highest reported wind. Updated wind data for many sites can be obtained from the post 1996 Edited Local Climatological Data – Annual publications.
http://www.ncdc.noaa.gov/oa/documentlibrary/other-doc.html#C00518
A rather trustworthy source ;<0.

Allan M R MacRae
January 16, 2009 7:55 am

Leif Svalgaard (19:57:40) :
Allan M R MacRae (19:49:11) :
Climate change is natural and cyclical
I would not disagree with that, except for downplaying the ‘cyclic’ bit. I don’t think there is strict cyclicity, just that it ‘goes up and down’.
Agree the up-and-down cycles are less than perfect – although there is something of interest in the PDO and/or Gleissberg – and possibly also in longer cycles but I haven’t looked at them.
I published Tim Patterson’s global cooling prediction (for 2020-2030) in 2002 – but perhaps we were a bit late…
Here is a note received this morning from a friend in Spain:
“The whole of Europe went through a big chill. Last week it’s been 20º below zero in Cantabría, Spain, and traffic collapsed in snowed-in Madrid. Same chaos in Marseille, with 30 cm of snow in the streets…
… Will we heat our frigid homes with wind powered electricity costing as much as the rent ? Or solar-powered juice going for twice that amount ?”
It is particularly distressing for me to see this cold winter misery unfolding, as Europeans’ inadequate alternative energy systems fail to keep them warm.
This disastrous scenario was not only predictable, it was predicted – by Sallie Baliunas (Harvard U Astrophysicist), Tim Patterson (Carleton U Paleoclimatologist) and me in September 2002, at:
http://www.apegga.org/Members/Publications/peggs/WEB11_02/kyoto_pt.htm
“The ultimate agenda of pro-Kyoto advocates is to eliminate fossil fuels, but this would result in a catastrophic shortfall in global energy supply – the wasteful, inefficient energy solutions proposed by Kyoto advocates simply cannot replace fossil fuels.”
This egregious error in energy policy is costing lives, and was entirely avoidable. The enviro-scare movement and foolish politicians are primarily responsible.
Another point we made in the same article, that Europeans may wish to consider as they huddle and freeze.
“Climate science does not support the theory of catastrophic human-made global warming – the alleged warming crisis does not exist. ”
Best regards, Allan

Jeff Alberts
January 16, 2009 9:42 am

there is some truth to that. 52% of Americans [or some number like that] do not understand or believe evolution or that the Earth is not just 6000 years old. Science also has a long way to go to reach these people. I fear that in all these cases, science may not get there.

Science will never reach them. We can only hope that later generations will not be so brainwashed from birth.

January 16, 2009 10:16 am

Jeff Alberts (09:42:07) :
Science will never reach them.
And neither the planetary folks.

Will
January 16, 2009 11:13 am

I’m looking for a .csv file on the ’79-’00 gold standard ice average. Anybody know who might have such a thing available?

E.M.Smith
Editor
January 16, 2009 12:04 pm

Allan M R MacRae (07:55:38) :
Here is a note received this morning from a friend in Spain:
“The whole of Europe went through a big chill. […]
It is particularly distressing for me to see this cold winter misery unfolding, as Europeans’ inadequate alternative energy systems fail to keep them warm.[…]
This egregious error in energy policy is costing lives, and was entirely avoidable. The enviro-scare movement and foolish politicians are primarily responsible.

“No one expects the Spanish Inquisition …” 8-}

E.M.Smith
Editor
January 16, 2009 12:10 pm

Tim Clark (05:58:42) :

E.M.Smith (18:19:10) :
(especially if my Uncle is talking 😉

That trait appears to be familial and obviously reccurs in each succeeding generation.
You left off the smiley. The smiley. You now, the …
Did I forget to mention that the uncle is from my wife’s family?… It must be contagious rather than familial. 😉
Thanks for the wind data!

E.M.Smith
Editor
January 16, 2009 12:15 pm

Roger Sowell (23:43:40) :
E.M. Smith
Thanks!

You are most welcome. BTW, ‘strike’ gives you strikeout font… Useful for lawyers…

Jeff Alberts
January 16, 2009 2:30 pm

Leif Svalgaard (10:16:38) :
Jeff Alberts (09:42:07) :
Science will never reach them.
And neither the planetary folks.

Sadly true.

January 16, 2009 2:54 pm

Edward Morgan (04:25:32) :
I mean do you not agree that Jupiter and the planets when aligned move the sun at all and that the sun moves around the centre of the mass of the solar system? Ed
This is another area not covered in Jagers so called paper, its something explained away by others as having no effect because we are free falling through space or use “flat eather” type ridicule as we see from Svalgaard on a constant basis. But its interesting that the Sun follows 2 distinct paths, 1 wide loop of around 2 solar radius formed by J+S together and 2 a much smaller loop that crosses back over itself formed by J+S opposed where the Sun is much closer to the centre of the solar system. When you look at the pattern the Sun is pulled all over the place. The Sun spends approx 10 yrs in each loop which could be a rhythm or resonance setting up the solar cycles and polarity changes. Outside of grand minima period this is exactly the type of solar cyclic motion and timing involved. But of course N+U come along approx every 178 yrs to spoil the party, creating max and min momentum that completely changes the ordered path the Sun was following. This also coincides EXACTLY with grand minima….everytime.
Science cant deny these facts, but instead the majority hide behind ridicule and arguments that it “cant be real” because they dont have a scientific argument right now and the facts go against all the work they have done so far…its akin to the AGW crowd and the IPCC trying to pull the wool over our eyes.

Edward Morgan
January 16, 2009 3:57 pm

Leif,
You never responded to the points made in my last post and you seem to have resorted to ridicule. I could think of a million uses of Landscheidt’s findings which could benefit those who know. If you’ve ever read the Christ Conspiracy by Acharya S (a great book) you will find all you need to know about how astrology has been hidden from the masses for a long time and used secretly against them. The science/art ended not because it was disproven but due to propaganda and reductionist thinking, the disbelief in it today is not through thorough study and testing but a backwash from that campaign. I feel people like Seymour and Landscheidt and others who follow true scientific discovery are really brave and outstanding people. How do you see yourself?
Would Al Gore have managed to effect so many if we knew it was natural cycles connected to the planets? In a way we have a new inquisition with modern myths like Global Warming instead of a belief in a literal godman. Many would never believe today in some of those old myths but of course if you profess to have the truth about AGW and through all sorts of negative tactics, educational and media control, you can dupe the people into believing and can wield a great deal of power. This is an insult to the wonderful people of this planet and completely not necessary. Ed

January 16, 2009 4:21 pm

Edward Morgan (15:57:46) :
You never responded to the points made in my last post
Because we have covered that ground so many times before
you seem to have resorted to ridicule.
You seem to do a good job on your own:
“If you’ve ever read the Christ Conspiracy by Acharya S you will find all you need to know about how astrology has been hidden from the masses for a long time and used secretly against them.”

Edward Morgan
January 16, 2009 7:53 pm

Leif. That’s unfair to Acharya S. Maybe I should forward that to her as this is such a popular site. Sounds like slander.
You left the debate before it was through but you always do that when we get to the nitty gritty. Ed

January 16, 2009 8:42 pm

Edward Morgan (19:53:04) :
You left the debate before it was through but you always do that when we get to the nitty gritty. Ed
I was also looking for an answer ….but we both know sometimes the Facts get in the way.

Edward Morgan
January 16, 2009 11:02 pm

nobwainer, me too.
I had an idea helped by Percy Seymour that the reason when the sun is slowed down in its spin it is more active was that the braids around the sun are released somewhat by a slower turn allowing things to be released. Speeding up pulls them tighter, more horizontal in their loops. See fig 5 here http://www.tmgnow.com/repository/solar/percyseymour1.html you probably already know this. Ed

January 17, 2009 12:28 am

nobwainer (Geoff Sharp) (20:42:59) :
Edward Morgan (19:53:04) :
You left the debate before it was through but you always do that when we get to the nitty gritty. Ed
I was also looking for an answer ….but we both know sometimes the Facts get in the way.

Well, if we continued, what would you consider to be a convincing proof [that can be given today] that the planetary theory is invalid? For a theory to be scientific it must be falsifiable [an opinion held by most scientists and philosophers], so what aspects of the planetary theory can be falsified today?

January 17, 2009 2:55 am

Leif Svalgaard (00:28:38) :
We just want you to answer the question: I mean do you not agree that Jupiter and the planets when aligned move the sun at all and that the sun moves around the centre of the mass of the solar system? Ed

Allan M R MacRae
January 17, 2009 6:50 am

Further on successful predictions:
Europeans are freezing from cold temperatures and the results of incompetent energy policies, since they have relied on intermittent wind power when they really needed fossil fuels or nuclear power to survive.
Here is one of my newspaper articles from 2002. It is a much more accurate indicator of recent climatic events than the IPCC reports, and includes a prediction of global cooling. The global cooling predictions was provided in a phone conversation with paleoclimatologist Tim Patterson, who based his comments on the Gleissberg Cycle. We may or may not be a bit late in this prediction.
My predictions on energy are proving correct. If I were to make any changes, I would be more negative on wind power and corn ethanol than in this article – based on further research on the very low “Substitution Factor” of wind power, and the very low energy efficiency of corn ethanol. In general, I do not support energy technologies that require ongoing operating subsidies, that mask the fact that these technologies are wasteful and uneconomic.
It is deeply regrettable that politicians worldwide have been so badly advised on this critical issue for the survival of our societies.
Best regards, Allan
____________________________________________________________________
Kyoto hot air can’t replace fossil fuels
Allan M.R. MacRae
Calgary Herald
September 1, 2002
The Kyoto Accord on climate change is probably the most poorly crafted piece of legislative incompetence in recent times.
First, the science of climate change, the treaty’s fundamental foundation, is not even remotely settled. There is even strong evidence that human activity is not causing serious global warming.
The world has been a lot warmer and cooler in the past, long before we ever started burning fossil fuels. From about 900 to 1300 AD, during the Medieval Warm Period or Medieval Optimum, the Earth was warmer than it is today.
Temperatures are now recovering from the Little Ice Age that occurred from about 1300 to 1900, when the world was significantly cooler. Cold temperatures are known to have caused great misery — crop failures and starvation were common.
Also, Kyoto activists’ wild claims of more extreme weather events in response to global warming are simply unsupported by science. Contrary to pro-Kyoto rhetoric, history confirms that human society does far better in warm periods than in cooler times.
Over the past one thousand years, global temperatures exhibited strong correlation with variations in the sun’s activity. This warming and cooling was certainly not caused by manmade variations in atmospheric CO2, because fossil fuel use was insignificant until the 20th century.
Temperatures in the 20th century also correlate poorly with atmospheric CO2 levels, which increased throughout the century. However, much of the observed warming in the 20th century occurred before 1940, there was cooling from 1940 to 1975 and more warming after 1975. Since 80 per cent of manmade CO2 was produced after 1940, why did much of the warming occur before that time? Also, why did the cooling occur between 1940 and 1975 while CO2 levels were increasing? Again, these warming and cooling trends correlate well with variations in solar activity.
Only since 1975 does warming correlate with increased CO2, but solar activity also increased during this period. This warming has only been measured at the earth’s surface, and satellites have measured little or no warming at altitudes of 1.5 to eight kilometres. This pattern is inconsistent with CO2 being the primary driver for warming.
If solar activity is the main driver of surface temperature rather than CO2, we should begin the next cooling period by 2020 to 2030.
The last big Ice Age, when Canada was covered by a one-kilometre-thick ice sheet, ended only about 10,000 years ago, and another big one could start at any time in the next 5,000 years. Mankind clearly didn’t cause the rise and fall of the last big Ice Age, and we may not have any ability to control the next big one either.
It appears that increased CO2 is only a minor contributor to global warming. Even knowing this is true, some Kyoto advocates have tried to stifle the scientific debate by deliberate misinformation and bullying tactics. They claim to be environmentalists — why do they suppress the truth about environmental science?
Some environmental groups supporting Kyoto also lack transparency in their funding sources and have serious conflicts of interest. Perhaps they are more interested in extorting funds from a frightened public than they are in revealing the truth.
Do they not know or care that Kyoto will actually hurt the global environment by causing energy-intensive industries to move to developing countries, which are exempt from Kyoto emission limits and do not control even the most harmful forms of pollution?
The Canadian government wants to meet its Kyoto targets by paying billions of dollars a year for CO2 credits to the former Soviet Union. For decades, the former Soviet Union has been the world’s greatest waster of energy. Yet it will receive billions in free CO2 credits because of the flawed structure of Kyoto. No possible good can come to the environment by this massive transfer of wealth from Canadians to the former Soviet Union.
Kyoto would be ineffective even if the pro-Kyoto science was correct, reducing projected warming by a mere 0.06 degrees Celsius over the next half-century. Consequently, we would need at least 10 Kyoto’s to stop alleged global warming. This would require a virtual elimination of fossil fuels from our energy system. Environment Canada knows this but doesn’t really want to tell you all the economic bad news just yet.
What would the economic impact of 10 Kyoto’s be? Think in terms of 10 times the devastating impact of the oil crisis of the 1970s (remember high unemployment, stagflation and 20 per cent mortgage rates) or 10 times the impact of Canada’s destructive and wasteful National Energy Program. Be prepared for some huge and unpleasant changes in the way you live.
Fossil fuels (oil, natural gas and coal) account for 87 per cent of the world’s primary energy consumption, with 13 per cent coming from nuclear and hydroelectricity. Is it possible to replace such an enormous quantity of fossil fuels?
Hydrogen is not an answer — it is a clean secondary energy currency like electricity, but it is made from primary energy such as fossil fuels, nuclear or hydro.
Kyoto advocates want expanded renewable energy such as geothermal, wind, and solar power and biomass to provide our future needs. Is this possible?
In 2001, there was a total global installed capacity of eight gigawatts (GW) of geothermal power and 25 GW of wind power. Even assuming the wind blows all the time, this equals only one quarter of one per cent of worldwide primary energy consumption. The contribution of solar electrical power generation is so small as to be inconsequential. To replace fossil fuels, we would need to increase all these renewables by a staggering 33,000 per cent.
Of course, wind doesn’t blow all the time — wind power works best as a small part of an electrical distribution system, where other sources provide the base and peak power. Although wind power has made recent gains, it will probably remain a small contributor to our overall energy needs. A 1,000-megawatt wind farm would cover a land area of 1,036 square kilometres, while the same-size surface coal mine and power plant complex covers about 36 square kilometres. Wind farms cover a much bigger area, are visible for miles due to the height of the towers and kill large numbers of birds.
What about solar? The electricity generated by a photovoltaic solar cell in its entire lifetime does not add up to the energy used to manufacture it, not to mention the requirement for vast areas for solar farms. These solar cells make sense only in limited special applications or in remote locations.
Hydroelectric power is another renewable, but environmental activists don’t want more hydro because it dams rivers.
What about biomass solutions such as ethanol? Canada, the United States and a few other countries may have available crop land for ethanol to partially meet our local needs, but it is clearly not a global solution.
Many developing countries will reject renewable energy due to higher costs, since renewables usually require subsidies to compete with fossil fuels.
Conventional nuclear fission or, someday, fusion are the only two prospects that could conceivably replace fossil fuels. But Kyoto activists hate nuclear.
Conservation is a good solution, but Canada has been improving its energy efficiency for decades, in response to rising energy prices. Significant improvements have been achieved in heating and insulation of homes, automotive mileage and industrial energy efficiency. However, Canadians live in a cold climate and our country is vast. There are practical limits to what we can achieve through energy conservation.
So where will all the energy come from if we eliminate oil, natural gas and coal? Kyoto supporters have provided no practical answers, they just want to ratify this flawed treaty. It would be nice if our energy supply solutions were simple, but they’re not. In the long run, if we implement Kyoto we will have only two choices — destroy our economy and suffer massive job losses and power blackouts, or break the terms of Kyoto, which will be international law.
Instead of Kyoto, a new global anti-pollution initiative should be drafted by people who have a much better understanding of science, industry and the environment. It should focus, not on global warming and CO2, but on real atmospheric pollutants such as SO2, NOx and particulates as well as pollutants in the water and soil — and no country should be exempt.
Then there might be a chance to actually improve the environment, rather than making it worse and wasting billions on the fatally flawed Kyoto Accord.
______________________________________________________________________
Allan M.R. MacRae is a professional engineer, investment banker and environmentalist.

January 17, 2009 7:37 am

nobwainer (Geoff Sharp) (02:55:47) :
We just want you to answer the question: I mean do you not agree that Jupiter and the planets when aligned move the sun at all and that the sun moves around the centre of the mass of the solar system?
Of course it does [although one has to be a bit careful with the words]. So, now I have a question for you: does the Earth move around the center of mass of the solar system? What does that movement do to the distance between the Sun and the Earth?
And I just want to you to answer this question:
“what would you consider to be a convincing proof [that can be given today] that the planetary theory is invalid? […] what aspects of the planetary theory can be falsified today?

Edward Morgan
January 17, 2009 9:23 am

Leif, said, “what would you consider to be a convincing proof [that can be given today] that the planetary theory is invalid?”
There would be many ways of doing this. Firstly I think you agree that the sun’s spin is slowed and speeded up by the movements of Jupiter and the other planets in various configurations due to a change in the angular momentum of the sun.
I think you also agree that magnetic canals are wound up by the spin becoming more parallel to the equator the quicker it spins.
Do you however agree that the change in spin rate would loosen and tighten the canals as the sun slows and speeds up respectively?
This releases pressure when slowing and gains pressure when increasing allowing in the first instance energy to be released. Like tightening bands around a sponge. Through the loosening a motion is set going in the suns plasma that has a momentum which enables some of it in the form of x-rays, flares, e.t.c to burst forth beyond the magnetic canal boundaries.
If you can prove that tightening magnetic canals don’t increase pressure and that loosening canals don’t decrease then this would prove that no energetic change can be caused by this process or if you can prove that no such loosening tightening takes place then this would disprove it also.
Ed.

January 17, 2009 9:27 am

Leif Svalgaard (07:37:21)
Of course it does
OK we are getting somewhere…we all know you had to agree with this outcome. The next question is a bit harder. If we all agree the sun is pulled around the centre of the solar system in a very irregular pattern, can you give a 100% guarantee that this motion has NO effect on the Sun.
And I just want to you to answer this question:
“what would you consider to be a convincing proof [that can be given today] that the planetary theory is invalid? […] what aspects of the planetary theory can be falsified today?

Such a weird question….this is an area of science that wouldnt have a clue whats going on. How can we be so presumptuous to prove anything incorrect in these times. The dynamo theory has no answers for the length of the Schwabe and Hale cycle, the modulation of every solar cycle and not an idea on grand minima. What would you consider proof that the dynamo theory is invalid?

Richard Sharpe
January 17, 2009 10:11 am

nobwainer says:

Such a weird question….this is an area of science that wouldnt have a clue whats going on. How can we be so presumptuous to prove anything incorrect in these times. The dynamo theory has no answers for the length of the Schwabe and Hale cycle, the modulation of every solar cycle and not an idea on grand minima. What would you consider proof that the dynamo theory is invalid?

I think you have fallen for Leif’s cleverly laid trap. If you cannot state what would falsify your “theory” then you are not engaging in science. I suspect that Leif can state precisely those observations that would falsify the solar dynamo theory.

January 17, 2009 10:35 am

Edward Morgan (09:23:37) :
I think you agree that the sun’s spin is slowed and speeded up by the movements of Jupiter and the other planets in various configurations due to a change in the angular momentum of the sun.
No, not at all. Angular momentum is with respect to an origin or axis. If angular momentum with respect to one origin [barycenter] changes that has no corresponding effect on angular momentum around the other origin [center of Sun].
Do you however agree that the change in spin rate would loosen and tighten the canals as the sun slows and speeds up respectively?
As the Sun doesn’t spin up/down the way you think, the answer to this doesn’t matter. And any effect goes the other way: more magnetic activity slows the Sun down.
If you can prove that tightening magnetic canals don’t increase pressure and that loosening canals don’t decrease then this would prove that no energetic change can be caused by this process or if you can prove that no such loosening tightening takes place then this would disprove it also.
If you increase the magnetic field, the plasma density decreases
nobwainer (Geoff Sharp) (09:27:33) :
If we all agree the sun is pulled around the centre of the solar system in a very irregular pattern, can you give a 100% guarantee that this motion has NO effect on the Sun.
The Sun is not ‘pulled around’, it is in free fall and feels no forces from that. And the word ‘NO’ is meaningless as stated. What matters is how much. If something moves 1 millimeter, there is some [tiny, tiny, tiny] effect which cannot be taken seriously.
Such a weird question
This question is central to all science. It is what sets science apart from religion or astrology.
The dynamo theory has no answers for the length of the Schwabe and Hale cycle,
the Hale cycle is just twice the Schwabe cycle, and the length of that is set by the speed of the meridional circulation which in turn may be set by a temperature difference between pole and equator.
The dynamo theory has no answers for the modulation of every solar cycle
the strength of the polar fields [itself a result of a random walk] controls the modulation of the solar cycle.
and not an idea on grand minima.
Solar Grand Minima and Random Fluctuations in Dynamo Parameters, Solar Physics, Issue Volume 250, Number 2 / August, 2008 DOI 10.1007/s11207-008-9202-z, Pages 221-234
D. Moss, D. Sokoloff, I. Usoskin and V. Tutubalin
Abstract We consider to what extent the long-term dynamics of cyclic solar activity in the form of Grand Minima can be associated with random fluctuations of the parameters governing the solar dynamo. We consider fluctuations of the alpha coefficient in the conventional Parker migratory dynamo, and also in slightly more sophisticated dynamo models, and demonstrate that they can mimic the gross features of the phenomenon of the occurrence of Grand Minima over suitable parameter ranges. The temporal distribution of these Grand Minima appears chaotic, with a more or less exponential waiting time distribution, typical of Poisson processes. In contrast, however, the available reconstruction of Grand Minima statistics based on cosmogenic isotope data demonstrates substantial deviations from this exponential law. We were unable to reproduce the non-Poissonic tail of the waiting time distribution either in the framework of a simple alpha-quenched Parker model or in its straightforward generalization, nor in simple models with feedback on the differential rotation. We suggest that the disagreement may only be apparent and is plausibly related to the limited observational data, and that the observations and results of numerical modeling can be consistent and represent physically similar dynamo regimes.
What would you consider proof that the dynamo theory is invalid?
That the Hale polarity law is violated.
My question still stands unanswered…

January 17, 2009 10:42 am

Richard Sharpe (10:11:40) :
So we have this situation where no one can claim they have the science proved. If we cant prove it, how can we disprove it? seems totally illogical to me. I will wait to see what Svalgaard comes up with on his theory on what would make the dynamo theory invalid.
BTW I have an uncle who is Richard Sharp from the UK, obviously you are not the same person….the Sharp name does crop up quite a bit in these forums.

Richard Sharpe
January 17, 2009 11:04 am

nobrainer says:

BTW I have an uncle who is Richard Sharp from the UK, obviously you are not the same person….the Sharp name does crop up quite a bit in these forums.

Please note, my name is spelled Sharpe.
Since I acquired it in roughly the same way as the main character in the series by Bernard Cornwall, I am quite proud of it.

Richard Sharpe
January 17, 2009 11:06 am

nobwainer says:

So we have this situation where no one can claim they have the science proved. If we cant prove it, how can we disprove it?

I think you fail to understand the endeavour that is Science.
We can never prove scientific theories, only disprove those that are wrong. We continually strive to improve the accuracy and utility of our theories.

Edward Morgan
January 17, 2009 11:24 am

Leif said,
“No, not at all. Angular momentum is with respect to an origin or axis. If angular momentum with respect to one origin [barycenter] changes that has no corresponding effect on angular momentum around the other origin [center of Sun].”
The curve ball (maybe you will respond to it this time) spinning around and towards the hitter. If I could increase the forward movement of the ball at this moment but not the spin there would be an increasing vector forward which would slow down the spin. As it is more forward than around in comparison to the first snapshot. Forces like this are acting on the sun one around (the spin) and one orbiting.
Leif said “As the Sun doesn’t spin up/down the way you think, the answer to this doesn’t matter. And any effect goes the other way: more magnetic activity slows the Sun down.”
The first point covers this.
Ed said to Leif,
“If you can prove that tightening magnetic canals don’t increase pressure and that loosening canals don’t decrease then this would prove that no energetic change can be caused by this process or if you can prove that no such loosening tightening takes place then this would disprove it also.”
You didn’t disprove this you just stated it wasn’t the case. Point out where and how each point of mine is wrong. Science is this as you say.
Leif said, “The Sun is not ‘pulled around’”
Leif you said a bit back that “of course it does” Nobwainer was talking about the movement of the sun effected by Jupiter around the centre of mass of the solar system.
Ed

January 17, 2009 11:27 am

Leif Svalgaard (10:35:55) :
The Sun is not ‘pulled around’, it is in free fall and feels no forces from that. And the word ‘NO’ is meaningless as stated.
Ok…so you cant give a guarantee. Enough said, nothing is invalidated.
the Hale cycle is just twice the Schwabe cycle, and the length of that is set by the speed of the meridional circulation which in turn may be set by a temperature difference between pole and equator.
I am looking for a dynamo theory that controls the Schwabe cycle length…you and I both know that doesnt exist as stated by your reference Jager.
the strength of the polar fields [itself a result of a random walk] controls the modulation of the solar cycle.
Great piece of science that one…the sunspot records and C14 records over 11000 yrs certainly show a less than random walk.
Solar Grand Minima and Random Fluctuations in Dynamo Parameters,
You can throw any papers you like at me…but you know you have no answers to the frequency and modulation of grand minima.
That the Hale polarity law is violated.
And if your Hale polarity law is proved by another function?….that is a weak argument. The polarity change is just one aspect of the solar function, it is not the make or break solution.
My question still stands unanswered…
By my reckoning there is 2 questions outstanding.
What does that movement do to the distance between the Sun and the Earth?
Good question, I would think no distance change, the Earth follows the path of the Sun.
what would you consider to be a convincing proof [that can be given today] that the planetary theory is invalid? […] what aspects of the planetary theory can be falsified today?
[that can be given today] Your answer re the Hale cycle cant be quantified today, so we are not on even ground. But I will be more realistic, if we dont experience grand minimum in SC24/25 and the J+S alignment happens before cycle max on both occasions the theory is shot.

January 17, 2009 11:31 am

Richard Sharpe (11:06:56) :
We can never prove scientific theories,
Mighty big statement there?

Edward Morgan
January 17, 2009 12:18 pm

Leif asked Nobwainer
“What does that movement do to the distance between the Sun and the Earth?”
Nobwainer replied “Good question, I would think no distance change, the Earth follows the path of the Sun.”
Ed says it changes the distance.

January 17, 2009 1:27 pm

Edward Morgan (11:24:06) :
The curve ball (maybe you will respond to it this time) spinning around and towards the hitter. If I could increase the forward movement of the ball at this moment but not the spin there would be an increasing vector forward which would slow down the spin.
If the pitcher was at the top of a very tall tower and gave the ball a spin throwing it towards the ground, the forward movement would be faster and faster, you are saying that the spin would be slowed down and eventually stop if the tower is tall enough?
more magnetic activity slows the Sun down.
is an observational fact.
“If you can prove that tightening magnetic canals don’t increase pressure
is too vague to comment on. What does ‘tightening’ mean? where is the canal? pressure measured where?
Leif said, “The Sun is not ‘pulled around’”
Leif you said a bit back that “of course it does”

You misunderstand orbital mechanics. To pull is to exert a force and there are no forces involved. The planets [and the Sun] are pulled or pushed around in their orbits.
nobwainer (Geoff Sharp) (11:27:01) :
Ok…so you cant give a guarantee. Enough said, nothing is invalidated. I can give a guarantee that no measurable effect arises.
I am looking for a dynamo theory that controls the Schwabe cycle length…you and I both know that doesnt exist as stated by your reference Jager.
http://www.iiap.res.in/PostDocuments/DibyenduNandy_4Dec07.pdf page 24 explains what is involved and what control what.
Great piece of science that one…the sunspot records and C14 records over 11000 yrs certainly show a less than random walk.
Even if they do [and people find that don’t] the issue was how dynamo theory explains the modulation from cycle to cycle.
You can throw any papers you like at me
Papers are mostly the result of serious scientific work. If you are impervious to them [don’t read them, don’t understand them, disregard them on the basis that they don’t fit dogma, whatever…] then it indeed difficult to have a serious discussion.
‘That the Hale polarity law is violated.”
And if your Hale polarity law is proved by another function?….that is a weak argument. The polarity change is just one aspect of the solar function, it is not the make or break solution.

In dynamo there there is no other function to provide that, and the question was what would disprove dynamo theory. For me, a violation of the Hale law would be enough.
“What does that movement do to the distance between the Sun and the Earth?
Good question, I would think no distance change, the Earth follows the path of the Sun.

So, does the Earth not orbit the barycenter? Does Jupiter? Would Jupiter also just follow the Sun? Is the law of gravity different for the Earth and Jupiter?
if we dont experience grand minimum in SC24/25 and the J+S alignment happens before cycle max on both occasions the theory is shot.
To quantify this give the size of the cycle that makes it qualify for a Grand minimum. Cycle 14 was 64, so a Grand Minimum would be smaller than that; Would both 24 and 25 have to be smaller than the Grand minimum limit or only one of them? when are the two J+S alignments?

Richard Sharpe
January 17, 2009 1:39 pm

nobwainer said:

Richard Sharpe (11:06:56) :

We can never prove scientific theories,

Mighty big statement there?

See, for example: Einstein’s statement.
Note, I was using prove in the normal, every day sense, which is closer to the mathematical version of prove than the scientific version (if it exists, as I suspect they tend to say “this experimental result/observation supports …”
Please show that you understand Einstein’s statement.

January 17, 2009 1:41 pm

Correcting a typo:
Leif said, “The Sun is not ‘pulled around’”
Leif you said a bit back that “of course it does”
You misunderstand orbital mechanics. To pull is to exert a force and there are no forces involved. The planets [and the Sun] are NOT pulled or pushed around in their orbits.

Edward Morgan
January 17, 2009 1:56 pm

Leif, you agreed that the centre of mass of the solar system changes and that this creates changes in the movements of the planets. That is what Nobwainer and me are talking about.
Don’t disappear on my other points. Ed

Edward Morgan
January 17, 2009 1:56 pm

I see you have answered them. I’ll take a look.

January 17, 2009 2:12 pm

Edward Morgan (13:56:05) :
Leif, you agreed that the centre of mass of the solar system changes and that this creates changes in the movements of the planets. That is what Nobwainer and me are talking about.
The changes are with respect to the center, not to the bodies. But first can you and no-brain agree as to what you talking out? e.g. about the distance between the Sun and the Earth.

Edward Morgan
January 17, 2009 2:20 pm

Leif said,
“If the pitcher was at the top of a very tall tower and gave the ball a spin throwing it towards the ground, the forward movement would be faster and faster, you are saying that the spin would be slowed down and eventually stop if the tower is tall enough?”
It would slow down but not necessarily stop as this would depend on how fast you spinned it (on earth)
Leif said “If you can prove that tightening magnetic canals don’t increase pressure
is too vague to comment on. What does ‘tightening’ mean? where is the canal? pressure measured where?
Fig 5 here (again)
http://www.tmgnow.com/repository/solar/percyseymour1.html
pressure can be measured by the tightening caused by the spin and evidence of this is the occurrence in sync of the x-ray quieter times e.t.c
Pulled around means the changes in accordance with the planets to the Centre of gravity of the solar system, the effect on this moving whole.
Ed

Edward Morgan
January 17, 2009 2:26 pm

Leif said, The changes are with respect to the center, not to the bodies
Leif I am saying that when Jupiter and Saturn for example come into conjunction with centre of mass of the solar system and the sun is on the other side of the centre of mass of the solar system, the centre of mass changes as the planets are moving. Now this effects other planets too, its a constant exchange, the whole system is flux. Every bit effecting every other bit. That’s what we mean by pulled around. Ed

January 17, 2009 2:40 pm

Edward Morgan (14:20:50) :
“If the pitcher was at the top of a very tall tower and gave the ball a spin throwing it towards the ground, the forward movement would be faster and faster, you are saying that the spin would be slowed down and eventually stop if the tower is tall enough?”
It would slow down but not necessarily stop as this would depend on how fast you spinned it (on earth)
At a given spin there would then be height of the tower that would stop the spin. If it is not slowed down enough we just make the tower a bit higher. Right?
Leif said “If you can prove that tightening magnetic canals don’t increase pressure
is too vague to comment on. What does ‘tightening’ mean? where is the canal? pressure measured where?
Fig 5 here (again)
http://www.tmgnow.com/repository/solar/percyseymour1.html

does not mention pressure anywhere [except for two references to [terrestrial] atmospheric pressure], so the enaswer is not to be found in your reference, so you must elaborate.

Edward Morgan
January 17, 2009 3:30 pm

Leif said,
“At a given spin there would then be height of the tower that would stop the spin. If it is not slowed down enough we just make the tower a bit higher. Right?” Within the limited realm of the pitcher’s ability to spin, yes.
“elaborate”
The increased stretching of the lines as seen in the picture would increase the pressure.
Ed

January 17, 2009 4:35 pm

Leif Svalgaard (10:35:55) :
No, not at all. Angular momentum is with respect to an origin or axis. If angular momentum with respect to one origin [barycenter] changes that has no corresponding effect on angular momentum around the other origin [center of Sun].

Angular Momentum is a property of the solar system as such. It does not really care which origin you choose as reference. It is computed from the individual masses and orbital velocities of each object in the system. Then add the spin component of each object.
Angular momentum is rigorously preserved for the whole the solar system on the condition that no external torque is acting upon the system.
If one component contributing to the angular momentum is changing, something else within the system must be changing also to compensate and preserve the total angular momentum of the solar system.
http://www.astronomynotes.com/angmom/s1.htm

January 17, 2009 4:49 pm

Carsten Arnholm, Norway (16:35:17) :
If one component contributing to the angular momentum is changing, something else within the system must be changing also to compensate and preserve the total angular momentum of the solar system.
If the orbital angular momentum of the Sun changes because of its orbit around the barycenter, the orbital angular momentum of Jupiter [mostly] changes to compensate for that. The spin angular momentum of the Sun and of Jupiter and [very importantly – because we measure it very precisely] of the Earth do not change.

January 17, 2009 4:57 pm

Edward Morgan (15:30:32) :
“At a given spin there would then be height of the tower that would stop the spin. If it is not slowed down enough we just make the tower a bit higher. Right?” Within the limited realm of the pitcher’s ability to spin, yes.
Well, if the pitcher can’t spin, then your example goes out the window, so we assume he can spin and that his ability depends on his arm and other bodily things and not on the height of the tower. So, let’s make the tower higher still, now the ball would begin to spin the other way around, right? because the ‘forwards vector’ that changed the spin is still operating.
“elaborate”
The increased stretching of the lines as seen in the picture would increase the pressure.

Where would it increase the pressure? and the pressure of what?

Edward Morgan
January 17, 2009 5:25 pm

Leif said
“Well, if the pitcher can’t spin, then your example goes out the window, so we assume he can spin and that his ability depends on his arm and other bodily things and not on the height of the tower. So, let’s make the tower higher still, now the ball would begin to spin the other way around, right? because the ‘forwards vector’ that changed the spin is still operating.”
The pitcher can spin it is just limited because he is not infinite. That’s what I meant. The downward vector in your example would stop the spin because it is acting down and not around as long as the ball is spinning horizontal to the earth. It would not then go in the other direction.
Leif asked “Where would it increase the pressure? and the pressure of what?”
It would increase the pressure all around/over the sun and the pressure is of the gas.
Ed

January 17, 2009 7:38 pm

Edward Morgan (17:25:37) :
It would not then go in the other direction.
1st: it would not slow down the ball, and if it did it would eventually cause the ball to rotate the other way.
It would increase the pressure all around/over the sun and the pressure is of the gas.
No, it would not and it is not of the gas. The is magnetic pressure which is not of the gas. But, since there is no mention of pressure in the paper you cited, I think that you have come up with your own version. Unfortunately you have not shown that the winding up of the ‘canl’ would increase the gas pressure all over the Sun. You probably can’t see where you go wrong even when pointed out to you.

January 17, 2009 7:48 pm

Edward Morgan (14:26:19) :
I am saying that when Jupiter and Saturn for example come into conjunction with centre of mass of the solar system and the sun is on the other side of the centre of mass of the solar system, the centre of mass changes as the planets are moving. Now this effects other planets too
Take a look at http://www.leif.org/research/Barycenters.pdf
The first panel shows the Sun [yellow], Earth [green] and Jupiter [pink]. The barycenter is marked with a small purple square. The distance between the Earth and th Sun by the double-headed arrow.
The next panel shows when Saturn [blue] is added. that changes the position of the barycenter, but not of the other planets, in particular, the Sun-Earth distance stays the same.
The next panel shows what would happen if a distant large planet [perhaps 1000 time further away than Jupiter] is added: the barycenter now moves out away from the Sun even to the other side of Saturn. the position of the other planets are not altered and in particular then Sun-Earth distance stays the same.
The next panel shows what happens if Jupiter moves a bit: the barycenter moves with. The Sun-Earth distance stays the same.
In the last panel, jupiter has moved to the other side of the Sun. The barycenter has moved with and the Sun-Earth distance is unchanged. Can we all agree that this is what happens?

January 17, 2009 8:23 pm

Leif Svalgaard (19:38:07) :
1st: it would not slow down the ball, and if it did it would eventually cause the ball to rotate the other way.
The purpose of this exercise was to convince you that the forwards motion of the ball has not influence on its spin, but I guess I failed in that.

January 17, 2009 9:58 pm

Leif Svalgaard (13:27:13) :
To quantify this give the size of the cycle that makes it qualify for a Grand minimum. Cycle 14 was 64, so a Grand Minimum would be smaller than that; Would both 24 and 25 have to be smaller than the Grand minimum limit or only one of them? when are the two J+S alignments?
To disprove the angular momentum theory we would need to have a high cycle when all the conditions of the theory suggest otherwise. An SSN over 100 if SC24 cycle max is after 2012 and SC25 cycle max is after 2021 would qualify the theory busted in my opinion.

January 17, 2009 10:29 pm

Richard Sharpe (13:39:52) :
I prefer this quote from Einstein.
“Whoever undertakes to set himself up as a judge of Truth and Knowledge is shipwrecked by the laughter of the gods.”

Edward Morgan
January 18, 2009 4:27 am

Leif said,
“1st: it would not slow down the ball, and if it did it would eventually cause the ball to rotate the other way.”
I’m holding the ball I spin as I release it. It is horizontally balanced and is spinning horizontally. The force downward due to gravity accelerates it to a point where the friction with the atmosphere limits the downward force and a maximum speed is achieved. However there is a very slight increase in gravity’s pull as well (as we know the further away from the earth the less the pull of gravity.) this would cause a slight acceleration. Within the realms of the spin (perfectly horizontal) capable by the pitcher the spin would stop because the spin put on the ball is not continually applied and the force against the spin is (the atmosphere increasing slightly as we near the ground too) eventually if we could keep it horizontal and build a tower high enough the spin would stop. The downward pull of gravity is definitely against the HORIZONTAL spin in this example because of the atmosphere.
Leif, you seem to be saying that there is no friction like that in space.
Leif, for this to be correct
Take a look at http://www.leif.org/research/Barycenters.pdf
What would happen if your centre of mass moved. Your a structure now, move yours (what moves it) how do you react. The planets react too, they are connected, they are a structure moving.
Ed

Edward Morgan
January 18, 2009 7:16 am

If you took Saturn and Jupiter and put them on one side of the sun and from a fixed not orbiting viewing point looked at the positions then moved them to the other side you would see their effect on the sun. The solar system is held together by mass you move that mass around and everything moves.
REPLY: This thread is about polar sea ice – enough with the barycentric babble. – Anthony

Edward Morgan
January 18, 2009 7:20 am

It is these changing forces that are part of the sun’s changes.

Edward Morgan
January 18, 2009 7:53 am

Anthony, OK, but can I request at some point that the planets be a topic of discussion where we can freely debate this. Maybe a guest post on the subject. Please. Ed
REPLY: I’ll consider it, though I don’t give barycentric theory much credence. I think it is mostly a case of visualization of coincidental cycles. – Anthony

Pamela Gray
January 18, 2009 8:16 am

I get it. The only way that stuff coming from the Sun could have the power to heat up or cool down Earth in an appreciable way and that would not get buried in the stronger influences of the stuff we have on the Earth, such as oceans and jet stream patterns, would be to change the distance from the Sun to the Earth. The barycenter is one of those phenomena that some people think have an influence not just on the Sun, but ultimately on us, climatically. But if the distance between us does not change no matter where the barycenter goes, it should be excluded as a possible influence on our climates and temperature patterns. So in the context of Earth’s climates and weather patterns, the barycenter is not an area of interest.
REPLY: Nicely said, Anthony

Edward Morgan
January 18, 2009 8:42 am

So if this effects the sun which effects us more noticeably then it should still be thrown out. The Milkanovitch cycles also show this distance to change. Is this true or not??? Has the debate truly ended???

January 18, 2009 9:01 am

Pamela Gray (08:16:12) :
But if the distance between us does not change no matter where the barycenter goes, it should be excluded as a possible influence on our climates and temperature patterns.
And both calculations and observations show that the distance between the Sun and the Earth do not in any way change when the barycenter moves around. We had a long discussion of that some time ago, and it does not seem fruitful to repeat all that again.

January 18, 2009 9:34 am

Edward Morgan (07:53:01) :
Anthony, OK, but can I request at some point that the planets be a topic of discussion where we can freely debate this. Maybe a guest post on the subject. Please. Ed
REPLY: I’ll consider it, though I don’t give barycentric theory much credence. I think it is mostly a case of visualization of coincidental cycles. – Anthony
Edward Morgan (08:42:08) :
Has the debate truly ended???

It might be more appropriate to have such a debate after “The Great Debate”:
http://meetingorganizer.copernicus.org/EGU2009/sessionprogramme/GB
I have tentatively accepted to participate, as per the following email exchanges:
On Wed, Nov 26, 2008 at 3:22 AM, Silvia duhau silvia.duhau@gmail.com wrote:
Dear Dr. Leif Svalgaard:
This is to invite you to act as a member of the opponent panel in the debate Planetary dynamics and solar activity have a role in climate change and geodynamics?
– A debate dedicated to the memory of Rhodes W Fairbridge
We have invited already to Cornelis de Jager, Ivanka Charvatova and Dirk Callebaut that has honored us by accepting our invitation
There will be It will be a great honor for us, if you accept to participate as a member of one of the panels: either the proponent or the opponent
(that is : to sustain the refutation of the hypothesis that solar
dynamo-orbital motions interaction as a cause neither of solar activity variations nor climate variations).
Dear Silvia,
The debate is supposed to discuss:
1) To what extent does the sun regulate the Earth’s climate? What is the evidence? What are the processes?
2) Does solar system dynamics significantly affect solar and planetary dynamos? If it did, could this affect the Earth’s climate dynamics?
3) Does solar activity result in geomagnetic field variations? Does it change the Earth’s rate of rotation? Do variations in the Earth’s
geomagnetic field and/or variations in the Earth’s rate of rotation
affect the planet’s climate dynamics.
I think that point (1) is much too broad. A whole week’s worth of
debate on this point alone would not do justice to the problem, so I think that point (1) should simply be dropped, as it would otherwise dilute the issue of real concern to Fairbridge, namely if there are any planetary influence on solar activity, and thereby on climate. Clearly, if there were no solar effect, there would presumably not be any climate effect either. So, I propose to debate only (2) and (3) while relegating (1) to a few remarks at the end. If you can agree to this, I would be glad to accept, otherwise, I would have to pass on this.
Dear Leif:
I am very grateful for your positive answer and for your advice.
In fact, I was thinking in erasing one of the questions, more if the
debate have only 1hr 30′.
Moreover, you are absolute right, as the debate is in the memory of Fairbridge, question 1 is out of place.
Please, I would like to have from you any suggestion for changes in questions 2 and 3. since we have time to change them in the EGU web page.
Regards
Silvia
——
So, perhaps, enough for now. My only concern is that no matter the outcome, it will have no effect on the position of the two sides, in which case the exercise is a waste of time, but at least it doesn’t hurt to recognize Fairbridge.

Edward Morgan
January 18, 2009 10:21 am

The way Leif gets to change the programme is so honest and of course they will remain in the same ranks because the solar lot are right and Leif has other interests.
Just been looking at loads of correlates between rainfall and cosmic rays absolutely perfect they are. But is this on the agenda for truth Winston. This isn’t only site in the world Leif. Control that.

January 18, 2009 12:27 pm

Edward Morgan (10:21:30) :
This isn’t only site in the world
Try your luck at Tamino’s:
http://tamino.wordpress.com/

January 18, 2009 5:13 pm

Pamela Gray (08:16:12) :
But if the distance between us does not change no matter where the barycenter goes, it should be excluded as a possible influence on our climates and temperature patterns.
This is where people get mixed up….its nothing to do with the distance from the Sun, that particular planetary influence is covered nicely by Milankovitch and is pretty well an excepted fact. I am arguing that the Jovian planets control angular momentum which has a direct link to the output of the sun, I am not interested in barycenter talk….I am in the middle of some convincing work that will tie this whole thing up, keep your minds open and above all study the information that is coming out….dont think there is nothing new out there to discover in this area.
I would love a seat at the great debate…perhaps I can get some proxy help.
http://landscheidt.auditblogs.com/archives/58

Jeff Alberts
January 19, 2009 12:31 pm

This is where people get mixed up….its nothing to do with the distance from the Sun, that particular planetary influence is covered nicely by Milankovitch and is pretty well an excepted fact.

Freudian slip? I’m sure you mean “accepted” fact…

January 19, 2009 4:55 pm

Jeff Alberts (12:31:11) :
Freudian slip? I’m sure you mean “accepted” fact…
Was rather poor wasnt it. It would be more correct to say “past experimental results, papers and observation support Milankovitch’s theory”.

January 20, 2009 4:34 am

Leif Svalgaard (14:12:31) :
The changes are with respect to the center, not to the bodies. But first can you and no-brain agree as to what you talking out? e.g. about the distance between the Sun and the Earth.
We will see who has the “brain” at your upcoming “Great Debate”. I suspect you might be under pressure if I manage to get my latest work to the conference.

andrew
February 13, 2009 1:25 am

Hi,
Just read the article and I had to point out the failure to take into account total areal extent of ice. The author argues that a 10% anomaly in the antarctic is more important than a 10% anomaly in the arctic, but this fails to take into account the fact that total areal extent is much greater in the arctic and a 10% anomaly represents a much larger area of ice.
Thanks for any thoughts.