By Joseph D’Aleo, CCM, ICECAP
May has been frigid slowing the planting and emergence of the summer crops in Canada. Late freezes and even snows are still occurring regularly and can be expected the rest of the month.

See larger image here.
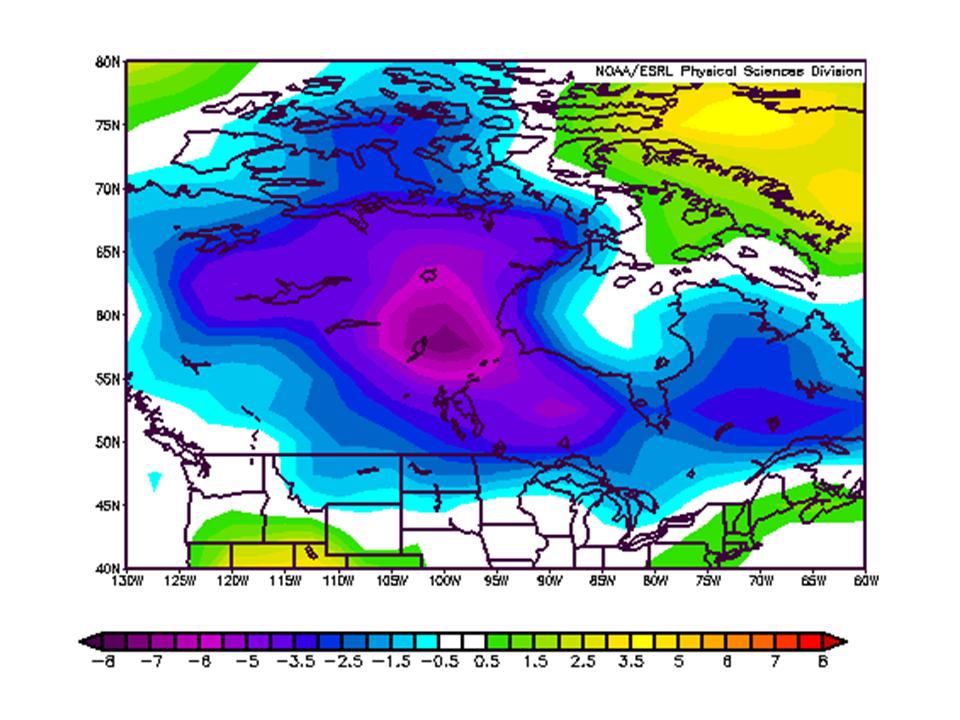
The chart above shows the May 2009 temperature anomaly through May 24th. Parts of central Canada (Churchill, Manitoba) are running 16 degrees F below normal for the month through the 26th (map ends 24th). Every day this month has seen lows below freezing in Churchill and only 6 out of the first 26 days days had highs edge above freezing. The forecast the rest of the month is for more cold with even some snow today in Churchill and again this weekend perhaps further south.
Hudson Bay remains mostly frozen though most of the seasonal melting occurs in June and July most years.
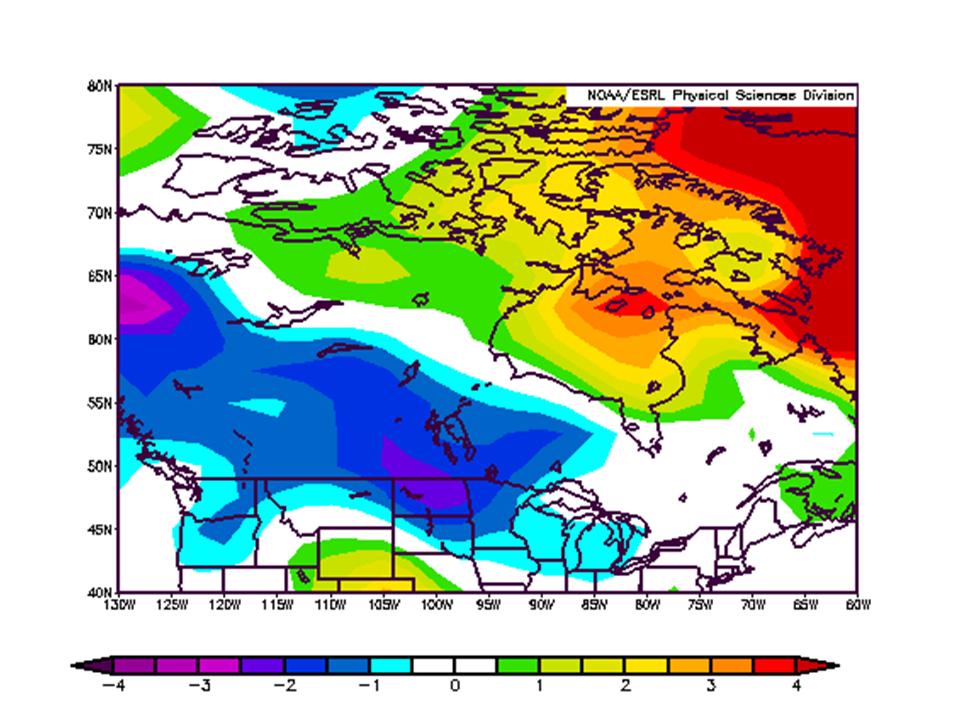
Parts of the south central region were also cold in April averaging 3-5 F below normal. The winter (December to March) was a cold one for southwest and central Canada but warmer in the far northeast.


See larger image here.
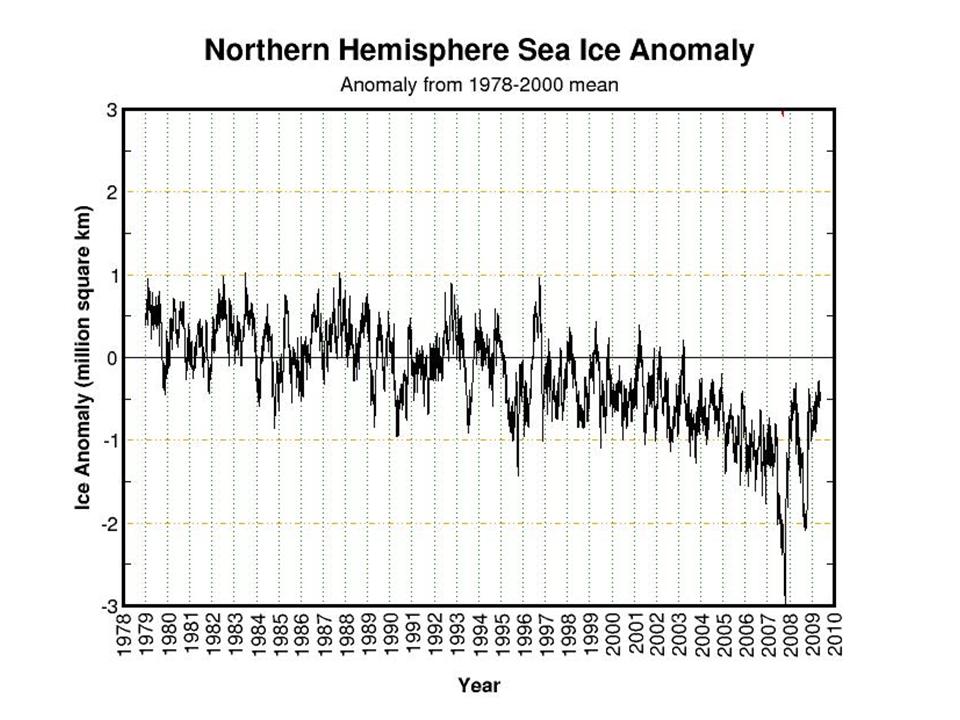
Meanwhile the arctic ice remains higher this data for any year this decade in a virtual tie with 2004.

See larger image here.
Given the polar stratospheric aerosols from Mt Redoubt, and a colder Atlantic and a continued cold Pacific, the recovery from the minimum of 2007 should continue this season.
The global data bases have large gaps in Canada, Africa, South America. So they will not reflect this in their global May anomalies as well as the satellites that see the entire surface – land and ocean excluding high latitude polar.
See pdf here.
May has been frigid slowing the planting and emergence of the summer crops in Canada. Late freezes and even snows are still occurring regularly and can be expected the rest of the month.

See larger image here.
The chart above shows the May 2009 temperature anomaly through May 24th. Parts of central Canada (Churchill, Manitoba) are running 16 degrees F below normal for the month through the 26th (map ends 24th). Every day this month has seen lows below freezing in Churchill and only 6 out of the first 26 days days had highs edge above freezing. The forecast the rest of the month is for more cold with even some snow today in Churchill and again this weekend perhaps further south.
Hudson Bay remains mostly frozen though most of the seasonal melting occurs in June and July most years.
Parts of the south central region were also cold in April averaging 3-5 F below normal. The winter (December to March) was a cold one for southwest and central Canada but warmer in the far northeast.

See larger image here.
Meanwhile the arctic ice remains higher this data for any year this decade in a virtual tie with 2004.

See larger image here.
Given the polar stratospheric aerosols from Mt Redoubt, and a colder Atlantic and a continued cold Pacific, the recovery from the minimum of 2007 should continue this season.
The global data bases have large gaps in Canada, Africa, South America. So they will not reflect this in their global May anomalies as well as the satellites that see the entire surface – land and ocean excluding high latitude polar.
See pdf here. H/T Climate Depot and Andy for the heads up
Canada Has a Frigid May after a Cold Winter By Joseph D’Aleo
May has been frigid slowing the planting and emergence of the summer crops in Canada. Late freezes and even snows are still occurring regularly and can be expected the rest of the month.
See larger image here.
The chart above shows the May 2009 temperature anomaly through May 24th. Parts of central Canada (Churchill, Manitoba) are running 16 degrees F below normal for the month through the 26th (map ends 24th). Every day this month has seen lows below freezing in Churchill and only 6 out of the first 26 days days had highs edge above freezing. The forecast the rest of the month is for more cold with even some snow today in Churchill and again this weekend perhaps further south.
Hudson Bay remains mostly frozen though most of the seasonal melting occurs in June and July most years.
Parts of the south central region were also cold in April averaging 3-5 F below normal. The winter (December to March) was a cold one for southwest and central Canada but warmer in the far northeast.
See larger image here.
Meanwhile the arctic ice remains higher this data for any year this decade in a virtual tie with 2004.
See larger image here.
Given the polar stratospheric aerosols from Mt Redoubt, and a colder Atlantic and a continued cold Pacific, the recovery from the minimum of 2007 should continue this season.
The global data bases have large gaps in Canada, Africa, South America. So they will not reflect this in their global May anomalies as well as the satellites that see the entire surface – land and ocean excluding high latitude polar.
See pdf here. H/T Climate Depot and Andy for the heads up.
.
Nobody wants to punch Al Gore in the **** more than me, but there seems to be as much positive anomaly on these maps as negative.
Clear evidence that there is no such thing as climate change.
Why are we the “deniers” and “skeptics” ?
I think we should start using the “natural cycle deniers” tag on AGW supporters…
It’s all in the jet stream. It continues its loop de loop as it circles the NH. That cold air normally restricted to the Fall, Winter, Spring, and Summer Arctic in El Nino years, is being channeled southward by the loops. Canada is now part of the new Arctic circle and will stay that way till the jet stream straightens out and stops all this loopyness. Airline companies don’t much like the loopy jet stream. They much prefer the straight and narrow West to East flow, in other words, the fuel saving flight path.
Pamela,
Perhaps you could shed some additional light on the jet stream. I have always understood that the jet stream was the result of the convergence of warm air masses from the south and cold air masses from the north. Which ever air mass is stronger in a particular area will push the boundry more north or south rather than the jet stream itself “pulling” on the air masses. Thanks.
I’m wondering—was there confirmation on the cold record broken in Edmonton by -12C? I didn’t catch if there was. I may have overlooked the report.
http://wattsupwiththat.com/2009/03/15/edmonton-canada-bests-march-10th-record-low-by-12-degrees-columnist-questions-climate-situation/
Robert (18:21:51) said :
Nobody wants to punch Al Gore in the **** more than me, but there seems to be as much positive anomaly on these maps as negative.
GRANTED. The worrisome thing, however, is that Greenland and Scandanavia are not the “breadbaskets” (to use the old Social Studies word) that are Manitoba, Saskatchewan and the southern reaches of Alberta.
Combined with a late start to the planting season across the Northern Plans of the USA, my guess is Buy Wheat Futures.
PS Suggest a contest for a four-letter word meaning “where I’d like to punch Al Gore”. My submission: “boys”.
I had read that what the sun is doing shows up first at the poles. I had also read that there is no evidence for that hypothesis. The sun has been quiet for 2 years and both North and South pole ice are in a growing trend. Correlation is not causation–I KNOW.
But is is possible this cold in Canada is connected to the quiet sun and not just from the -PDO and the jet stream?
mkurbo (18:53:09) :
I have thought things along those lines too mkurbo.
hareynolds (19:26:42) :
A debate in broad day light with Václav Klaus or Richard Lindzen might make Al Gore feel like he’s being troubled in those “boys”.
Coldest winter in the UK in 30 or more years. Record lows/snow in Canada and the USA. Arctic ice almost back to 1979 “norm”. Snow in Saudi, China and first snow in Iran in 100 years. Cold summer in Australia. Autumn bypassed, winter arrives in New Zealand. SH ski season in Australia starts 5 weeks early…
http://www.skiinfo.com/News-104-en.jhtml?a=137762
This stinks of a trend, albeit as short one, to me.
hareynolds (19:26:42) :
PS Suggest a contest for a four-letter word meaning “where I’d like to punch Al Gore”. My submission: “boys”.
My suggestion is cods.
I’m wondering how much effect Mt. Redoubt’s eruption has in the Northern hemisphere. Perhaps it’s too soon to see the effect but this coming fall and winter could be worse for Canada and the Northern hemisphere.
Tom in Florida, the following link is one of the better explanations of the jet stream behavior. During El Nino, the jet stream is further south, blows west to east in a rather straight pattern (with some camel back-like large waves extending northward, and can be quite strong, bringing warm air to Canada. Therefore extreme weather events occur in more southern latitudes. Nonetheless, jets can travel an El Nino jet stream almost as the crow flies.
During La Nina, the jet stream aims for the Rockies and then travels in a looping pattern east-northeast towards the great lakes. The loops are so severe that the primary flow is north to south, not south to north as is the case in the more southern position. Extreme weather events occur in northern latitudes and force Arctic cold blasts into the states. Jets literally are forced to jump from one loop to another, significantly decreasing gas mileage and fuel costs.
So what comes first, jet stream movement or PDO changes. The most immediate cause is likely PDO changes. Which leads to jet stream changes. Going further back, PDO changes are most likely caused by trade wind (Coriolis affect) changes. And that is as far as I can go without further study.
http://www.weatherexplained.com/Vol-1/El-Ni-o-La-Ni-a.html
Tom in Florida, may I suggest the reading of Marcel Leroux’s books “Dynamic analysis of weather and climate”?
Hardly hard science — just casual observations — but I am here in southern Alberta and spring is LATE! Period. Poplar trees still not fully leafed out … Maydays bloomed about two weeks late this year….we got snowed on twice two weeks ago on a spring camping trip. See here…yucko..
http://members.shaw.ca/ocl3/campout.jpg
Tulips have just finished blooming here.
I have yet to check the data for where I live, but assuming it to be a couple of degrees below 1970-2000 average.
The days start getting shorter in 3½ weeks. ☺
Take a look at the prevailing direction of cold air into Canada in the May jet stream animation. Notice the number of times the arrows are demonstrating cold Arctic blasts swooping South into our neighbor to the North.
http://squall.sfsu.edu/scripts/nhemjet_archloop.html
You have to set the parameters for 2009, May, 20 days, 6 hr, and then hit “build animation”.
The chart above shows the May 2009 temperature anomaly through May 24th. Parts of central Canada (Churchill, Manitoba) are running 16 degrees F below normal for the month through the 26th (map ends 24th).
Fear not. GHCN will catch those outliers and correct them.
Pamela: What about the WPO? Doesn’t that play a big hand in calling those shots?
evanmjones, just for giggles I googled WPO. Actually, this may be what you mean. The World Presidents’ Organization may indeed call the shots. Or the World Packaging Organization.
“Alaska’s Hubbard Glacier is advancing at the rate of seven feet per day!”
http://www.freerepublic.com/focus/news/2249100/posts
“”Clive (20:12:46) : Poplar trees still not fully leafed out … Maydays bloomed about two weeks late this year””
I’m wondering if this is natures reaction to the quiet sun. Or some much larger mechanism also.
Sounds familiar, what David Archibald was saying would be happening, though a tad bit advanced on schedule.
Pamela: Oops. NPO. The Aleutian-Edmonton pressure differential.
Detailed report on Edmonton’s mid May 2009 snow storm is here: http://pathstoknowledge.wordpress.com/2009/05/19/its-weather-and-climate-20cm-of-snow-in-edmonton-area-may-19th-2009/ .
“I’m wondering if this is natures reaction to the quiet sun. Or some much larger mechanism also.”
Never noticed it until this year, but my Giant Sequoias are following the sun by bending themselves nearly a foot from morning until evening. At first I thought the ground had settled and the trees were leaning over.
Dunno about poplars, but I know that guys are planting spring wheat and Barley in Saskatchewan in the snow. That’s not particularly helpful. The ground isn’t warm enough to germinate seeds. Even if we WERE/ARE warming, we can deal with warming a WHOLE lot easier than cooling.
orbs
The folks over at National Geographic have announced that global warming is now audible:
http://news.nationalgeographic.com/news/2009/05/090521-global-warming-audible-hear.html
I wonder if all this cooling makes noise too?
Typo in your article?
The following doesn’t make sense: “Meanwhile the arctic ice remains higher this data for any year this decade in a virtual tie with 2004.”
Maybe you meant to write “Meanwhile the arctic ice AREA DATA remains higher this YEAR for any year this decade in a virtual tie with 2004”?
REPLY: I agree. It was written by Joe D’Aleo, so I can’t correct it for him but will notify him.
Mkurbo,
I prefer the term “Climate Naturalist” for myself, whenever it comes up (in my greenista town, it does). They hate that, but they can’t argue with it. “Oh, so you’re a global warm… er, I mean a climate change denier?”
No, the Climate’s been changing for 4 billion years, only an idiot would deny that. Ergo, I’m a Climate Naturalist.
Enough Canadians must have painted their roofs white.
hareynolds (19:26:42) : my guess is Buy Wheat Futures.
Yup. For those not into buying futures contacts, there are exchange traded funds (trade like stocks) that do the futures contracts for you. These are called ETN or Exchange Traded Notes funds. There are also mutual funds that hold different agricultural goods and even baskets of ag companies like seed and fertilizer makers. You can buy these in any stock account.
Right now, they look good. This chart shows JJG rising from lower left to upper right… (“MOO” is beating it, though 😎
JJG is a basket of grain contracts. Mix of wheat, corn (maize), soybeans
MOO has a combination of seed producers, fertilizer companies, etc.
COW has a mix of cattle, pork, and chicken futures (flat – feed costs up…) I left it off the chart. Not interesting at this time.
SGG Sugar is up nicely (I own CZZ, a Brazilian sugar grower / maker)
JO Coffee is up.
NIB Cocoa has been low, but just started a spike. Cold weather…
DBA is a mixed ag basket. Bit of everything, almost. Rising too.
WOOD (not on the chart) was rising nicely but has gone flat (housing starts not as good as expected) I sold my timber REIT PCL Plum Creek Lumber, but will buy back in on an upturn.
I’m planning to buy some JJG and either NIB or JO (folks are going to WANT that hot cup of cocoa or coffee…) I already own some MOO.
In summary, I’m already owning the inputs makers (takes more to make up for bad weather, and failed seeds means a re-buy), I’ll be adding some grain futures vi JJG and some warm beverage. The “cold trade” is on, and it’s working…
BTW, do not hold any long bonds for the next couple of years. The bond auction today had the 2 and 5 year hold up, but the rate on 10s and 30s was “way high”. Folks are not willing to tie up their money for 10+ years while the dollar is being buggered. If you MUST own bonds, own those in foreign currencies (Yen, Swiss Franc, Euro, Brazilian Real, and maybe UK Pound more or less in order) or TIP Treasury Inflation Protected Securities. Any other long duration U.S. bond is going to get creamed as the rates rise… (bonds sell for lower prices as the rate rises. Especially bond FUNDS, which unlike a single bond, never mature…
The jet stream (and ocean currents) distribute heat around our tiny planet.
The energy that is distributed comes from the sun.
I’d be interested to know if Anthony has any comment or links to comments regaerding the persistently low ap index.
Less energy = less heat.
mkurbo (18:53:09) :
Why are we the “deniers” and “skeptics” ?
I think we should start using the “natural cycle deniers” tag on AGW supporters…
I’m not a sceptic or a denier. I’m a realist.
In case you wonder why only Alaska is shown: most of the rest of the US has had a positive temperature departure for the last month. Also, the global temperature anoamly went up quite amazingly
http://discover.itsc.uah.edu/amsutemps/execute.csh?amsutemps+002
But why should we concentrate on a more global picture when we can focus on only one (close to the pole) state?
BTW, given the state of the ice thickness rightnow, nobody in its right mind would predict a large recovery of the Arctic. Maybe it will be a bit more that 2007, probably the same level as 2008, in other words some 30 years ahead of the most pessimistic predictions.
http://svs.gsfc.nasa.gov/vis/a000000/a003500/a003589/
but my guess is that is could be worse. The Greenland sea is very fractured, which could expose the perennial sea ice North of Canada to much more open water.
I know my Iris patch usually blooms around Easter and the flowers are usually gone by May. This year they bloomed in May and WOW did they bloom. The flowers are so big and three to a stalk.. so heavy that they are pulling themselves down. I think they like the extra Co2, or maybe the added rain. Its still chilly nites here but we are supposed to hit the 90’s tommorro. We shall see, because everytime they say its going to be warmer the clouds move in. Perhaps all that transported moisture from this winter is steaming off but I sure wish it would get warm already. I cant say its unusual to be chilly this time of year though. I have seen it snow as late as the middle of June here in Boise.
PS how did Chu’s last prediction work out. I bet CA is still planting and growing crops this year. Were running it down the ditch to them as fast as we can:P
Somewhat OT, but I urge everyone (particularly Brits) to have a look at this festering garbage from the BBC:
Climate Change:The Evidence
Is this really all they have? I love the claim that CO2 is the main greenhouse gas and the use of a fluffy (i.e. disguised) version of the Hockey Stick.
Don’t know what was wrong in the chart link. I’ll try it again. Here is the “very long form”:
http://bigcharts.marketwatch.com/charts/big.chart?symb=jjg&compidx=aaaaa%3A0&comp=dba+moo+nib+jo&ma=1&maval=50&uf=7168&lf=2&lf2=4&lf3=1024&type=4&size=3&state=15&sid=2913190&style=320&time=6&freq=1&nosettings=1&rand=7151&mocktick=1
andas a short click me
Guess we’ll see if I can get it right this time. WordPress sometimes does odd things with links full of ampersands…
Flanagan (23:51:16) : In case you wonder why only Alaska is shown:
Perhaps you could actually look at the graphs before posting your trollings? That’s Canada not Alaska. Alaska isn’t even on the maps.
I’ll assume the rest of your posting was of similar quality…
And as for the notion that it’s been abnormally warm, well, it’s been cold. I’m cold now. My tomatoes are not setting fruit due to cold nights. The AC has not been used at all. The heater has. Make all the pretty pictures you want from dancing in the error bands of calculated fantasies, it’s cold. And it’s not just Canada. New Zealand, Canada, Alaska, Peru, Australia, Afghanistan, Switzerland, etc. etc.
http://chiefio.wordpress.com/2009/05/23/south-hemisphere-record-early-snow/
Your anomalies are based on broken thermometers run through fantasy creating programs with badly formed calculations that violate the rules of Nyquist and of False Precision and are in many cases based on estimates of polar ice from broken satellite sensors. They are worse than useless. I’ve been through a lot of the code that creates the GIStemp anomalies and it’s junk. Complete, utter, worthless junk. I’m not going to bother putting up the links here, anyone who wants them can find them at chiefio.wordpress.com and see for themselves.
What is reliable, and clearly visible, is snow. Lots of it. Globally. It’s staying longer than expected in the north, and it’s arrived earlier than usual in the south. What’s undeniable is crops. They are being planted late, not sprouting due to cold soils, and not setting fruit. Grain prices show it isn’t a local isolated thing.
http://chiefio.wordpress.com/2009/05/04/argentine-drought-crop-failure/
So you can take your pretty pictures, and I’ll take facts on the ground. Yours are good for entertainment and scaring children. Mine will be used to invest very large sums of money, so they have to be right. So far, I’m making money on “the cold trade”. The Global Warming trade has been a dismal failure:
http://chiefio.wordpress.com/2009/05/20/the-market-votes-no-on-global-warming/
And that’s not my money, that’s the global traders market…
Pat (19:48:16) first snow in Iran in 100 years.
I can assure you there’s plenty of snow in Iran every year – there’s even ski resorts. Maybe a particular place in Iran had snow for the first time.
Pamela Gray @20:15:08
Brrrrr…. tha tmakes me feel cold.
Robert of Ottawa, Canada
Oh, and I should probably mention that FUD is a food basket, but JJG the grains is beating it (and it is fairly thinly traded, not much volume – it’s a new fund that’s trying to catch hold.)
So I’d stay with MOO, JJG, JO, and maybe a bit of SGG and NIB.
The cellulosics (WOOD, CUT, BAL {cotton} ) are not doing much ether, but they are more tied to economic rather than climate effects.
Oh, chart of FUD:
http://bigcharts.marketwatch.com/charts/big.chart?symb=fud&compidx=aaaaa%3A0&comp=dba+moo+nib+jo+sgg+jjg&ma=1&maval=50&uf=7168&lf=2&lf2=4&lf3=1024&type=4&size=3&state=15&sid=3150224&style=320&time=6&freq=1&nosettings=1&rand=6779&mocktick=1
These anomaly maps do a poor job of showing what farmers are actually up against. For example, one hot day, with temps +16, can cancel out six cool days with temps -2, and make a week look “normal.”
If you look a the records for Concord, New Hampshire, you can see that the four-day early season heat-wave at the end of April shifted the month’s anomaly to +2.6, which in some ways gives a false impression how mild the month was.
Also a lot has to do with how deeply the ground freezes, which has to do with how early a lasting snow-cover occurs. Snow, especially powder snow, insulates the earth. (Despite the fact last January was -6 of normal in New Hampshire, the snow did a great job of insulating the earth) (and also ponds, so incautious folk up from Massachusetts drove cars out onto thin ice and fell through.) While the ground froze 4 feet deep two winters ago, last winter it only froze 4 inches deep, which meant we could plant cold-weather crops early.
Warm-weather crops are another matter. Old-timers advised to skip the bother of planting things like tomatoes and squash until Memorial Day, (which was May 31 in the old days.) I should have listened, for frosts on May 19 and May 26 had me hustling about with tarps to cover plants, despite the fact May’s average low here is around 45 degrees, and the anomaly map shows we are .5 above normal.
Before anyone rushes off to plunk money down on wheat futures, they ought consult the farmers of Canada and the Dakotas. Those fellows are a tough lot who attempt to grow wheat at the edge of possibility, and usually succeed. Don’t trust anomaly maps alone.
http://chiefio.wordpress.com/2009/05/04/argentine-drought-crop-failure
Oh great … just as the US government is going to spend billions of dollars to increase further the price of food by subsidising ethanol production.
OK, so simply replace “Alaska” by “Canada” like the poster did and the rest remains the same. BTW, your long criticism of GISTemp is very funny, given that I was referring to UAH. But time will tell. We’ll see by the end of the summer if the sea ice recovered from last year…
Pat (19:48:16) :
Coldest winter in the UK in 30 or more years.
Err sorry – where does this come from? Over England and Wales it was the coldest since 1995/96 and over Scotland and Northern Ireland the coldest since 2000/01. The UK as a whole was slightly colder than 2000/01. Even with global warming at ~0.2 deg per decade a winter as cold as 2008/09 could be expected at least every ~10 years.
To add to my previous post (02:57:01)
There were a couple of winters in the 1990s and at least 4 in the 1980s which were much colder.
OT: AGW Alarmists increase carbon in red-light bedrooms !!!!!
As reported on Drudge.
“The global climate challenge may have been on the daytime agenda during the recent World Business Summit climate conference in Copenhagen, but in the evenings many businessmen, politicians and civil servants are reported to have availed themselves of the capital’s prostitutes……….
http://politiken.dk/newsinenglish/article719339.ece
Whilst in the UK: “Tourism bosses in Bournemouth have accused the Met Office of costing the resort millions of pounds in lost revenue after forecasters predicted thundery conditions on bank holiday Monday – which turned out to be the hottest day of the year.”
Bournemouth anger over Met Office’s bank holiday Monday forecast
Flanagan (23:51:16)
“US has had a positive temperature departure for the last month. Also, the global temperature anomaly (sic) went up”
Warming temperatures?? That is just weather.
Richard deSousa (20:05:41) :
One thing that might be worth looking for, especially if the weakening La Nina lets the jet stream become more zonal (west-east), is the latitude of the jet stream. While I was writing my summary of 1816 in New England (our Year Without a Summer), I concluded that the jet stream was further south than normal. While there were several warm periods, there were also strong cold fronts, storms, and crop liking freezes. OTOH, there wasn’t a freeze during apple blossom season and the lack of insects let them have a very good crop.
Meanwhile, places like Virginia had more moderate weather, though it’s a little hard to tell – a general cold snap that brings disaster to New England wouldn’t be a freeze in Virginia.
I don’t know if there’s enough data lurking around to create weather maps of that summer. Good project for a weather historian.
So, if Mt. Redoubt’s ash and aerosols cool the Arctic, that could lead to a more southern jet stream track, and that might show up best at ground level in the temperatures just south of the usual summer track.
Just don’t be surprised if there are a couple heat waves that muddy the situation!
E.M.Smith (01:26:58) said :
Flanagan (23:51:16) : In case you wonder why only Alaska is shown:
Perhaps you could actually look at the graphs before posting your trollings? That’s Canada not Alaska. Alaska isn’t even on the maps.
That’s OK Flanagan, I suspect is a congenital condition. My wife, the Irish-Catholic Phi Beta Kappa, can’t identify the countries of Scandanavia on one of those geography-test outline maps. My guess is that there’s an Ageographic gene which affects the same population as gluten intolerance (“siliac” IIRC).
The most famous victim, of course, would have been Wrong Way Corrigan.
OTOH, if you have any savings whatsoever, I would suggest following Mr. Smith’s advice rather than betting on AGW.
As the old saying has it, if you want to make a milion dollars on the AGW theory, start with ten million.
Ric, unusual freezes and snow intermingled with sudden warmth only to return to cold in the upper half of the US usually means the Jet stream is in its more northern track. Damaging weather along the tornado and hurricane belt in the South usually means an El Nino positioned Southern track.
E M Smith, you need to create a blog post about your cold versus warm agricultural stock market. Fascinating. By the way, what are wine and hops futures doing?
in reply to:
Just Want Truth… (19:21:19) :
I’m wondering—was there confirmation on the cold record broken in Edmonton by -12C?…
…I’ll resubmit a link that was placed at the time: http://www.climate.weatheroffice.ec.gc.ca/climateData/almanac_e.html?timeframe=1&Prov=XX&StationID=1865&Year=2009&Month=3&Day=10
Mr. Gunter got one thing right it seems; it was a new record low for the month (at least since 1961), but only by 0.5 degree from -42.2 to -42.7C. He expressed it very poorly, as he gave the impression that the previous low for the month had been -12C warmer.
In fact, only the previous low for the date of March 10 had been -12C warmer.
Flanagan, you are not a very good student. Do you simply REFUSE to do any homework? Many people here initially swore up and down that the Sun was the cause of the variation. They have opened their minds (me included) to other more endogenous drivers because they DID THEIR HOMEWORK. And are now leaving you in the dust. I know. I know. Don’t feed the troll but trolls easily lose their interest in trolling and move on to other blogs they don’t like. Flanagan, I think, remains a stubborn student, like several who believe in the Sun as the source of these temperature pattern variations (to you Flanagan that means climate change).
One of the tables I look at in a La Nina/neutral trend with the jet stream continuing to loop are the record temperature data. In such extreme weather we are likely to see both cold and hot conditions. It is instructive to see records of such events. Compared to anomaly maps, it is more precise on a monthly basis because you are counting daily events, not averaging them.
The PDO index started to decline in 2001 based on least square slope analysis[ -0.0487 points /year.] It went completely negative in Sept 2007 and continues to go lower and now at -1.65
AMO index started to decline in 2003 based on linear trend analysis. It went negative January 2009 and now at -0.078
Both of these have historically had a major impact on Canadian weather and are close to the levels of the1960- 1970’s when cooler weather dominated and both indices were also negative [1964-1976]
Notice the May temperature anomaly for the Arctic seas. Isn’t it interesting that we don’t see a more than normal rate of ice melt pattern. Yet the temps are higher than normal. Anybody guess why? If you did your homework you will know the answer.
Pamela Gray
I liked your jet stream web page reference . I went back to December 2008 when British Columbia in Canada had all the severe winter storms and extra snow .You can see the northern half of the jet stream head north to the Alaska, NWT and Mackenzie Delta region and then back south to BC and the Prairie provinces bringing cold air south. It would appear that unless the potential El Nino conditions materialize and dominate late 2009 or early 2010, as some are predicting, if the PDO remains negative , there should be plenty of snow for the 2010 Winter Olympics.
This unique pattern of the jet stream also accounted for all the flooding from the extra cold and snow resulting in significant snow melts in the Red River and Fargo regions in the spring. These regions get one part of the jet stream coming directly across from Oregon / Washington state region bringing extra moisture and snow and also the northern part of the jet stream coming from the Canadian Prairie Provinces bringing extra cold air. These are extra acute during La Nina conditions and some time even under Neutral conditionds as we saw during the early part of 2009
Just Want Truth… (20:28:11)
Just to clarify info on the link: The Corps (USACE) is on of the most generous organizations in the world in making its technical, scientific and general information available.
I think they’re amazing and I’m Canadian
Pamela – special thanks for that squall site link – I did not know there was a jetstream archive – wish I had known earlier and now have little time to study it – so these are just impressions gained from looking at SSTs for the northern Pacific and north Atlantic – at Hadley Centre here in UK, and more recently, Anthony’s animations showing the storm tracks on WeatherAction. Firstly, the ‘loopiness’ seems to be a seasonal phenomenon also – the track straightens up in the winter across the Atlantic and seems to have shifted further south this last winter – bringing storms, floods and colder temperatures to Spain; I have tried to get the picture with the shift in the PDO – the SSTs shifted in October 2006, and up until then the storm tracks came across the warmwater pool up into Alaska (rainfall records show a long term wet/warm period over the last 30 years 1977-2006) – but then as the jetstream has shifted south Alaska doesn’t get the warmth and precipitation (and the Pacific has much less to give at this latitude) – this pattern will I think affect the flow of warm water into the Arctic via the Bering Sea (less), as well as clouds over the ice (up 14% from 1980-2000), and ultimately also, the inflow of warm water (less) from the warm (until the AMO shifts fully) Atlantic.
Charles Perry (US geological service) did some work on the PDO/jetstream/precipitation in the mid-West and you might want to check his papers. He thinks there is a feedback from warm surface waters to the jetstream and this affects the loops in the standing wave.
I would like to know what ‘straightens’ the track .
I presume you already know of Drew Shindell’s thesis that UV variability affects the polar vortex and the jetstream – and linked this to the Maunder Minimum when the jetstream seems to have tracked further south and straight for 100 years! Spain was cold and wet, the UK froze in the winter and rot set in in the summer.
Flanagan: the UAH anomalies are interesting as they show no obvious impact of the current solar minimum at 4.4km or the surface, and yes, 2009 is up on 2008 slightly, but if you go back to 1999 you will find that a 0.5C anomaly has persisted for 10 years without getting any bigger.
EM Smith: if a large number of people follow your advice and buy grain futures, this combined with the AGW-driven laws for biofuel current in the EU, will raise the price of grain to very high levels next year (coupled with the then obvious shortfall in yields). You will make a killing.
But in more ways than you may be aware. Over 70 countries depend on the northern hemisphere food surplus for Food Aid – they can’t feed themselves. Last year the World Food Programme, for the first time in its existance, ran out of money to replenish its stocks – because the prices were so high, and it asked for $500 million.
At some point in this ‘cooling’ process, the point will be reached where the poor will die in very large numbers – firstly because the prices are too high, and secondly, because nobody is exporting and the food simply can’t be bought.
I’m not a climate expert, I’m a math guy (an actuary).
So, I don’t have fancy explanations for the mechanics of solar forcing and its impact on jet streams and all that. But I can look at the data and paint a reasonable story.
I posted not too long ago about my updated correlation analysis between sunspot activity, cycle length, and temperature anomalies. That post is here:
http://digitaldiatribes.wordpress.com/2009/05/13/may-2009-sunspot-update/
My conclusion is not so much that the length of cycle matters in and of itself. It only matters because a longer cycle simply means there is a longer period of lower average sunspot activity.
According to my correlation analysis, it takes about 2 years for lower sunspot activity (12-month average) to have any discernible impact on temperature. An average below 60 leads to cooler temps, and an average above 100 leads to warmer temps. There seems to be some level of average activity where you don’t get additional warming – about 160. This would make sense if the reason is a disruption of cosmis ray activity – if 160 is the point of major disruption, then additional activity wouldn’t matter.
The data shows that high sunspot activity warms things much faster than low activity cools. Makes sense. Thus, in a shorter cycle, there isn’t enough time for the offsetting cooling to occur before heavy activity occurs, and warming picks up from an already elevated level. It takes quite some time, then, of low activity (<60 annual average) before we see cooler temps. First, it takes about two years to see any adjustment, and then the impact is about 0.1 degrees Celsius per year.
Based on when things dipped below an average of 60, we probably started seeing the impact of that only between a year or two ago. But this is a slow process. It is not going to happen in large leaps. If the next cycle is very weak, then we will see a very noticeable change over the next decade+.
I'd also like to point out a couple other posts I've made that I think have some value. The first is a best-fit approach of sine waves to the HadCrut data. I think it speaks volumes in itself of the cyclical nature of the data:
http://digitaldiatribes.wordpress.com/2009/02/10/deconstructing-the-hadcrut-data/
It's a couple months old, but there is a clear cyclicality that can be identified. The implications to the future are shown by extrapolating the waves forward. It is also not coincidental that the periods of the waves line up with a similar analysis I did with respect to the PDO and AMO oscillation patterns:
http://digitaldiatribes.wordpress.com/2009/02/02/a-closer-look-at-oceanic-oscillation-cycles/
All the data, and honest analysis, sure seems to present the conclusion that there seems to be some small, long-term warming trend, but the majority of shorter-term trends can be explained by a combination of Ocean cycles and Solar cycles. Again, this is just a look at data. I'm sure smarter people than me can explain why the data is not telling the proper story. I kind of hope they are wrong, because right now all the data analysis and extrapolation points to a much cooler period over the next 20-30 years.
I'd be interested in any feedback on these analyses. I'm willing to accept that I am looking at things improperly.
About 3 months ago, after noticimg an unusual number of overcast days, I started to keep a little diary of observations. I walk my dog 4 times a day, with the first one being an hour shortly after dawn, and the last about 10:00 PM. I am also out usually near midday for other reasons. Thus I have ample observations of sky/cloud locally. I live near 30 degrees north latitude and 4 miles inland from the Atlantic Ocean.
Of the last 87 days, 71 have been fully overcast at least 80% of the day, and the rest have all had scattered cloud. There have been no clear days. Interestingly, 53 of the nights have been clear or slightly cloudy at 10:00 PM, and most mornings are clear overhead, but over ½ of these with clouds on the horizon in the direction of the sun at dawn. My guess is that most of these nights have been clear.
Most mornings, at near 1 hour after sunup, the sky sunward is clear, and the sun bright and warm. Then about 1&1/2 hours after sunup, the overcast begins to form, and is solid in about ½ hour. I am not a weather or climate expert, but can hypothesize that we have had a persistent cool upper layer of air, and when the sun begins to heat the surface, evaporation encounters that layer and forms clouds, which dissipate again when the lower air cools after sundown.
During the cloudy but not overcast days, I have observed no times when there was less than 50% (by eyeball judgment) cloud cover, frequently with very heavy clouds near the western horizon.
Compared to the last several years, this is no 3% increase in cloud cover. It is a large multiple, probably 4 to 6 times what I have taken to be normal, at least during the day.
It appears that we have had high reflection of insolation during the day and relatively unopposed escape of long wave IR radiation at night, a rather excellent formula for cooling. The icing on the cake is that my electrical bill has shown average monthly local temperature lower than last year by 4 to 5 degrees F for each of Feb/Mar/Apr. At least locally we have major cooling relative to last year.
Unlike Murray, I don’t see anything unusual about the cloud cover or precipitation. It’s just colder. Since discovering http://landscheidt.auditblogs.com I have been preparing for the coming cold. Recently I moved 5 hours South so I should be able to preserve a tolerable climate of the upper region of marginal cultivation in the Canadian Praries (ie: get my fall and spring back instead of the brutal stark transition from winter to bugs).
I found one paper that studied the drop in the tree line in the Rockies during the Maunder Minimum so I wait for the glaciers of the Rockies to follow those in Alaska and start growing again. Hopefully they don’t reach the Icefield Parkway between Jasper and Banff before its all over in 30+ years.
One hopefull sign is excavations into ‘Buffalo Jumps’ like ‘Head Smashed in Buffalo Jump’, the colder periods were more Biologically Productive because the moisture is the restraining factor and more winter storage helps mitigate what is really an arid climate. I haven’t seen so many amphibians and other creatures I thought would be stressed under these conditions since I was a kid in the 70’s. I guess the species here evolved in the cooler conditions following the margin of the Boreal Forest with the retreat and advance of the ice sheets. Maybe the advance in strains of cereal grains along with the slightly elevated CO2 will mitigate this cold periods effect on agriculture here and all we have to tolerate is extended ‘cold snaps’ of -40 during the winter.
mkurbo, paul, dan lee etc: I don’t mind being called a “denier”, but couldn’t it be “denyer”, please? “Denier” is a measurement of the sheerness of ladies’ stockings, and my doctor says I mustn’t think about them at my age!
A slight thread creep but the Catlin 3 Stooges have this on their site.
Quote
“The Catlin project will continue – the priority being to ensure that the data so painstakingly collected is interpreted by the Survey’s scienists.
Pen Hadow and Ann Daniels are established speakers on the international circuit……..”
Oh dear…………
Flanagan (02:17:24) :
OK, so simply replace “Alaska” by “Canada” like the poster did and the rest remains the same. BTW, your long criticism of GISTemp is very funny, given that I was referring to UAH. But time will tell. We’ll see by the end of the summer if the sea ice recovered from last year…
Flanagan,
We know, even if hell freezes over you will still be writing love letters to Gore and Hansen.
It would seem the Hubbard Glacier has a long history of advancing when other glaciers retreat.
Not that I accept the AGW thesis but Hubbard may not be a good comparator. But hey I am just an interested thicky.
Trevor (13:20:32):
Thus falsifying the notion that global warming causes glaciers to recede.
Pamela Gray (06:25:40) : E M Smith, you need to create a blog post about your cold versus warm agricultural stock market. Fascinating. By the way, what are wine and hops futures doing?
I make a weekly posting of what I’m doing for anyone who cares. It includes my ag positions. This last week version is at:
http://chiefio.wordpress.com/2009/05/22/wsw-friday-may-22-2009/
Tomorrows (which may actually get done in the wee AM and technically be on Saturday…) will have a 29 in both places if I get the stub up before wordpress rolls the date over on me…
The interest in solar cycles and warm / cold as market predictors has a long and storied history (i.e. it isn’t just me) starting around the time of Stanley Jevons who did work on it (studied decades of grain data from India and elsewhere in “the Colonies” and even invented an early calculating machine – the “Logic Piano”) I’m just moving the pebble a bit further along the road.
Warm vs cold is only one of the trade themes I’ve got going at the moment (albeit one thats working best…). BTW, buy oil too. PBR Petrobras is well positioned as are the Canadian oil trusts (though you get nicked for a 15% Canadian tax on the dividends). Non-US oils are “safer”. I expect some sort of US “profit tax” on the US oils… PCZ PetroCanada is cooking! (SU and IMO are stronger tar sands plays and bounce around more.) I presently own PBR and PCZ and wish I had some SU and IMO.
To the best of my knowledge, there are no exchange traded wine or hops futures. This site:
http://www.winex.com/cat-70-2008-Bordeaux.aspx
http://www.winex.com/cat-22-2006-Bordeaux.aspx
does not have a charting service that I can find, but it looks to me by inspection that prices are high and headed higher; with only one 2006 still available and the 2008 looking pricey already…
Italian wine futures are still a new idea:
http://www.winespectator.com/Wine/Blogs/Blog_Detail/0,4211,1178,00.html
And after a rocky time, it looks like Santa Barbara wine futures are being saved but still a personal contact niche :
http://www.independent.com/news/2009/mar/14/wine-futures-still-future/
But it’s a “delivery market” so you buy a contract and expect delivery of the product. I prefer to trade non-delivery (who want’s 1000 tons of pork bellys on their front lawn!) and frankly, with a wine futures delivery market I would drink all the profits… Discipline is the key to market success, and I don’t have the needed discipline for wine futures :-{
Per Hops, these folks don’t show it:
http://www2.barchart.com/mktcom.asp?code=BSTK§ion=softs
but I know hops futures exist. I would guess that it’s a thin market and more privately traded. Near as I can see we’re still coming down off a tight market in 2007 so a trade to the long side is probably setting up, but where to get charts and non-delivery contracts would be problematic. I have less of a problem with consumption of the delivery, though, as it isn’t “finished” yet 😎
This site: http://beeradvocate.com/forum/read/2060382
indicates storm damage recently to German hops production, so I’d expect high end specialty beers and hops to be going higher…
Wheat rice and corn are going up:
http://www2.barchart.com/mktcom.asp?code=BSTK§ion=grains
But I can’t find a quote on barley there. It too is a smaller more specialized market. But these folks:
http://data.tradingcharts.com/futures/quotes/AB.html
show it going up. (Plan to plant more barley… it’s cold tolerant and you can always drink it if things get too bad 😉
That’s about the best I can do on hops and wine futures… But the cold in Canada says that barley is going up and so is wheat. Hops is a higher latitude crop (30 to 70 degrees lat?) so ought to be cold influenced as well and the mid-European storms say higher prices, I just don’t see where a ‘home gamer’ can get a contract. You could always fill the basement with beer though… Did I mention I provide free financial consulting for beer 😉
Hope that helps…
Peter Taylor (08:15:46) : EM Smith: if a large number of people follow your advice and buy grain futures, this combined with the AGW-driven laws for biofuel current in the EU, will raise the price of grain to very high levels next year (coupled with the then obvious shortfall in yields). You will make a killing.
It is very important to keep issues of scale in mind. The grain futures are dominated by a few “whales”. Folks like ADM and Cargill. There is darned near nothing that any individual or collection of individuals can do to move the market (unless they are funded like Soros…). If I and everyone else who reads my blog and WUWT went out and bought a grain futures contract it would do exactly nothing to the market. We’re just not big enough.
Grain will move based on weather, government programs, and farmers production decisions. Buyers have a small impact but they tend to be more consistent. General Mills is going to make a certain quantity of corn flakes be the price $4 or $4.10 for a bushel of corn. The traders are nothing compared to the futures desks of companies like Kellogs, General Mills, ADM, and Cargill. So predict the weather and watch the government Ministry of Stupidity and get to think like a farmer…
I do expect to make a killing, but it will be as a trend follower not a trend maker. The trick is in proper prediction (not projection – never lie to yourself and trade…) of what the trend will be. Frankly, that’s about 1/3 of why I’m here. To hone my weather and crop prediction skills. (The other 2/3 is split between the AGW boondoggle and what it means for the economy and the way cool folks with brains who post here…)
So your statement is correct, but only if you remove the predicate about ‘folks buying futures”. They have no impact.
Also, realize that buying is only half the process. You also must either sell the contract or accept delivery. That’s why I like the ETNs – no delivery! If TOO many folks buy contracts and the price gets high from that, ADM and Cargill will happily sell you lots of contracts for “way high” prices — then force delivery or buy them back at way low prices… This market discipline is what prevents market manipulation. So when food prices spike up, please bear in mind that it is ultimately supply and demand, not “traders”. The trader can at most change when the equilibrium price shows up (moving the market faster) and not how far the market moves.
At the end of the day the trader must either sell the contract or take the grain. The grain ends up in the hands of producers and a market equilibrium happens. You just can’t change that. (Every so often you see these panic sellouts of contracts in the last couple of days before expiration as the folks who bought too high dump contracts like crazy to avoid having a zillion tons of wheat to sell on the spot market… Somehow this is never mentioned when folks talk about traders “bidding up prices”… )
Per poor folks and food: The poorest of the poor folks are cattle. When grain goes up the farmers take a long look at the feed bill for pigs and cows and decides to sell them now rather than feed for another 4 months. So meat prices temporarily drop (later to rebound if the reduced demand for feed does not lower grain costs). For this reason, COW often moves opposite JJG in the short run even if a very long term inflation play says meat will cost more in 5 years. COW hedges grain in the short run. What this means for poor folks is that as cattle are slaughtered, their grain is available for people.
The real fight is not between traders and poor starving people. It is between rich people eating steak, ham, and even BigMacs vs starving folks eating millet under oppressive confiscatory governments. I have not solution for that other than better governments in those oppressed folks countries. Governments that know it’s better to grow more than to fight over less…
(One example: In one country in Africa they are short of food. If you enhance the land with things like water infrastructure and fences, the government will appropriate it for the good of all and give you some crap land to start over on. Consequently nobody invests in infrastructure. Welcome to socialism 101 … They could feed themselves many times over under a system of property rights. Now they starve – but everyone is equal; except maybe the government employees … )
E.M. – I’m eternally grateful that you didn’t mention rice and beer in the same sentence.
PWL
I followed the link to your blog where you say;
“Personally I vote for an increase in global temperatures to say what it was 8,000 to 4,000 years ago during the Roman Age or even a little higher. Brrr… in Vancouver. – pwl
I think you meant to insert an ‘or’ after ‘4000 years ago’ as I don’t think you are claiming the Romans existed that far back.
All the best
TonyB
“”E.M.Smith (01:26:58) : What’s undeniable is crops. They are being planted late, not sprouting due to cold soils, and not setting fruit. Grain prices show it isn’t a local isolated thing.””
I have many friends in the Philippines. Life is already hard enought there. If food prices go higher I don’t know what they will do.
“”The Diatribe Guy (08:31:39) : “”
You’re not alone. See:
http://www.heartland.org/bin/media/newyork09/PowerPoint/Piers_Corbyn.ppt#260,1,Slide 1
“”” Miles (14:21:24) :
E.M. – I’m eternally grateful that you didn’t mention rice and beer in the same sentence. “””
Me too ; so why the hell did you ?
George
I pity all those Northern transplants that thought it would be a good idea to plant a vineyard in Minnesota. Or North Dakota, or even Canada. I would buy futures in spring wheat, which does not do so well in cold weather. However, winter red is also a good bet. Winter red makes the best bread. But it requires more time. You plant it one year, and it grows the next, so to speak.
On the other hand, if all those Minnesotians learned how to make dandelion wine, they would do okay. Dandelions grow in cold weather and have been known to peek through late snows. And there is NOTHIN better than wilted dandelion salad with a fresh pan fried trout. Put some eggs in boiling water. Cook bacon. Use part of the bacon grease to smother a dandelion salad with the hard boiled eggs. Add crumbled bacon. Meanwhile with remaining grease pan fry a fresh caught trout. Wash down with beer. No need to wash fry pan. Let cool slightly and then lick it clean.
Pamela please stop your incessant flirting. It’s driving me loony.
jeez I was about the respond that I wasn’t. Then I re-read my post. Oops. My bad. I actually got the last part of that sentence from a cookbook I have called “Bitchen in the Kitchen”. It is a very good (and outrageous) cookbook for women who suffer from PMS. It recommends never washing the cooking utensils. You just lick them clean or throw them away. It was an innocent semi-quote. But since there is no edit function on WUWT, it will have to stand the way it is. wink wink
Do you believe the nonsense NASA is involved in?
They have awarded a Chicaco Botanic Garden with a money award.
Why? Because this Garden promotes AGW BS.
http://www.chicagobotanic.org/research/awards/nasa_award.php
Ron de Haan (18:40:07) :
When will this end? Maybe we are stuck with AGW for a 1000 years!
But maybe I’m just in a bad mood. Or maybe I’m being realistic.
Pamela Gray (06:32:15) :
Many people here initially swore up and down that the Sun was the cause of the variation.
…remains a stubborn student, like several who believe in the Sun as the source of these temperature pattern variations
Nice straw men, Pam. So, was the Little Ice Age merely a case of your “temperature pattern variations”?
The sun certainly plays a big part in climate (I don’t believe anyone has ever said it was THE cause of climate change, let alone some “temperature pattern variations”).
However, from what I have learned, our climate is an extremely complex system, with both short and long-term cycles, and varying factors, the two biggest of which most likely are the oceans and the sun, but then of course there are also the Milankovitch cycles.
I have just finished reading Unstoppable (Every 1,500 Years) Global Warming, by Fred Singer and Dennis Avery, and highly recommend it.
Bruce Cobb.
Whatever the Little Ice Age was, it wasn’t anthropogenic.
Neither were the Big Ice Ages anthropogenic.
Neither is Al Gore’s Global Warming anthropogenic.
Neither is the Global Cooling we have seen since 1998…
For those who haven’t noticed, there’s a big huge fiery ball (which is a LOT bigger than we are) a mere 93 million miles away from us. The forementioned big fiery ball appears to be entering a very quiet period…
(I’ll tell you what is anthropogenic though – runaway population growth.)
To Ron De Haan,
Maybe the ladies in the Chicago Botanical Garden will serve the same educational purpose as the Catlin Artic Survey. With the PDO in the cold phase and nothern tier of states and Canada like to see a continuation of colder winters, there is a lot they will be able to demonstrate about climate change.
Here is a test. Come up with all the variations of the Sun’s testable output (every thing: plasma, solar wind (or rather Universe Wind), heat, whatever) and put it into its known calculations in terms of what it is measured at when the stuff reaches planet Earth. Then tell me what the Sun has to do to increase or decrease its affect on Earth’s temperature to match the variations. This stuff is known already so it will just take some study on your part. You won’t need to come up with anything new. You will see that in nearly all cases, you have to MOVE THE SUN CLOSER to the Earth, or the other way around, to get the temperature variation you see in short and long time scales. No straw man here. Bottom line: The Sun is not the driver of the variation. What up or down direction it has the potential to cause is buried in the temperature measurement error.
good one George, you got me 🙂
Pamela says:
The Sun is not the driver of the variation.
Another straw man, Pam? Tsk Tsk! I didn’t say the sun was THE driver of the variation, did I?
As you well know, the exact mechanisms for the suns effect on climate change are not yet known, but the hypothesis is that small variations in TSI are amplified by two factors, at least: 1) cosmic rays creating low, cooling clouds, and 2) solar-driven ozone changes in the stratosphere.
The Maunder Minimum didn’t “just happen” to occur during the LIA.
Jimmy Haigh (10:47:36) :
Bruce Cobb (17:03:30) :
You might like this :
“Blackfeet Indians predict the return of ‘many glaciers’ to Glacier Park”
http://cdapress.com/articles/2009/05/23/columns/columns06.txt
Just to stick my two cents worth in on the whole;” sun is the driver or not” deal, I wondered if any of you had taken a look at the work by Henrick Svensmark and the influence of Cosmic Rays. I think he has got something very interesting to say and it ties in nicely with a decrease in sunspot activity and an increase in cloud cover and therefore cooling of the Earth.
Just Want Truth: Great link, thanks. I believe the Indians have a wisdom and knowledge we would do well to listen to. If anyone would know about the natural climate cycles, they would. How they must laugh at, and pity the poor brainless Alarmists running around screaming “the sky is falling, and we’re to blame!”
I look forward to reading next weeks’ “The History of the Manmade Global Warming Hoax.”
Australian Aborigines have a long oral history, what would Australian climate history be like?
Pamela Gray said:
“Bottom line: The Sun is not the driver of the variation. What up or down direction it has the potential to cause is buried in the temperature measurement error.”
And GM could never go bankrupt. It’s in the margins and crossing that line.
The sun has everything to do with the Earth’s surface temperature. The cosmic comedy of it all is maybe in ten to fifteen years after we are well into the present ‘Grand Minimum’ and ‘relatively’ freezing our behinds off we will get some research money to understand how the physical world works instead of how to misuse modelling techniques and computing hardware.
There are endless discussions about what TSI is and isn’t and oddly enough Milankovitch is almost universally accepted but Jose/Landscheidt/Maunder et al are not.
Another curious thing is how it can be science to backward extrapolate the output of flawed models the physical characteristics of a trace gas making it magical violating well established ‘laws’ of Physics. All that computing power and you could stare at a pop bottle warming to room temperature and explain most of what we are observing in our partial pressure experience.
Lief and Pamela will have to get their pencils out very soon (a decades not that long) and explain to us why its so damn cold.
Todays SC24 sunspots observed from my back garden with C8 telescope, Baader solar filter and webcam.
http://arnholm.org/astro/sun/sc24/sun_20090531_anim1.gif
The little spot appeared to disappear more and more over an hour of observation.
Having lived on the warm West coast of Canada for 19 years, I have consistently employed a simple but effective technique to help develop my understanding of “global” warming: it was COLD in the winter the first few years, then started to WARM (Trout Lake in Vancouver, for example, could be skated on the first few winters I was here; plenty of snow days – mid-1990s to early 2000s that began to change away) for some years; now it is getting COLD again.
The last few winters here have been brutal: lots of snow to the point of it building up and compacting into ice on the roads for weeks at a time, conditions not unlike the Prairies where I grew up though certainly not as long-lived or as cold. Commuter buses and trains shutting down due to inability to cope with ice and snow. Late, late Springs as noted.
In brief then: we had a several-years period of warmer weather, during which the hysteria and consequent cash-generating machinery of “global” warming was ramped up full steam; now the weather is getting distinctly colder again. The hysteria hasn’t abated though, nor should any of expect it to: it is far and away the greatest gravy train in human history, one our great-grandchildren can expect to be paying for as they curse our lack of courage and gullibility.
Another sign that global warming in Canada is warmer than expected?
http://www.nugget.ca/ArticleDisplay.aspx?e=1325062
I apologize for the wrong posting above for North Bay. There was snow in Northern Ontario this past weekend according to our weather report, but this is all that I could find on the internet to confirm. Maybe other bloggers can confirm as well.
http://www.theweathernetwork.com/snow/snowon
Unusual clouds and snow showers in Sudbury on Sunday am.
http://www.thesudburystar.com/ArticleDisplay.aspx?e=1591899
“Sandy (12:17:06) :
Australian Aborigines have a long oral history, what would Australian climate history be like?”
Too bad some of the billions going to co2 studies couldn’t be diverted to this!!
Bruce Cobb (17:03:30) :
len (14:22:53) :
This has been posted in some other threads here and you may have seen it already. It very interesting and fascinating to watch.
“The Cloud Mystery”
http://www.thecloudmystery.com/Home.html
5 part YouTube series
This from the BoM of Australia, there’s an El Nino developing in the Pacific…
http://www.smh.com.au/environment/water-issues/warmer-than-normal-leave-your-winter-woolies-at-home-20090601-bsdh.html
It don’t feel warm. In fact the “weather” was one topic of conversation at a wedding on Sunday. No-one there was saying it was warmer than “average”.
How true is this, does anyone know sources of reliable information (Year I know, not easy in this day of instant misinformation)?
pat
According to this source , there is a possibiblity for an El Nino. There has been an El Nino event within about year after every solar minimum for most of the last 10 solar cycles [ i think about 8 out of the last 10 cycles]
http://www.bom.gov.au/climate/enso/
Pat
I double checked how soon after a solar minimum , do El Nino’s occur, if they occur at all. I found that it is not quite that positive. There is a pattern for the last 4 solar cycles but prior to that it was all over the place .
For the last 10 solar cycles
5 happened within about a year after the solar minimum[ 1913, 1964, 1976,1986, 1996]
3 happened within 2-3 years [1901,1923,1954]
2 had no such event [ 1933,1944]
It is June first and the temp reached the thirties F last night here in Vermont, and it snowed in the Adirondacks.
“Bottom line: The Sun is not the driver of the variation” – PG
In logical augmentation, this is known as asserting a negative. In other words, it is a statement made based on faith, or judgment, not rigorous proof, as it is nearly impossible to prove any negative on this scale. Especially with the climate as poorly understood as it is today, and the sun radiating on multiple wavelengths affecting various gases at various altitudes as well as modulating incoming radiation from deep space, like a transistor, through magnetism and the solar winds operating, of course, on a chaotic system where a butterfly’s wingbeat… well, you know the rest. Lief has his proof that the Sun can’t change the climate with small variations in irradiance, but it is so laden with assumptions, and dismissive of counter-evidence as random coincidence, that it is no proof at all. For instance, if you tell Lief that you found studies that show a correlation between solar cycles and temperature in arctic lakes, or flooding of the Nile, or wheat prices in 19th century England, he will tell they that they are all statistical flukes. If pressed, he will finally aver that one has to start somewhere to stay on solid ground, even if you have to assume the ground beneath you, to make progress. (my characterization of his position) That doesn’t get us anywhere close to “bottom line” finality.
The jury is out and the experiment may, or may not, be underway to get a better handle on the issue. We will see how the solar cycles progress.
Thanks for the info Matt V. S, basically, it could go either way. Here’s my prediction; It’ll be a cold winter with many low lows or even record lows in NSW, Australia.
Look people, I’m not doing your homework for you. If you want to know why it is snowing here, and drought”ing” there, you need to understand the basic water cycle as it comes off the ocean and travels across land. You also need to study the Jet Stream’s northern track and how its loops can cause both record heat and record cold within the span of a few days. It would also be worth your while to study record weather events. Try 1996 for starters. This study will help you understand what happens when a northern track and southern track follow each other in the same fall/winter/spring season (read La Nina/El Nino). It is a fabulous study in 5th grade water cycle application combined with Jet Stream data that will be a good starting point in understanding these powerful weather pattern variation drivers. Then work your way backwards, searching for information on what drives each driver. You will be lead to the Trade Winds and ENSO, then the Coriolis affect, and finally what drives that (which I am studying right now). In other words, do your own damn pencil work. I did, and am.
What is it with people these days? They don’t want to engage themselves in a course of study on their own? They want it spoon fed and with a bib? And then get extra pay for letting someone else do their homework for them? It is a lazy, not-really-interested-in-the-answers, I-want-my-course-in-online-video-format, person who requests that someone else push their pencil for them. As a teacher, your request disgusted me.
Homework. And it is brought to you in on-line video powerpoint format. Click on the ppt button to get to the presentation. Wanna bib with that?
http://www.cpc.ncep.noaa.gov/products/analysis_monitoring/enso_advisory/index.shtml
I live in Saskatchewan, Canada… The heart of Canada’s breadbasket. It has been one of the coldests Mays and Aprils on record…
We have had only a few warm days this year… Saturday, May 30, the temperature shot up to 30C/86F… For one day… 2 days previous to this, we had frost where I live… Tonight (June 1st), a hard frost is yet again predicted for this area (there has actually been frost almost every night somewhere in Southern Canada in May… unusual.. Hard frosts in Southern Ontario in late May where normally the frost free season begins in late April)
Many farmers in this area have seen their Barley crops freeze back twice now this year.. Luckily, barley is a very cold hardy cereal grain and can recover… Wheat is not… Much of the wheat is not even up yet… Same with Canola and other crops.
There are many, many trees in Saskatoon that are still in the process of just breaking bud… and it’s June! I have never, ever seen anything like this and I have been on this earth for almost 60 years.
People here are making snide remarks about “Global Warming” and “The 117th warmest May on record” (In 118 years of record keeping here).
It’s always Marcia Marcia (15:56:34) :
“”E.M.Smith (01:26:58) : What’s undeniable is crops. They are being planted late, not sprouting due to cold soils, and not setting fruit. Grain prices show it isn’t a local isolated thing.””
I have many friends in the Philippines. Life is already hard enought there. If food prices go higher I don’t know what they will do.
Well, I live in the Northern part of California near the coast. We’ve been colder than normal (part of the cool zone that stretches up into Oregon) so my comments were more about me, here, and Canada (from the article) along with a bit of Argentina from other news.
Well, the good news for your friends is that the Philippines are tropical. The poles are cooling, but the equator is staying warm (it will take a while to cool off all that ocean…). So a place like Canada has a colder growing season, but Brazil and the Philippines don’t notice much. They may pay more for beer made from Canadian barley or bread made from Argentine wheat, but local fruits, vegetables, and rice ought to be just about the same as now. At least for the next couple of years (IMHO, of course).
A good example of this was on The Weather Channel tonight. It showed a front moving down across the central US with cold air north of it and warm south. So folks in North Dakota may have a bit of a harder time getting grains to grow (or tomatoes to set fruit 😉 at near 50F) while folks in Texas and Florida are wondering what all the fuss is about since they are at normal summer temps of 85F to 90F+. Oh, and the Anomaly Admirers say nothing is happening since when you average it all together it disappears…
I’ve watched this for a year or so now. To me, it is like a giant “Lava Lamp” with blobs of warm air pushing north to cool off and blobs of cold air pushing south from the pole (in the Northern Hemisphere, of course it would be reversed in the Southern, but I don’t see the S. H. on the nightly weather report 😉 As the N. Pole has cooled we’ve moved from a flatter jet stream to a more ‘loopy” one with the lava lamp blobs trying to equalize the temperature difference. The corollary to this is that if you are far enough away from the pole that the polar air blob never reaches you, “nothing happens” from your point of view.
Barley, Wheat, Oats all tend to be cooler climate crops and widely grown in the northern latitude land of the northern hemisphere (and in Australia and Argentina). Soybeans and rice are warmer climate crops and grown more in places like Texas, California, and yes, Asia and the Philippines. All further from this cooling blobs of polar air effect. So global wheat prices are rising. But rice, not so much:
http://futures.tradingcharts.com/hist_RI.html
Shows rice having seasonal price movements, but nothing of a trend to speak of longer term. Generally flat sideways from 2008 to date with humps up and valleys down depending on news and season.
It’s also the case that the Philippines have started growing a lot more aquacultured food, like shrimp and Tilapia, that are fairly low cost to produce. So to the extent folks are eating traditional fish, shrimp, and rice dishes they ought to see nothing much. To the extent they want imported beer and French Bread, well, that’s going to cost a bit more… but that’s probably not the poor folks…
The other good news is that to the extent wheat is grown in a warm place, like Brazil or the Philippines, the higher prices will mean more revenue to the country from exports. The rural farmers will make a bit more money, and that’s generally a good thing.
So I wouldn’t worry too much about the Philippines. I’d worry a whole lot more about the Canadian wheat farmers and the price of Labatts Blue beer… Oh, and places like North Korea where it does get cold are likely to have a very cold hard winter next year. That does not bode well given their lack of investment in improved farming; having spent their money to play with nuclear weapons and rockets instead. That is something to worry about… but that is for a different topic elsewhere…
The only real worry I’d have is that Texas gets a bit more 1930’s style drought and folks keep trying to grow corn and soybeans when they ought to shift to drought tolerant things like millet and sorghum more. That would only be a one or two year effect, most likely. Farmers catch on pretty quick and some amount of sorghum is already grown in Texas. Doesn’t take long for one guy moaning about his corn failure and another crowing about his big sorghum crop, or his millet that produced with little rain, for the shift to happen. Yes, gossip is a major driver of crop decisions! And an effective coordinating tool for improving crop choices. Strange, but true…
BTW, you can put millet flour in any corn bread recipe instead of the corn and get a very nice loaf of “millet bread”. I’m very fond of it. While many folks disparage millet as “bird seed” it is a staple food in much of drought stricken Africa. It is also one of the traditional important grains of Asia used for a kind of couscous like dish. I would speculate it had that revered position in the past due to it’s drought tolerance and high yields under adverse conditions. Sorghum flour makes a nice pancake if used instead of wheat.
And finally, I do have to point out again that the big losers in any major food price hike / shortage are not people. It is cows and pigs. We reduce the herd size to save feed costs, that cuts demand for corn and soybeans. It takes 10 kilos of grain to make one kilo of beef (or 3:1 for pork) and that’s live weight on the hoof… So if food prices try to go up much, folks eat less beef and pork. That aquacultured fish has a 1:1 feed conversion ratio, so it stays cheaper. Instead of beef ribs, you have kung pao shrimp, and the grain needed drops by quite a bit: 9/10 less. (by 9 kilos if you drop 1 kilo of beef and substitute 1 kilo of shrimp or fish) That 9 kilos less demand makes up for a heck of a lot of reduced grain yield…
So your friends are well positioned to not notice much, especially if they are willing to eat less red meat and more traditional seafood / rice meals. And maybe rediscover a millet pilaf or sorghum hoe cakes…
Something very much like this happened in the Little Ice Age. England, Ireland, Germany, Russia all embraced the potato that grew well with cold and wet. France insisted on wheat and bread, disparaging the potato. One of the contributors to the French Revolution and the “Let them eat cake” reply to the peasants having no bread to eat… So a little food flexibility can go a very long way, and a brittle approach to food can topple empires…
Miles (14:21:24) :
E.M. – I’m eternally grateful that you didn’t mention rice and beer in the same sentence.
I’ll stifle my intense curiosity and only say “Don’t read my prior posting per the Philippines!!!” 😉
Pamela Gray (18:23:48) : No need to wash fry pan. Let cool slightly and then lick it clean.
Tho I’m thuposth tuh leth ith coorl frithst?
Thathst whath I didthnth doth.. 😉
BTW, I have a ‘crop’ of dandelions in my front yard. Regularly pick a few leaves just to munch or put into a regular salad. High in some needed minerals, nice herbal medicine and they are very rich in vitamins like C, A, K along with antioxidants and even protein. They have a bit of bitter flavor (so use them for the ‘bitters’ in your salad ) and I like them fresh with a home made olive oil mustard vinaigrette… even if the neighbors don’t understand that it isn’t a lawn full of weeds, it’s my salad garden…
BTW, bunnies just LOVE dandelions… bunnies have great instincts for what plants are good for you. The are also especially fond of cabbages and peas… Oh, and soft fruit wood (nobody’s perfect 😉
Reply: Tortoises love dandelions as well, both leaves and flowers. ~ charles the moderator
Michael H anderson (10:21:28) : The hysteria hasn’t abated though, nor should any of expect it to: it is far and away the greatest gravy train in human history, one our great-grandchildren can expect to be paying for as they curse our lack of courage and gullibility.
FWIW, I don’t expect “our children” to be paying for it, nor any of the other nonsense our governments are spending boatloads of cash to promote.
Why?
I expect that pretty quick they will figure out that they have to pay back the “debt” with pretty pieces of colored paper and that those are pretty darned easy to print up in large number with very large numbers on them… It’s the folks who are loaning the government the present value of money that are paying for it all – as their bonds are going to become worth very much less long before their maturity in 20 to 30 years…
Inflation is just wonderful for erasing debts…
BTW, China has realized that this is the game, and has been shortening the maturities they hold; pulling them in to the 2 year and 5 year range. The auction of 10 year bonds had to pay high rates (and our Treasury secretary is now in China trying to explain to intelligent people that they ought to do stupid things so that stupider people can do more incredibly stupid things with the Chinese money… I think they will give him some nice warm tea and smiles; and dump more 30, 20 and 10 year bonds for 2 year bonds.) They also dumped $10B or so on Petrobras to pay for drilling out the big oil field off the coast of Brazil for a piece of the oil. Expect to see more of that too: China handing long bonds to someone else in exchange for a resource ownership position. That’s what I’m doing with my dollars too.
So it isn’t your children nor your grand children who’s pocket will be picked. It’s the folks sitting on government bonds and large U.S. dollar deposits.
If you must hold U.S. dollar bonds, do it only with Treasure Inflation Protected Securities. They have an inflation adjustment built in. TIP is the ticker for a fund that holds them. Me? I’ve sent my money off to countries with growing economies… and exempt from Kyoto. I don’t need US bonds.
Yeah, I just posted about this in another thread. It is still very cool and well under so called seasonal normals. I strongly suspect that the change of El Nino – La Nina formation has altered jet stream, perhaps increasing northerly cloud cover, strengthening northerly flows, weakening warm gulf southerlies. The net result: we’re getting snow in S. Ontario at the end of May. Unheard of in my lifetime….
Fred Houpt
You must have been born after the 1950’s
Negative PDO levels [currently -1.65] bring cooler than normal temperatures to much of western Canada right up the Great Lakes and Ontario. The average annual PDO in 2008 was [-1.29]. This is the 4th lowest since 1900, only 1950, 1955, 1956 had average annual PDO‘s lower. Those years were coldest years [annual basis] in 61 years since 1948 for many parts of Canada like the west [Northwest, Prairies, Pacific coast.] So we seem to be returning to the weather of the 1950-1970’S which were generally cooler. This could last for several decades so we might as well get used the cooler weather generally. The 2009 pattern seems to follow 2008 so far.
Does anyone follow the Artic Sea Ice News and Analysis?
http://www.nsidc.org/arcticseaicenews/
An interesting thing happened this past month. They shut down the daily reporting for a while and “recalibrated” their sensors. Up to the end of April, the sea ice area was trending towards the 1979-2000 average. After the calibration it moved back towards the historical low of 2007. It may be real but it looks a bit like the data was adjusted to expectations perhaps purposely, coincidentally or accidentally. I don’t have the skills to interpret the information, but perhaps others on this site do.
Matt: 1955. Thanks for the info. I was just reading an interesting note about how the Sun’s magnetic interplanetary field is so low and might go lower. If I’m not mistaken, in the past when the earth warmed up during the early 2000’s it was observed that almost all the other planets in our s.s. also simultaneously warmed, all the way out to Pluto! I wonder now if the reverse will be observed and if yes will any mainstream scientist have any explanation?