 Guest post by Steven Goddard
On the same day when President Obama and Prime Minister Brown separately warned of imminent economic catastrophe, the new US Energy Secretary Dr. Steven Chu issued a different catastrophe warning. The LA Times quoted him saying ““I don’t think the American public has gripped in its gut what could happen,” he said. “We’re looking at a scenario where there’s no more agriculture in California.” And, he added, “I don’t actually see how they can keep their cities going” either.”
This is a terrifying warning of drought, coming from a cabinet level official whom the LA Times describes as “not a climate scientist.” And perhaps a little surprising, since it was only two winters ago when the “world’s leading climate scientist” Dr. James Hansen, forecast a “Super El Niño” with severe flooding for California. Dr. Hansen has also warned of a return to wet El Niño conditions during the current year or so.
One of the commonly made claims from the AGW camp is that global warming is causing more El Niño events. Roger Pielke Sr. just did a web log on this topic.
El Niño Impacts: Weaker In The Past, Stronger In The Future?
“What about the future of El Niño? According to NCAR senior scientist Kevin Trenberth, ENSO’s impacts may be enhanced by human-produced climate change. El Niños have been unusually frequent since the mid- 1970s.
El Niño is famous for bringing copious amounts of rain and snow to California. I have spent several El Niño winters in the Bay Area where Dr. Chu lives, including the big one in 1998 when the rain was nearly continuous for months. Living Redwood trees were sliding across Highway 17 in the Santa Cruz mountains. I remember a wonderful weekend in LA in February, 2005 during their second wettest winter on record when they received six inches of rain in three days. It didn’t stop pouring for five seconds the entire weekend. According to NOAA:
(LA 2005) had its 2nd wettest rainfall season since records began in 1877 and the wettest season in 121 years. Over 37 inches of rain (37.25) fell downtown, just failing to reach the record 38.18 inches set during the 1883-1884 rainfall season. Average wet season rainfall for LA is 15.14 inches, making the 2004-2005 season 246% wetter than the 1971-2000 normal.
Snowfall in the Sierras is also normally high during El Niño years. Below is a graph of Lake Tahoe snowfall from 1918-2008 – official data taken from here. Not much of a trend, except to note that the Dust Bowl in the 1930s was dry, as Steinbeck and the Okies observed.
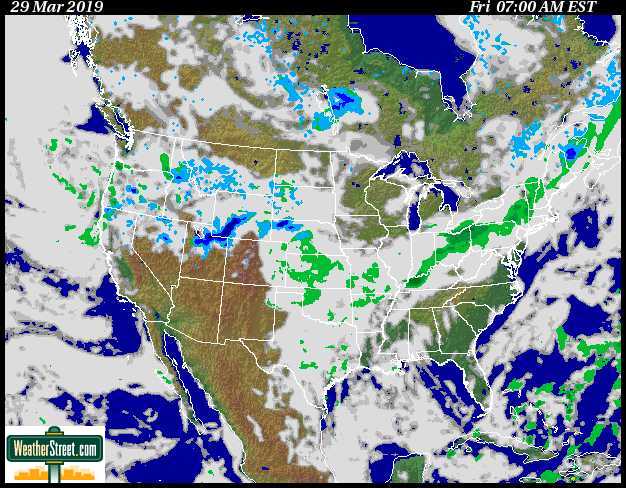
From: this spreadsheet El Niño years bring lots of water to the cities, farms and reservoirs, and allow for periods of high agricultural productivity. So I am not sure what it is that we are supposed to be terrified of – famously dry La Niña years in California, or famously wet El Niño years caused by “global warming?” The official horror story morphs so fast, it is often difficult to keep up. Reading Steinbeck, one might get the impression that dry periods are part of the normal climate cycle in California, rather than a recent invention caused by the burning of fossil fuels. President Roosevelt said at the time – “We have nothing to fear but fear itself.“Heavy rain and snow is forecast for California today.
Perhaps we now have the “Chu Effect” working in concert with the Gore Effect?

From weatherstreet.com
malcolm (21:19:36) :
You just have to come to the right blog. Tamino wouldn’t have given you that link. 🙂
I prefer to stick to the science but in this field you have to fall back on politics, religion, and chasing the money. It’s all very annoying, depressing, and expensive.
Glad to have helped open your eyes. When you have a chance, check out http://wermenh.com/climate/index.html or click my name above. BTW, I’ll be posting a “State of the Climate” article there pretty soon.
Someone ought to tell Chu he sounds like a kook.
John Philip (03:17:05) says:
Joel is correct, the rate of change over the last century is at least an order of magnitude greater than that the planet undergoes when entering an interglacial, and the idea that global mean temperature is at 1980 level is absurd. [unless you indulge in some outrageous cherry-picking of individual months].
John Philip – Your temperature graph is seriously misleading at
http://www.woodfortrees.org/plot/uah/from:1980/mean:60
You accuse others of outrageous cherry-picking, but whoever concocted this 60-month running mean is guilty of exactly that – was this your doing?
Try plotting the actual monthly data by substituting “1” for “60” in the appropriate box – then you will see real data, and the absence of any significant LT warming trend.
For those who prefer the UAH LT data source, see
http://www.atmos.uah.edu/data/msu/t2lt/tltglhmam_5.2
psi (06:13:45) :
I believe that Svensgard’s proposed mechanism for how decreased solar magnetosphere can produce increased cloud cover (which causes warming everywhere but in Antarctica)
Increased cloud cover causing warming everywhere but in Antarctica is not Svensmark’s theory.
John Philip,
Please don’t post charts by Caspar Amman. He has been widely discredited, both at CA and here: click
sonicfrog (18:16:29) :
I can’t remember the fibrous rock in that area. Is that chrysotile?
Serpentine, the ‘non-fibrous’ variant. But after weathering to microscopic particles…
From: http://en.wikipedia.org/wiki/Asbestos
White
Chrysotile, CAS No. 12001-29-5, is obtained from serpentine rocks which are common throughout the world
Asbestos can be found naturally in the air outdoors and in some drinkable water, including water from natural sources.[20] Studies have shown that members of general (non-occupationally exposed) population have tens of thousands to hundreds of thousands of asbestos fibers in each gram of dry lung tissue, which translates into millions of fibers and tens of thousands of asbestos bodies in every person’s lungs.[21]
Asbestos from natural geologic deposits is known as “Naturally Occurring Asbestos” (NOA). Health risks associated with exposure to NOA are not yet fully understood, and current US federal regulations do not address exposure from NOA. Many populated areas are in proximity to shallow, natural deposits which occur in 50 of 58 California counties and in 19 other U.S. states. In one study, data was collected from 3,000 mesothelioma patients in California and 890 men with prostate cancer, a malignancy not known to be related to asbestos. The study found a correlation between the incidence of mesotheliomas and the distance a patient lived from known deposits of rock likely to include asbestos, the correlation was not present when the incidence of prostate cancer was compared with the same distances. According to the study, risk of mesothelioma declined by 6 percent for every 10 kilometers that an individual had lived away from a likely asbestos source.[22]
Of course, it’s worse if you smoke. Especially some brands:
Kent, the first filtered cigarette on the market, used crocidolite asbestos in its “Micronite” filter from 1952 to 1956.[14]
Allan M R MacRae (07:59:12) :
John’s graph doesn’t show data for 1980, it starts with the mean of 1980-1985. It also ends 2.5 years before now. Instead of displaying stuff with just all the glorious noise, my I suggest displaying both? See http://www.woodfortrees.org/plot/uah/from:1980/mean:60/plot/uah/from:1980 – not only does it show the whole period (perhaps I should’ve started a few years earlier, but it helps to keep the Y-axis over a more familiar range). The smoothed data is flat enough to force a lot of exaggeration in the Y-axis, the noise is enough to show why you need smoothing to bring out the long term trend, but the trend now looks small enough and appears to be heading down.
Hmm, it may not be long before all the warming of the last positive PDO goes away. Interesting, I didn’t expect that to happen for a decade or two.
Hmm, this is cute – with 12 month smoothing, then the start point is warmer than the end point. http://www.woodfortrees.org/plot/uah/from:1980/mean:12/plot/uah/from:1980
The trend is still positive, it’ll take time for current conditions to remove the warm period before the PDO flip.
Roger Carr (19:10:38) :And maybe add the new research, John, which shows leaves have an inbuilt capacity to monitor and control their own temperature, thereby creating a cooler zone below them in hot weather. (”Magic” is as nothing compared to the wonders of natural things.)
Tree leaves control their own temperature
Roger, thank you! That link:
http://www.sciencecentric.com/news/article.php?q=08061131
Had such gems (bold added by me) as:
In addition, weather-forecasting models rely on accurate estimates of surface-water evaporation, much of which comes from tree leaves. Knowing the temperature of these leaves is crucial to an accurate prediction of future climate scenarios.
The research, published online in this week’s Nature, contradicts the longstanding assumption that temperature and relative humidity in an actively photosynthesising leaf are coupled to ambient air conditions. For decades, scientists studying climate change have measured the oxygen isotope ratio in tree-ring cellulose to determine the ambient temperature and relative humidity of past climates. The assumption in all of these studies was that tree leaf temperatures were equal to ambient temperatures.
Which assumption this report shows is in error…
And in some ways, my favorite:
Although there are few studies that compare tree-canopy temperatures throughout an entire growing season, a recent study using infrared thermal imaging of a mixed forest in Switzerland agreed with the current study: canopy temperature was 4-5 degrees (Celsius) higher than the cool, ambient air temperature of Switzerland.
So can we blame global warming on the trees??? 😉
But seriously, if we’re measuring temperatures and not recognizing the difference between a tree leave field and a ploughed field, we can get 4-5C of ‘warming’ that is, in fact, very very green …
DJ (19:22:35) : It is the “sceptics” who made the big switch […]
(http://www.guardian.co.uk/environment/2003/mar/04/usnews.climatechange).
Your understanding of history and terminology is worse than the climate knowledge I see here.
The Guardian… now there’s a great peer reviewed scientific journal for you…
Isn’t the IPCC the Intergovernmental Panel on Climate Change? Hmmm?
BTW, a google of: “Climate Change” 2002 yields ‘about 22,500,000 hits.
2001 yeilds 22,100,000 hits.
1990 yields 12,900,000 including on the top page both WHO and the U.N.
I think 1990 precedes your 2002 memo to the Pres to get with the current usage…
HINT: Do basic google sanity check before posting tripe from daily rags.
Something weird going on up in the Arctic. Looks like something took a bite out of the ice cap and then the whole thing came down with gray chicken pox.
REPLY: Links? Pictures?
JamesG above mentions the WUWT 9/19/07 post “Grilling the Data”.
In the comments to that post, is a link to a NOAA data adjustment chart:
http://www.ncdc.noaa.gov/img/climate/research/ushcn/ts.ushcn_anom25_diffs_pg.gif
Does anyone have a copy of that chart, as the above link seems to be dead?
Never mind. The link now works for me. Silly computers.
Wow. Even google “Climate Change” 1980
turns up stuff:
The Millenial Files – Global Climate Change and Warming, 1980-86
1980. In a report to President Carter, 13 U.S. government agencies stated … “ Inter-governmental panel on Climate Change…a United Nations group of 2500 …
Katherine: “You don’t like “climate changes”?”
If you read my comments again, you will notice that ‘climate change’ is in quotes. I was referring to the phrase as used by a political operative, Frank Luntz, who suggested using the term ‘climate change’ to downplay concerns about global warming.
The term ‘climate change’ has for long been an accepted way of referring to the effects of global warming, and the IPCC has been in existence now for 20 years.
“It’s up to the warmists to prove that the current conditions are unnatural and catastrophic.”
No. AGW climate scientists need only show that AGW is the best explanation for the current climate, ie that AGW best explains the evidence. Proof is a mathematical, not a scientific, concept.
peter_ga (22:25:11) :
Mr Chu appears to be taking the most extreme AGW predictions and running with them. That is most alarming. In a Westminster system, his job would equate to a top government minister?
I think that’s about right. Think of him as “The U.S. Ministry of Energy Minister”
Sounds like he’s bought the whole story, and has effectively given up hope of any possibility of remedial action, the situation is so critical.
The problem is psychological. The basic mind set of the AGW, green, et. al. movement is that we are all doomed because we are evil. Since basic tenets of any religious belief system can not be challenged (if you wish to stay in it); he has no choice but to ‘buy the whole story’ and ‘give up hope’…
Funnily enough, I can still find California oranges here in my local supermarket in Australia.
This is actually a direct result of economic laws.
The cost of a product + cost of shipping goes up with distance. If you ship the least valuable stuff a long ways it is only slightly cheaper than the best stuff since shipping becomes a larger percentage of price, so folks buy the best. If kept locally, the cheaper stuff is a very large percentage cheaper than the best stuff, so folks buy more of the cheap stuff. It’s a ‘better deal”.
The end result is that you will have good California Oranges in your stores long after I can find none in mine… Strange, but true…
(This is also part of why they sell 1/4 pound lobsters at roadside stands in Maine, but bigger ones are air freighted around the world…)
Roger Carr (21:41:29) :
It riles the experts to say so, buit I have seen white-painted weatherboard (clapboard USA?) houses still standing after a bushfire (wildfire USA) has gone through and eaten every other house of various other materials for breakfast…
Dunno quite why these experts get so het when this little piece of bush lore is mentioned.
I don’t understand it either. There is no need for homes to ever burn in brush fires.
White stucco outside, tile roof, steel ‘storm shutters’ over windows (to prevent radiative heat transfer to drapes et. al.) and undercoat the eaves with retardant materials. Oh, and no brush growing against the house…
Cheap. Easy. Rarely done…
Smokey: “With you, AGW is completely political…Go ahead, deny it.”
No it’s not.
“But your last paragraph makes it crystal clear to the most casual observer where you’re coming from.”
Let’s try that again. A political party operative offers PR advice to obfuscate the science of global warming. That makes me a political operative? You’ve probably heard of a non sequitur.
“Look at Katherine’s post above. Is she stupid, too? Is she deluded?”
Whether or not you accept AGW is a matter of judgement. I cannot say with any certainty how people arrive at their judgements. I think some people on both sides of the issue arrive at their position through temperament and ideological views. Since I don’t know Katherine, I cannot say how she arrived at her views.
“Should we unquestioningly accept what you hypothesize, without any measurable empirical evidence to back you up?”
Smokey, you have a habit of wearing your heart on your sleeve. I am not demanding that you unquestionably accept anything, and especially not what I say. You find the evidence for AGW unconvincing. That’s fine. But most climate scientists who are doing the scientific work accept AGW, with whatever uncertainties about some aspects and possible outcomes.
Psi: “Time to huddle and see if you can agree, before you try to convert the unwashed masses.”
No need. I’m talking about ‘natural variation’ as a theory to rival ‘AGW’. The overarching term ‘natural variation’ is consistent with all phenomena, and therefore “explains everything and nothing”.
This is exactly what the observations show. The SOI is going increasingly negative … – unprecedented behaviour and driver for the highly unprecedented drought in southern Australia.
The SOI has been strongly positive for the last 2 years.
http://www.bom.gov.au/climate/current/soi2.shtml
The so called drought in a smallish area of south eastern Australia isn’t ‘highly unprecedented ‘. It isn’t even ‘ordinarily unprecedented’. It’s within the normal climate range for the area as shown by the climate record.
As is normal with positive SOI/La Nina conditions, the north of Australia has had recent widespread heavy rain and floods.
BTW, I live in southern Australia and not only have our recent annual rainfall been normal to a little above normal, the trend over recent years has been toward wetter years, again consistent with a positive SOI and PDO shift.
The models and AGW proponents like Hansen who predicted negative SOI conditions and more El Ninos were plain wrong.
And people like DJ who claim to have knowledge and deride the rest of us for not having that knowledge, need to get over their cognitive dissonance at the models and claimed experts failing in their predictions and look at current data.
Brendan H, in a rhetorical sleight of hand, says:
Except, that since those climate scientist you claim mostly agree, are no where near to understanding the planet’s climate systems, so you cannot dismiss natural variation in the system. The confidence with which you assert human agency reminds me of the problems early scientists had in removing man from his central position in the universe. This time around it also has a strong feel of religion and politics.
To get an feel for the quality of some of those so-called climate scientists it is worth checking out ClimateAudit.
Smokey says:
Here is where you have made a fatal error: Yes, it is true in science that a hypothesis has to convince one’s fellow scientists in order to become accepted in the scientific community. Indeed, it must and indeed that is what AGW has done.
Now, you personally may not be convinced, but there is no rule that AGW remains an unsubstantiated hypothesis just because YOU believe it to be so any more than evolution remains an unsubstantiated hypothesis because lots and lots of people on the web seem to think this is the case (as a google search on “evolution unsubstantiated hypothesis” will verify). Or, to put it another way, it may remain an unsubstantiated hypothesis in your mind but that bears absolutely no relation to its status according to the scientific community.
JamesG … I’m fairly sure we can likely trust the satellite data from 79, which of course shows warming for 20 years and plateauing for 10 years.
I see: so the satellite data is clean but the adjusted surface record suspect? This gives us the opportunity to assess just how severe is the contamination from these adjustments by comparing the two…. Hmmmm – do you see anything to worry about? I don’t.
Alan MRM John Philip – Your temperature graph is seriously misleading at ….You accuse others of outrageous cherry-picking, but whoever concocted this 60-month running mean is guilty of exactly that – was this your doing?
Yep, I commonly use a 5 year smoothing as a way of averaging out the large interannual variability [aka noise] and so show the underlying trend. But then so does a lot of the climate science discipline, its a totally standard, mundane, unremarkable practice, and it clarifies, it does not mislead.
y plotting the actual monthly data by substituting “1? for “60? in the appropriate box – then you will see real data, and the absence of any significant LT warming trend.
I wish that were true, however the linear trend shown was the trend in the raw data, approx 0.13C / decade in UAH, pretty much consistent with the IPCC projections for this period. Certainly the proposal of no change since 1980 is unsupported by the data. Here is all the data, with OLS trend and 5 year mean.
For those who prefer the UAH LT data source, see
http://www.atmos.uah.edu/data/msu/t2lt/tltglhmam_5.2
If you click the ‘raw data’ link on the graph, you will see that this is the data that is being plotted.
Smokey: Please don’t post charts by Caspar Amman. He has been widely discredited I think we are best relying on the moderators to choose what may or may not be referenced, don’t you? Two blogs ‘discredit’ peer-reviewed journal papers? That day has yet to come, but since you dislike that particular messenger, here’s the message again: http://www.ipcc.ch/ipccreports/tar/vol4/english/wg1figspm-4.htm
Dammit – there’s a broken link in the last post, here’s the para again
Yep, I commonly use a 5 year smoothing as a way of averaging out the large interannual variability [aka noise] and so show the underlying trend. But then so does a lot of the climate science discipline, its a totally standard, mundane, unremarkable practice, and it clarifies, it does not mislead.
When is WordPress going to get a ‘Preview’ button??
REPLY: John if the lack of a preview button irritates you so much, please go elsewhere. I have no control over it. – Anthony
Joel Shore says:
That seems to be a hobbyhorse of yours, doesn’t it Joel. That is, insinuating in as many ways as you can that those of us who are not convinced of the AGW religion are creationists.
For the record, again, I find that “much in Biology does not make sense until you understand natural selection and evolution.” However, I have moved well beyond the simplistic and Marxist views of Stephen Jay Gould and Lewontin.
Also, for the record, the evidence that the Earth is billions of years old is convincing and that the Universe is even older is also convincing.