 Guest post by Steven Goddard
On the same day when President Obama and Prime Minister Brown separately warned of imminent economic catastrophe, the new US Energy Secretary Dr. Steven Chu issued a different catastrophe warning. The LA Times quoted him saying ““I don’t think the American public has gripped in its gut what could happen,” he said. “We’re looking at a scenario where there’s no more agriculture in California.” And, he added, “I don’t actually see how they can keep their cities going” either.”
This is a terrifying warning of drought, coming from a cabinet level official whom the LA Times describes as “not a climate scientist.” And perhaps a little surprising, since it was only two winters ago when the “world’s leading climate scientist” Dr. James Hansen, forecast a “Super El Niño” with severe flooding for California. Dr. Hansen has also warned of a return to wet El Niño conditions during the current year or so.
One of the commonly made claims from the AGW camp is that global warming is causing more El Niño events. Roger Pielke Sr. just did a web log on this topic.
El Niño Impacts: Weaker In The Past, Stronger In The Future?
“What about the future of El Niño? According to NCAR senior scientist Kevin Trenberth, ENSO’s impacts may be enhanced by human-produced climate change. El Niños have been unusually frequent since the mid- 1970s.
El Niño is famous for bringing copious amounts of rain and snow to California. I have spent several El Niño winters in the Bay Area where Dr. Chu lives, including the big one in 1998 when the rain was nearly continuous for months. Living Redwood trees were sliding across Highway 17 in the Santa Cruz mountains. I remember a wonderful weekend in LA in February, 2005 during their second wettest winter on record when they received six inches of rain in three days. It didn’t stop pouring for five seconds the entire weekend. According to NOAA:
(LA 2005) had its 2nd wettest rainfall season since records began in 1877 and the wettest season in 121 years. Over 37 inches of rain (37.25) fell downtown, just failing to reach the record 38.18 inches set during the 1883-1884 rainfall season. Average wet season rainfall for LA is 15.14 inches, making the 2004-2005 season 246% wetter than the 1971-2000 normal.
Snowfall in the Sierras is also normally high during El Niño years. Below is a graph of Lake Tahoe snowfall from 1918-2008 – official data taken from here. Not much of a trend, except to note that the Dust Bowl in the 1930s was dry, as Steinbeck and the Okies observed.
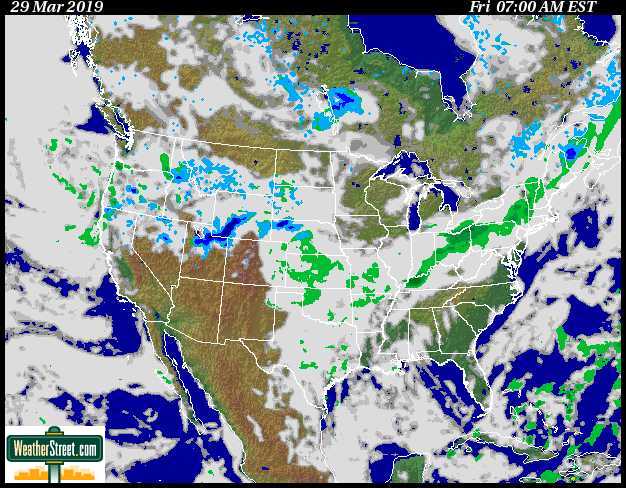
From: this spreadsheet El Niño years bring lots of water to the cities, farms and reservoirs, and allow for periods of high agricultural productivity. So I am not sure what it is that we are supposed to be terrified of – famously dry La Niña years in California, or famously wet El Niño years caused by “global warming?” The official horror story morphs so fast, it is often difficult to keep up. Reading Steinbeck, one might get the impression that dry periods are part of the normal climate cycle in California, rather than a recent invention caused by the burning of fossil fuels. President Roosevelt said at the time – “We have nothing to fear but fear itself.“Heavy rain and snow is forecast for California today.
Perhaps we now have the “Chu Effect” working in concert with the Gore Effect?

From weatherstreet.com
George – it was Bruce Cobb who introduced the Inhofe/Morano list as ‘disproof’ of the concensus amongst scientists, my response was to point out, with perhaps the most extreme example, that the list of prominent, sceptical, scientists actually contains many who clearly fail to qualify on one or more of these criteria, hence does not even dent the concensus. Morano’s aim is propaganda rather than science and his modus operandi is to trawl the media for any vaguely ‘sceptical’ statement – whether it is from a politician [e.g. Lord Lawson], an economist [e.g. Richard Tol, who is certainly not a sceptic of AGW], an engineer [e.g Bob Edleman], a mathematician [e.g. Richard Mackey] or indeed a TV Gardener, and then spin it up into the demonstrably untrue statement that here are ‘650 prominent scientists’ who disagree with the concensus. Once again it seems that ‘scepticism’ is unevenly applied; if I were a US taxpayer I would be outraged at my money being expended on this absurd and meritricious document.
As for engaging with the ‘scientific arguments’ proposed in Morano’s document, this would be a pure waste of my time. The place for scientific arguments to be advanced is the scientific literature, not some PR exercise. If these arguments have merit the proponents can publish them in a paper in the appropriate journal for scrutiny by the appropriate experts, so far precious few of these Morano’s eminences have attempted this, the ‘gold standard’, scientificially speaking, and the concensus is in fact based upon the findings in the published literature.
If you’re really interested, Ray Pierrehumbert, who in my view does qualify as an eminent scientist, and author of a textbook on the Physics of Climate, and who clearly has more patience than I, engages with Morano in the comments to this discussion [Especially comments 51, 72, 91, 96, 109, 144, 185, 199, 204] on a NY Times blog, making Marc Morano this offer … so how about we play it this way: Every time you respond, I’ll expose another one of your skeptics. I’m in no rush. Maybe in a few months we’ll get to the bottom of your list …, continued here [comments 60, 81, 111, 113, 156, 174, 196, 197, 200, 219, 264, 304, 394, 450, 415, 434-5, 450, 453, 481, 485, 521, 550, 558, 564, 578, 581, 867 ] until the moderator closed out the comments at 1200.
Cheers.
See how George Bush conquered global warming – page 7.
In truth, George didn’t have much to do with it – it was all Al Gore’s doing; right after he invented the internet. 😉
http://scienceandpublicpolicy.org/images/stories/papers/originals/jan_co2_report.pdf
The Bush Years: 8 years’ global cooling
SPPI’s Monthly CO2 Report shows that throughout the eight years of George Bush’s presidency there has been a downtrend in global temperature at a rate equivalent to 2 °F (1.1 °C) per century.
Main points –
Since Al Gore’s climate movie An Inconvenient Truth was launched in January 2005, global cooling has occurred at the equivalent of 11 °F (6 °C) per century. If this very rapid cooling were to continue, the Earth would be in an Ice Age by 2100.
The UN’s climate panel, the IPCC, had projected temperature increases at 4.5 to 9.5 °F (2.4 to 5.3 °C) per century, with a central estimate of 7 °F (3.9 °C) per century. None of the IPCC’s computer models had predicted a prolonged cooling.
The IPCC’s estimates of growth in atmospheric CO2 concentration are excessive. They assume CO2 concentration will rise exponentially from today’s 385 parts per million to reach 730 to 1020 ppm, central estimate 836 ppm, by 2100.
However, during President Bush’s eight-year term, CO2 concentration rose in a straight line towards just 575 ppmv by 2100. This alone halves the IPCC’s temperature projections. Since 1980 temperature has risen at only 2.5 °F (1.5 °C) per century.
The University of Colorado has published no sea-level data from the JASON monitoring satellite since the summer of 2008. However, sea level has been rising at just 1 ft (32 cm) per century, well below the IPCC’s recently-reduced 2 ft maximum.
Sea ice extent in the Arctic recovered to the 30-year average during the early winter of 2008. In the Antarctic, sea ice extent reached a record high late in 2007, and has remained plentiful since. Global sea ice extent shows no trend for 30 years.
The Accumulated Cyclone Energy Index is a 24-month running sum of monthly energy levels in all hurricanes, typhoons and tropical cyclones. The Accumulated Cyclone Energy Index hit a 30-year low in October 2008.
A paper explaining how SPPI’s CO2 and temperature graphs are computer-generated is under peer review and will be available soon.
For future editions of the Monthly CO2 Report, go to http://www.scienceandpublicpolicy.org.
Anthony Watts, Steve McIntyre and Joe d’Aleo have all done outstanding work on ST data integrity, or the lack thereof. Here is a good compilation.
Response to Gavin Schmidt on the Integrity of the Global Data Bases
By Joseph D’Aleo, CCM, AMS Fellow
http://icecap.us/images/uploads/URBANIZATION_IN_THE_TEMPERATURE_DATA_BASES.pdf
Allan M R MacRae says:
I don’t see how Simon’s use of all the data available from when the satellite record started until now is cherrypicking. It is simply comparing the datasets over the entire time period for which one could possibly compare all 4 data sets…And, importantly, it is over a long enough time period that the error bars for the trends are relatively small and thus the comparison is meaningful.
By contrast, your comparison is over a much shorter time period and one for which, if you haven’t cherry-picked, I certainly can’t figure out any rational justification for. Furthermore, the trends (while they may like dramatic the way you have plotted them) are smaller in magnitude and the error bars are likely considerable. And, given that trends over shorter time periods are likely to be more greatly affected by differences in the analysis (e.g., the GISS data includes the arctic region while the HADCRUT data does not), it is not surprising to see some divergence of this sort for trends in noisy data over short time periods. So, while “covered in cherry juice” you may be, but I don’t think it is fair to blame Simon for any of it.
“No, George – evidence of one example of dishonesty is evidence enough of dishonesty. ”
Oh, really?
“Would you care to give me evidence of my wilful ignorance, Gary, rather than just asserting the prejudice you have built up over time?”
Please review, at your leisure, the evidence at CA and its voluminous threads. I used Fortran 77 in Numerical Analysis back in the day, I wrote scripts to wend one ASCII parsing routine with the next. GISTemp code is a crime against nature.
Arguing the superiority of ground-based data for its Arctic data, and finding it all interpolated was minor. Finding that a routine to identify rural sites by light cast at night was not used to correct nearby urban sites for UHI but to adjust the rural data prior to the baseline of these very sites was the clincher.
Hansen is a fraud, QED. The ‘debate’ is over.
Re: Waves off California coast: from NWS for 2-10-2009:
TONIGHT
NE PORTION….SW WINDS 20 TO 30 KT EARLY…BECOMING
SHIFTING WINDS 15 TO 25 KT LATE. SEAS BUILDING TO 21 TO 26 FT.
SW PORTION…W TO SW WINDS 25 TO 35 KT EARLY…SHIFTING TO NW 35
TO 45 KT LATE. SEAS BUILDING TO 26 TO 34 FT…HIGHEST SW.
NUMEROUS SHOWERS THROUGHOUT.
gary gulrud (11:39:23) :
“No, George – evidence of one example of dishonesty is evidence enough of dishonesty. ”
Oh, really?
I have posted that the Hadley trend exceeds the GISS trend over the latter’s period of record. Is that true or is it false? A simple question that invites a simple, honest answer. Lucia has blogged to the same effect:
http://rankexploits.com/musings/2009/trends-since-1900-gisstemp/
I look forward to your response.
“”” John Philip (01:51:56) :
George – it was Bruce Cobb who introduced the Inhofe/Morano list as ‘disproof’ of the concensus amongst scientists, my response was to point out, with perhaps the most extreme example, that the list of prominent, sceptical, scientists actually contains many who clearly fail to qualify on one or more of these criteria, hence does not even dent the concensus. “””
Must be something wrong with my new browser John; so it erased the part where you quoted Bruce Cobb; leading to me to presume it was your assertion.
That must be why I can’t decipher half of the posts here, since it is not clear who is saying what, rather than cut and pasting something someone else said. After 12 reposts and pastes, it gets a little confusing.
And yes I’ve read quite a few of those ad hominem blogs to see how they rate the persons on Morano’s list; those with whom I am familiar. Typical of the ad hominem approach; they seldom get much right. And who vets the bloggers? Cheapest thrill in town hiding behind a curtain with a booming voice that people are supposed to shudder over.
For the record, Marc Morano, actually collects whatever he can find in anything that appears to be some recognised publication; such as New Yprk times for example. If it leads to a real scientific paper citation, he will obtain that; or try to obtain it, so he can send that out to his mailing list.
He has a short list of maybe 30-40 people; well actually several lists, since some people don’t want to bother with a lot of those things they already know about. And those on the short list actually communicate with each other, so they can vet any paper that Morano turns up, and inform him (in their opinion) as to whether it is real, imaginary, exaggerated, total nonsense or what have you, so he can wean out stuff that it BS.
I belong to the AAAS among other Scientific Societies, eg The Optical Society of America;one of the founding groups of the American Institute of Physics; so I routinely send Morano the weekly table of contents of SCIENCE magazine, and sometimes point to climate or energy articles that he may find of use to circulate, or for his own education. He can only access the abstracts for such articles from AAAS, but I can send him the full paper if he finds it interesting.
So to you it may appear like propaganda; which would be understandable because nobody in the Climate Science Community would ever stoop to propaganda; But I believe Marc Morano considers it a service to Senator Inhofe, and his EPW Committee minority group; to keep them up to date on related matters.
Somewhat of a contrast to Barbara Boxer who simply has Hansen or Al Gore come in and bloviate.
If you are quite happy with your government operating in that mode; that is your choice. I’m not a citizen, so I don’t communicate directly with Senator Inhofe; I think that is usurping privileges I don’t have; but it seems worthwhile to me to at least try and educate Marc Morano,to the extent that he can understand the issues.
But I can certainly understand that those who swill at the public trough, may feel that to be threatened by public disclosure of the reality of climate situations. It would be inconvenient for some to suddenly find the government not funding their gravy train; when the truth sinks in. They might have to actually go out and get a real job, in a real economy.
So our new President urges sudden action on his “Stimulus” package, which he swears contains no pork; but somehow it creates 400,000 new government jobs at a cost of $220,000 each; would that I be so lucky as to make that kind of money. And after they build that bridge (the non pork bridge) then of course all those people will be unemployed again. I call that a spending bill, not a stimulus bill.
John – You can nitpick the list of 650 scientists all you want, but your claim that the list “does not even dent the concensus” is absurd, and just political spin on your part. Especially since, “the consensus” is all just a myth to begin with, and actually based on politics, not science. But, since you are so interested in your mythical, political “consensus”, check out this recent posting on this blog for a number of links to articles totally debunking the so-called “consensus”.
Link
the concensus is in fact based upon the findings in the published literature.
Wow, so we have a myth based upon computer models based upon a long-discredited hypothesis. Talk about being on shaky ground!
Allan M R MacRae:
By the way, Lucia (who is hardly a stalwart defender of the IPCC) has a post on the “artfulness” of one of the graph’s (p. 6) in this propaganda piece over at her blog: http://rankexploits.com/musings/2009/more-artful-graphs-from-monckton/
Bruce Cobb says:
So, are you saying that the ability to assemble a list like Inhofe has shows that any consensus on climate change is a myth? If so, would you say the same is true in regards to evolution on the basis of this list: http://www.christiananswers.net/q-eden/edn-scientists.html If not, what makes the one case different from the other?
Reply: I’m going to allow this post because the analogy it makes has some logical validity however, discussions of creationism and intelligent design are prohibited at this site. This will not be allowed to spin out into a discussion of such. ~ charles the moderator
“I look forward to your response.”
Fake but accurate.
Joel Shore,
You might want to read what Lucia says in full. I like this from your link in particular:
“I find that the IPCC projected trend for this period would be rejected if we use 90% confidence levels.”
What do you think she is trying to say about the IPCC?
As to the pedigrees of those who are skeptical of AGW, sine most of the IPCC is no more qualified, and many of the AGW leadership are the same, I think this is a red herring for the AGW community to further dissemble with.
Joel Shore says:
So, are you saying that the ability to assemble a list like Inhofe has shows that any consensus on climate change is a myth? If so, would you say the same is true in regards to evolution on the basis of this list: http://www.christiananswers.net/q-eden/edn-scientists.html If not, what makes the one case different from the other?
No Joel. The Inhofe list is evidence that whatever “consensus” there was is actually losing ground, and is one example only. Do try to keep up.
And Joel, your feeble attempt to compare skeptics with anti-evolutionists is nothing more than a blatant ad hominem, and is very typical of the sleazy tactics you and your ilk continually use. It is a measure of the complete lack of any scientific foundation of your arguments that you feel the need to resort to that.
Not really. The sat records aren’t nearly long enough to have covered several of the known and emerging (as far as our knowledge is concerned) ocean, atmospheric and solar cycles. They’re just blips in time, really.
Bruce Cobb:
It is not evidence of that at all. I would look toward more objective measures than Inhofe press releases. Some such measures: The Global Climate Coalition has gone defunct and many of the companies that were part of it now accept the science on AGW. And, more and more corporations, including ones in the power industry, are accepting the science. Amongst scientific organizations, even the American Society of Petroleum Engineers, which was the only major scientific society with an openly challenging statement on AGW has adopted a new statement which one would best characterize as “non committal” (see here: http://en.wikipedia.org/wiki/Scientific_consensus_on_climate_change ).
That’s just silly. It is not ad hominem at all. You are the ones who are introducing this list of Inhofe’s as some sort of important piece of evidence. Now, we can tell you ’til we are blue in the face that the credentials of most of the signers are not very impressive (and a few of the more impressive ones have apparently asked to be taken off of the list). [And, as an aside since you mention it, we can also tell you ’til we are blue in the face where you get the science wrong…and have actually spent considerable time here doing so.]
However, sometimes when someone presents a piece of evidence such as this list which they somehow think is so compelling, the easiest way to point out why it is not compelling is to show how a similar list can be created to argue for a point of view that I think a much wider group of us here, in both the AGW and skeptics-of-AGW camps, would agree is not scientifically tenable. It’s sort of “a demonstration is worth a thousand words” statement.
I have sort of an interesting story / analogy in this regard: Several years ago, Harper’s Magazine published in their “readings” a piece by an English professor by the name of Wallace who took various paragraphs from Lewis Carroll’s work and created anagrams that were quite ghoulish and in some cases even somewhat confessional, and tying this in with Carroll’s known enjoyment of anagrams and word games, he tried to argue that this suggested that Lewis Carroll should be considered the prime suspect of having been “Jack the Ripper”.
Now, I am sure that someone could give a nice lecture about how easy it is to anagram a long enough piece of text to say virtually anything…and he might manage to convince some people to be very skeptical of Wallace’s thesis. However, what two brilliant readers did instead was to take the first paragraph of Wallace’s piece and produce from it an anagram that had him confessing to killing Nicole Simpson and framing O.J. Their anagram was so good…in fact so much better than any of them in Wallace’s piece…that I was skeptical that it was an an exact anagram and actually wrote a piece of code to verify to myself that it was!
By providing such a compelling demonstration, what these two people did was to create a stronger argument why Wallace’s thesis was bunk than anyone could possibly have made directly. And so (in an admittedly less brilliant and creative way), that is what I am trying to do here: I can argue until I am blue in the face about how easy it is to find the names of 650 scientists to agree with something, especially if you set your standards low enough, or I can simply provide a demonstration of the fact that similar lists do indeed exist to defend a scientific idea that I think we could have quite wide agreement here is not tenable.
If anyone wants to read the Lewis Carroll anagram story, there is a Wikipedia page about it: http://en.wikipedia.org/wiki/Jack_the_Ripper,_Light-Hearted_Friend (Yeah…I know this is a tangent, but trust me, it is a very amusing one!)
Jeff Alberts says:
Well, compared to the sort of lengths of time over which trends seem to have attracted interest around here, I would say they are considerably more than just blips in time. Furthermore, the sort of statistical evaluations that one can do to determine the uncertainty in a trend from the behavior of the data show the trends to be much less uncertain than for the trends over the shorter time periods of, say, ~10 years or less that have been so popular of late.
hunter says:
Actually she then goes on to say, “The trend would fail to reject at 95% confidence.”
Furthermore, you have to be very careful in how you play the game with these confidence levels. This is best illustrated by the point that if you repeat a study 10 times, it is very likely by chance to find that in one of the studies, you reject a hypothesis at the 90% confidence level even if it is correct. In this case, we have lots of years of data that are somewhat analogous to the repeating of a study many times (not quite because of correlation in the data and such). And, we know for the fact that we are now just coming off a significant La Nina that caused a significant cooling over the last couple of years. So, it would also be interesting to ask: Did the trend through, say, 2006 also reject at the 90% confidence level? And, a few years from now, what does the trend show?
Along these lines, here is a study of how the temperature trends were comparing with the IPCC predictions through 2006: http://www.sciencemag.org/cgi/content/abstract/sci;316/5825/709 At that point, the temperature trends were not only within the IPCC projections…They were actually toward the high end. So, I would caution against trying to jump to conclusions too quickly unless you want to give yourself whiplash!
You won’t have seen me say anything about so-called trends in recent years. So I can’t speak to that. I’m not sure how you can determine uncertainty with a incredibly short 30 year data set. How do you know a 30 year trend is “certain” over a 10 year one? And given that, a thousand year trend would be even more certain.
There are standard ways to compute the uncertainty in a linear trend from a data set on the basis of how much the data deviate from a straight line. For data that has noise that has no correlation in time, it is pretty straightforward. For temperature data sets, where such time correlations do exist, it gets more complicated.
Admittedly, such trend analyses can’t speak to the point of whether the trend is part of a longer term cycle (over some time period longer than the data) …but it can speak to the question of how reliable the estimate of the linear trend is for the data over the time period that the data is analyzed.
New All-Time Low Temperature Recorded in Maine
http://www.erh.noaa.gov/car/News_Items/2009-02-10_item001.htm
Minus 50 degrees F on 16 January 2009, breaking the old record of -48dF set in 1925.
I recently read a news report out of the UK that claimed the extreme cold just experienced in Europe was caused my global warming. No, it did not seem to be a satire – just another tall tale from that lovable but goofy global warming gang.
I really wish the warmists were right – I am getting tired of all this damned cold – but the groundhog and I expect the LT anomaly to drop considerably by May 2009.
Stay tuned, and bundle up!
Regards, Allan
It may have been this article, or another similar one.
“Warming causes cooling… … Down is up… …Less is more.”
http://www.telegraph.co.uk/topics/weather/4436934/Snow-is-consistent-with-global-warming-say-scientists.html
Snow is consistent with global warming, say scientists
By Richard Alleyne, Science Correspondent
Last Updated: 6:41AM GMT 03 Feb 2009
Britain may be in the grip of the coldest winter for 30 years and grappling with up to a foot of snow in some places but the extreme weather is entirely consistent with global warming, claim scientists.
Temperatures for December and January were consistently 1.8 F ( 1 C) lower than the average of 41 F (5 C)and 37 F (3C) respectively and more snow fell in London this week than since the 1960s.
But despite this extreme weather, scientists say that the current cold snap does not mean that climate change is going into reverse. In fact, the surprise with which we have greeted the extreme conditions only reinforces how our climate has changed over the years…
icecap.us comments:
Sorry guys, the jig is up. Yes weather is different from climate but a climate regime change has taken place which will mean this kind of weather will happen more frequently. Your excuses and claims will seem more and more ludicrous with each passing storm or cold day/season. Better either open you minds or start looking for another line of work.
http://www.telegraph.co.uk/topics/weather/4436934/Snow-is-consistent-with-global-warming-say-scientists.html
So, Allan M R MacRae, please be so kind and point out, where exactly your “Warming causes cooling” quote comes from.
Joel Shore says:
The Global Climate Coalition has gone defunct and many of the companies that were part of it now accept the science on AGW. And, more and more corporations, including ones in the power industry, are accepting the science.
Who cares what an industry group or individual corporations do or say about AGW? Can you say “self-interest”? Being on board the AGW bandwagon is good for the bottom line, that certainly doesn’t mean it is good science. Nice try, Joel.
That’s just silly. It is not ad hominem at all. You are the ones who are introducing this list of Inhofe’s as some sort of important piece of evidence.
Nonsense, Joel. Of course it’s ad hominem. Now you are simply being disingenuous. It is a deliberate attempt on your part to try to tar skeptics with the same brush as the anti-evolutionists. Nice try.
Besides, you conveniently ignore all of the other evidence debunking the consensus myth in the recent posting on this blog giving a number of links to articles totally debunking the so-called “consensus”.
Finally, your mythical consensus is purely a political construct, useful for propaganda purposes. In no way does it validate the flimsy science of AGW, but people who aren’t familiar with how science works often don’t know that, which of course is what the AGW propagandists are counting on.