 Guest post by Steven Goddard
On the same day when President Obama and Prime Minister Brown separately warned of imminent economic catastrophe, the new US Energy Secretary Dr. Steven Chu issued a different catastrophe warning. The LA Times quoted him saying ““I don’t think the American public has gripped in its gut what could happen,” he said. “We’re looking at a scenario where there’s no more agriculture in California.” And, he added, “I don’t actually see how they can keep their cities going” either.”
This is a terrifying warning of drought, coming from a cabinet level official whom the LA Times describes as “not a climate scientist.” And perhaps a little surprising, since it was only two winters ago when the “world’s leading climate scientist” Dr. James Hansen, forecast a “Super El Niño” with severe flooding for California. Dr. Hansen has also warned of a return to wet El Niño conditions during the current year or so.
One of the commonly made claims from the AGW camp is that global warming is causing more El Niño events. Roger Pielke Sr. just did a web log on this topic.
El Niño Impacts: Weaker In The Past, Stronger In The Future?
“What about the future of El Niño? According to NCAR senior scientist Kevin Trenberth, ENSO’s impacts may be enhanced by human-produced climate change. El Niños have been unusually frequent since the mid- 1970s.
El Niño is famous for bringing copious amounts of rain and snow to California. I have spent several El Niño winters in the Bay Area where Dr. Chu lives, including the big one in 1998 when the rain was nearly continuous for months. Living Redwood trees were sliding across Highway 17 in the Santa Cruz mountains. I remember a wonderful weekend in LA in February, 2005 during their second wettest winter on record when they received six inches of rain in three days. It didn’t stop pouring for five seconds the entire weekend. According to NOAA:
(LA 2005) had its 2nd wettest rainfall season since records began in 1877 and the wettest season in 121 years. Over 37 inches of rain (37.25) fell downtown, just failing to reach the record 38.18 inches set during the 1883-1884 rainfall season. Average wet season rainfall for LA is 15.14 inches, making the 2004-2005 season 246% wetter than the 1971-2000 normal.
Snowfall in the Sierras is also normally high during El Niño years. Below is a graph of Lake Tahoe snowfall from 1918-2008 – official data taken from here. Not much of a trend, except to note that the Dust Bowl in the 1930s was dry, as Steinbeck and the Okies observed.
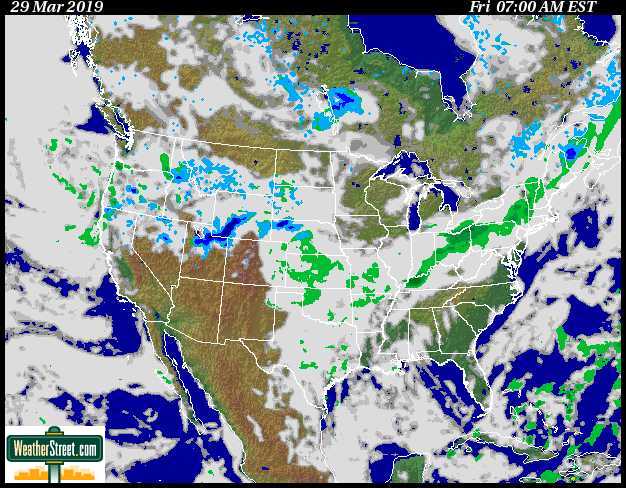
From: this spreadsheet El Niño years bring lots of water to the cities, farms and reservoirs, and allow for periods of high agricultural productivity. So I am not sure what it is that we are supposed to be terrified of – famously dry La Niña years in California, or famously wet El Niño years caused by “global warming?” The official horror story morphs so fast, it is often difficult to keep up. Reading Steinbeck, one might get the impression that dry periods are part of the normal climate cycle in California, rather than a recent invention caused by the burning of fossil fuels. President Roosevelt said at the time – “We have nothing to fear but fear itself.“Heavy rain and snow is forecast for California today.
Perhaps we now have the “Chu Effect” working in concert with the Gore Effect?

From weatherstreet.com
When talking about white roofs, do not forget that absorption takes place in the visible and the infrared, while emission is infrared only. Absorption in the visible and infrared are not related, e.g. you have radiator paint that is white in the visible and black in the infrared.
Furthermore it pays off to look at what Chu actually said. I took the first hit on google. It goes to an interview with the Taipei Times
Flat roof buildings in cities, no paint required. Motl refers to the very same interview. Interestingly, the interview does not even mention paint, while on Motl’s blog you will find
(emphasis added)
John Philip (03:17:05) :
“It is actually the ‘natural-only’ advocates who have the evidence shortage; no known natural driver of climate is capable of explaining the recent trend, whereas it is entirely consistent with natural fluctuation superimposed on an anthropogenically-forced rising trend.”
I hope you’re satisfied with that, because that’s all you’ve got. A teeny trend from CO2 that can’t even overcome a solar minimum and a PDO flip in tandem. And I bet you still hang on to your aerosols to explain all the cooling during the last warm to cool flip of the PDO. No volcanoes to pin the current cooling on. And that recent warming trend which you fiercely hang on to as some kind of ‘proof’, had underneath it the PDO flipping warm as well as the AMO.
You can’t shush that ‘weather noise’ with the pathetic whimper of CO2.
Joel Shore (19:42:05)
I tend to look upon AGW and creationism as unsubstantiated hypotheses. What’s more, I am somewhat worried by the AGW defenders almost religious way of approaching those who dare to disagree. After all, “jail the deniers” is not all that far away from “death to the infidel” or “crucify the christians”, at least not conceptually.
this graph suggests there has been no net global warming since 1940, despite an ~800% increase in humanmade CO2 emissions.
I used Hadcrut3 ST from 1940 (despite of its warming bias), and UAH LT thereafter.
What do you think?
I think you have spliced together two anomaly time series with different baselines [UAH is the anomaly from 1979-1999, Hadley from 1961 – 1990], and therefore drawing any conclusions drawn from the graph is as valid as comparing the heights of two people when one of them is standing on a box.
Katherine -“And, no, statistical models don’t count as empirical data.”
Just a small correction – the GCMs are not statistical models, they are ‘physical’ models. I’m not convinced that makes them any more accurate, but it’s important to understand the difference.
For example, one hears the argument that the banks’ models let them down so badly that we should not trust climate models. The (reasonable) response is that financial models were statistical not phsyical, so the argument isn’t a good one.
John Philip (04:22:04) :
Allan said:
This graph suggests there has been no net global warming since 1940, despite an ~800% increase in humanmade CO2 emissions.
I used Hadcrut3 ST from 1940 (despite of its warming bias), and UAH LT thereafter. What do you think?
JP says: I think you have spliced together two anomaly time series with different baselines [UAH is the anomaly from 1979-1999, Hadley from 1961 – 1990], and therefore drawing any conclusions drawn from the graph is as valid as comparing the heights of two people when one of them is standing on a box.
Allan says: You are wrong JP. The different anomaly baselines don’t matter here, since there is no net warming from ~1940 to ~1980 in the Hadcrut3 Surface Temperature (ST), and no net warming in the UAH Lower Troposphere (LT) temperature from ~1980 to present.
My statement that there has been no net global warming since 1940 is even more likely to be correct, since the ST data has been demonstrated to have a significant warming bias (~0.2C since ~1980, and probably another ~0.2C for the previous 40 years). Therefore, it is probable there has been minor global cooling since 1940, but this is well within the range of data uncertainty (as is the entire AGW hypothesis).
To demonstrate warming, your side chooses to extrapolate the warming half of the last climate cycle (since ~1976). I choose to show the entire cycle, since ~1940, and it shows NO NET GLOBAL WARMING SINCE ~1940.
The need to splice datasets is justified in this case since there are no satellite temperatures before 1979, and the ST datasets have many quality problems including poor spatial coverage and the aforementioned warming bias.
In general, I do share your concerns about data splicing.
There was, for example, no valid reason for Mann to splice together 2 datasets (dendro temperatures and ST’s ) in his famous 1998 “hockey stick” paper. Perhaps he spliced in the ST data to avoid the “Divergence Problem” (a DOWNWARD-SLOPING hockey stick blade), which would have shown global COOLING since the 1970’s. Google “Divergence Problem” for more info.
Another more recent example with Mann as co-author was Steig’s hypo (unlikely to be true, imo) about western Antarctic warming – where some of the evidence of warming was provided by erroneously splicing together ST datasets from two distant locations “Harry” and “Gill” and representing it all as “Harry”. Harry is located far inland, while Gill is on the coast. The jury is still out on whether this datasplice significantly affected the results, but it was certainly an error. See wattsupwiththat or http://www.ClimateAudit.org for updates on the “Harry met Gill” saga.
JP – if you wanted to make a valid point about the dangers of datasplicing, why didn’t you just use these two fine examples of Mann-made global warming?
Regards, Allan 🙂
Allan M R MacRae (17:33:36) :
It’s engrained into electrical engineers that looking at part of a cycle is fraught with misunderstanding. It’s often important, e.g. when looking at peak loads, but full cycle analysis provides a baseline for meaningful comparisons.
That variable cycle lengths of the PDO, sunspots, etc make the math more difficult, to be sure. Things with a fixed cycle, like the seasonal effect of CO2 measurements at Mauna Loa are easy deal with (i.e. remove) to make the long term trend clear, and what’s left is predictable, at least in warming conditions.
Sometimes you can get away with a partial cycle, e.g the average temperature during the warming phase of a PDO suggests that may be the same as the average temperature of the cooling phase. On the other hand, extrapolating the rise into the future is completely stupid. However, that’s not what the warmists are doing! They don’t see the PDO as influencing temperature, they see CO2 as the culprit and note that CO2 is increasing exponentially and therefore the logarithmic response to CO2 concentrations means a steady upward trend.
There are two problems with that:
1) The feedback parameter is way too high due to not taking PDO warming into account.
2) What looks like an exponential curve may not be – I’ve never seen a model for it like I have for the effect that CO2 has. In particular, even if the increase in CO2 over the 280 ppm baseline is exponential, then the curve fitting equation would take the form 280 + A e^year, where A is a coefficient that describes the rise. The log() of that is nowhere close to a straight line, but something that declines over time.
ODE TO STEIG (AND MANN), ON ALLEGED ANTARCTIC WARMING
NOW THE WORLDWIDE PRESS IS SWARMING,
‘ROUND ANOTHER
FINE EXAMPLE OF MANN-MADE GLOBAL WARMING!
JUST LIKE THE FAMOUS HOCKEY STICK,
THEY USED THE OLD
“SPLICE TOGETHER TWO DATASETS” TRICK.
******************
I said in my previous post:
A clarification of that last sentence – the log(CO2 concentration) curve does monotonically increase, but the slope declines. Hmm. I may be all wet, it may increase. The time to double the total CO2 starts out as being much longer than the (constant) time to double the amount over 280 ppm, but the former time gradually reduces with the latter being the theoretical limit.
Need to do some more digging or curve fitting myself. Don’t have time this month!
Jeff Alberts says:
You miss the point. The way science has advanced in our society and the way that our societies have advanced through the harnessing of science and technology is by listening to the best sound science. However, there are a few interesting cases where there is a gap between what the prevailing scientific view in the field is (and what the scientific societies say and so forth) and between what a small but vocal minority of scientists and non-scientists say. The gap is so large that you have, for example, scientists in support of a theory that many of this other group believe to be “an unsubstantiated hypothesis”.
In such a case, I think it is quite instructive to look at these interesting cases and compare them and see what we might learn from them. In particular, if one hears a certain argument against AGW, one can ask, “Does this sound similar to arguments that I hear against evolution, a theory that I know to be extremely well-founded scientifically?”
Look, the fact is that there is absolutely nothing surprising that there are a number of people around making the claims about AGW that you skeptics make. The case of evolution shows us that it is entirely to be expected in the case where a well-grounded scientific theory goes against strong religious, philosophical, or political beliefs or economic interests, independent of the merit of that theory. In fact, what would be surprising would be if this did not happen…And, in fact, what is increasingly surprising is the number of organizations (such as fossil fuel companies, power companies, etc) who now accept the basic science of AGW even though it is not in their economic interests to do so…or certainly not in their interests if it is not in fact a well-grounded scientific theory (and they certainly resisted for a while).
@ur momisugly bluegrue (03:20:18) :
“you can be reducing 10 [percent] to 20 percent of the air conditioning load.” — Ahhhh CHU!
Is that for peak AC load in an uninsulated cardboard box in the dog days of Summer?
“…the answer to energy efficiency is not always as black and white as one might think. Roof systems that have good performance levels can be specified to provide competitive energy-efficient solutions. With the initial cost per R-value for insulation averaging about 2 cents per square foot, the cost to offset the benefit provided by a white roof system is slight.”
http://www.professionalroofing.net/article.aspx?id=183
I.e., better insulation is the answer, with roof color making a difference only in summer and only very slightly on well insulated homes, at least in the Chigago area.
And then there’s the expense of re-tiling a roof, probably not amortized vs energy consumption over the lifetime of the roof, even here in CentFla (the last re-tiling was done with white, which from the ubiquitous molds are now nearly black in many places).
So, if you’re building a NEW home in a warm climate, white may be the way to go. But in the North, I wouldn’t rush into it, especially until after the cooling that’s expected blows over, possibly not for 10 to 20 years.
I pity the pilots who have to fly over the all-white city. Think “snow-blind in summer.”
Joel Shore:
Well, since you ask, the answer is an unequivocal “No.” Unless, of course, you’re referring to the private conversation that goes on between your ears. And I notice that you’re once again trying to promote AGW from a failed hypothesis to a theory. Stop it. AGW is not a theory.
Forget the tortured analogies, and ask yourself: where is the real world evidence that increases in CO2 will lead to runaway global warming? Last time I checked, CO2 was rising and global temperatures were falling: click
Don’t give us any computer model fantasies, give us empirical evidence that carbon dioxide causes global warming.
Mr Green Jeans:
You taken one thing said by one person (James Hansen) and blatantly misrepresent what he actually said. (I don’t defend what Hansen said…I don’t think it was particularly constructive to the discussion but what he said bears little relation to how you have represented it.)
And, if you want to talk about witchhunts, you need look no further than Congressionman Barton’s meddling into the whole “hockey stick” controversy in such a heavy-handed way that even his fellow Republican, House Science Committee Chairman Sherwood Boehlert denounced it by saying ( http://sciencepolicy.colorado.edu/prometheus/archives/climate_change/000497letter_from_boehlert.html ):
As I recall, the scientific societies like the NAS as AAAS also weighed in on this. However, for the most part, the “skeptics” seemed to be cheering Barton on.
Yup…And, today it is colder in Rochester than it was yesterday even though we are heading toward spring. Man, who promoted that silly “seasonal cycle” garbage from to a theory from an “unsubstantiated hypothesis”!?!
And, let’s see, what do those climate models that you deride predict will happen over 8 year periods under steadily-rising CO2 levels…Hmmm, let’s see…It looks like they expect there is a significant chance that temperatures will fall over any given period (and, of course, there is a much larger probability that they will fall over SOME periods of this length): http://www.realclimate.org/index.php/archives/2008/05/what-the-ipcc-models-really-say/langswitch_lang/in
@ur momisugly Graeme Rodaughan (23:56:48)
“Is it possible to go for a “AGW is not science, is religeon, and should not be taught in classrooms” and bring it too a court of law where it would actually have to prove it was in fact science?”
Is the photo in this article admissible as evidence?
A commenter on Motyl’s website tipped them off to this
“Let’s develop better micro-organisms that break down the cellulose…I hope 30 years from now a that substantial fracton of transportation fuels will be raised from crops” — Chu
Hope? …30 years? I thought drilling for oil, which we don’t have to “hope” for because it is there, was a pipe dream because it would allegedly take 10 years to get to market?
Also, here’s something else to Chu on…
http://www.caivp.org/category/tags/steven-chu
So Joel
Looks like models “predict” then according to your last post. And here I was thinking that they were only “scenarios”.
Also, the models apparently predict cooling……or warming. Does it take a model to do this? or can anyone throw out a guess like this?
“The way science has advanced in our society…is by listening to the best sound science.”
This makes no sense. How is science advanced by listening only to “best sound science”? Who gets to decide what is “best” and “sound”? Why should that be blindly accepted? I think science would have advanced very little if everyone just stopped questioning and working when some body of persons declared an idea the “best” out there.
I got a kick that this story was called an example of Mannian enHansenment.
Joel Shore says:
The way science has advanced in our society and the way that our societies have advanced through the harnessing of science and technology is by listening to the best sound science.
However, there are a few interesting cases where there is a gap between what the prevailing scientific view in the field is (and what the scientific societies say and so forth) and between what a small but vocal minority of scientists and non-scientists say. The gap is so large that you have, for example, scientists in support of a theory that many of this other group believe to be “an unsubstantiated hypothesis”.
Ah, yes, Joel, the “there is a consensus” fantasy. That one never gets old, particularly as you people find 1001 different ways of putting it. First of all, the “consensus” claim is more about politics than science. It is a way of “shutting up” your oponents, and shutting down debate. That is not how science works.
Secondly, there is not, nor was there ever any “consensus”, other than in the fevered minds of the AGW ideologues.
For example, in the 2007 IPCC report, only 52 scientists authored the much-hyped IPCC 2007 Summary for Policymakers, and only four UN scientists in the IPCC peer-review process explicitly endorsed the key chapter blaming mankind for warming the past 50 years. Big consensus.
Meanwhile, the latest 231-page U.S. Senate Minority Report report — updated from 2007’s groundbreaking report features the skeptical voices of over 650 prominent international scientists, including many current and former UN IPCC scientists, who have now turned against the UN IPCC. Indeed, the number of skeptical scientists, which include those who were previously hesitant to declare their skepticism, plus those who now have serious doubts and/or concerns about the AGW hypothesis is growing continually. This must indeed be alarming to AGW proponents, as evidenced by the increased shrillness of their alarmist cries, and calls for “immediate action”.
Joel, your comparison of the science skeptical of AGW with arguments against evolution is nothing but a thinly-veiled ad hominem. Further, you calling AGW a “well-grounded scientific theory” is simply laughable. You then come up with another beaut of an ad hominem, implying that we skeptics/climate realists are simply motivated by “strong religious, philosophical, or political beliefs or economic interests, independent of the merit of that theory”. This is nothing but a bald-faced lie on your part, but typical of an AGW True Believer.
This graph suggests there has been no net global warming since 1940, despite an ~800% increase in humanmade CO2 emissions.
I used Hadcrut3 ST from 1940 (despite of its warming bias), and UAH LT thereafter.
This is the result when one plots the FULL PDO cycle, instead of attempting to extrapolate the WARMING HALF-CYCLE, as many warmists do.
Ah the penny drops! At first glance it seems that the only way the graph supports the startling claim of no net warming since 1940 is to compare Hadley 1940 with UAH April 2008, but it now dawns on me that the claim is Hadley – no net warming from 1940-1980, then UAT no net warming 1980 to [April] 2008 thus bingo! no net warming since 1940…
So, ignoring for a moment that the two series measure different physical quantities, it does look like a small net cooling from 1940 to 2008. But is a conclusion based on just three data points robust? Why the choice of 1980 as a crossover year when the UAH data starts in 1979? Why the comparison with the year 1980 with just one month – April 2008?
Was 1940 an unusually warm year perchance? … click Was April 2008 anomalously cool? … click Hmmm…
In fact the UAH data shows an end-to-end rise of 0.382C from its first data point in December 1978 [-0.199C] to its last in December 2008 [0.183C] which matches the calculated linear trend. The Hadley annual average rose by 0.061C from 1940 to 1980, so combining the two dataets actually gvies a net rise of 0.44C from 1940 to 2008.
Can the result be radically amended by picking a different start date? Well By choosing 1950 as the start of the PDO cycle we get
Hadley 1950: -0.293
Hadley 1979: +0.046
A net change of 0.34C, add that to the UAH change 1979-2008 and using the same ‘method’ I can claim a net change from 1950 to 2008 of 0.72C, or 1.2C/century! Here’s the UAH and HAdley data together, with the UAH offset to coincide at Jan 1979: http://www.woodfortrees.org/plot/uah/from:1979/offset:0.1/plot/hadcrut3vgl/from:1940/plot/hadcrut3vgl/from:1940/trend
Neil Crafter says:
The point simply is that the climate variations over short enough time scales are dominated by processes such as ENSO that are very sensitive to initial conditions but over longer time scales. What it means is that one simply cannot make conclusions regarding whether or not CO2 is a dominant forcing by looking over periods that are too short to determine a climate trend that is resilient to these shorter-term issues.
I am sorry that nature behaves in a way that you don’t find appealing but, hey, what can we do?
AKD says:
Well, that probably wasn’t one of my best sentences. You edited out the more sensible part of it though, which is that society advances by considering the best sound science, which is why we have organizations such as the National Academy of Sciences set up to provide the public and policymakers with an overview of the current scientific thinking.
There is still something to the part of my sentence that you left in. And that is that the peer-review system has indeed been found useful for increasing the signal-to-noise ratio in science well above what it is like outside of the scientific journals. So, I would say that scientists are the one who should be evaluating if their colleagues’ contributions are good and sound enough to merit publication.
I suspect broken links and such like maybe down to the new IE8, which has known issues.
Bruce, is it really significant that fewer scientists prepared the summary of a report than worked on the report itself? And what does and only four UN scientists in the IPCC peer-review process explicitly endorsed the key chapter blaming mankind for warming the past 50 years , [which is also stated on Inhofe’s website] actually mean? If you look at the document behind this claim from climate data analyst John Mclean it is clear he is referring to reviewers of the Second Order Draft only, thus ignoring all comments to the First and Zero order drafts, which were far higher in number. Secondly the main points of review comments are to suggest changes and correct errors, I am not aware that lack of ‘explicit endorsement’ in response to a request for comments tells you anything about the document’s support, in fact probably the opposite – if I put out a document for review and get few comments back it usually indicates reviewers are happy to sign off on the content. The list of the 619 contributing authors to the IPCC working group on the Physical Science can be found here. Is your point that because each and every one did not make a comment ‘explicitly endorsing’ the relevant chapter then we should believe they do not support its conclusions? Can you name any other multi-authored document where this is the case?
Inhofe’s list of ‘over 650 prominent international scientists’ has some elements of pure comedy, and maybe 30-40 actual dissenting scientsts. I leave others to judge their prominence. Read the entry on Alan Titchmarsh for example [note they misspell his surname] and you will see he says this I’m sure we are contributing to global warming, and we must do all we can to reduce that . Read the website of this TV gardening show presenter and popular novelist and marvel at how he manages to find the time also to be a ‘prominent international scientist’ and how he has managed to keep it quiet 😉
Off-topic, [and apparently a post on this is in preparation, however as this is a response to a point, please bear with me] but the concensus is robust, as demonstrated by this survey in EOS that found 97% of climate scientists agree that global warmng is real, and human activity is a significant causal factor. Another smaller survey by Roger Pielke had majority explicity endorsing the IPCC with equally-balanced minorities opining that the IPCC were over or understating the severity of the problem.
Then there are the joint statements by the Science Academies of major countries, the literature review by Naomi Oreskes …
@ur momisugly HasItBeen4YearsYet? (10:59:33)
You are perfectly correct that white roofs are just one aspect, insulation is important, too, and of course their is no one-size-fits-all solution for all climates. Prior to air-conditioning your ancestors developed different housing suited for the local climate in different parts of the USA. That’s experience you can build on for new houses.
I find it very curious, that Motl and many here on this blog entry attribute to Chu, that he advocates rebuilding all roofs, when in the interview Chu answers explicitly to a question about building new, energy-efficient buildings. Or do you have other sources than that Taipei Times interview?
P.S.: HasItBeen4YearsYet?, I’ve had a look at the site
http://www.geocraft.com/WVFossils/greenhouse_data.html
you pointed me to on the “WaPo pundits …” entry. Please have a look at my reply, the data the site presents is flawed, to put it mildly. Details over there.
“The point simply is that the climate variations over short enough time scales are dominated by processes such as ENSO that are very sensitive to initial conditions but over longer time scales. What it means is that one simply cannot make conclusions regarding whether or not CO2 is a dominant forcing by looking over periods that are too short to determine a climate trend that is resilient to these shorter-term issues.”
In other words, there is no way to know for sure, however give us all your money anyway, or the polar bears and the coral get it….