
A few days ago I wrote in State of the Sun for year end 2008: all’s quiet on the solar front – too quiet that “No new cycle 24 predictions have been issued by any solar group (that I am aware of ) in the last couple of months.” Coincidentally and shortly after that, NASA’s David Hathaway updated his solar prediction page here. He’s made a significant backtrack over previous predictions, and now for the first time he is claiming cycle 24 will be less than cycle 23, not greater.
Kudos to our WUWT resident solar physicist Leif Svalgaard for his foresight. He has been saying for many months that cycle 24 would be significantly reduced, and not greater than 23.
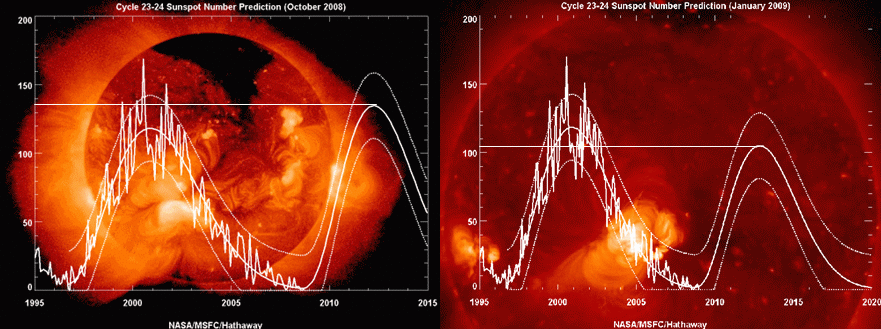
Here is Hathaway’s most familiar graphic, which has an active sun in the background. Perhaps it is time to update that background to something more reflective of the times…..oh wait, read on.
Click for a larger image
Here in this graphic, from Klimadebat.dk we can see how much has changed since Hathaway’s last prediction update in October 2008:
Click for a larger image
Note that Hathaway did indeed change background graphics from October to January. Its just not quite the smooth and nearly featureless ball we see today.
Courtesy of Mike Smith, here is the March 2006 prediction graphic:

Click for larger image
Hathaway’s predicted Cycle 24 maximun in March 2006: 145
Hathaway’s predicted Cycle 24 maximun in October 2008: 137
Hathaway’s predicted Cycle 24 maximun in January 2009: 104
I’d say that represents a sea change in thinking, but the question now is: How low will he go?
I was looking for a substantial quote from Hathaway in his prediction page, but it appears he is being quite conservative in his language, focusing mostly on methodology, not the prediction itself. I don’t blame him, he’s in a tough spot right now.
Meanwhile we’ve had an entertaining episode with the most recent Cycle 24 transient sunspot/sunspeck that appeared briefly yesterday then disappeared almost as fast as it appeared. See the area on the lower right of the sun:

In response to my query asking if he concurred with my assessment of it being an SC24 speck, (he did) Leif wrote to me: “Seems that it has received even a region number 11010. Somewhat ridiculous.”
Then about 12 hours later: “And SWPC has withdrawn the number. No numbered region after all.”
It will be interesting to see which organization counts this event, or not, in the month end tally. Up until this point, we had 25 consecutive spotless days. Now we have more, or not.
h/t to Frank Lansner for the Klimatdebat.dk graphic link and a bunch of other commenters who made note of the Hathaway page
Dr. Svalgaard…
The value of Rmax=75 would appear to agree with two of the four choices in Hathaway’s recent presentation (“Solar Activity Cycles Past and Future”). Are you optimistic that Cycle 24 data will confirm any one of those four?
That was a very informative post on TSI and solar activity. If sunspots were over counted for 3-4 recent cycles, would you also apply that to the recent minimum? I wonder if the December sunspot would have been observable, for example, during the Maunder minimum (I bet the Jan 6 “spot” would not have). In other words, our current minimum would have even less spots.
It appears that radio flux can vary by a factor of 3 from solar min to max. I don’t think that wavelength is included in TSI. Are there other forms of radiation that do vary that can contribute to heating (or cooling)? Your post seems to have covered most possibilities. What do you think of Dr. de Jager’s 2006 paper that discusses a 100-fold variation in amplitude in the UV spectrum? I assume that the visible output varies very little – plants are green for good reason.
Regards,
Bob
Two formulas devised to track periodicity and the amplitude envelope for the sunspot cycles:
http://www.vukcevic.co.uk/combined.gif
suggests range 79-85 for late 2013. As an overall amplitude assessment, the periodicity graph (blue line) gives a reasonable approximation since 1920
and the amplitude envelope (red line) from 1890 (except for SC 20 in both cases).
See also:
http://www.vukcevic.co.uk/combined1650.gif
http://www.vukcevic.co.uk/GrandMinima.gif
more details:
http://www.vukcevic.co.uk/ links for solar current and subcycle
Clark (11:41:55) :
There has to be more to it than that, because if I remember the latest blink animation correctly, Hathaway has made 4 predictions.
You missed my last sentence:
“As a final touch he averages the number with a prediction by Thompson based on the number of disturbed days at minimum.”
And THAT number does change with time.
Wyatt A (12:14:22) :
James Hastings-Trew (11:19:08) : Was 2008 one of the hottest 10 years of the last decade?
LOL!
Good one!
Did Tamino really state that?
Dunno but with his propensity for getting it wrong, probably said it would fall just outside the top 10 ;-P
DaveE
I guess that’s me banned LOL
DaveE
Hathaway seems to be doing his best with the data available and the current undertanding of underlying phenomena. That includes revising his models and making new predictions as new data becomes available. In fact, he deserves credit for doing exactly that – and it’s the opposite of the AGW crowd’s behavior.
He may be wrong, even wildly wrong, without being dishonest. I haven’t seen anything in his behavior that would justify lumping him in with the AGW hoaxters.
(BTW, I’m willing to accept that there are scientists out there who do legitimately believe that the data can be interpreted as showing AGW. No one should lose the presumption of legitimacy until they a. resort ad hominum arguments, b. manipulate and distort data to obtain a predetermined outcome, and c. refuse to modify their theory in light of new information or understanding.)
A complete animated archive of all recovered Hathaway predictions in the current form factor are available here:
http://commons.wikimedia.org/wiki/File:SSN_Predict_NASA.gif
Individual monthly GIF files can be extracted from the animated GIF. Click on the first graphic to expand the animation to full page size.
Mike
Does anyone know of a website that reports sunspot numbers AND distinguishes between the spots of successive cycles? When was the last cycle 23 spot?
Alex, the problem is that making a prediction is a claim of expertise. If Hathaway said “I just don’t know” then I, for one, would not blame him. But putting out predictions that are constantly changing and usually wrong is worse than having no prediction at all.
This should be a salutary lessson to those who have high confidence in global climate prediction for 50-100 years hence, enough confidence to enact trillions of dollars in economic penalties on people right now.
Danger ahead as the Sun goes quiet
http://www.newscientist.com/article/mg20126903.700-danger-ahead-as-the-sun-goes-quiet.html
Dr. Hathaway, I do have a sympathy for your predicament.
(July 2007: Dr.H. It is somewhat disturbing the Mr. Vukcevic stops his plot at about 1810 .
Well, it has been on:
http://xxx.lanl.gov/ftp/astro-ph/papers/0401/0401107.pdf
since Jan 2004.)
Leif, could you tell me where this is wrong? I know you think Landscheidt is off on one. Its from Percy Seymour an astronomer in Britain. He has a theory of how planets alter the sun here http://www.tmgnow.com/repository/solar/percyseymour1.html see from fig 4 to fig 7 you don’t need to read the whole thing. Please stick to the explanation given and not veer from the point as you usually do its real short.
Anyone else interested in this aspect this is a clear piece. Ed.
Perhaps this is due to low solar activity, or maybe windmills aren’t that good of an idea:
http://www.thesun.co.uk/sol/homepage/news/ufos/article2108149.ece
Seems that a windmill was struck by a UFO, knocking one blade off and mangling another one. With no trace of the missing blade.
So, does the lack of sunspots confuse their navigation systems, or are aliens just lousy drivers? (it couldn’t be due to any bias at the reporting source…)
crosspatch (09:26:56) :
The ramp up to maximum is generally faster than the tail off to minimum.
Or more precisely the ramp up an tail down split pretty much into the golden section
1:1.618 as noted by Theodor Landscheidt.
The Australian Ionospheric Prediction Service is still forecasting max SSN 134.7:
http://www.ips.gov.au/Solar/1/6
(The prediction is based on the average of the last 8 solar cycles
(Cycles 15 to 23). IPS will adjust this average cycle as the new cycle unfolds. To do this IPS has developed software for manipulating this predicted cycle. The difficulty is ensuring that adjustments are not made for short term variation, only for longer term cycle variation.)
But the end of the blue line and the beginning of the red line somehow do not want to join up:
http://www.ips.gov.au/Solar/1/3
Bit like waiting in the church when the bride has changed her mind.
Who know what goes through the mind of a prospective bride let alone the forces of the universe.
Paul Shanahan (11:04:25) :
The interesting question is: what does the current sunspot look like if adjusted for historical detection sensitivity. Cut out the spots that would not have been seen in the past and you’ll have even fewer in the current cycle.
I don’t have any problem with Hathaway’s predictions, as Leif said he is making them in a transparent fashion and changing them as the data warrants.
I think we get so used to the way many people put way too much confidence in model predictions that we may tend to jump on someone who hasn’t actually done anything of the sort.
For people who think that this is a denialist sight you may want to see Leif’s post above headed 11:07:03. I have no idea what the future holds for solar activity or how big an effect it may have, but they aren’t just grabbing any contrary opinion for its own sake.
Retired Engineer,
Apparently Aliens are subject to the dangers of ‘buzz’ driving.
Retired Engineer (13:21:47) :
“Perhaps this is due to low solar activity, or maybe windmills aren’t that good of an idea:
http://www.thesun.co.uk/sol/homepage/news/ufos/article2108149.ece
Seems that a windmill was struck by a UFO, knocking one blade off and mangling another one. With no trace of the missing blade.
So, does the lack of sunspots confuse their navigation systems, or are aliens just lousy drivers? (it couldn’t be due to any bias at the reporting source…)”
—————————
Actually it reveals the true reason that governments the world over have been pushing AGW and Windmills ….. defense against Alien invasion. Very clever of them.
I use two formulas devised to track periodicity and the amplitude envelope for the sunspot cycles:
http://www.vukcevic.co.uk/combined.gif
they suggest range 79-85 for late 2013. As an overall amplitude assessment, the periodicity graph (blue line) gives a reasonable approximation since 1920
and the amplitude envelope (red line) from 1890 (except for SC 20 in both cases).
See also:
http://www.vukcevic.co.uk/combined1650.gif
http://www.vukcevic.co.uk/GrandMinima.gif
more details:
http://www.vukcevic.co.uk/ links for solar current and subcycle
Richard deSousa (10:07:25) :
Dr. Hathaway will be more respected if he simply says he doesn’t know what the future portends… there’s nothing wrong with admitting that… to throw up numbers and constantly changing his predictions is not science.
Um, I think it is science. Make a hypothesis, test it, find it wrong, make a new hypothesis. That his prediction did not work is as valuable to a real scientist as when it does work…
Put me in the group that lauds him for putting it out there for folks to see and for being willing to change his mind when the data change. Very refreshing compared to the “cooling is the new warming” behaviour of others…
Edward Morgan (13:18:44) :
could you tell me where this is wrong?
The fatal flaw is this: “Our claim is that braiding considerably reduces the effects of buoyancy”. Let me explain where the buoyancy comes from. A plasma parcel in the interior of the Sun is in hydrostatic equilibrium if the downward weight of the material in the parcel matches the upward pressure of the underlying parcels. Now put a strong magnetic field inside the parcel. A magnetic field also exerts a pressure and adds to the pressure inside the parcel, which means that the parcel can be in pressure balance with less material, hence less weight, hence it will rise [like a balloon filled with gas of a lesser density that air]. “Braiding” [although not precisely specified in the article] will increase the magnetic field inside the parcel. The field strength is the number of field lines per unit area. Any twisting, braiding, knotting, etc of the field will increase the number of field lines threading an area, hence increase the field strength, hence increase the magnetic pressure, hence decrease the amount of material needed for pressure balance, hence decrease the density, hence increase the buoyancy [“the balloon rises”].
Leif Svalgaard (10:15:42) :
But the ‘above graph’ is an obsolete reconstruction of solar irradiance that is not consider valid today. For a more probable reconstruction that reflects what we have learned the past decade see the red curve on: http://www.leif.org/research/TSI-LEIF.png
Interesting graph. What made for the difference? Method change, better data, improved approach? Does TSI include UV and other non-visible?
Edward Morgan (13:18:44) :
http://www.tmgnow.com/repository/solar/percyseymour1.html
Very interesting hypothesis, however, I think that the solar activity most likely would be a continuous process of random or uniform polarisation if it was not for the external factors. Gravitation forces alone could not regulate the Hale’s polarisation cycle. Thus, another factor (with a magnetic polarity property) must be in the play, which has to be related to the planetary orbital periods. That could only be the existence of the planetary magnetospheres, which not only control (or override) solar polarity but trough negative feedback suppress the solar activity, result: solar minima during period of the strongest feedback. The crucial question is how is this feedback achieved; I believe it could be through the heliospheric current’s negative feedback due to disturbances (or interactions) within asymmetric central plane of the helioshheric current sheet, by the magnetospheres orbital paths.
For more see: http://www.vukcevic.co.uk solar current link
Leif,
We have had this conversation before, but The PMOD Composite data (currently from the Virgo satellite) to the end of November has shown a decline in Solar Irradiance which is (slightly) inconsistent with your reconstruction in the sense that the minimum TSI has fallen below previous minimums (not much but shows it can happen anyway).
http://www.acrim.com/RESULTS/Earth%20Observatory/earth_obs_fig27.pdf
I know the SORCE satellite is not showing a reduction in TSI which is consistent with the decline from Virgo.
Leif Svalgaard (11:07:03) :
http://www.cdejager.com/wp-content/uploads/2008/10/jagerversteegh-20063.pdf
Thanks for the reference. Interesting paper (and does a nice job of casting reasonable doubts on ‘the planets did it’).
I did note that the author did not say ‘total nonsense’ but rather took a more reasonable approach of saying it can’t explain the dynamo changes but maybe they can cook up some other mechanism. A prudent position. (i.e. they have a correlation that doesn’t fit with the known mechanisms. Back to the drawing boards planetary guys… )
The conclusion is therefore that accelerations caused by the planets simply completely disappear in the accelerations actually observed inside the solar body. They are too small by a very large factor to be able to cause the observed accelerations. Therefore they cannot significantly influence the solar dynamo unless a completely different hypothesis is forwarded that would, first, invalidate the present dynamo theory, and, secondly, at the same time explain solar activity, its polarity reversals and sunspots by planetary gravitational attractions. A strong point of criticism to the planetary hypothesis is that no physical mechanism has yet been forwarded for explaining polarity reversal by planetary motions.
Doesn’t close it down completely, but does raise the bar rather a long ways.