This is a combination of two posts elsewhere that illustrate just how much hype and how little substance the MSM and blogs like Grist, Climate Progress. and Capital Weather Gang have been pushing trying to make a run of the mill summer heat wave seem like an event of unprecedented global warming proportions. It isn’t, and not even close compared to weather records history of the past.
Spread these far and wide, anywhere the hype manifests itself.
First from the Real-Science blog, an analysis of the 3000 new high temperature records set that gets touted by the shrill alarmists as if this never happened before and is a direct consequence of CO2 in the atmosphere. It isn’t according to the data:
==============================================================
There have been 372,989 correctly recorded daily high temperature records in the US since 1895. 84% of them were set when CO2 was below 350ppm.

Compare the number of record highs in the 1930s to the past decade. You can see that the 1930s were consistently much hotter.


=============================================================
Bear in mind, that since the 1930’s, when the majority of America (and weather stations) were rural, we now have many more large cities and many weather stations compromised (~90% of USHCN stations in Category 3,4,5 from Fall et al) by affected by urbanization encroachment.

Next up, a much broader analysis from Joe D’Aleo of WeatherBell via ICECAP:
=============================================================
Records and Extremes – Updated
By Joseph D’Aleo, CCM, AMS Fellow
Following the super La Nina of 2010/11, we had a period of extremes – snow and cold to start, then floods and drought, tornadoes and heat and a landfalling hurricane.
As the La Nina faded but the eastern and northern Pacific water remained cold, a warm and dry winter followed in 2011/12 much as the warm winter of 1918/19 followed the super La Nina of 1917/18 which was the only colder, snowier La Nina this century.
The warmth peaked in March. With the exception of the Pacific Northwest, most of the nation was well above normal with many daily record highs. Warmest March in the record books for the lower 48.

The warmth has continued but gradually subsided since then.
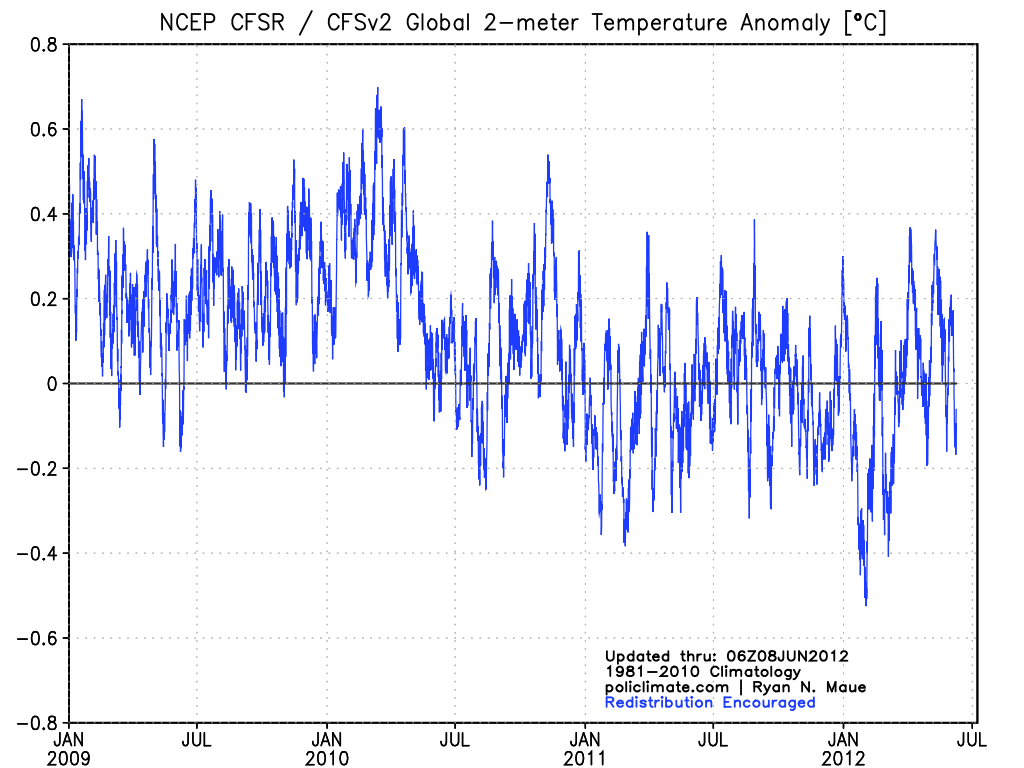
Despite the high number of record daily highs, this is a US centric warm event. The NCEP CFSv2 global anomalies from the winter through early June have been much of the time below the 1981-2010 average. The deep Eurasian cold wave shows in late January.

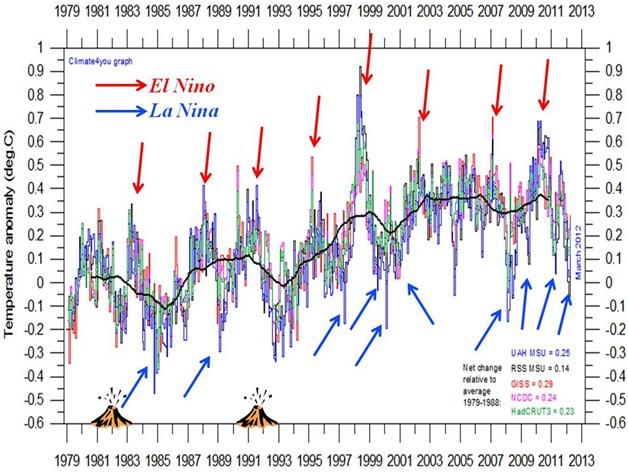
Looking back over the last century, you can explain global temperatures by ENSO and volcanism and the ocean multidecadal cycles that favor a particular ENSO state. Here is the plot since 1979 of all data sets with ENSO and volcanism indicated.

El Ninos bring a short term warming, La Ninas a dip in global temperatures. The warm mode of the Pacific from 1977 to 1998, led to a net warming. Major volcanoes produce a cooling as we saw in the early 1980s and early 1990s, lack of volcanism (like we have seen since the middle 1990s) means more solar radiation at the surface and enhanced warming.

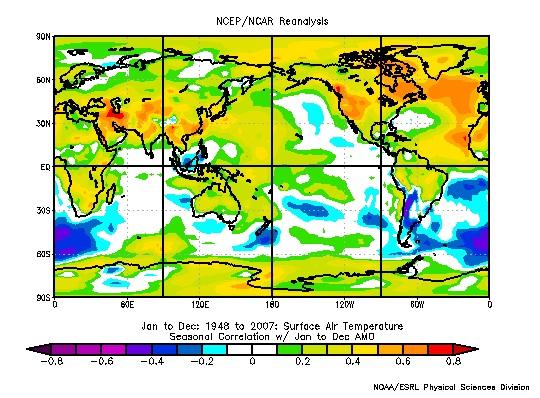
In 1995, the Atlantic went into its warm mode, which means a warmer annual temperature in the Northern Hemisphere.

May for the US was warm again making the last year in the US allegedly the warmest in the record, but as John Christy of UAH noted from the satellite perspective, it was notable only in the lower 48 (see).
Again in the Pacific Northwest, it actually was colder than the 30 year mean for the fifth straight year.

•Spring temperatures across the Northwest Region have been trending downward at a rate of 0.59 degrees F per decade during the 30 years since 1983.
•Spring temperatures across the Northwest Region have been trending downward at a rate of 4.10 degrees F per decade during the 10 years since 2003.
A Cold west usually translates to warmth further east as we saw in the 2010 and 2011 summers.
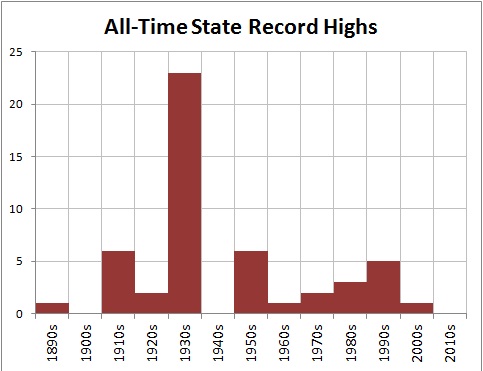
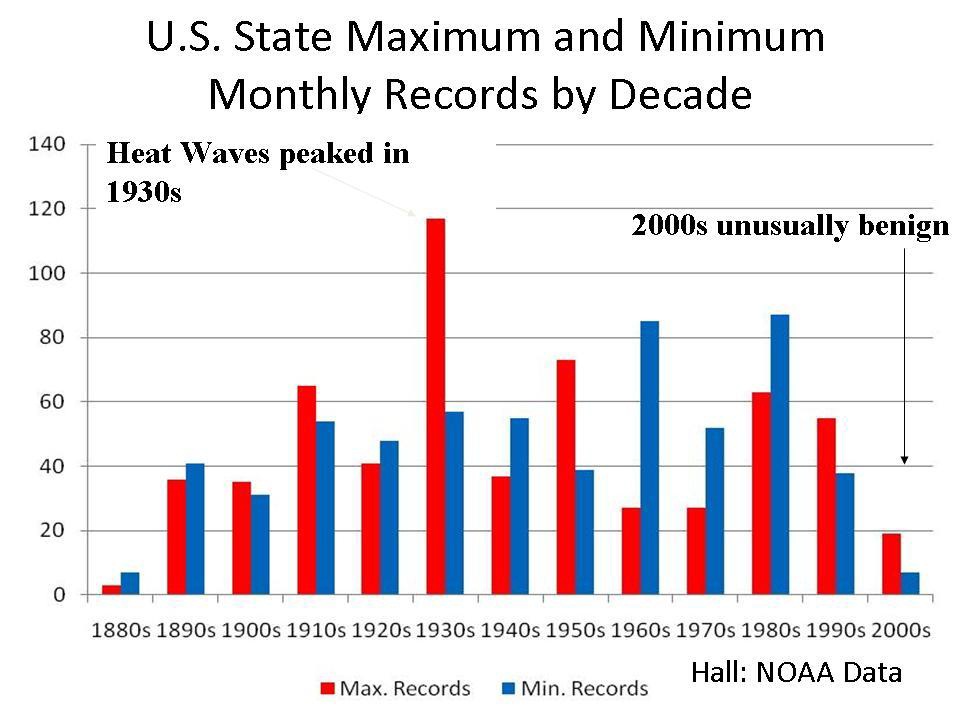
As hot as it has been the past two summers, the heat is not cracking all-time levels. Here is the latest decadal plot of all-time records for the 50 states. When multiple years are tied, the latest year/decade is used.

The 1930s stands out as the hottest decade, the 1910s and 1950s were second, 1990s third and 1980s fourth. This decade doesn’t rank although it is early.
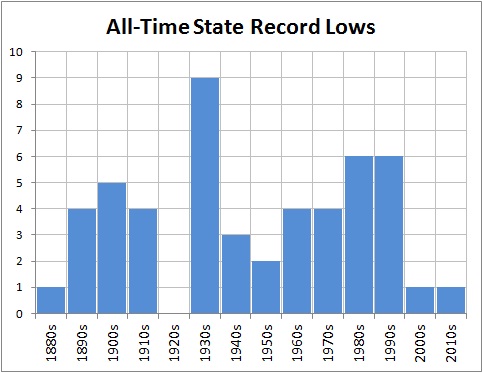
All time cold records look like this.

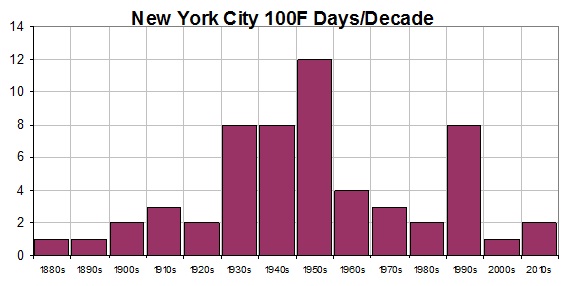
New York City reached 100F last summer, but that was common from the 1930s to 1950s.

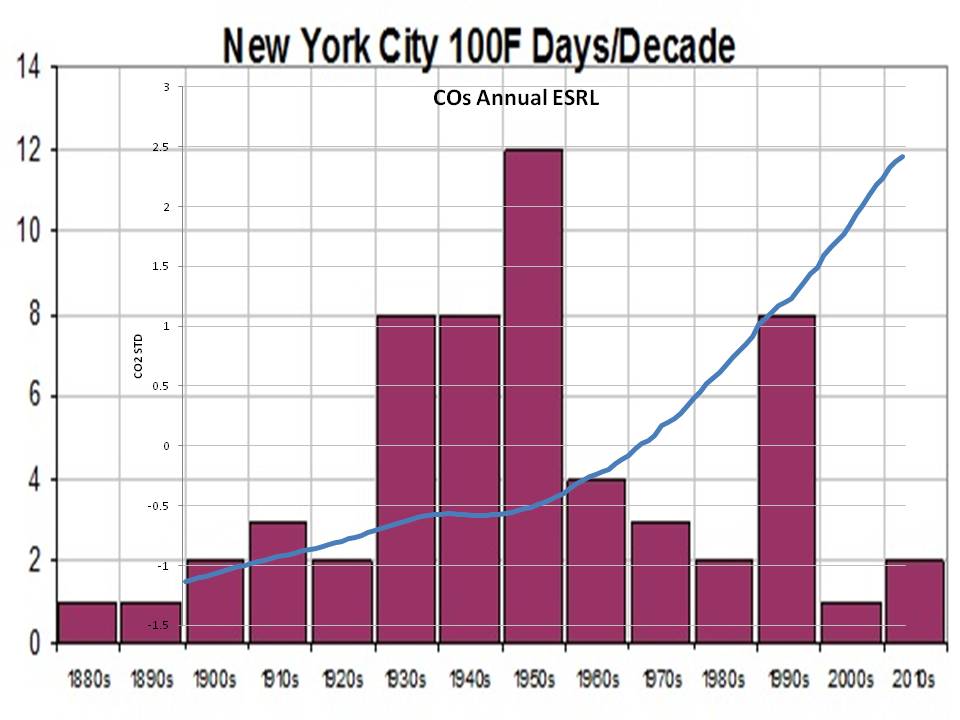
Oh by the way see how the 100 degree days compares with CO2.

Here is Des Moines which has seen fewer and fewer 100F days in recent decades.

As Steve Goddard reports “During the 1930s, 100 degree days were very common in Des Moines. They very rarely happen any more. It has been nine years since Des Moines hit 100F. By contrast, 1934 had thirty-one days over 100 – including five days over 110 and three days over 112.”
The state monthly records through the end of the 2009.. This depicts the 12 monthly records for the 50 states (600 data points). There were likely March heat records set in some states and perhaps some other months so the 2010s will show and take away from some prior years.

See Bruce Hall’s 2010 guest post on Roger Pielke Sr.’s Climate Science here.
ICECAP NOTE: ICECAP was one of the earliest ‘realist’ climate blogs that provided insight into natural factors and challenged the orthodoxy. Your donations helped us maintain the site and provide some support for the time invested in keeping it updated. One or more posts have been added a day for going on 5 years now now totaling 6,082 entries. 305,205 have enrolled as members with a total of 32,446,550 page hits. All the posts are archived. We maintain them in the archives and have a good search tool. I maintain the site as best I can – maintaining a secure site with high traffic is expensive. You can help with even small donations – see the DONATE button left or email me at frostdoc@aol.com for an address to mail a check if you prefer not using PAYPAL. Rest assure, we have never had an issue with Paypal although they get a piece of any transaction. I have had at times had to subsidize the site from month to month. I don’t like having to ask people for donations but our side despite all the claims to the contrary is not subsidized/ endowed with money and grants like the alarmist blogs like RealClimaate and Climate Progress. You will never see them ask for donations. They get all they need from their liberal foundations and eco groups.
You can also help by buying books in the Amazon store and/or enrolling as a Premium member of Weatherbell.com, where I am co-chief meteorologist with Joe Bastardi. recently Dr. Ryan Maue from FSU has joined our staff and is helping us provide model based value-added output. He maintains and has published on the ACE index. We have a weather radio show on Sunday nights 8pm to 9:30pm EDT called Wise Guys of Weather Radio. On the Weatherbell site we have the premium blogs and specialized forecasts for energy, agriculture, marine, snow, insurance and other applications on the Commercial site. Joe B has also posted on Icecap. Both Icecap and Weatherbell are 7 day a week jobs. I have also PRO BONO helped produce documents for comments to the EPA that enabled lawyers to file a science based AMICUS brief that went to the DC courts to try and stop EPA deadly overregulation. Thank you for you support over the years. Joe D’Aleo and Art Horn
Rats, I’ve already done my articles for today on the site I post to. Will bring attention to this one as I can…
In the meantime!
Per Steve from Rockwood:
@Paul K2. You say that a loss of Arctic ice leads to a slow down in the Jet Stream which in turn allows weather patterns (like the current heat wave) to stick around longer.
The strongest / longest heat wave in recent memory was in the 1930s. Can you comment on Arctic ice loss then? I would like to believe climate scientists know what they are doing but my concern with your logic is they focus on short term effects and extrapolate them into long term ones.
This is probably a spurious worry. It gets to be a lot harder to have a record temperature as time goes on since each record has to be hotter/colder than the last record. One might suppose that if the threshold to record-dom has risen over time yet plenty of new records are being established, it might be an unusual cycle.
to make this easier to understand, a temperature need only beat four other temperatures to be a record in year 5 of collecting readings. When you get to year 100, you need to beat all of the previous temperatures.
Show me what I’ve missed.
Question: do the peaks in the 1930s have anything to do with recording history? I.E. if we’re talking about “records” rather than just “days over 100F” then you’d expect there to be a lot more records set in the early days of record keeping than you’d be getting 50 or 100 years later.
– MJM
The record high – vs- time chart does not mean as much as it seems. If temperature on any given day at each place were a random number between 0 and 110, and you tracked new highs (or lows) vs time, you would expect to see an exponential decay from t0 that approaches zero new highs per year after a span determined by the PDF of the random number generator.
That the count is high, but stops declining does not support the argument that nothing odd is afoot. I don’t think it is odd, I’m just picking on that chart.
Yeah, glad to see some other folks called it too. Math literacy exists at WUWT. New records of this kind decline with time.
Thought I was first due to moderation delay.
Thought this might be relevant to the discussion;
http://drtimball.com/2012/cant-see-the-climate-forest-for-the-trees/
Did someone mention Heatwave?
Agree with the other comments…..in the first year of record every single day sets a record for that day….this obviously falls off over time if there is stationarity. wouldn’t one expect more records set in the 30’s than currently…..unless stationarity is violated?
Would you please post the corresponding plot of USCHN daily minimums each year?
This second sentence does not follow from the first. “Compare the number of record highs in the 1930s to the past decade. You can see that the 1930s were consistently much hotter.” It should say the 1930s consistently set more temperature records. They may have been hotter, but that does not follow from the number of temperature records.
Eventually, we may have a year with no temperature records that is warmer than 30s. It may be in the next interglacial, but it should happen eventually.
Capital Weather Gang likes to tout Reagan National Airport (DCA) with its expanded gravel around the thermometer (mainly raises low temps on calm nights) and large, new parking lots about 1/2 mile away (raises daytime highs with a west or SW wind). Our heat is real, my own thermometer hit 102 in a field with no parking lots or towns within 5 miles. Manassas is probably representative (100 or 101 the last couple of days). DCA could arguably add a degree to that, any extra would be new urbanization.
Ian (CWG) has pointed out that the thermometer used to be on the roof in various places (downtown and at the airport), so some of the old record highs may also reflect artificial local heating. So past and current DCA data is old crap compared to new crap. Dulles Airport (IAD) has some development around it and BWI has some local effects. Airports here and elsewhere are usually not good for recording temperature and CWG knows that but rarely informs their readers of that fact.
KevinM says: “The record high – vs- time chart does not mean as much as it seems. If temperature on any given day at each place were a random number between 0 and 110, and you tracked new highs (or lows) vs time, you would expect to see an exponential decay from t0 that approaches zero new highs per year after a span determined by the PDF of the random number generator.
That the count is high, but stops declining does not support the argument that nothing odd is afoot. I don’t think it is odd, I’m just picking on that chart.”
This is fair point, and without knowing the methodology involved in making the chart, I cannot say whether it is a problem for that particular chart. However, there are a large number of analyses not subject to this particular problem, and they generally show the same pattern: that the greatest extremes of heat occurred in the thirties.
One way to circumvent the tendency of setting records to decline as records get longer is to allow ties to go to the recent record: this induces a bias of the opposite kind, of course, but surely warmers couldn’t complain you were using a record biased to show current conditions cooler. This technique was used by Bruce Hall, and the result is shown in the last figure above. Clearly the recent period doesn’t compare to the past.
Another technique is not to use records, but rather count events above a certain threshold (a fixed, rather than moving goal post) several of the plots above show individual cities with a threshold of 100 Degrees Fahrenheit for one day events. Here is a heatwave index that was evidently good enough for the US Government, which naturally spun it to be scary:
http://i23.photobucket.com/albums/b370/gatemaster99/heatwaveindex.png
That was shown in an EPA document where they emphasized how awful it was that there were warm events recently, concentrated in the night time.
The graphic appears to be related to the work of Ken Kunkel and colleagues, which show a clear maximum of heat waves in around the 1930’s.
It is very easy to set ‘new records’ just start using a different reporting station in say 1970 (or even 1998) and don’t go back into the obs from the previous. I think you will find many of the records are caused just like that.
KevinM;
That the count is high, but stops declining does not support the argument that nothing odd is afoot. I don’t think it is odd, I’m just picking on that chart.
>>>>>
Well for starters, the earth had been warming up for the last several centuries, most of it long before CO2 increases started to become significant. Given that the earth has been warming for several centuries, we would EXPECT record highs to be posted every year due to natural on going processes.
That said, the temperature records we have are rather uneven. We don’t have temperature records going back to the age of Viking communities in Greenland for example. So, we know it was clearly warmer then that it is now, but a *recent* high in Greenland would constitute a “record” based on the very short temperature series we have from there, while a relatively high temperature in say central England where we have the very long CET to refer to might not be. If one truncated the CET to the same length as we have from Greenland… it might be again, while also being cooler than it was when the Vikings colonised Greenland.
Which is why screaming about records (both high and low) is pretty much meaningless. Until we have enough data to determine what baseline natural trends actually are, all the wailing and gnashing of teeth about records is just silly.
Ian W says:
July 8, 2012 at 5:07 pm
It is very easy to set ‘new records’ just start using a different reporting station in say 1970 (or even 1998) and don’t go back into the obs from the previous. I think you will find many of the records are caused just like that.
=======================================================
Or just “adjust” some of the old records.
Most of the biases discussed here would be overcome by using the ratio of new highs to new lws. If you don’t like ratios, you can plot the log ratio. The relative number of new highs to new lows has gotten much higher of the past 20 years and has been rather extreme lately. Where I live we just had four days in a row above 100 for the first time since records have been collected 1895. Really unfortunate for people who have been without electricity for 9 days due to extreme wind damage to trees throughout the region.
As several others have pointed out, the frequency of records, both high and low, should decay with time. On the first day of a particular site’s record, it is both the record hot and record cold day. With the passage of time, records get harder to break.
It would be more interesting to see how many new recording stations were added over the years.
Gentlemen, you’re missing the point. The spurious claim by the alarmists is that there are a record number of records being broke. It is isn’t true. The record number of records being broke is in the 30s. Yes, we would expect a decline in the record number of records, and we do see it. What we don’t see, and if it were true should concern us, is that a record number of records being broke.
Those charts aren’t showing the number of record highs/lows that were records at the time they were set. They are showing the number of record highs/lows during each decade from a 2012 perspective. For example, let’s say during a given decade, 500 record highs were set and 350 of them have been beat since then. The charts above would show only 150 record highs from that decade, not 500.
At least I’m fairly certain this is the case; otherwise, the total number of data points would be a lot higher. For example, there are only 600 data points for the state all-time record highs chart (12 x 50 = 600). But presumably most, if not all, of the states set new records during multiple decades, which would mean there would be far more than 600 data points if the way the above posters are interpreting these charts is correct.
Yes, of course the frequency of records shows decay over time. But here, as is probably true with most National Weather Service recordkeeping, a tie is replaced with the current year. So the fact that many high temperature records from the 1930s still stand means that they have not been reached or tied in that time. (In the Kansas City area, about one third of the summer highs were set in the 1930s; the other 2/3s scattered around the other 120 years or 12 other decades.) My conclusion is that the 1930s were hotter than more recent times. Can anyone explain to me why that is not true?
Here’s the list of record highs and lows I got from the NWS in 2007 for Columbus Ohio. Both highs and lows are listed by year, more recent at the top. Most of the record highs are before 1950 and most of the record lows are after 1950. (I know records have been broken since then but the 2007 list is the only one I’ve sorted this way.)
(Again, apologies for the length.)
DAY HIGH YEAR DAY LOW YEAR
Feb-09 66 2001 Mar-26 13 2001
Apr-08 83 2001 Apr-10 20 1997
Apr-09 83 2001 May-11 33 1997
Jan-02 64 2000 Sep-04 44 1997
Feb-25 74 2000 May-13 34 1996
Feb-26 75 2000 May-14 34 1996
Feb-11 74 1999 Apr-04 24 1995
Jan-05 65 1998 Sep-22 37 1995
Mar-30 82 1998 Sep-23 33 1995
Mar-31 83 1998 Nov-09 17 1995
Sep-26 92 1998 Jan-18 -17 1994
Sep-27 90 1998 Jan-19 -22 1994
Nov-10 71 1998 May-02 30 1994
Nov-28 67 1998 Mar-14 8 1993
Dec-06 73 1998 Mar-15 4 1993
Dec-07 69 1998 Jun-21 46 1992
Jan-04 67 1997 Jun-22 41 1992
Feb-21 71 1997 Nov-03 20 1991
Mar-01 65 1997 Nov-04 18 1991
Jan-18 68 1996 Nov-05 14 1991
Feb-27 71 1996 Jun-05 39 1990
Jan-13 67 1995 Aug-07 51 1990
Mar-14 78 1995 Jul-17 53 1989
Jun-14 94 1994 Aug-08 46 1989
Jun-17 97 1994 Aug-09 51 1989
Jun-19 98 1994 Oct-09 29 1989
Jun-20 97 1994 Dec-17 -12 1989
Mar-02 73 1992 Dec-18 -7 1989
May-14 91 1991 Dec-22 -17 1989
May-15 92 1991 Dec-23 -14 1989
Aug-02 99 1991 Jun-04 41 1988
Mar-11 76 1990 Jun-10 41 1988
Mar-12 75 1990 Jul-01 44 1988
Mar-13 78 1990 Jul-02 48 1988
Mar-15 79 1990 Sep-07 40 1988
Apr-27 88 1990 Oct-13 28 1988
Nov-27 75 1990 Oct-14 28 1988
Feb-01 66 1989 Oct-04 29 1987
Jun-21 98 1988 Apr-23 23 1986
Jun-22 97 1988 May-04 31 1986
Jun-25 101 1988 Jun-18 47 1986
Jul-07 100 1988 Nov-14 12 1986
Jul-15 100 1988 Jan-20 -19 1985
Jul-16 100 1988 Jan-21 -16 1985
Aug-17 97 1988 Feb-03 -10 1985
Apr-21 86 1987 Feb-04 -9 1985
Nov-02 79 1987 Mar-09 -6 1984
Nov-03 80 1987 Mar-10 2 1984
Nov-04 78 1987 May-15 36 1984
Feb-05 64 1986 May-30 36 1984
Apr-04 82 1986 May-31 38 1984
Feb-23 66 1985 Jul-08 49 1984
Apr-22 87 1985 Sep-06 40 1984
Nov-19 73 1985 Jul-07 48 1983
Feb-12 69 1984 Sep-24 35 1983
Dec-16 64 1984 Dec-24 -12 1983
Dec-17 67 1984 Dec-25 -12 1983
Dec-28 68 1984 Dec-26 -5 1983
Mar-05 78 1983 Jan-10 -11 1982
Mar-07 77 1983 Apr-07 14 1982
Aug-20 101 1983 Jun-24 46 1982
Sep-10 96 1983 Aug-22 46 1982
May-13 88 1982 Jun-27 45 1981
Dec-02 72 1982 Jul-30 49 1981
Dec-03 76 1982 Aug-17 48 1981
Dec-04 68 1982 Oct-24 21 1981
Dec-26 62 1982 Mar-02 0 1980
Apr-03 79 1981 Jun-12 43 1980
Nov-05 76 1977 Jun-17 44 1980
Feb-29 70 1976 Oct-06 30 1980
Mar-04 78 1976 Jan-09 -5 1979
Jan-10 59 1975 Feb-17 -7 1979
Jan-29 65 1975 May-05 32 1979
May-24 90 1975 Jun-25 43 1979
May-25 93 1975 Jul-19 50 1979
Nov-06 77 1975 Aug-16 46 1979
Nov-09 76 1975 Feb-01 -3 1978
Mar-03 75 1974 Feb-15 -4 1978
Mar-08 80 1974 Mar-05 1 1978
Mar-09 77 1974 Apr-22 27 1978
Mar-06 76 1973 May-01 30 1978
Mar-10 77 1973 May-03 30 1978
Nov-15 71 1971 Jan-13 -14 1977
Dec-10 72 1971 Jan-16 -13 1977
Dec-01 67 1970 Jan-17 -19 1977
Oct-13 85 1969 Feb-06 -11 1977
Oct-17 83 1968 Feb-07 -2 1977
Jan-23 68 1967 Feb-08 -13 1977
Dec-18 63 1967 Apr-29 28 1977
Dec-21 64 1967 Jun-07 39 1977
Mar-23 76 1966 Jun-08 40 1977
Dec-08 69 1966 Aug-20 50 1977
May-19 92 1964 Oct-17 26 1977
Dec-30 63 1964 Dec-06 3 1977
Apr-01 80 1963 Apr-12 21 1976
Apr-02 82 1963 Jul-18 53 1976
Oct-06 86 1963 Aug-02 50 1976
Oct-24 82 1963 Aug-30 45 1976
Oct-25 81 1963 Oct-18 25 1976
Oct-26 83 1963 Oct-28 21 1976
Oct-27 81 1963 Dec-05 8 1976
May-18 93 1962 Dec-31 -5 1976
May-20 91 1962 Sep-14 38 1975
Feb-24 72 1961 Mar-24 11 1974
Sep-24 92 1961 Mar-25 5 1974
Apr-23 88 1960 May-07 31 1974
Apr-24 88 1960 May-18 34 1973
May-02 88 1959 Apr-08 19 1972
May-03 89 1959 Apr-09 18 1972
May-06 91 1959 Apr-26 26 1972
Aug-14 96 1959 Jun-11 35 1972
Aug-23 95 1959 Jul-05 49 1972
Aug-25 99 1959 Jul-06 43 1972
Sep-28 92 1959 Aug-10 45 1972
Oct-04 89 1959 Oct-20 24 1972
Dec-27 66 1959 Apr-27 28 1971
Nov-17 76 1958 Apr-30 30 1971
Jun-16 96 1957 May-28 36 1971
Jun-13 95 1956 Aug-24 47 1971
Feb-28 65 1955 Nov-07 20 1971
Aug-01 97 1955 Nov-08 13 1971
Aug-03 100 1955 Jul-21 48 1970
Aug-04 99 1955 May-26 37 1969
Sep-17 94 1955 Jun-16 43 1969
Sep-18 95 1955 Oct-23 23 1969
Nov-13 74 1955 Jan-01 -6 1968
Feb-15 70 1954 May-06 29 1968
Jun-12 94 1954 Jul-03 50 1968
Jul-31 96 1954 Jul-04 47 1968
Sep-05 99 1954 Jul-29 51 1968
Sep-06 99 1954 Oct-05 31 1968
Nov-18 73 1954 Mar-01 -2 1967
Jul-01 98 1953 Apr-28 28 1967
Aug-29 98 1953 Jul-31 47 1967
Aug-30 100 1953 Aug-11 48 1967
Aug-31 98 1953 Aug-12 45 1967
Sep-01 99 1953 Aug-13 48 1967
Sep-02 100 1953 Sep-01 42 1967
Sep-03 99 1953 Sep-02 43 1967
Sep-04 96 1953 Sep-25 33 1967
Sep-29 96 1953 Jan-30 -5 1966
Sep-30 92 1953 May-10 25 1966
Oct-03 89 1953 Jun-02 39 1966
Oct-19 85 1953 Jul-22 50 1966
Oct-20 84 1953 Dec-03 0 1966
Oct-21 83 1953 Dec-04 3 1966
Nov-16 72 1953 Aug-03 45 1965
Jan-01 67 1952 Aug-29 39 1965
Jan-17 62 1952 Jan-14 -14 1964
May-05 92 1952 Aug-14 45 1964
Jun-26 100 1952 Aug-15 43 1964
Jul-28 100 1952 Sep-13 38 1964
Oct-01 89 1952 Oct-11 24 1964
Dec-09 66 1952 Oct-12 27 1964
Oct-05 90 1951 Dec-01 7 1964
Dec-31 68 1951 Jan-24 -15 1963
Jan-25 74 1950 Jan-28 -15 1963
Jan-26 70 1950 Jan-29 -13 1963
Oct-31 83 1950 Feb-22 -8 1963
Nov-01 80 1950 Feb-26 -10 1963
Jan-16 60 1949 Feb-27 -11 1963
May-04 91 1949 May-23 34 1963
Oct-10 85 1949 Jul-09 49 1963
Dec-12 64 1949 Jul-10 45 1963
Feb-18 65 1948 Sep-30 31 1963
Mar-21 77 1948 Dec-20 -10 1963
Apr-26 89 1948 Apr-16 22 1962
Jun-23 96 1948 Apr-17 25 1962
Aug-24 97 1948 Jul-27 45 1962
Aug-26 98 1948 Jul-28 50 1962
Aug-27 100 1948 Aug-18 48 1962
Aug-28 97 1948 Sep-21 31 1962
Dec-15 65 1948 Oct-26 23 1962
Apr-05 83 1947 Oct-27 20 1962
Oct-22 83 1947 Dec-12 -2 1962
Oct-23 83 1947 May-27 34 1961
Jan-06 69 1946 Jun-26 48 1961
Jan-09 65 1946 Mar-07 4 1960
Feb-04 66 1946 Mar-08 -2 1960
Mar-16 79 1945 Jun-28 48 1960
Mar-25 85 1945 Oct-25 23 1960
Apr-10 82 1945 Dec-13 -7 1960
Sep-23 91 1945 May-16 32 1959
Nov-08 74 1945 Jun-14 44 1959
Jun-18 99 1944 Jun-15 47 1959
Jun-27 101 1944 Jun-19 47 1959
Jun-28 102 1944 Sep-17 37 1959
Aug-10 98 1944 Sep-18 34 1959
Aug-11 98 1944 Nov-17 13 1959
Aug-15 95 1944 Nov-30 -4 1958
Apr-30 89 1942 Dec-10 -8 1958
May-01 88 1942 Jul-16 52 1957
Nov-20 74 1942 Nov-10 19 1957
Apr-13 86 1941 Nov-11 20 1957
Apr-14 84 1941 May-24 36 1956
Apr-19 86 1941 Sep-20 37 1956
May-21 92 1941 Jan-31 -5 1955
May-22 93 1941 Mar-27 15 1955
Oct-07 88 1941 Mar-28 15 1955
Dec-22 63 1941 Nov-02 25 1954
Jul-29 99 1940 Apr-18 22 1953
Jul-30 99 1940 Apr-19 21 1953
Aug-18 96 1940 Apr-21 22 1953
Feb-19 70 1939 Nov-06 20 1953
May-23 90 1939 Aug-01 48 1952
Sep-07 98 1939 Aug-23 46 1952
Sep-08 100 1939 Oct-07 29 1952
Sep-09 95 1939 Oct-21 17 1952
Sep-13 95 1939 Oct-22 24 1952
Sep-14 98 1939 Feb-02 -13 1951
Sep-15 97 1939 Aug-05 46 1951
Oct-08 91 1939 Sep-08 39 1951
Oct-09 89 1939 Dec-16 -14 1951
Feb-13 68 1938 Apr-14 20 1950
Mar-22 82 1938 Jul-14 47 1950
Oct-18 83 1938 Aug-04 49 1950
Nov-07 78 1938 Nov-24 7 1950
Jan-08 66 1937 Nov-25 5 1950
Feb-08 72 1937 Nov-26 7 1950
May-07 87 1936 Dec-27 -14 1950
May-08 89 1936 Dec-28 -10 1950
May-10 94 1936 May-29 38 1949
Jul-08 102 1936 Jan-26 -9 1948
Jul-09 105 1936 Mar-11 8 1948
Jul-11 104 1936 Mar-12 1 1948
Jul-12 103 1936 Aug-06 48 1948
Jul-13 101 1936 Dec-15 -4 1948
Jul-14 106 1936 May-08 29 1947
Jul-27 102 1936 May-09 28 1947
Aug-13 98 1936 Jul-20 49 1947
Aug-19 101 1936 Jul-23 47 1947
Aug-21 99 1936 Jul-24 52 1947
Aug-22 98 1936 Sep-27 32 1947
Jun-01 96 1934 Jul-26 50 1946
Jun-29 100 1934 Sep-03 43 1946
Jul-20 101 1934 Oct-02 31 1946
Jul-21 106 1934 Jun-06 39 1945
Jul-24 102 1934 Jul-11 50 1945
Jul-25 104 1934 Aug-26 47 1945
Jul-26 102 1934 Aug-27 45 1945
Nov-21 73 1934 Oct-16 30 1944
Nov-30 71 1934 Mar-03 0 1943
Jun-08 98 1933 Mar-04 -1 1943
Jun-11 95 1933 Jun-30 46 1943
Jul-23 99 1933 Aug-19 48 1943
Dec-23 62 1933 Sep-10 41 1943
Jan-14 70 1932 Jan-07 -6 1942
Jan-15 64 1932 Jan-08 -12 1942
Feb-10 69 1932 Sep-28 32 1942
Nov-22 74 1931 Sep-29 31 1942
Nov-23 72 1931 Dec-21 -11 1942
Nov-24 68 1931 Mar-18 7 1941
Dec-11 66 1931 May-12 34 1941
Feb-22 70 1930 Jul-12 47 1940
Apr-11 88 1930 Jul-13 44 1940
Apr-12 86 1930 Aug-21 43 1940
Jun-07 95 1930 Sep-12 42 1940
Jul-19 98 1930 Sep-26 33 1940
Aug-09 98 1930 Oct-15 24 1939
Apr-06 82 1929 Jan-22 -16 1936
Oct-11 86 1928 Jan-23 -15 1936
Oct-12 84 1928 Jan-27 -8 1936
Oct-28 81 1927 Feb-18 -7 1936
Oct-30 80 1927 Feb-19 -6 1936
Nov-11 74 1927 Apr-15 22 1935
Nov-29 70 1927 Feb-28 2 1934
Feb-06 60 1925 Apr-24 28 1930
Feb-07 61 1925 Jul-15 49 1930
Jun-05 95 1925 Nov-27 3 1930
Jun-06 95 1925 Nov-28 7 1930
Mar-20 78 1921 May-20 36 1929
Oct-02 88 1919 May-25 33 1925
Feb-14 68 1918 Oct-10 29 1925
Aug-05 103 1918 Oct-29 21 1925
Aug-06 102 1918 Jun-03 41 1924
Aug-07 98 1918 Mar-31 9 1923
Jan-31 62 1917 Apr-01 15 1923
Jan-12 67 1916 Jun-29 48 1923
Jan-27 68 1916 Sep-15 40 1923
Jan-30 64 1916 Apr-13 21 1920
Apr-25 90 1915 Apr-25 25 1919
May-30 95 1915 Jan-12 -13 1918
Jan-28 66 1914 Feb-05 -10 1918
Apr-28 85 1914 Jun-23 44 1918
May-29 94 1914 Feb-12 -8 1917
Jun-09 96 1914 Sep-11 39 1917
Jun-24 97 1914 Dec-09 -8 1917
Aug-08 95 1914 Dec-11 -9 1917
Aug-16 96 1913 Sep-16 40 1916
Feb-17 67 1911 Mar-30 16 1915
May-26 94 1911 Aug-31 43 1915
May-27 94 1911 Feb-24 -1 1914
May-28 94 1911 Jun-20 45 1914
Jun-10 98 1911 Nov-20 11 1914
Jul-03 101 1911 Jun-09 39 1913
Jul-04 104 1911 Jul-25 52 1911
Jul-05 97 1911 Nov-12 16 1911
Mar-24 84 1910 Nov-13 14 1911
Mar-27 81 1910 Apr-02 20 1907
Mar-28 83 1910 Feb-14 -8 1905
Mar-29 83 1910 Feb-16 -5 1904
Jan-24 66 1909 Apr-20 22 1904
Nov-14 74 1909 Jun-13 46 1903
Dec-05 67 1909 Sep-05 45 1902
Nov-25 68 1908 Mar-06 2 1901
Jan-07 64 1907 Sep-19 40 1901
Jan-19 67 1907 Feb-25 -7 1900
Mar-26 80 1907 Mar-16 4 1900
Jan-20 68 1906 Mar-17 0 1900
Jan-21 72 1906 Feb-09 -17 1899
Jan-22 71 1906 Feb-10 -20 1899
Feb-02 64 1903 Feb-13 -13 1899
Mar-18 77 1903 Oct-01 30 1899
Mar-19 77 1903 Dec-14 -1 1898
Jun-30 99 1901 Mar-13 7 1896
Jul-22 104 1901 Oct-19 25 1896
Dec-13 65 1901 Oct-30 20 1895
Dec-14 65 1901 May-19 37 1894
May-16 96 1900 Jun-01 41 1894
May-17 92 1900 Jan-15 -12 1893
Sep-25 93 1900 May-17 34 1891
Oct-29 80 1900 Oct-08 29 1889
Apr-29 86 1899 Oct-03 31 1888
Jul-02 98 1898 Mar-29 14 1887
Jan-03 64 1897 Aug-25 46 1887
Jun-15 96 1897 Aug-28 44 1887
Sep-12 96 1897 Oct-31 20 1887
Sep-16 96 1897 Nov-29 2 1887
Oct-14 86 1897 Jan-11 -11 1886
Oct-15 90 1897 Dec-02 1 1886
Oct-16 88 1897 Feb-11 -11 1885
Apr-15 82 1896 Feb-20 -9 1885
Apr-16 86 1896 Feb-21 -8 1885
Apr-17 88 1896 Feb-23 -4 1885
Apr-18 89 1896 Mar-19 8 1885
Apr-20 85 1896 Mar-20 1 1885
May-09 93 1896 Mar-21 8 1885
May-11 92 1896 Mar-22 6 1885
Nov-26 70 1896 Mar-23 9 1885
May-31 96 1895 Jan-05 -16 1884
Jun-02 96 1895 Jan-06 -20 1884
Jun-03 99 1895 Jan-25 -15 1884
Jun-04 97 1895 Feb-29 0 1884
Sep-11 96 1895 Dec-19 -8 1884
Sep-19 97 1895 May-21 34 1883
Sep-20 97 1895 May-22 35 1883
Sep-21 96 1895 Sep-09 39 1883
Sep-22 95 1895 Nov-15 15 1883
Dec-19 61 1895 Nov-16 12 1883
Dec-20 62 1895 Apr-11 23 1882
Apr-07 85 1893 Dec-07 -1 1882
Dec-25 64 1893 Dec-08 -4 1882
Feb-20 68 1891 Apr-05 15 1881
Jan-11 66 1890 Apr-06 19 1881
Feb-03 63 1890 Nov-18 10 1880
Mar-17 74 1889 Nov-19 -3 1880
Dec-24 66 1889 Nov-21 5 1880
Dec-29 67 1889 Nov-22 -5 1880
Jul-17 100 1887 Nov-23 -1 1880
Jul-18 99 1887 Dec-29 -10 1880
Feb-16 72 1883 Dec-30 -12 1880
May-12 90 1881 Jan-02 -13 1879
Jul-06 98 1881 Jan-03 -20 1879
Jul-10 103 1881 Jan-04 -10 1879
Aug-12 97 1881 Apr-03 18 1879
Nov-12 74 1879 Nov-01 24 1878
Thank goodness there are at least some people here who can spot the mathematical mistake in this post from Real-Science dot blog, so I don’t have to address it. The conclusions the post draws are nonsensical. Maybe Real-Science should actually be called Fake-Science.
But why did this post even get posted? This point was made and debunked back on the “Eastern U.S. Heat Wave” post. Seems like some re-tread arguments that have already been debunked are being rolled out again to fool …. well, who?
As for Aleo’s post, he’s avoided addressing the issue: What has happened to summertime NH mid-latitude temperatures in the last 30 years? Answer: they are warming, and there now seems to be more severe periodic heat waves, while other neighboring regions experience spells of colder than normal temperatures.
Some of the states in the US southeast are on course to have their three hottest summers ever, in a row! This is an extremely unlikely event in a random system.
If the emerging El Nino really kicks in, then 2013 should be the hottest year in the history of human civilization. Couple this with low Arctic ice pack influence on the jet stream Rossby waves, and next year should see some really severe weather patterns.
I just went to NWS and counted high temperature records. For the summer (June, July and August), in Kansas City, there were 49 high temp records set in the 1930s–that is over half of the 92 days in those 3 months. So again, what is the argument that the 30s were not warmer than now?
James Sexton has it right. When you’re looking at records time doesn’t come into play. The old records still have to be higher than anything that has happened since then or it wouldn’t be a record.
James,
If you are looking for a change on the order of 1C, and your temperature has a range of about 30C, then no, you are not looking for a record number of new records. You are looking for any statistically significant deviation from the expected decay trend.
I happen to believe global warming is horse shite, but that’s no excuse for bad math. You can model this with the RAND() function in an Excel sheet. It’s entry level science.