This is a combination of two posts elsewhere that illustrate just how much hype and how little substance the MSM and blogs like Grist, Climate Progress. and Capital Weather Gang have been pushing trying to make a run of the mill summer heat wave seem like an event of unprecedented global warming proportions. It isn’t, and not even close compared to weather records history of the past.
Spread these far and wide, anywhere the hype manifests itself.
First from the Real-Science blog, an analysis of the 3000 new high temperature records set that gets touted by the shrill alarmists as if this never happened before and is a direct consequence of CO2 in the atmosphere. It isn’t according to the data:
==============================================================
There have been 372,989 correctly recorded daily high temperature records in the US since 1895. 84% of them were set when CO2 was below 350ppm.

Compare the number of record highs in the 1930s to the past decade. You can see that the 1930s were consistently much hotter.


=============================================================
Bear in mind, that since the 1930’s, when the majority of America (and weather stations) were rural, we now have many more large cities and many weather stations compromised (~90% of USHCN stations in Category 3,4,5 from Fall et al) by affected by urbanization encroachment.

Next up, a much broader analysis from Joe D’Aleo of WeatherBell via ICECAP:
=============================================================
Records and Extremes – Updated
By Joseph D’Aleo, CCM, AMS Fellow
Following the super La Nina of 2010/11, we had a period of extremes – snow and cold to start, then floods and drought, tornadoes and heat and a landfalling hurricane.
As the La Nina faded but the eastern and northern Pacific water remained cold, a warm and dry winter followed in 2011/12 much as the warm winter of 1918/19 followed the super La Nina of 1917/18 which was the only colder, snowier La Nina this century.
The warmth peaked in March. With the exception of the Pacific Northwest, most of the nation was well above normal with many daily record highs. Warmest March in the record books for the lower 48.
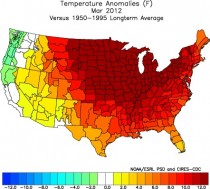
The warmth has continued but gradually subsided since then.
Despite the high number of record daily highs, this is a US centric warm event. The NCEP CFSv2 global anomalies from the winter through early June have been much of the time below the 1981-2010 average. The deep Eurasian cold wave shows in late January.
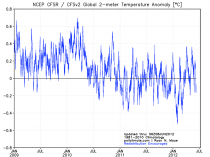
Looking back over the last century, you can explain global temperatures by ENSO and volcanism and the ocean multidecadal cycles that favor a particular ENSO state. Here is the plot since 1979 of all data sets with ENSO and volcanism indicated.
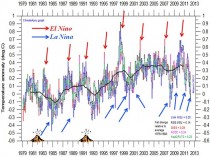
El Ninos bring a short term warming, La Ninas a dip in global temperatures. The warm mode of the Pacific from 1977 to 1998, led to a net warming. Major volcanoes produce a cooling as we saw in the early 1980s and early 1990s, lack of volcanism (like we have seen since the middle 1990s) means more solar radiation at the surface and enhanced warming.

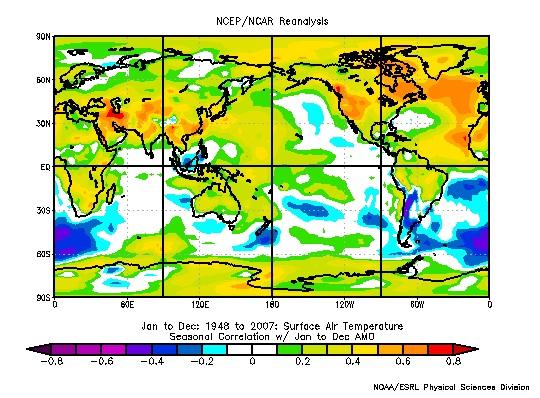
In 1995, the Atlantic went into its warm mode, which means a warmer annual temperature in the Northern Hemisphere.
May for the US was warm again making the last year in the US allegedly the warmest in the record, but as John Christy of UAH noted from the satellite perspective, it was notable only in the lower 48 (see).
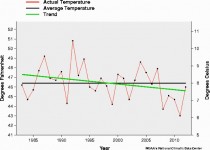
Again in the Pacific Northwest, it actually was colder than the 30 year mean for the fifth straight year.
•Spring temperatures across the Northwest Region have been trending downward at a rate of 0.59 degrees F per decade during the 30 years since 1983.
•Spring temperatures across the Northwest Region have been trending downward at a rate of 4.10 degrees F per decade during the 10 years since 2003.
A Cold west usually translates to warmth further east as we saw in the 2010 and 2011 summers.
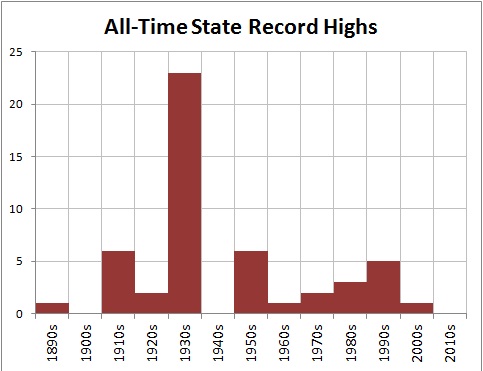
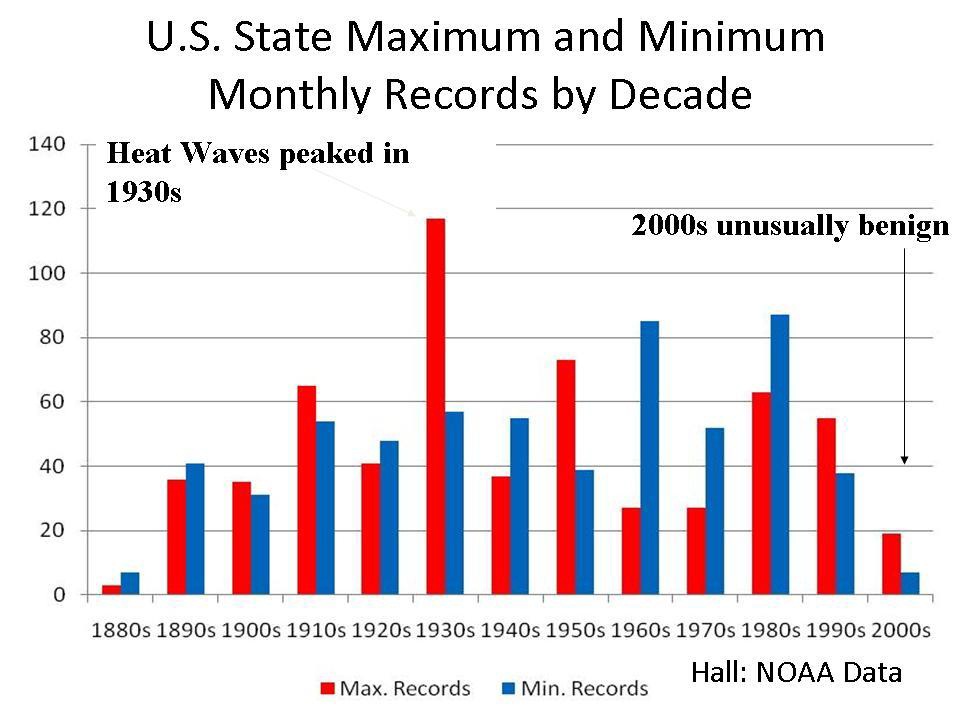
As hot as it has been the past two summers, the heat is not cracking all-time levels. Here is the latest decadal plot of all-time records for the 50 states. When multiple years are tied, the latest year/decade is used.

The 1930s stands out as the hottest decade, the 1910s and 1950s were second, 1990s third and 1980s fourth. This decade doesn’t rank although it is early.
All time cold records look like this.

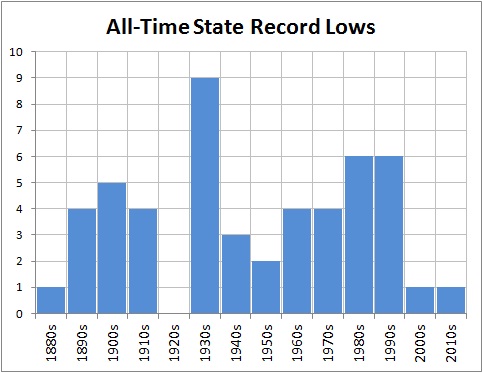
New York City reached 100F last summer, but that was common from the 1930s to 1950s.

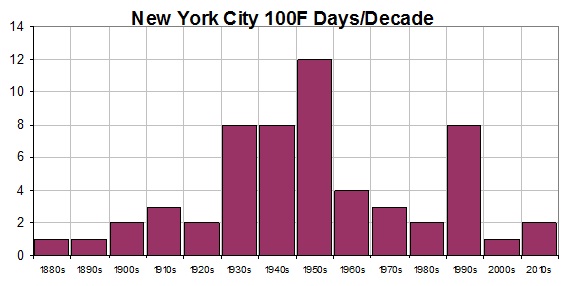
Oh by the way see how the 100 degree days compares with CO2.
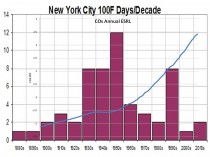
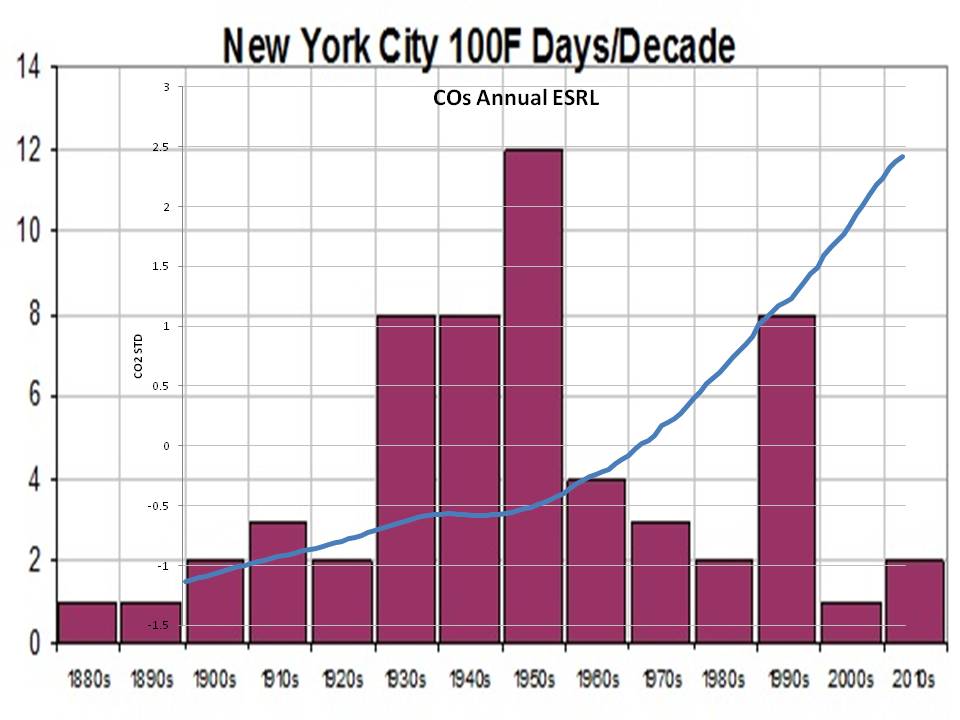
Here is Des Moines which has seen fewer and fewer 100F days in recent decades.
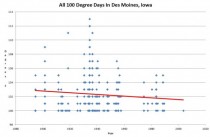
As Steve Goddard reports “During the 1930s, 100 degree days were very common in Des Moines. They very rarely happen any more. It has been nine years since Des Moines hit 100F. By contrast, 1934 had thirty-one days over 100 – including five days over 110 and three days over 112.”
The state monthly records through the end of the 2009.. This depicts the 12 monthly records for the 50 states (600 data points). There were likely March heat records set in some states and perhaps some other months so the 2010s will show and take away from some prior years.

See Bruce Hall’s 2010 guest post on Roger Pielke Sr.’s Climate Science here.
ICECAP NOTE: ICECAP was one of the earliest ‘realist’ climate blogs that provided insight into natural factors and challenged the orthodoxy. Your donations helped us maintain the site and provide some support for the time invested in keeping it updated. One or more posts have been added a day for going on 5 years now now totaling 6,082 entries. 305,205 have enrolled as members with a total of 32,446,550 page hits. All the posts are archived. We maintain them in the archives and have a good search tool. I maintain the site as best I can – maintaining a secure site with high traffic is expensive. You can help with even small donations – see the DONATE button left or email me at frostdoc@aol.com for an address to mail a check if you prefer not using PAYPAL. Rest assure, we have never had an issue with Paypal although they get a piece of any transaction. I have had at times had to subsidize the site from month to month. I don’t like having to ask people for donations but our side despite all the claims to the contrary is not subsidized/ endowed with money and grants like the alarmist blogs like RealClimaate and Climate Progress. You will never see them ask for donations. They get all they need from their liberal foundations and eco groups.
You can also help by buying books in the Amazon store and/or enrolling as a Premium member of Weatherbell.com, where I am co-chief meteorologist with Joe Bastardi. recently Dr. Ryan Maue from FSU has joined our staff and is helping us provide model based value-added output. He maintains and has published on the ACE index. We have a weather radio show on Sunday nights 8pm to 9:30pm EDT called Wise Guys of Weather Radio. On the Weatherbell site we have the premium blogs and specialized forecasts for energy, agriculture, marine, snow, insurance and other applications on the Commercial site. Joe B has also posted on Icecap. Both Icecap and Weatherbell are 7 day a week jobs. I have also PRO BONO helped produce documents for comments to the EPA that enabled lawyers to file a science based AMICUS brief that went to the DC courts to try and stop EPA deadly overregulation. Thank you for you support over the years. Joe D’Aleo and Art Horn
Mr. Cain Thaler says:
July 9, 2012 at 3:19 pm
stevengoddard
Who is talking about normal Guassian distributions? I remarked that the data looks distributed in a log normal distribution.
I will say that I’m now confused about what rules this data is assembled under. I was under the impression from reading the graph that this is data that is collected each time a record temperature has been broken.
=================================================
Mr. Cain Thaler,
Apparently, you weren’t alone in that assumption. I’m not Steve, but, let me try to explain…….
It is a collection of records per site per day…… the current records. So, when you look at the graph, in the mid 30s, for a couple of years, we see that nearly 1000 records were set and still stand!! Again, this is per site, per day, and then grouped by occurrences of that particular year.
If this had been a graph of each time a record was broke, then the first year would have had the highest point on the graph.
Essentially, this is a look back at history. It asks the question what are the current record temps for each day of the year for each site and what year did this happen and how often did this happen per year? The last two questions were plotted.
On June 28, 1778, the American Revolution Battle of Monmouth (New Jersey) was fought in 100-104 temperatures. Many losses on both sides were due to heatstroke.
Paul K2 says:
July 9, 2012 at 3:02 pm
The meteorologist Dr. Jeff Masters at Wunder blog has a post up showing that the heat wave has resulted in a third consecutive record hot rolling 12-month period for the US. The chance of this happening randomly is… wait for it… 1.6 million to one!
=======================================================
LMAO! Thanks Paul! Yes, 1.5% area of the globe having a warm spell, 1.6 million to one….. love it! Explains a lot.
James Sexton and Terry Stern: The cost of the changing extreme weather trends due to jet stream changes on crop losses are nearing ten billion annually in the US alone. And there are the lives lost due to persistently high temperatures in the summer.
Do you have have a plan to compensate for the loss of farms, ranches, fisheries, and forests? How about the cost of the lives lost?
But wait, there is cost of the flooding and abnormal weather in England right now. And how about the heat wave in Central Europe, and then moving to the other side of the stalled Rossby wave in the jet stream, we see the extraordinary flooding in Russia. And so forth around the planet, we can see the impact of the slowed jet stream, and persistent blocking patterns in the weather systems.
You need to learn a bit about meteorology, and I suggest you get off this site and find a meteorologist like Dr. Jeff Masters. Read his posts on changes in the meteorology systems, and especially the post where he talks about Dr. Jennifer Francis and other meteorologists who are examining changes in jet stream patterns caused by loss of Arctic ice and reduced NH snow cover.
We are only talking about severe heat waves, precipitation events, cold spells (especially in the winter) all through the NH mid-latitudes where billions of people live.
Paul K2 says:
“You need to learn a bit about meteorology…”
Paul K2 needs to learn something about the climate Null Hypothesis, about which he is obviously completely ignorant. The Null Hypothesis has never been falsified. Simply, it says that current parameters such as temperature, precipitation, hurricanes, tornadoes, etc., have not been exceeded. Therefore, there is no “abnormal weather”. There is only abnormal pseudo-science, which K2 keeps flogging here.
Paul K2 needs to take some time out, and learn about the Null Hypothesis. It is clear that he does not understand it. Even Kevin Trenberth understands it, which is why Trenberth wants to reverse the Null Hypothesis and put the onus on skeptics. K2 is simply not up to speed on the subject. Thus, his arm-waving over “abnormal weather”, which is only a figment of his imagination. Weather is weather, and nothing “abnormal” is occurring. It has all happened before, and Holocene parameters are not currently being exceeded.
As Roy Spencer points out: “No one has falsified the hypothesis that the observed temperature changes are a consequence of natural variability.”
I changed the algorithm to remove any bias. Instead of assigning the *all-time* record temperature to the first or last year it occurred, I now assign duplicates to all years which reached the record.
This changed the shape very little, but increased the total number of records.
http://stevengoddard.wordpress.com/2012/07/10/another-abuse-of-statistics-by-the-team/
cainthaler
A record temperature is marked if it is the highest temperature at a given station on a given day of the year, relative to all other years which have records at that station on that date.
When you hear that a record high was set in 1936, that means that the all-time record high was set in 1936. Those are the records that I am plotting.
Paul K2 says:
July 9, 2012 at 7:18 pm
James Sexton and Terry Stern: The cost of the changing extreme weather trends due to jet stream changes on crop losses are nearing ten billion annually in the US alone. And there are the lives lost due to persistently high temperatures in the summer.
===============================================
Paul, First of all, the jet stream was never in a static state. Secondly, there is no change in extreme weather trends. That’s a work of fiction. And, demonstrably false. Regardless of what you believe about the graphics shown here, we note there is no upward trend on local temp records being broke. Hurricanes, droughts, tornadoes and floods, all have a slight to moderate decrease in frequency and severity.
Weather events have always been the bane of farming, being acutely aware of and in constant contact with an agricultural community, I can say, there is no out of the norm loss. In fact, global food production continues to increase, as it has for centuries.
But, while were talking about global concerns, you do realize that this years, so far, as been exceptionally cool, right? Here, you don’t even have to read the words, (you may feel aggrieved) just look at the graphs…… http://suyts.wordpress.com/2012/07/09/reality-check-to-the-profoundly-stupid-the-u-s-isnt-the-entire-globe-this-year-is-the-3rd-coldest-in-the-last-15-years/
Yeh, globally this is the 3rd coolest in the last 15 years.
Oh, btw, there has been no decrease in NH snow cover for over 20 years. http://suyts.files.wordpress.com/2012/04/image_thumb90.png?w=652&h=389 (graph derived from Rutgers, all seasons) So, I’m wondering what Masters thinks he’s studying.
All other assertions about weather events will be happily shown upon request.
Paul, at some point, not only compensation will be brought up, but also the pursuit of justice. You’d do well to actually look at the numbers and facts yourself and quit believing the hysteria driven misanthropy we call CAGW.
I quoted my source on extreme weather events, and gave the link to Dr. Masters’ post covering the data:
The post also shows the key figure from a report showing the US Climate Extremes Index hit an all-time high. In spite of a great of reluctance to accept the data showing more extreme weather, the Index indicates that more extreme weather is hurting America.
Get up to speed guys, the US climate extremes index has been around for awhile, the data extends back before 1900. The index has never been this high before.
There are more severe weather events in the US, costing money and lives.
Paul K2 says:
July 9, 2012 at 11:51 pm
I quoted my source on extreme weather events, and gave the link to Dr. Masters’ post covering the data:
=======================================
Yes, you have. I regularly have a good laugh at Dr. Master’s expense. I’d suggest look into what goes into those numbers. I mean really, didn’t you say Master’s was studying the effects of the loss of snow cover? Now, if you’d followed my link, and understand that the data comes for the foremost snow cover tracking entity, and see that we haven’t had any snow cover loss in the last 20 years, what does this say about the information he’s providing? Never mind attaching any cause to any perceived increase in any imaginary extreme events.
Paul K2
You did not get the point of of my comment. The point was that the present heat on the east coast is not unprecedented and such events predate the industrial revolution. I don’t understand how you concluded that I need to learn a little about meteorology. I can conclude that you are a presumptuous jerk.
I have no plan to do anything in relation to climate change. I don’t feel there is anything that can or should be done. Weather events will continue to be inconvenient despite efforts to eliminate them.
As to your comment regarding abnormal weather in England, there is no normal. Weather will fluctuate periodically. Here in Southern California the weather has been very pleasant.
I have no desire or intention of getting off this site. Your suggestion that I do so is asinine.
Thank you James Sexton and Smokey for covering well some of the other PK2 gibberish.
Paul K2, can you explain why the “9 point binomial filter” in the US Climate Extremes Index continues to the present year rather than stopping 5 years ago? Also how much of the climate extremes is due to natural variability? It seems to me that AGW simply adds an extra bit of heat to a heat wave (thus also a bit of extra dryness in a drought) and is no responsible for the bulk of the deviation from normal.
Paul K2 said: “Get up to speed guys, the US climate extremes index has been around for awhile, the data extends back before 1900. ”
Been around since 1995, about as long as I have studied AGW.
I don’t suppose we have similar graph (similar to the first one shown) of record lows? The lower graph (state lows) appears to show that we have been getting more record lows recently than record highs.
It is staggering how fast that heat left. It went from 35 C to 15 C overnight July 6/7th. We have been having lows of 15 since, just north of Toronto. I just had to turn the heat back on as it is too nasty waking up at 15 C
I’m going insane! So should I buy coal? Or move to the mountains to stay cool? They’re coming to take me away, heehaw… tree rings? Records? Government putting stuff in my water. My A/C broke last night… 101 out in L.A. this AM was 69… gawd… I just don’t know.
Roger Dane says:
July 11, 2012 at 6:44 am
I’m going insane! So should I buy coal? Or move to the mountains to stay cool? They’re coming to take me away, heehaw… tree rings? Records? Government putting stuff in my water. My A/C broke last night… 101 out in L.A. this AM was 69… gawd… I just don’t know.
===========================================================
I work in the field. Even though it’s LA, you’re water is probably fine. Just don’t drink the Kool-Aid.