In today’s report
- Arctic Sea Ice on the rise again, presently in the range of normal levels
- Antarctic Sea Ice is at slightly above normal levels
- Why is early satellite data for Arctic and Antarctic Ice extent referenced in the first IPCC report missing from today’s data?
- Is revisionism going on with the date of the famous USS Skate photo in the Arctic?
- Bonus – it seems NOAA is taking Arctic soot seriously
First the Arctic from NSIDC:

Source: http://nsidc.org/data/seaice_index/images/daily_images/N_stddev_timeseries.png
After being out of the ±2 STD area since before peak melt last year, Arctic extent has spent most of March in near normal territory. After what looked like a maximum earlier this month, it was false peak, and ice is on the rise again.
NORSEX SSM/I shows the current value within ±1 STD

Source: http://arctic-roos.org/observations/satellite-data/sea-ice/observation_images/ssmi1_ice_area.png
A caution, as we saw in 2010, extent hugged the normal line for quite awhile, and that didn’t translate into a reduced or normal summer melt. So, forecasting based on this peak might not yield any skillful ice minimum forecasts.
Antarctic Sea Ice is at slightly above normal levels, as it has been for some time:

Source: http://nsidc.org/data/seaice_index/images/daily_images/S_stddev_timeseries.png
Why is early satellite data for Arctic and Antarctic Ice extent referenced in the first IPCC report missing from today’s data?
In a post last week, Steve Goddard pointed out that in the original IPCC FAR in 1990, there was an interesting graph of satellite derived Arctic sea ice extent:

This is from page 224 of IPCC FAR WG1 which you can download from the IPCC here
And here is figure 7.20 (a) magnified:

The IPCC descriptive text for these figures reads:
Sea-ice conditions are now reported regularly in marine synoptic observations, as well as by special reconnaissance flights, and coastal radar. Especially importantly, satellite observations have been used to map sea-ice extent routinely since the early 1970s. The American Navy Joint Ice Center has produced weekly charts which have been digitised by NOAA. These data are summarized in Figure 7.20 which is based on analyses carried out on a 1° latitude x 2.5° longitude grid. Sea-ice is defined to be present when its concentration exceeds 10% (Ropelewski, 1983). Since about 1976 the areal extent of sea-ice in the Northern Hemisphere has varied about a constant climatological level but in 1972-1975 sea-ice extent was significantly less. In the Southern Hemisphere since about 1981, sea-ice extent has also varied about a constant level. Between 1973 and 1980 there were periods of several years when Southern Hemisphere sea-ice extent was either appreciably more than or less than that typical in the 1980s.
I find it interesting and perhaps somewhat troubling that pre-1979 satellite derived sea ice data was good enough to include in the first IPCC report in 1990, but for some reason not included in the current satellite derived sea ice data which all seems to start in 1979:

Since the extent variation anomalies in 1979 seem to match with both data sets at ~ +1 million sq km, it would seem they are compatible. Since I’m unable to find the data that the IPCC FAR WG1 report references so that I can plot it along with current data, I’ve resorted to a graphical splice to show what the two data sets together might look like.
I’ve cropped and scaled the IPCC FAR WG1 Figure (a) to match the UUIC Cryosphere Today Arctic extent anomaly graph so that the scales match, and extended the base canvas to give the extra room for the extended timeline:

Click image above to enlarge.
Gosh, all of the sudden it looks cyclic rather than linear, doesn’t it?
Of course there will be much wailing and gnashing of teeth over my graphic, and the usual suspects will try to pooh-pooh it, but consider the following
- Per the IPCC reference, it is data from NOAA, gathered by the American Navy Joint Ice Center
- It is satellite derived extent data, like Cryosphere Today’s data
- The splice point at 1979 seems to match well in amplitude between the two data sets
- The data was good enough for the IPCC to publish in 1990 in the FAR WG1, so it really can’t be called into question
- If Mike Mann can get away with splicing two dissimilar data sets in an IPCC report (proxy temperature reconstructions and observations) surely, splicing two similar satellite observation data sets together can’t be viewed as some sort of data sacrilege.
Of course the big inconvenient question is: why has this data been removed from common use today if it was good enough for the IPCC to use in 1990? Is there some revisionism going on here or is there a valid reason that hasn’t been made known/used in current data sets?
If any readers know where to find this data in tabular form, I’ll happily update the plot to be as accurate as possible.
Is revisionism going on with the date of the famous USS Skate photo in the Arctic?
It seems our favorite photo of the USS Skate has had it’s date revised.

Since yesterday was the anniversary of the March 17th surfacing of the USS Skate, WUWT contributor Ric Werme was interested in what the photographic conditions might look like on March 17th 1959 when the sun was just below the horizon, and so found a sub and attempted to recreate the photo conditions himself to see if the photograph was actually possible.
See: http://wattsupwiththat.com/2012/03/17/submarines-in-the-winter-twilight/
Turns out it was, but then he stumbled on something he didn’t expect to find. The date for the surfacing has been changed from March 17th, 1959 to August, 1958 (with no day given) in Wikipedia and in NAVSOURCE. He at first thought I’d made a mistake in citation, but it turns out dates have been changed since I wrote my original article on the USS Skate on April 26th, 2009.
I wrote about how the original date remains on NAVSOURCE in the Wayback machine
Anthony Watts says:
Navsource, in the Wayback machine, had it stated as March 17th 1959, just days before my original article. This is the April 18th 2009 snapshot from Wayback:
http://web.archive.org/web/20090418161606/http://www.navsource.org/archives/08/08578.htm
The caption then reads:
Skate (SSN-578), surfaced at the North Pole, 17 March 1959.
I remember checking NAVSOURCE for accuracy before publishing, my caption then says:
Skate (SSN-578), surfaced at the North Pole, 17 March 1959. Image from NAVSOURCE
History on that photo changed there at NAVSOURCE since then, probably due to alarmist pressure from Wiki etc. and other folks like Neven who went ballistic over the picture when I highlighted it. It is “inconvenient” in March (during peak ice season) but soothing for them in August (during near peak melt season).
The picture may have been taken a couple of days after the funeral photo in March alluded to upthread.
Se EM Smith comment in my original thread. http://wattsupwiththat.com/2009/04/26/ice-at-the-north-pole-in-1958-not-so-thick/#comment-122932
Oddly, NAVSOURCE now shows a caption of:

So what had been certain and unchallenged for years now all of the sudden is uncertain and may be in August 1958. Seems like a case of the tail wagging the dog.
Obviously there is a need to pin this date down, but I’m amused that so much attention has been brought to this photo since I first blogged on it.
BONUS: I’ve always said that the current drop in Arctic Ice Extent might have roots in soot from the industrialization of Asia causing an albedo change which really took off in the 1990’s, would show up in the summer melt season when solar irradiance is at a peak in the Arctic. Now it seems NOAA is taking Arctic soot seriously:
From the video description:
Small, new, remotely-operated, unmanned aircraft are being flown in the Arctic to measure black soot. The soot is produced by burning diesel fuel, agricultural fires, forest fires, and wood-burning stoves. It is transported by winds to the Arctic, where it darkens the surface of snow and ice, enhancing melting and solar warming. See http://saga.pmel.noaa.gov/ and http://www.pmel.noaa.gov/edd/manta.html
As always, check the latest sea ice conditions on the WUWT Sea Ice Reference page.
UPDATE: Robert Grumbine disputes some the the points related to the IPCC1 report and sea ice with EMMR equipped satellites here. – Anthony
August 1958, not 1959
REPLY: Yup. typo fixed, thanks – Anthony
Surely someone in the US Navy reads this blog?
It also seems that from about 1980-1990 the “old” data swings about the zero anomaly point. Eyeballing the present data from 1980-1990 the average is about +0.5 million sq kM. Were we remaking history back in 1990 at the IPCC to increase the past?
So it was up there in August 1958 and March 1959 and both times the water was basically Ice free.
LOL
As for Hiding the Incline prior to 1979, that is standard practice isn’t it.
Hide any data that would be inconvenient to have to explain.
I have been reading WUWT for a few years now and I have been perplexed about the Sea Ice average. Why is it averaged from 1979-2000? Why is it not 1979-2009, since 30 years is the “holy grail” of time periods for climate?
There is a book about the Skate’s voyage called “Surface at the Pole”. This is from one of the reviews on Amazon:
“Captain James F. Calvert describes tactics developed for operating in the Arctic Ocean during the summer. … the USS Skate was able to surface in a polynaya …. (the summer ice was to thin and weak for a plane to land on).
Polyanyas do not exist near the pole in winter so new tactics were required for a winter operation. Taking their clue from beluga whales, the sub was modified and tactics for winter arctic operations were developed during the 2nd cruise discussed. During this trip the USS Skate became the 1st ship to surface at the North Pole by breaking through the relatively thin ice that occurs when ice flows crack forming “leads”. In the winter these leads immediately start to re-freeze but the ice remains thin enough for a sub (modified for this task) to break through for over a week.”
Source: http://www.amazon.com/review/R3ICNLJ0XTXEQZ/ref=cm_cr_pr_perm?ie=UTF8&ASIN=0548388628&nodeID=&tag=&linkCode=
One interesting trend I notice with sea ice was that the years with high sea ice minimums tended to translate to cold and snowy US winters. This year and 2007 were the two lowest summer sea ice extents, and those winters that followed were relatively warmer. The two years with high summer sea ice extents, like 2009 and 2010 produced following winters that were cold and snowy, of course we remember the 09-10 winter being quoted as “snowmaggedon”. This year is currently running above all of these years and if we do get a high summer sea ice minimum, I would look towards a cold and snowy winter overall in the US. Maybe, these trends I’m seeing are coincidence or are they not?
Also from http://www.navalhistory.org/2011/08/11/uss-skate-ssn-578-becomes-the-first-submarine-to-surface-at-the-north-pole/
Graham P Davis says: (October 30th, 2011)
“USS Skate did indeed surface at the North Pole but not until 17 March 1959. Ice conditions in August 1958 were too heavy at the Pole for the Skate to surface, as they were for the Nautilus some days earlier. The Skate did surface in several other leads and polynya that August, including one near Ice-station Alfa. The above picture may have been from one of those.
When the Skate sailed for the Arctic the following year, the sail had been strengthened to allow it to break through thin ice. At the Pole, they eventually found a small, refrozen lead, or skylight, and managed to break through it. Later, many of the crew gathered for a service at which the ashes of Sir Hubert Wilkins were sprinkled in the wind. The temperature during this service was -26F (-32C).”
Anthony:
The following is found at Navsource.org regarding USS Skate (SSN 578). The warmists forgot to look farther down at the photo of Vice Admiral Calvert the following is the caption with his photo note that it says that Skate surfaced at the North Pole in February 1959. I included the entire biography for completeness.
“Vice Admiral James F. Calvert played a key role in developing nuclear submarine Arctic tactics during his tour as commanding officer of the Skate (SSN-578) from December 1957 to September 1959. Skate surfaced at the North Pole in February 1959. During this tour, Calvert also helped define the operational capabilities of the Navy’s first series-production class of nuclear submarine.
Originally from Cleveland, Ohio, Calvert graduated from the U.S. Naval Academy in June 1942 and from Submarine School in September of that year. He was awarded the Silver Star and the Bronze Star while serving aboard the submarine Jack (SS-259) during World War II.
He also served as executive officer aboard the Haddo (SS-255) in 1945. Following the war, he served as executive officer aboard the Charr (SS-328) and Harder (SS-568) and as commanding officer of the Trigger (SS-564).
Calvert served as Superintendent of the U.S. Naval Academy from 1968 to 1972.”
David O. Smith
Rogers, AR
I went to the Skate SSN 578 page in Wiki and rated it, lacks reputable sources. I suggest everyone do this. The rating input is at the bottom of the page.
http://www.navsource.org/archives/08/0857809.jpg
Maybe this confirms the original date?
Caption reads “Commemorative postal cover issued on the occasion of the Skate (SSN-578), as the first Submarine to surface at the North Pole, 17 March 1959.”
The ‘old’ John Daly site still exist:-. http://www.john-daly.com/ The following is based on a report on arctic ice dated 2nd Feb 2001. http://www.john-daly.com/polar/arctic.htm He gives the date for the surfacing of the Skate at the North Pole as ‘late March’ 1959, adding that it was a first to the North Pole. On the same voyage the Skate surfaced at 10 other locations finding open water or very thin ice. He also mentions that the Skate undertook a similar cruise in August 1958, but (since the surfacing at the North pole in March 1959 was a first) presumably NOT at the North Pole.
Verity Jones says:
March 18, 2012 at 10:15 am
“Also from http://www.navalhistory.org/2011/08/11/uss-skate-ssn-578-becomes-the-first-submarine-to-surface-at-the-north-pole/
Graham P Davis says: (October 30th, 2011)”
Thanks, Verity. Now, instead of citing this very plausible account, somebody has decided that it’s much better to simply falsify the historical record. CAGW science communication at its best…
There is a short piece on the voyage of the Skate at this eBay site. The picture shows the sub with fairly thin ice sheets draped over it. There is no date on it but it looks like Verity Jones’ ice lead breakout site.
http://www.ebay.com/itm/Submarine-USS-Skate-SSN-578-1959-Arctic-Voyage-/200678722636
Bernie
Brian Johnson Uk – Great find!
And… the Wiki article on the Skate itself goes into great detail: http://en.wikipedia.org/wiki/USS_Skate_%28SSN-578%29
Skate surfaced through ice: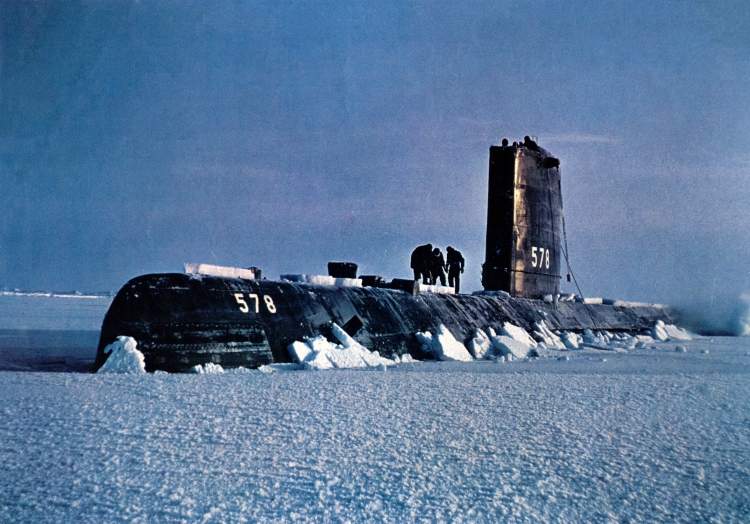
Incorporating the 1974-1978 data would significantly change the running norm. Say 1974-2000.
And i agree that there seems to be no predictive value in winter ice growth versus summer recession.It would be interesting to graph sea surface temperatures versus ice extent (individual years, not normed), to see if that lends some information as to the probability that soot is an important factor in summer melt.
The top picture here http://americanhistory.si.edu/subs/work/exploring/exploration/index.html is cited as the North Pole surfacing of the Skate. As you can see the sub has ice draped over it.
Quote
“On March 17, she surfaced at the North Pole to commit the ashes of the famed explorer Sir Hubert Wilkins to the Arctic waste. When the submarine returned to port, she was awarded a bronze star in lieu of a second Navy Unit Commendation for demonstrating ” … for the first time the ability of submarines to operate in and under the Arctic ice in the dead of winter … .”
From here:
http://www.submarinesonstamps.co.il/History.aspx?h=215
“why has this data been removed from common use today if it was good enough for the IPCC to use in 1990?”
It’s just another example of team CAGW Zohnerism. Noticing these convenient start and end dates and comparisons is what lead me to become a skeptic. Back then (1994) there was no WUWT. How did I ever get by without WUWT? How has a movement that is contingent upon consideration of only a particular subset of available data to make any sense at all lasted so long? It’s like we’ve lost the ability to critically analyze a presentation (sales pitch) to any degree at all.
A quick search in newspaper archive.
I found a United Press report from March 7, 1958 reporting the completion of a crossing of the Arctic by the Skate “almost entirely underwater”.
I also found a news report on August 13, 1958 reporting the completion of a second crossing of the Arctic by the Skate, the crossing by the Nautilus in the opposite direction having been reported a few days earlier. This report says that the Skate surfaced 40 miles from the North Pole to report its position.
Isn’t this correction in the post also needed : August, 1959 to August, 1958?
“Turns out it was, but then he stumbled on something he didn’t expect to find. The date for the surfacing has been changed from March 17th, 1959 to August, 1959 (with no day given) in Wikipedia and in NAVSOURCE. He at first thought I’d made a mistake in citation, but it turns out dates have been changed since I wrote my original article on the USS Skate on April 26th, 2009.”
REPLY: Yep, too early, not enough coffee, kids needing breakfast all conspired to make this post be written in segments of attention. Thanks for catching that, will fix – Anthony
Here’s a link to the photp provided by Alan Cheetham in an earlier WUWT thread.
http://www.appinsys.com/GlobalWarming/RS_Arctic.htm
I have the photo on my PC with the filename “uss-skate-open-water march 1959.jpg”
Anthony, you can combine the IPCC FAR WG1 Figure (a) and UUIC Cryosphere Today Arctic extent anomaly graph, but keep in mind that they both have different baselines.
““USS Skate did indeed surface at the North Pole but not until 17 March 1959. (…) At the Pole, they eventually found a small, refrozen lead, or skylight, and managed to break through it. Later, many of the crew gathered for a service at which the ashes of Sir Hubert Wilkins were sprinkled in the wind.”
An image of the ceremony can be found here. Maybe show it in an update or in the next Arctic sea ice blog post?
REPLY: Well aware of that photo, but I’m interested in nailing down the date on the one in question, not substituting another you would prefer – Anthony
Scrubbing the internet is on ongoing issue. Always save a screen shot of something found that may be historically important in your view. Having written many aeronautic safety papers, I always kept the screen shot as well as the web site address. It is amazing how may of the sites are no longer up or the article is gone missing from the site. Not all of this is devious behavior, but a function of server space or just cleaning what does not receive hits. On the other hand, some of the scrubbing is for political control. It is important as Anthony points to in this post to reveal such things around subjects that are being used to persistently drive some creepy dude agenda.
Here’s to holding their feet to the fire. Prost!