In our previous post, we highlighted the BoM weather station on Willis Island, and wondered what would happen to it and to the staff who worked there.
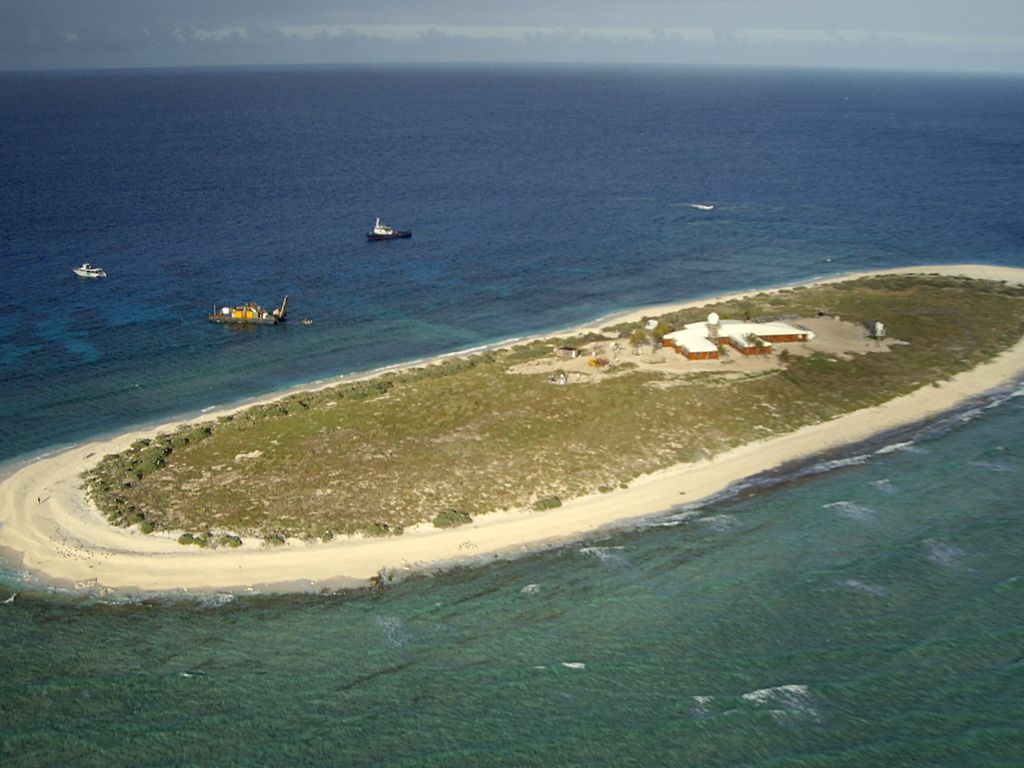
Fortunately the staff has been evacuated prior to Yasi hitting the island. They apparently left everything running on automatic, including the radar. The data from the weather station tells the story of the approach and the hit.
Temperature and dewpoint converge as the air and the sea become one.
 The humidity pegs the meter.
 Rainfall soared.
 Barometric pressure dropped like a rock.
 And the wind peaked, the equipment failed, and the station went silent.
 The last radar image from the Willis Island BoM radar showed a massive eye.

You can watch the story the data tells at other weather stations in Queensland, just click on the map below to use the interactive BoM website.

BOM) recorded wind speeds of 185km/h on Willis Island before Cyclone Yasi took out the weather station on the island.
http://news.ninemsn.com.au/national/yasi/8205472/cyclone-smashes-weather-station
Wow that is awesome information Anthony. Thankyou
We’ve been closely monitoring this cyclone. My son, Matt, who is working /backpacking through Australia is staying in Tully, which is about 50 Km south of Innisfail and 16 km in-land.
Tully appears to be dead center in the projected path of this monster.
Matt is holed up in a bar called “Rafter Pub” with about 120 others. They have sandbagged the building and boarded up all the windows, as well as moved all the mattresses into the pub from the hostel rooms.
Judging from the wind and pressure data above, they have a very rough night ahead of them.
Thanks for that fantastic series of plots Anthony! Says it all.
I’m looking how T barely moved but DP merged. From a meteorological point of view have you ever seen that captured on tape before? That just might occur as tornadoes initially form too.
I certainly don’t wish to downplay the severity of this storm nor the impact is will have on our Queenslanders. From the radar image it appears that rainfall is only moderate rather than extreme. Rainfall on Willis Island was 60mm prior to the drop out, not huge for such a big storm. I wonder whether the cyclone is being overplayed to ensure that people don’t take risks and that damage is prepared for. Seems that the wind will be the problem rather than the rain.
Thanks for the great post Anthony, it really gives one an idea of the power of nature! Say just because we don’t post doesn’t mean that the silent majority isn’t watching. Keep up the good work!
Fascinating! Thank you for pulling all of this together.
~Chris
The linked clickable map is for the graphs.
http://www.bom.gov.au/qld/qld-observations-map.shtml
That clickable map is for the observations – more stations are presented, particularly reef-based stations.
Cheers
Very interesting data there. That pressure drop is stunning. That really tells the story of the power associated with a storm like that.
I grew up in Tornado Alley and have experience with that, but this is an entirely different beast.
Greatly appreciated, Anthony. Instantaneous scientific observation is amazing and it’s obvious that natural variability is behind this nasty weather.
Note that the wind direction shifted 180 degrees a couple of hours before the anemometer failed. Suggests that it already was damaged – probably lost it’s wind vane… It may be that the readings are suspect from about 6am.
“Lawrie Ayres says:
February 1, 2011 at 10:10 pm”
I agree with your sentiments however, the Australian media are stroking this one for all they can. Tracy, 1974, 50km wide (NT). Larry, 2006, 100km wide (Qld). Yasi, 2011, expected to be 500km wide (Qld).
The data suggests it may have survived the wind only to be overcome by the storm surge.
Here’s a history of Australia’s deadliest & most destructive cyclones
http://www.reuters.com/article/2011/02/02/us-australia-cyclone-history-idUSTRE71113C20110202
Hey Patrick – funny thing is the international media seem to be ignoring it
“twawki says:
February 1, 2011 at 11:03 pm”
I think, possibly, the MSM in other countries are watching what went on in Tunisia recently, what is going on now in Egypt and what appears to be spreading to Morocco, Jordan and Yemen with more concern.
But at least people and authorities seem to be proactive with this storm. We’ll know for sure in about 6 hours.
I read a story on the Willis Island station once. It described the “cabin fever” the staff suffer there. Exacerbated by the fact that their drinking water (rainwater from the roof) all tastes of guano. Yuck!
It has been graded up to a category 5 cyclone, winds exceeding 300km/h. The radius estimate is 400kms. Barometric pressure is 942. There was a bigger one over a hundred years ago where the barometric pressure fell to 914. It sent surges over 40 feet high and over half a kilometre inland.
Of course the green dingbats are howling to gaia that this is all about climate change and it justifies a multibillion dollar carbon tax. A stacked committee with the terms of reference to produce a tax is in action. Skeptics were banned from the committee. Our fool of a Fabian Prime Minister is already urging part time workers and the disabled to work harder because she knows the carbon tax will destroy our economy.
Even the simplest school child knows this is about the La Nina pattern.
Jeff C says:
February 1, 2011 at 9:58 pm
Judging by the fact they’re in a pub, have moved the mattresses to where the alcohol is (no doubt to protect the bottles) they’ll have one ‘ellova night.
Some will probably not even remember the cyclone by the time they wake up. lol
But seriously, good luck to your son and the people with him.
Yep I agree wind speeds at many locations eg Flinders Reef are nothing like predicted. Maybe the core is small and intense with stronger winds?
Awsome, Thanks.
The more I look at TC Yasi, the more I think it’s gunna be a bit of a fizzer. As big as it looks on the radar images, I don’t think it’s as severe as it’s made out to be. Lets hope so.
Cyclone Yasi is obviously caused by global warming just like the record breaking storm surge of 1899.
/sarc
————–
————–
@Jeff C:
This map: http://chiefio.files.wordpress.com/2011/02/idq65001.gif
that I picked up from the A.BOM looks like a direct hit on the pub is likely. May that “inland” bit be enough for a significant weaking of the winds….
There’s a link to the BOM site where I picked up that map in this posting:
http://chiefio.wordpress.com/2011/02/02/austrailia-braces/
where you can get a more recent version as time passes.
Best of luck to you and yours…
“Baa Humbug says:
February 1, 2011 at 11:30 pm”
Priorities priorities.