UAH v6.1 Global Temperature Update for September, 2026: +0.61 deg. C

From Dr. Roy Spencer’s Global Warming Blog

Dr. Roy Spencer,

The Version 6.1 global average lower tropospheric temperature (LT) anomaly for September, 2026 was +0.61 deg. C departure from the 1991-2020 mean, down from the August, 2026 value of +0.68 deg. C.

The Version 6.1 global area-averaged linear temperature trend (January 1979 through September 2026) remains at +0.16 deg/ C/decade (+0.22 C/decade over land, +0.13 C/decade over oceans).

The following table lists various regional Version 6.1 LT departures from the 30-year (1991-2020) average for the last 33 months (record highs are in red).

YearMonGlobeNHemSHemTropicUS48ArcticAust.Can.
2024Jan+0.80+1.02+0.57+1.20-0.19+0.40+1.12+0.97
2024Feb+0.88+0.94+0.81+1.16+1.31+0.85+1.16+2.45
2024Mar+0.88+0.96+0.80+1.25+0.22+1.05+1.34+1.12
2024Apr+0.94+1.12+0.76+1.15+0.86+0.88+0.54+1.39
2024May+0.77+0.77+0.78+1.20+0.04+0.20+0.52+0.67
2024June+0.69+0.78+0.60+0.85+1.36+0.63+0.91+0.19
2024July+0.73+0.86+0.61+0.96+0.44+0.56-0.07+1.15
2024Aug+0.75+0.81+0.69+0.74+0.40+0.88+1.75+1.36
2024Sep+0.81+1.04+0.58+0.82+1.31+1.48+0.98
2024Oct+0.75+0.89+0.60+0.63+1.89+0.81+1.09+0.89
2024Nov+0.64+0.87+0.40+0.53+1.11+0.79+1.00+1.61
2024Dec+0.61+0.75+0.47+0.52+1.41+1.12+1.54+1.65
2025Jan+0.45+0.70+0.21+0.24-1.07+0.74+0.48+1.04
2025Feb+0.50+0.55+0.45+0.26+1.03+2.10+0.87-0.35
2025Mar+0.57+0.73+0.41+0.40+1.24+1.23+1.20+0.80
2025Apr+0.61+0.76+0.46+0.36+0.81+0.85+1.21+0.45
2025May+0.50+0.45+0.55+0.30+0.15+0.75+0.98+0.81
2025June+0.48+0.48+0.47+0.30+0.80+0.05+0.39-0.22
2025July+0.36+0.49+0.23+0.45+0.32+0.40+0.53-0.23
2025Aug+0.39+0.39+0.39+0.16-0.06+0.82+0.11+0.62
2025Sep+0.53+0.56+0.49+0.35+0.38+0.77+0.30+2.44
2025Oct+0.53+0.52+0.55+0.24+1.12+1.42+1.67+2.59
2025Nov+0.43+0.59+0.27+0.24+1.32+0.78+0.36+1.47
2025Dec+0.30+0.45+0.15+0.19+2.10+0.32+0.37-1.86
2026Jan+0.35+0.51+0.19+0.09+0.30+1.40+0.95+1.17
2026Feb+0.39+0.54+0.23+0.03+1.91-0.48+0.73+0.32
2026Mar+0.38+0.33+0.42+0.07+3.74-0.48+1.14-3.17
2026Apr+0.39+0.43+0.34+0.23+1.20+0.30+0.70-0.89
2026May+0.53+0.46+0.60+0.58+0.21+0.34+0.10+0.21
2026June+0.46+0.54+0.38+0.57+0.64+1.01+0.38+0.99
2026July+0.48+0.68+0.27+0.85+1.14+0.53-0.22+0.78
2026Aug+0.68+0.76+0.59+0.90+0.60+0.80+0.39+0.71
2026Sep+0.61+0.78+0.44+0.89+1.32+0.80+1.13+0.99
YearMonGlobeNHemSHemTropicUS48ArcticAust.Can.

Time Series Plots for Tropics, USA48, Canada, and Australia

The full UAH Global Temperature Report, along with the LT global gridpoint anomaly map for September, 2026 and a more detailed analysis by John Christy, should be available within the next several days here.

The monthly anomalies for various regions for the four deep layers we monitor from satellites will be available in the next several days at the following locations:

Lower Troposphere

Mid-Troposphere

Tropopause

Lower Stratosphere

The climate data they don't want you to find — free, to your inbox.
Join readers who get 5–8 new articles daily — no algorithms, no shadow bans.
5 7 votes
Article Rating
Subscribe
Notify of
139 Comments
October 3, 2026 2:44 pm

Third warmest September in the UAH history

2024 0.81
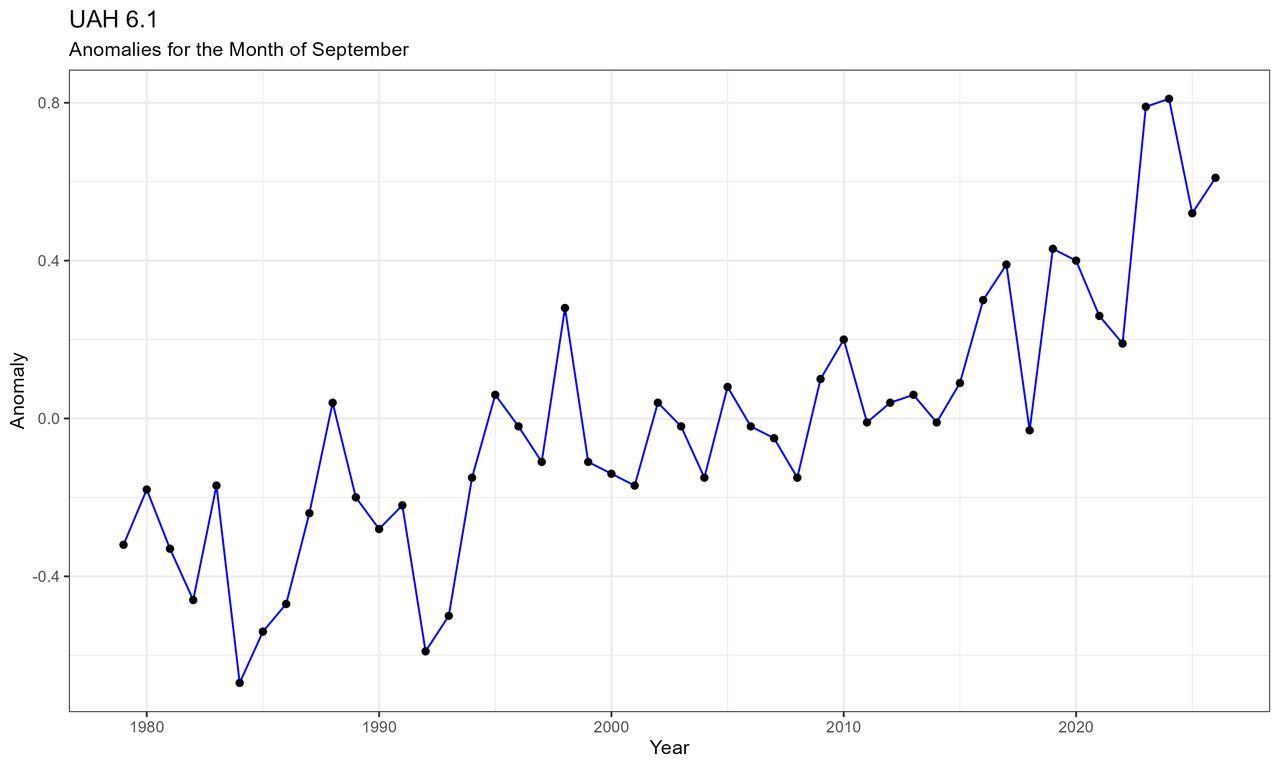
2023 0.79
2026 0.61
2025 0.52
2019 0.43
2020 0.40
2017 0.39
2016 0.30
1998 0.28
2021 0.26
comment image

(Disclaimer:

Presenting this data from UAH in no way implies a belief it is accurate, endorses the lack of uncertainty intervals, or that the number of decimal places is appropriate. Data only goes back to 1979 so there may have been hotter Septembers in the past 4.5 billion years.)

Reply to  Bellman
October 3, 2026 3:06 pm

Here’s my unofficial global map for September.

comment image

Reply to  Bellman
October 3, 2026 3:12 pm

Warmest countries, by my reckoning, were all in Europe.

1 Switzerland 2.79
2 France 2.73
3 Luxembourg 2.59
4 Spain 2.53
5 Portugal 2.48
6 Belgium 2.09
7 Italy 1.94
8 Austria 1.94
9 Slovenia 1.89
10 Germany 1.88

The following countries all had their warmest Septembers (since at least 1979)

Benin, Brunei, Burkina Faso, Cameroon, Central African Rep., Chad, Colombia, Congo, Côte d’Ivoire, Dem. Rep. Congo, Ecuador, El Salvador, Eq. Guinea, Eritrea, Ethiopia, France, Gabon, Gambia, Ghana, Guinea-Bissau, Guyana, Indonesia, Liberia, Nigeria, Panama, Papua New Guinea, Portugal, Rwanda, S. Sudan, Senegal, Sierra Leone, Spain, Sudan, Suriname, Togo, Uganda, United States of America

Reply to  Bellman
October 3, 2026 3:17 pm

The coldest countries were

1 Falkland Is. -1.36
2 Uruguay -1.03
3 Greenland -0.97
4 Antarctica -0.74
5 Iceland -0.30
6 Madagascar -0.29
7 Fr. S. Antarctic Lands -0.16
8 Cyprus -0.11
9 eSwatini -0.09
10 Algeria -0.08

Reply to  Bellman
October 3, 2026 4:46 pm

More of the same stupid monthly regurgitation over a single global number.

Yawnnnnnnn…… Zzzzzzz….

Reply to  Sunsettommy
October 3, 2026 5:42 pm

So you’re saying Dr. Spencer is stupidly regurgitating.

When did WUWT become so anti–Dr. Spencer?

Reply to  Eldrosion
October 3, 2026 7:04 pm

No it is YOU, Bellman, and a couple others who post the same drivel in temperature thread after temperature thread after temperature thread over a single number.

Reply to  Sunsettommy
October 3, 2026 7:44 pm

Reality is difficult for you, huh?

leefor
Reply to  Eldrosion
October 3, 2026 8:29 pm

Ah reality. The South-west of Western Australia was and is still cold. Not warmer as bellman’s unofficial graph shows. And certainly not by 2C. 😉

Reply to  leefor
October 3, 2026 9:05 pm

The enhancing greenhouse effect is warming the globe but regional climate variations also impact temperature trends.

leefor
Reply to  Eldrosion
October 3, 2026 11:12 pm

If it is regional it can’t by definition be global. 😉

Reply to  leefor
October 3, 2026 11:29 pm

Yes, regional climate variations are not global.

Reply to  Eldrosion
October 4, 2026 12:44 am

Now you show what an ass you are as I don’t dispute that there is a warming trend but clods like YOU overlook that for the first 180 years or so of warming from year 1700 to 1880’s there was no corresponding CO2 increase.

That is the reality you ignore.

Reply to  Sunsettommy
October 4, 2026 1:12 am

“Now you show what an ass you are as I don’t dispute that there is a warming trend “

Then what, exactly, is wrong with merely presenting the same data as Dr. Spencer alongside other relevant analyses?

“clods like YOU overlook that for the first 180 years or so of warming from year 1700 to 1880’s there was no corresponding CO2 increase.”

Why are we supposedly “overlooking” the climatic behavior during the period 1700–1880? We are merely commenting on a blog post discussing satellite data spanning from 1979 to the present.

The fact that you attribute these things when we have said nothing of the sort speaks volumes.

Reply to  Eldrosion
October 4, 2026 6:05 am

Why are we supposedly “overlooking” the climatic behavior

Because you not dealing with “CLIMATE”! You are dealing with temperatures, an intensive property that does not average properly.

The issue is actually HEAT ENERGY distribution. Heat energy is made up of two components, the sum of Q_sensible and Q_latent plus Work. If you want to know what is actually occurring, you need to convert temperature to enthalpy which is total heat.

Dealing with temperature is only part of the equation of what is occurring in the earth’s atmosphere. Basically, you are ignoring water vapor which is, by far, the largest component.

Reply to  Jim Gorman
October 4, 2026 9:45 am

Would you accept that a warmer atmosphere holds more water vapor, or have you further arm-waving comments about that?

Reply to  Sunsettommy
October 3, 2026 10:28 pm

Reading comp. is still an issue for Elrosian.

Art Slartibartfast
Reply to  Eldrosion
October 4, 2026 3:29 am

The trouble, Eldrosion, is not the person of Dr. Spencer, who has done some excellent climate work. The problem is that temperature is an intensive property, i.e. a property that is independent of mass or volume. Although you can average those numbers, that average has zero physical meaning.

You might as well take the average color (an intensive property) of each the frame in a movie, average that outcome across all frames, and conclude from the result that one movie is better than another.

bdgwx
Reply to  Art Slartibartfast
October 4, 2026 7:30 am

The problem is that temperature is an intensive property, i.e. a property that is independent of mass or volume. Although you can average those numbers, that average has zero physical meaning.

Pressure, density, relative humidity, etc. are intensive properties too. All of them are averaged ubiquitously and yet have enough physical meaning that governments, businesses, and individuals use those averages (perhaps unknowingly in many cases) to plan their activities around the physical environment and phenomena around them even to the extent of making life or death decisions in some cases. I’m curious…what’s your definition of “physical meaning”?

Art Slartibartfast
Reply to  bdgwx
October 4, 2026 10:06 am

“Pressure, density, relative humidity, etc. are intensive properties too.” correct. The whole climate narrative hinges hinges on the effect that rising temperatures have on all kinds of processes on earth. Temperature alone does not describe that effect. Air pressure and humidity are factors as well. What you would want to calculate is the enthalpy (dependent on temperature, humidity and air pressure) and average that. But nobody does that. 40 °C in the dry desert has a very different effect from 40 °C in a tropical rain forest. Temperature alone does not determine the effect.

What is worse, plain averaging is wrong. If I have a volume of dry air at 1000 millibar of 20 °C and I let that mix with the same volume of dry air at 0 °C, the resulting temperature is less than 10 °C, it is approximately 9.65 °C. Why? Mostly because air at 0 °C has 7% more mass than air at 20 °C. This is a fair comparison, because what thermometers measure is thought to be representative for a volume of air around them. In an era where average temperature is presented accurate to two decimals, this kind of difference is significant. Plain averaging of temperatures is fundamentally flawed.

Another reason why I oppose averaging temperatures is that it destroys information An acceptable looking average can hide that opposing extremes are cancelling each other out. According to one classification we have thirty types of climate on this Earth. It seems ridiculous to me that the health of all these climate types can be reduced to a single number by taking averages of averages of temperature, because that is what “climate scientists” do.

bdgwx
Reply to  Art Slartibartfast
October 4, 2026 3:15 pm

What you would want to calculate is the enthalpy (dependent on temperature, humidity and air pressure) and average that. But nobody does that.

[Song et al. 2022]

[Schuckmann et al. 2023]

What is worse, plain averaging is wrong. If I have a volume of dry air at 1000 millibar of 20 °C and I let that mix with the same volume of dry air at 0 °C, the resulting temperature is less than 10 °C, it is approximately 9.65 °C. Why? Mostly because air at 0 °C has 7% more mass than air at 20 °C.

That doesn’t mean averaging is always wrong. Just because an average can be abused doesn’t mean that averaging is always abusive.

Plain averaging of temperatures is fundamentally flawed.

And yet temperatures are averaged ubiquitously and people (probably even you) make decisions based on these averages up to and including those involving life and death on a daily basis.

BTW…look at the latest METAR report from your nearest airport. The temperature is actually an average. You just might not have realized it.

Another reason why I oppose averaging temperatures is that it destroys information

That’s ridiculously absurd. Averaging absolutely does NOT destroy information. All averaging does is compute Σ[X_i, i:{1 to N}] / N. The individual X_i values do not magically disappear after doing the computation.

Reply to  bdgwx
October 4, 2026 5:03 pm

That’s ridiculously absurd. Averaging absolutely does NOT destroy information. All averaging does is compute Σ[X_i, i:{1 to N}] / N. The individual X_i values do not magically disappear after doing the computation.

Yes they do disappear because they are NEVER reported or retained after the multiple averaging steps necessary to come up with one of these useless “anomalies”.

Reply to  Art Slartibartfast
October 4, 2026 8:25 pm

Even worse, how many of those existing climate zones defined by the climate types have been lost to CLIMATE change?

The US central plain is still a savannah, and the high plains are still semi-arid deserts. The savannahs of central Africa are still there but are shrinking because of FOREST EXPANSION! England still has its climate classification of temperate oceanic.

If the climate zones don’t change is there actually any CLIMATE change?

Reply to  bdgwx
October 4, 2026 5:21 pm

“All of them are averaged ubiquitously”

No, they aren’t. Extensive values calculated from the intensive properties are averaged.

You can’t average the pressure of a piston in a floor jack with the pressure againt the piston in an air compressor and come up with any kind of useful, physical value.

But you *can* convert those pressures to force and use the force to find the thermal properties induced by them on the pistons and average those. And then find an average value of heat added by the work done in each. Complicated comparison but doable – WITH EXTENSIVE VALUES.

Physical meaning – that the system is dependent on its size. The mass of Rock1 is M1 and the mass of rock two is M2. Hold them in your hand an you have M1 + M2. Replace them with a third rock of mass (M1 + M2) and you won’t be able to tell the difference. What you have is dependent on the size of the system. The average mass is (M1 + M2)/2. If I put two different rocks, M3 and M4 in your hand, each with a mass of (M1+M2)/2, you will have the same mass in your hand as with M1 and M2.

The temperature of Rock1 is R1 and the temperature of Rock2 is R2. Hold them both in your hand and what do you have? Is it R1 + R2. Can I replace those two rocks with a rock whose temperature is (R1 + R2) and get the same PHYSICAL reaction from the skin in your hand? What you have is *NOT* dependent on the size of the system. If I replace Rock1 and Rock2 with Rock3 and Rock4, each at a temperature of (R1+R2)/2 what will you have in your hand? What will happen to your hand?

Think electric field strength. The electric field strength is defined as E = F/q. E will have a definite value regardless of how much test charge you use to measure it. Doubling the test charge doubles the force and F/q stays the same.

Conceptually this all boils down to the intensive properties being a FIELD. Be it temperature or pressure, etc. The field value at any point is a function of the driving generators involved in the generation of the field. You can double the generators and create a stronger field but there isn’t any way double the field at all points because of the interference patterns of the two generators. The key is that you aren’t just adding two fields together, you are actually changing the system.

It’s like adding 2 gallons of water at 20C to 2 gallons of water at 20C. You get 4 gallons of water at 20C. The volume doubled but the temperature didn’t! The intensive value of temperature didn’t add. It didn’t double. So how do you average the temperature? The average of each of the two containers is 1gallon/10C. Now you have 4 gallons. Is the temperature 40C? Or 20C? If instead of buckets of water what if they are volumes of air at two different locations. One cubic meter of air has a temperature of 10C/m^3, i.e. 10C/m^3. The other has the same. Now you put them together and what do you get? 1 m^3 at 20C? 1m^3 at 10C?

Take a mass of 2kg and glue it to a second mass of 2kg. you wind up with a larger system of mass 4kg. The system got larger and so did the extensive value.

It *is* all based on physical reality. If you sample the temperature field on top of Pikes’ Peak and the temperature field at the zoo in Colorado Springs can you average them and find the temperature midway between the two locations? Or is the temperature at that midpoint totally independent of the temperature field value at that point?

The global temperature field is a 4D field varying in time and space driven by a multiplicity of input drivers that are all inter-related and are also all time and space varying. That field is *NEVER* stable. Trying to define it based on a sparse sampling methodology where the samples are measured differently at different times in order to produce a single state value that totally describes the entirety of the field is, if not impossible, highly unlikely to have any real physical meaning.

It may be soothing to a statistician’s soul to exercise their blackboard by averaging that sparse sampling of the intensive temperature field to create a single value but it’s just mathematical masturbation at its finest.

it’s why even LOCAL weather models, based on much more extensive sampling, has a hard time following the local temperature field for more than a few days.

Reply to  Bellman
October 3, 2026 4:29 pm

Most of these are smaller than a single UAH grid cell — stooopid map.

Reply to  karlomonte
October 3, 2026 5:25 pm

Yes, I wouldn’t read too much into the country estimates, especially for small countries, and especially where the country has a lot of coastline.

It’s also very much a work in progress, and there may be some issues with my masking for smaller countries.

Reply to  Bellman
October 3, 2026 9:53 pm

Yes, I wouldn’t read too much into the country estimates, especially for small countries, and especially where the country has a lot of coastline.

It’s also very much a work in progress, and there may be some issues with my masking for smaller countries.

More typical equivocation — why not plot them against tea prices also?

You have zero appreciation for how these satellite data are obtained and the implications thereof.

Only this utterly useless trendology matters to you.

Reply to  karlomonte
October 3, 2026 10:40 pm

I think he does have appreciation. He explicitly said:

“Presenting this data from UAH in no way implies a belief it is accurate, endorses the lack of uncertainty intervals, or that the number of decimal places is appropriate. Data only goes back to 1979 so there may have been hotter Septembers in the past 4.5 billion years.”

Reply to  karlomonte
October 4, 2026 4:50 am

“More typical equivocation — why not plot them against tea prices also?”

I’m not sure what your problem is. Or where you think the equivocation is.

The UAH data is always presented with anomalies for the US and Australia, and now Canada. I wondered what the anomalies would be for other countries, and thought it would be an interesting exercise to figure out how to derive them from the published data. These are my efforts so far.

I’m under no illusion about the issues of using satellite data for this, but it is the only data regularly published on this site, so it’s where I’m starting out.

Reply to  Bellman
October 4, 2026 6:03 am

is the only data regularly published on this site, so it’s where I’m starting out.

To accomplish what? Some ulterior motive?

The Deadly Sin of Reification is not your friend.

Reply to  karlomonte
October 4, 2026 6:29 am

There is no point to it beyond what it is. No dark conspiracy. It’s just a bit of fun. I like figuring out how to do do things, and was rather pleased at how this project shaped up I’ve never once suggested it will tell you anything meaningful about global warming.

Nor have I suggested that the temperatures derived using satellite data wil reflect actual ground temperatures.

Reply to  Bellman
October 3, 2026 5:26 pm

When I said warmest and coldest countries in the list – I should have said highest and lowest anomalies.

leefor
Reply to  Bellman
October 3, 2026 11:14 pm

Based on Average temperature or mean temperature?

Reply to  Bellman
October 4, 2026 6:11 am

When I said warmest and coldest countries in the list – I should have said highest and lowest anomalies.

Two questions,
What is the measurement uncertainty of the anomalies?
What is the actual heat energy at the locations?

I ask about heat energy because anomalies do not allow you to determine the actual heat energy at a location. You need to use absolute temperatures for that. Basically, colder temperatures have less heat energy that warmer temperatures. That is a far better metric for the distribution of “heat” across the globe.

Reply to  Jim Gorman
October 4, 2026 6:41 am

“What is the measurement uncertainty of the anomalies?”

You would have to ask Dr Spencer, it’s his data. But you will probably get the same response as I did – they don’t have enough resources to do an uncertainty analysis.

“What is the actual heat energy at the locations?”

Couldn’t tell you, and don’t care. ISH don’t provide that data and it’s not what I’m interested in.

If you want that information, why don’t you do your own analysis?

Reply to  Bellman
October 4, 2026 7:11 am

“What is the measurement uncertainty of the anomalies?”

You would have to ask Dr Spencer, it’s his data. But you will probably get the same response as I did – they don’t have enough resources to do an uncertainty analysis.

A total cop-out that propagates the bad data practices inherent in mainstream climastrology.

And the truth is, you could not care less about what the real measurement uncertainties are — .001, .1, 1, 10

Reply to  Bellman
October 4, 2026 7:17 am

Here’s the map using absolute temperatures.

20261004wuwt1
Reply to  Bellman
October 4, 2026 7:24 am

Here are the warmest countries this month (temperatures in K).

                Country Temperature
1  United Arab Emirates       278.1
2          Saudi Arabia       277.8
3                  Oman       277.5
4                 Yemen       277.3
5                 Qatar       277.2
6                Kuwait       277.1
7                 Sudan       276.9
8               Eritrea       276.8
9              Djibouti       276.5
10                Niger       276.4

and the coldest

                  Country Temperature
1              Antarctica       225.4
2               Greenland       245.2
3            Falkland Is.       250.8
4  Fr. S. Antarctic Lands       251.7
5                 Iceland       256.0
6                  Norway       257.9
7             New Zealand       257.9
8                  Russia       258.5
9                  Canada       259.2
10                Finland       259.2
Reply to  Bellman
October 4, 2026 9:22 am

“Yemen 277.3” K = 4.2°C

This is a useful number??

I don’t think so.

Reply to  karlomonte
October 4, 2026 9:42 am

That’s why anomalies are more useful.

Reply to  Bellman
October 4, 2026 11:25 am

Your brain has been anomalized.

Reply to  karlomonte
October 4, 2026 1:04 pm

Thank you.

Reply to  Bellman
October 3, 2026 4:35 pm

Since, as is quite obvious in the UAH GLAT graph as well as this UAH text statement:
“The Version 6.1 global area-averaged linear temperature trend (January 1979 through September 2026) remains at +0.16 deg/ C/decade (+0.22 C/decade over land, +0.13 C/decade over oceans)” ,
should anyone . . . anyone at all . . . be surprised or alarmed that more recent months tend to be warmer than older months.

IOW, when looking at a series of measurements for a time-based upward trend there is little value is saying this recent data point is the nth-most warmest.

ROTFL.

Reply to  ToldYouSo
October 3, 2026 5:44 pm

“IOW, when looking at a series of measurements for a time-based upward trend there is little value is saying this recent data point is the nth-most warmest.”

Maybe not. Clearly, not everyone knows there’s an upward trend. One commenter below claims there is secular global cooling.

Reply to  Eldrosion
October 4, 2026 6:14 am

Clearly, not everyone knows there’s an upward trend. One commenter below claims there is secular global cooling.

You speak of “warming and cooling”. You don’t know whether heat energy is actually changing by examining temperature anomalies. Actual thermodynamic heat has two components, sensible and latent. Until you can examine those you really don’t know if the earth’s atmosphere is warming or cooling.

Reply to  Jim Gorman
October 4, 2026 9:57 am

Until you can examine those you really don’t know if the earth’s atmosphere is warming or cooling.

Shall we tell the glaciers to stop melting until we confirm whether it’s getting warmer or not?

Reply to  TheFinalNail
October 4, 2026 11:10 am

And sea levels are rising as well.

Reply to  Eldrosion
October 4, 2026 8:16 pm

Sea levels have been rising and falling for hundreds of years. So what?

Is NYC *actually* flooded as predicted? How about Miami? How many islands have been lost to the sea rise? Any?

Reply to  TheFinalNail
October 4, 2026 8:13 pm

Glaciers have been melting for thousands of years. So what?

Reply to  ToldYouSo
October 3, 2026 6:12 pm

Of course it shouldn’t be a surprise that recent years have been warmer given global warming. It’s only a surprise to those who think it’s been cooling,

What is more surprising is how much the last few years have been above that trend.

Richard M
Reply to  Bellman
October 3, 2026 8:29 pm

It’s not a surprising when you understand real science.

Reply to  Richard M
October 3, 2026 9:11 pm

Real science? On Dr. Spencer’s blog, you expressed the PDO as an important candidate for explaining modern global warming. The problem is it has been in its negative phase recently:

https://www.ncei.noaa.gov/access/monitoring/pdo/

And since its negative phase commenced, global temperatures have only surged.

leefor
Reply to  Eldrosion
October 4, 2026 4:12 am

What is the timeline proposed or do they expect instantaneous variation?

Richard M
Reply to  Eldrosion
October 4, 2026 6:02 am

I stopped believing the PDO was the main driver of warming over a decade ago. It is part of the equation, but it’s not the main driver. Unlike climate alarmists, I can change my mind when the evidence demands it.

Reply to  Richard M
October 4, 2026 12:25 pm

Ok, I respect that.

Reply to  Eldrosion
October 4, 2026 6:20 am

And since its negative phase commenced, global temperatures have only surged.

But has the atmosphere warmed thermodynamically?

Reply to  Bellman
October 4, 2026 6:19 am

As I have stated elsewhere, what you are looking at is not a good metric for thermodynamic heating or cooling. I don’t disagree that temperature anomalies have been rising, however, that doesn’t tell much of a story. Example, if the Arctic is at -50°C, how much heat energy does that location actually have compared to a tropics location at 40°C?

That is the question you should be looking at if you want to proscribe heating or cooling.

Reply to  Jim Gorman
October 4, 2026 7:49 am

“As I have stated elsewhere, what you are looking at…”

The thing I’m looking at is exactly the same thing you claim proves CO2 does not cause warming.

“..a good metric for thermodynamic heating or cooling.”

You need to define exactly what you mean by thermodynamic heating or cooling. I’ve wasted far to much time going through your contradictory definitions. First the claim that everything was cooling all the time, and warming all the time. Then that it’s about the change in internal energy, whilst rejecting the term latent cooling. Then the claim that raising a stone up warms it by adding potential energy, whilst cutting a stone in half cools it.

If you mean is total internal energy rising all falling, I would think temperature is a reasonable proxy for that. The only issue is how much of a change there has been in latent energy.

“Example, if the Arctic is at -50°C, how much heat energy does that location actually have compared to a tropics location at 40°C?”

You are going to have to define the location for that. Are you including the entire ice shelf or just what UAH is estimating, the lower troposphere? Also, what do you mean by “heat energy”? Do you mean heat, or internal energy?

If this is of concern to you, maybe do the work yourself. I’m only interested in whether places are getting hotter or colder.

Reply to  Bellman
October 4, 2026 5:05 pm

If you mean is total internal energy rising all falling, I would think temperature is a reasonable proxy for that.

Do you ever bother to proofread the dreck you type into the reply box?

Reply to  karlomonte
October 4, 2026 5:45 pm

It really doesn’t matter. After a month-long tutoring on here about internal energy he still doesn’t understand the word “isothermal”, let alone its implications.

Reply to  Tim Gorman
October 4, 2026 6:09 pm

You are right: numbers is numbers and temperature is heat.

Reply to  Bellman
October 4, 2026 5:43 pm

“If you mean is total internal energy rising all falling, I would think temperature is a reasonable proxy for that. “

You’ve been shown mathematically why this isn’t the case MULTIPLE TIMES. And yet you can’t repeat that math to save your soul. It just goes in one ear and out the other.

  1. The total internal energy of a system cannot practically be measured.

Internal energy can be temperature, entropy, volume, pressure, etc. A change in internal energy does *NOT* have to cause a temperature change. That is what the word “isothermal” means.

Go to your blackboard and write the word ISOTHERMAL 1000 times.

Reply to  Bellman
October 3, 2026 10:26 pm

Presenting this data from UAH in no way implies a belief it is accurate, endorses the lack of uncertainty intervals, or that the number of decimal places is appropriate.

Then why are you regurgitating them.

Reply to  karlomonte
October 4, 2026 4:52 am

Why are you reading this?

Reply to  Bellman
October 4, 2026 6:05 am

bellman equivocates and runs away under another smoke screen.

No surprise.

Reply to  karlomonte
October 4, 2026 6:34 am

Do you know what “equivocate” means?

Reply to  Bellman
October 4, 2026 7:26 am

Do you know what “weasel” means?

Crispin in Val Quentin
Reply to  Bellman
October 4, 2026 2:55 pm

I liked seeing the chart for Canada. That’s new for me. The trend from 1997 until now is basically zero. As we are heading into a quiet sun for 10 years it will again settle in negative territory.

The amazing this was March this year with the USA48 at +3.74 and Canada at -3.14. That’s a 6.88 degree difference in a few thousands miles. The peak in 1998 was a little higher than the “super El Nino year” now. I am hoping for a mild winter.

Alberta has been cold since April. The longest warm stretch was in September. The rain has been incredible, ending a 10 year dry spell. The hay crop is stunning! Anyone need some?

Milo
October 3, 2026 3:38 pm

So far promised Super Duper El Niño hasn’t showed up. Maybe too early yet or secular cooling trend is dampening it.

Anthony Banton
Reply to  Milo
October 4, 2026 12:37 am

comment image

Reply to  Anthony Banton
October 4, 2026 6:06 am

Banton had spaghetti for din-din…

Anthony Banton
Reply to  karlomonte
October 4, 2026 6:17 am

Bless!

A lamb roast actually + a pint of Bateman’s XB

Reply to  Milo
October 4, 2026 6:27 am

Editorial note : On checking my post for errors I am aware that this is coming across in “loftily pontificating professor” mode.

Although definitely not my intention I am unable to rephrase it more “modestly”.

.

So far promised Super Duper El Niño hasn’t showed up. Maybe too early yet …

The CPC’s ENSO page has ENSO (/ SOI / RONI) peaking in November.

The first entry of the “Outlooks” block — ~50-55% of the way down that page — is an “Official NOAA CPC ENSO Outlook” link, which is updated monthly, and includes a table of numerical values that can be easily Copy / Pasted into most spreadsheets (either directly or via an ASCII text file).

Immediately after the “Outlooks” block of links on the main webpage is their “Expert Discussions/Assessments” block, headed by the “Weekly ENSO Evolution, Status, and Prediction Presentation” link to their widely-cited “Recent Evolution and Current Conditions” PDF slide-show file.

NB : The version of that PDF file at the time of posting is dated “28 September 2026”.

Page (/ slide) 25 copies the latest “Outlook” graph, and includes the header lines :

CPC Official ENSO Outlook

Updated: 10 September 2026

Note that page 26 shows the “NCEP CFS.v2 Forecast” alternative forecast “fan”.

Historically an ENSO peak in November / December precedes a peak in the UAH (globally averaged lower-troposphere anomalies) dataset the following March / April.

Although I personally am (very) curious to see to what “heights” UAH (LT, V6.1) will eventually rise, we will all just have to wait until next May or June (or July ?) before we get access to the actual numbers.

UAH_New-records_Jan2015-June2027
bdgwx
Reply to  Milo
October 4, 2026 6:56 am

So far promised Super Duper El Niño hasn’t showed up.

comment image

Maybe too early yet or secular cooling trend is dampening it.

First…what secular cooling trend?

Second…if > +3 considered dampened then how high must it go to overcome this “secular cooling” that you speak of?

Reply to  bdgwx
October 4, 2026 7:24 am

More spaghetti…what a mess.

October 3, 2026 4:22 pm

Hmmmm . . . down a whopping 0.07 deg. C from the previous monthly anomaly value of +0.68 deg. C, as if that precision to hundredths of one degree C in UAH reporting GLAT temperature data has any real significance.

Is this the effect of the damned persistence of that water injected into the stratosphere in January 2022 by the Hunga-Tonga submarine volcano eruption, or the effect of the much-publicized super-El Niño that officially started in June 2026, or the effect of the very recent NASA-NOAA combined PR that the Sun just entered its solar maximum period, a peak characterized by a high number of sunspots, powerful X-class solar flares, and frequent coronal mass ejections (CMEs) . . . or is it caused by something else entirely, say, random variations.

Some many choices . . . so little scientific data to support a given hypothesis. That’s weather/climate for you!

Michael Flynn
Reply to  ToldYouSo
October 3, 2026 5:38 pm

. . . or is it caused by something else entirely, say, random variations.

One thing that can be positively ruled out is the silly (but widely held) notion that increased CO2 (or other supposed “greenhouse gas”) levels in the atmosphere cause surface thermometers to get hotter, due to some non-reproducible physical effect.

Surface temperatures range from about 90C to -90C, and both the hottest and coldest temperatures occur when the mysterious “greenhouse gases” are least.

But the “greenhouse effect” cultists still insist that adding “greenhouse gases” to air can make thermometers hotter!

Completely mad, the whole sorry lot of them.

October 3, 2026 6:21 pm

Once again, atmospheric high pressure has been parked over the CONUS. Since last year this has been the case, especially over the western states. I expect that during La Niña, but come on now, how much longer will we deal with this?

Reply to  johnesm
October 3, 2026 10:59 pm
Reply to  Eldrosion
October 3, 2026 11:09 pm

Thanks for that link. Looking at other regions, Europe, Canada, and Australia have had more recent negative anomalies in the UAH data than we have here, and it’s frustrating.

Reply to  Eldrosion
October 4, 2026 7:55 am

Since there is a global warming trend obvious and stated in the UAH GLAT reporting and monthly graph updates, one should naturally expect the average temperature over the last 13 years to be above the average temperature over the last 47+ years (i.e., the data span beginning-1979, the start of the graph posted at the top of the above article).

Same logic applies if one wants to focus on a cherry-picked geographical area.

But thanks for posting the obvious.

October 3, 2026 9:39 pm

Bellman: “Presenting this data from UAH in no way implies a belief it is accurate, (my bold)”

The only comment in accord with metrology.

Reply to  Pat Frank
October 3, 2026 10:51 pm

Agreed. In a previous thread, Jim Gorman argued that measurement uncertainty does not diminish with 1√N, even under conditions where uncertainty is random and independent.

leefor
Reply to  Eldrosion
October 4, 2026 4:16 am

And which measurements are entirely random? As for independent, does that mean all thermometers are calibrated… annually, semi-annually, not at all?

bdgwx
Reply to  leefor
October 4, 2026 7:50 am

In reality measurement errors are neither entirely random nor entirely systematic. But here’s the interesting thing…measurement errors don’t have to be entirely random and independent for the uncertainty of the average to be less than the uncertainty of the individual measurements that went into that average. The only requirement for this to be true is that the correlation R < 1. You can prove this for yourself by using the NIST Uncertainty Machine.

And don’t hear what wasn’t said. I did NOT say that averaging decreases the uncertainty of the individual measurements. I did NOT say that all measurement errors are random. I did NOT say that all measurement errors are gaussian. I did NOT say a lot of things in this post that some here will erroneously claim that I did. As I always say…I’m not going to defend the arguments posited by others especially when they are absurd.

Reply to  bdgwx
October 4, 2026 9:24 am

But here’s the interesting thing…measurement errors don’t have to be entirely random and independent for the uncertainty of the average to be less than the uncertainty of the individual measurements that went into that average.

The usual trendology BS — it stinks.

Reply to  bdgwx
October 4, 2026 11:12 am

In reality measurement errors are neither entirely random nor entirely systematic. But here’s the interesting thing…measurement errors don’t have to be entirely random and independent for the uncertainty of the average to be less than the uncertainty of the individual measurements that went into that average. The only requirement for this to be true is that the correlation R < 1. You can prove this for yourself by using the NIST Uncertainty Machine.

First thing, you must put the correct information into the NIST Uncertainty Machine. That means correct measurements and standard deviations. The last time I looked, it did say standard deviation and not standard deviation of the mean.

Second, you must create a measurement model to start any process. Tmax and Tmin are single measurements. They can have no Type A evaluation since there are not multiple measurements of the same thing. That means a Type B evaluation must be done. A proper Type B requires an Uncertainty Budget to be created that is applied to each measurement. Please show us your Uncertainty Budget that you used in the NIST Uncertainty Machine.

Third, for a monthly_average, do you have 30 samples or 30 multiple observations in a random variable? If you used 30 entries for a single input quantity in the NIST Uncertainty Machine, I would like to see screen shots of how you entered the data.

If you have a random variable with 30 observations, then a GUM Type A evaluation is appropriate where the μ (mean) and σ (measurement uncertainty) are appropriate calculations. Since they are not multiple observations of the same thing, GUM Sections F.1.1.2 and H.6 apply.

If you declare the measurement to be an average, then Section 4.2 does not apply (you cannot average twice), and each sample is a separate and unique input quantity with its own measurement uncertainty. Each input quantity becomes a functional relationship of xᵢ/n. You may then use one of the equations in the GUM for calculating a combined uncertainty.

I should also point out, that random uncertainty may cancel if you add in quadrature, however, systematic error like calibration, drift, shelter, and land use are constant biases and should be added to the combined uncertainty as a separate input quantity. Bet you didn’t think about this when using the NIST Uncertainty Machine did you?

Reply to  bdgwx
October 4, 2026 5:59 pm

And often left out is that you generally have 2 choices of correlation coefficients between the combination of random and systemic measurement errors used to distinguish trend expected values and their standard deviations. Zero, or between g.t. zero, and one. The maximum standard deviation of a trend occurs at zero. From then up, the values bunch and the trend standard deviation reduces.

Yes, the right combo of systemic data errors can point a trend up or down. Never seen an example of that mentioned here…

Reply to  bigoilbob
October 4, 2026 6:11 pm

And still the point you trendology lot refuse to accept: where do you find the true values?

Error is not uncertainty.

Reply to  karlomonte
October 4, 2026 7:16 pm

The same nonsensical diss can be uttered about any evaluation ever attempted. Which is why you no rebut to my point.

Reply to  bigoilbob
October 4, 2026 7:49 pm

The rebuttal to your assertion is that you have no idea what the correlation coefficients are for either the random or systematic effects from independent, non-colocated temperature measurement stations.

Unless you can show us how you come up with these your assertion is nothing more than a non sequitur – it has nothing to do with the issue at nand.

Reply to  bigoilbob
October 4, 2026 7:47 pm

“correlation coefficients between the combination of random and systemic measurement errors”

  1. error is not uncertainty and vice versa
  2. Exactly what *is* the correlation coefficient for the systematic effects between independent temperature measurement stations?
  3. Exactly what *is* the correlation coefficient for the random effects at independent temperature measurement stations?
Reply to  bdgwx
October 4, 2026 6:16 pm

“The only requirement for this to be true is that the correlation R < 1.”

R of WHAT?

” uncertainty of the average”

What uncertainty of the average? The sampling uncertainty or the measurement uncertainty?

The SAMPLING uncertainty is based on the VALUEs in the measurements, as in “stated value +/- measurement uncertainty”. The sampling uncertainty, i.e. the SEM is based on the “stated values” and has nothing whatsoever to do with the measurement uncertainties. Although I don’t believe temperature values are very highly correlated for various reasons, their correlation has nothing whatsoever to do with the measurement uncertainty.

If you look at Eq 15 and expand it using Eq 14 the covarience term has the following components:

u(x_i), u(x_j), and u(x_i,x_j) / [ u(x_i) * u(x_j) ]

Nothing in there but uncertainties, i.e. the variances of the data components.

Just how are the measurement uncertainty values from independent, widely separated, measurement stations correlated. What *is* u(x_i,x_j)?

My guess is that it is so close to zero as to be indistinguishable from zero.

And the propagation of measurement uncertainty thus becomes, based on Eq 10, variance ∝ Σu(x_i)^2

That variance applies to *any* value in the measurement uncertainty interval, including the mean of the stated values.

Thus the measurement uncertainty of the average *IS* Σu(x_i)^2.

*YOU*, like so many of your compatriots need to learn to READ and COMPREHEND what the metrology texts actually say. Instead of just cherry picking things you think validate your misconceptions.

“ I did NOT say a lot of things in this post that some here will erroneously claim that I did.”

You just said the propagation of measurement uncertainty depends on the correlation of the estimated VALUES of the measurements instead of on the correlation of the measurement uncertainties.

That’s wrong. It’s the same kind of pettifogging and gaslighting that climate science is famous for.

  1. Measurement uncertainties from independent, un-correlated temperature measurement stations ALWAYS ADD.
  2. The total measurement uncertainty is ALWAYS GREATER than the individual measurement uncertainties.
  3. the total measurement uncertainty applies to ALL values inside the measurement uncertainty interval, including the mean of the stated values.
  4. If the total measurement uncertainty is greater than the sampling uncertainty generated from the stated values then it is basically meaningless. It just gets subsumed into the measurement uncertainty interval.
  5. If the sampling uncertainty is *greater* than the total measurement uncertainty then the measurement process and instrumentation is sadly and irretrievably broken and the entire product should be put in the round file.
Reply to  Tim Gorman
October 4, 2026 7:51 pm

got a down vote I see. But no refutation of anything I asserted.

Typical of the global climate warming crowd.

Reply to  Tim Gorman
October 4, 2026 9:52 pm

So much easier to push the red button than to face the truth.

Reply to  leefor
October 4, 2026 8:00 am

UAH-data, derived from MSU instruments on orbiting spacecraft, is not based on thermometers.

leefor
Reply to  ToldYouSo
October 4, 2026 9:34 pm

And i did not claim otherwise.

Reply to  Eldrosion
October 4, 2026 5:55 am

Can you link Jim’s comment?

Reply to  karlomonte
October 4, 2026 10:58 am

You’re conflating two different requests.

The conversation you linked to concerns you guys requesting what Pat Frank said regarding his position on measurement uncertainty under conditions where all uncertainty is random.

The present conversation concerns a Jim Gorman’s position on the matter. A different person.

Thanks for demonstrating to everyone the poor reliability of your accusations.

Reply to  Eldrosion
October 4, 2026 11:15 am

You are still dodging the original question. Not a good look!

Reply to  Jim Gorman
October 5, 2026 12:04 am

It was provided.

bdgwx
Reply to  Pat Frank
October 4, 2026 7:09 am
Reply to  bdgwx
October 4, 2026 10:53 am

Thanks. That’s exactly the quote I am referring to.

Reply to  karlomonte
October 5, 2026 12:08 am

From your link:

“ Random uncertainty does not cancel by 1/√n. “

Reply to  bdgwx
October 4, 2026 11:34 am

Yes, it is true.

Can you show us an equation from the GUM that has a subtraction for calculating combined uncertainty? Remember, a squared term will never be negative. Don’t bother with 5.2.2 because the measurement of one temperature’s value does not influence the measurement value of the next measurement. They are independent.

Reply to  Jim Gorman
October 4, 2026 1:12 pm

You keep asking that and ignore everyone who points out that you don’t need to subtract to make a number smaller. The uncertainty of an average gets smaller not because you are subtracting but because you are dividing by √N.

Reply to  Bellman
October 4, 2026 5:25 pm

You keep asking that and ignore everyone who points out that you don’t need to subtract to make a number smaller. The uncertainty of an average gets smaller not because you are subtracting but because you are dividing by √N.

The uncertainty of the mean gets smaller by 1/√n. The measurement uncertainty of an input quantity is the standard deviation. The standard deviation is not decreased by 1/√n.

The only average shown in the GUM Section 4 is when there are multiple observations of a measurand that form a random variable “q” that contains the qₖ observations. The mean of qₖ observations is the best estimate of the value and the measurement uncertainty is the standard deviation σ. Neither of these are divided by √n.

The reliability of the mean, the interval where the mean may lay, is the standard deviation of the mean (SDOM). It can be estimated by σ/√n. It is not the measurement uncertainty.

I know you base your assertions by making a functional relationship describing the measurand to be an average. You cannot have both a functional relationship average using observations AND a Type A evaluation using a random variable that contains the observations also. That results in two averages of the same observations.

If you want to impress people take the temperatures from NIST TN 1900 Example 2 and show the math about how you would perform a Type A evaluation using GUM Section 4.2, then create a combined uncertainty using a functional relationship reusing the temperatures again to calculate a monthly average measurand.

Reply to  Jim Gorman
October 4, 2026 7:29 pm

“The uncertainty of the mean gets smaller by 1/√n. The measurement uncertainty of an input quantity is the standard deviation. The standard deviation is not decreased by 1/√n.”

Correct, except an input quantity may be a mean of multiple measurements in which case it’s uncertainty is divided by √n.

“The only average shown in the GUM Section 4 is when there are multiple observations of a measurand that form a random variable “q” that contains the qₖ observations.”

This is unrelated to equation 10 – but yes, section 4 explains the “experimental standard deviation of the mean”, the same as SDOM in Taylor’s book. Both cases are using the same concept as the SEM, but applied to measuring a single value.

“The mean of qₖ observations is the best estimate of the value and the measurement uncertainty is the standard deviation σ. Neither of these are divided by √n. ”

No. You keep ignoring section 4.2.3. The section that says the experimental standard deviation of the mean may be used as measure of the uncertainty of the mean of the qₖ observations. And that’s when you are dividing by √n.

“The reliability of the mean, the interval where the mean may lay, is the standard deviation of the mean (SDOM). It can be estimated by σ/√n. It is not the measurement uncertainty.”

They tell you in 4.2.3 that it is the measurement uncertainty of the mean.

“I know you base your assertions by making a functional relationship describing the measurand to be an average.”

Yes, that’s where equation 10 comes in. This is different from measuring the same thing multiple times as in 4.2.3. It’s saying if you want to find the combined measurement uncertainty of any functional relationship, you can use that equation to propagate the individual measurement uncertainties.

“You cannot have both a functional relationship average using observations AND a Type A evaluation using a random variable that contains the observations also.”

Why not? You were the ones who insisted that you had to use equation 10 to determine the uncertainty if the mean, then when it turned out it still gave you a division by √n, you say you can’t use it.

“That results in two averages of the same observations.”

No it doesn’t. The assumption of using equation 10 for the average is that you are averaging a number of different things, each with a different value. You have a measurement for each thing, which may come from a single measurement with a Type B uncertainty, or the result of measuring one thing multiple times with a Type A uncertainty. It doesn’t matter in order to use equation 10. It’s just propagating the individual uncertainties into a combined uncertainty.

“If you want to impress people take the temperatures from NIST TN 1900 Example 2”

Please no, not that again.

They are not using equation 10. It’s just applying a sampling uncertainty to the mean, i.e. calculating the SEM of the different daily values. They justify this as measurement uncertainty terms by considering the daily values as measurements of the same thing under conditions of repeatability, and so use 4.2.3 and calculate the experimental standard deviation of the mean.

“show the math about how you would perform a Type A evaluation using GUM Section 4.2,”

Take the daily values and average them. Take the standard deviation and divide that by √n. Calculate an interval using a student-t distribution with n – 1 degrees of freedom.

As I keep saying, I think it’s questionable to call this the measurement uncertainty of the monthly average, as it has little to do with any uncertainty in the individual measurements.

“then create a combined uncertainty using a functional relationship reusing the temperatures again to calculate a monthly average measurand.

For that you would need to know the Type B uncertainty of the station, which they don’t state. As the resolution of the stated values appears to be 0.25°C, let’s assume that this is the standard uncertainty. So now it’s just a question of putting in these uncertainties into equation 10 with partial derivatives of 1/22 for each input. Which will come to

√[22 * (0.25/22)²] = 0.25 / √22 = 0.053°C.

That would be the measurement uncertainty of the exact average of those 22 daily values.

However, you then have the big problem that there are 9 missing days, so if you want to know the uncertainty of the actual monthly average.

A simple way of handling that would be to treat them as coming from the same distribution as the other 22 days, then each of the missing days has an uncertainty of 4.1°C

Reworking equation 10, but now with 22 days with an uncertainty of 0.25 and 9 with an uncertainty of 4.1 and we get (hopefully)

√[22 * (0.25/31)² + 9 * (4.1/31)²] = √[22 * 0.25² + 9 * 4.1²] / 31 = 0.40°C.

This is smaller than the TN1900 version because it’s assuming we want the uncertainty of the actual monthly average rather than treating all the values as a random sample.

Reply to  Bellman
October 4, 2026 6:37 pm

You are STILL CONFLATING SAMPLING UNCERTAINTY WITH MEASUREMENT UNCERTIANTY!

Sampling uncertainty is calculated from the stated values. It has ZERO to do with measurement uncertainty. If the sampling uncertainty is smaller than the measurement uncertainty, then it just gets subsumed into the measurement uncertainty. If the sampling uncertainty is greater than the measurement uncertainty, then your whole measurement process is fatally flawed.

Reply to  Tim Gorman
October 4, 2026 7:43 pm

“You are STILL CONFLATING SAMPLING UNCERTAINTY WITH MEASUREMENT UNCERTIANTY!”

Where? Equation 10 is about measurement uncertainty.

bdgwx
Reply to  Jim Gorman
October 4, 2026 3:40 pm

I find it strange that you and your brother do not believe the GUM authors understand metrology and physics yet you still seem to put a lot of stock in their authority on these matters.

For the record and so that no one gets the wrong idea…I have no problem with the GUM’s authorship. I believe that the authors do understand metrology and physics.

Reply to  bdgwx
October 4, 2026 5:06 pm

For the record 

No one cares…

Reply to  bdgwx
October 4, 2026 6:15 pm

I find it strange that you and your brother do not believe the GUM authors understand metrology and physics yet you still seem to put a lot of stock in their authority on these matters.

There are plenty of authors of metrology documents. The problem with using the GUM is that you need to understand some basic metrology. It is not a textbook, it is a procedure manual. If you don’t understand the why’s behind the procedures, you are essentially operating blind.

If you would like more references I have more. Funny how you never introduce any metrology resources other than the GUM which requires studing textbooks and other documents to understand it.

Please read this document carefully.
https://pmc.ncbi.nlm.nih.gov/articles/PMC3387884/

Some notes from it.

  • A numerical value (expressed in SI units as required by ISO 15189) which gives the best estimate of the quantity being measured (the measurand). This estimate may well be a single measurement or the mean value of a series of measurements.
  • A measure of the uncertainty associated with this estimated value. In clinical biochemistry this may well be the variability or dispersion of a series of similar measurements (for example, a series of quality control specimens) expressed as a standard uncertainty (standard deviation) or combined standard uncertainty (see below).

Type A components are characterised by an estimate of their variances ( 𝑠2𝑖) or their estimated standard deviations (si) and the appropriate number of degrees of freedom (see below). A standard deviation (si) is numerically identical to a standard uncertainty (ui). 

Reply to  bdgwx
October 4, 2026 6:35 pm

The authors of the GUM understand metrology pretty well. It’s YOU that can’t read what they write for meaning and context.

Since measurement uncertainties from independent temperature measurement stations are uncorrelated, the propagation of measurement uncertainty in Eq 10 becomes

variance = Σu(x_i)^2

That variance goes with EVERY SINGLE VALUE THAT EXISTS IN THE MEASUREMENT UNCERTAINTY INTERVAL, NO MATTER HOW YOU COME UP WITH IT!

It doesn’t matter if your BEST GUSS for the value of the measurand is 10, 11, 16, 18 or whatever. The uncertainty interval remains 10 to 20.

The central value, which statisticians typically call the mean by always assuming everything is Gaussian, is just a reference point. Valid statements for the measurement could be

15 +/- 5. (Gaussian distribution)
14 +6/-4 (skewed right distribution)
18 +2/-8 (skewed left distribution

Each of these is a totally valid statement of Best Estimate +/- measurement uncertainty. And they all give a measurement uncertainty interval of 10 to 20.

If the sampling uncertainty, s/sqrt(n), is smaller than the measurement uncertainty then the sampling uncertainty just gets subsumed into the measurement uncertainty and it is useless in comparing subsequent measurements, including whether anomalies between two measurements that are less than the measurement uncertainty can actually be known.

Reply to  Pat Frank
October 4, 2026 2:00 pm

Maybe Jim could answer what he believes. I find it difficult to keep track of what he and Tim actually believe about measurement uncertainty of the mean.

It seems to come down to two contradictory claims.

  1. That you propagate the measurement uncertainties of all the individual measurements, using the standard rules or equation 10 in the GUM. But that’s when they keep insisting that this does not result in any division, and the measurement uncertainty of the mean is the same as the measurement uncertainty of the sum. Hence the uncertainty increases with the square root of the number of measurements.
  2. That the measurement uncertainty of a mean is the standard deviation of all the values that went into the average.
Reply to  Bellman
October 4, 2026 2:56 pm

It seems to come down to two contradictory claims.

The contradiction lies with you and your total lack of any real experience with uncertainty analysis.

Reply to  Bellman
October 4, 2026 6:59 pm

You *still*, after three years of tutalage, understand nothing of metrology basics.

Sampling uncertainty, s/sqrt(n), is determined from the stated values of the measurements. It has NOTHING to do with measurement uncertainty.

The total measurement uncertainty *IS* the sum of the individual measurement uncertainties. It is a variance. u(x_i) is a standard deviation calculated from u(x_i)^2.

As the GUM states, that total variance *IS* the measurement uncertainty of the measurand. It has NOTHING TO DO with the s/sqrt(n) which is calculated from the stated values.

There are no contradictory claims.

The GUM states:
————————-
This estimate of variance and its positive square root s(q_k), termed the experimental standard deviation
(B.2.17), characterize the variability of the observed values q_k , or more specifically, their dispersion about their mean q.
———————–

Note carefully – VARIANCE OF THE OBSERVED VALUES IS s^2(q_k)

———————
The experimental variance of the mean s^2(q_bar) …. quantify how well q_bar estimates the expectation μ_q
of q, and either may be used as a measure of the uncertainty of q_bar
————————

s^2(q_k) is NOT EQUAL to s^2(q_bar).

s^2(q_bar) tells you how close you are to the mean. s^2(q_k) tells you how uncertain you are about that mean being the actual value of the measurand.

You keep trying to conflate the two by NEVER specifying which you are talking about.

You’ve wasted thousands of hours of of peoples time and effort trying to explain to you that q_k and q_bar are not the same thing and s(q_k) and s(q_bar) are not the same thing. If s(q_bar) < s(q_k) then it gets subsumed into s(q_k) and NO ONE CARES about it in the real world.

Assuming the measurement uncertainty is always a Gaussian distribution and its mean is the BEST ESTIMATE is a crutch used solely for reference purpose. Whether those ASSumptions hold true is never questioned by statisticians. But they ARE questioned by people that actually have to use the measurements in the real world.

And *that* is the real contradiction here. The statistical world wherein the ASSumption of always Guassian is acceptable and the real world where that assumption has to be justified and proven before being use.

And you simply can’t get over that fact. You want to be able to just say “all measurement uncertainty is random, Gaussian, and cancels” so you can use s^2(q_bar) as your measurement uncertainty SO YOU CAN MAKE IT AS SMALL AS YOU WANT!

Reply to  Tim Gorman
October 4, 2026 8:03 pm

“The total measurement uncertainty *IS* the sum of the individual measurement uncertainties. It is a variance. u(x_i) is a standard deviation calculated from u(x_i)^2.
As the GUM states, that total variance *IS* the measurement uncertainty of the measurand. It has NOTHING TO DO with the s/sqrt(n) which is calculated from the stated values.”

As I said – you are claiming contradictory things. Thanks for confirming it.

“You’ve wasted thousands of hours of of peoples time and effort trying to explain to you that q_k and q_bar are not the same thing”

Why on earth would you think they are the same? As always you fail to address any point I make, and just argue with things I haven’t said. No wonder you are wasting so much of your precious time.

“If s(q_bar) < s(q_k)”

That will always be the case as s(q_bar) = s(q_k) / √n.

“then it gets subsumed into s(q_k) and NO ONE CARES about it in the real world.”

Then why bother to make multiple measurements and say the average is the best estimate of the measurand? Why waste time showing how to do it in 4.4.3 is nobody cares about it in the real world?

“The statistical world wherein the ASSumption”

I miss arguing with adults.

“of always Guassian”

Don’t you mean GuASSian?

Regardless, it makes no difference to this discussion what the distribution of the uncertainties are. The mean is still the best estimate and the experimental standard deviation of the mean is still the best estimate of the uncertainty.

“And you simply can’t get over that fact.”

What fact? The one about you always making stuff up about what I say and believe?

Not all distributions are Gaussian. Not all uncertainties are independent. Systematic errors exist. I keep telling you this, and you just keep claiming I said the opposite. It’s just a very childish way of arguing.

Reply to  Eldrosion
October 4, 2026 8:03 am

Agreed. In a previous thread, Jim Gorman argued that measurement uncertainty does not diminish with 1√N, even under conditions where uncertainty is random and independent.

I will just say you appear to be an absolute master of cherry picking statements and using them out of the context they were used in.

A Type A statistical analysis of measurement uncertainty is the result of multiple observations of the same thing under repeatable conditions that result in a probability distribution. The mean of that probability function, is the best estimate of the center of an interval where the true value may lay. The standard deviation of that probability function is the measurement uncertainty. The standard deviation of the mean (SDOM) of that probability function is a measure of the reliability of the mean value.

A Type A analysis of a measurand requires multiple observations. If you declare the standard deviation of the mean to be 1/√n, then you have automatically declared the group of observations to a single sample of size “n” . Therein lies a problem. Is the group of observations a population or a sample? Are there more than 30/31 days of Tmax, Tmin, Tavg? If there are not, then you have the entire population and not a sample.

If you are dealing with a population then the mean, and standard deviation is known as perfectly as can be. The SDOM can be estimated by √n. BUT NOTE: the measurement uncertainty is the standard deviation.

The standard deviation is a measure of the dispersion of observations surrounding the mean. More observations will only provide a better description of the distribution, it will not have a dependence on 1/√n.

The standard deviation of the mean (SDOM) depicts the reliability of the mean value. It is a measure of the sampling error. The SDOM is the standard deviation of the sample means. The sample means is plural; it is defined as a resulting probability distribution from a number of samples of size “n”. In effect, it is the measurement uncertainty of the mean value. The SDOM can be ESTIMATED by the factor of 1/√n.

As I stated multiple times, there are other influence quantities that are systematic in nature. Those must be determined and the total combined measurement uncertainty is determined by adding those together.

The combined measurement uncertainty of a measurand is determined by summing the Type A and Type B measurement uncertainty of all the input quantities that determine the measurand.

As you can see, Type A measurement uncertainty is additive, it does not grow or decrease by a factor of √n.

Reply to  Jim Gorman
October 4, 2026 11:17 am

But this is precisely the point at issue.

You explicitly state that the SDOM is, in effect, the measurement uncertainty of the mean value, and you acknowledge that the SDOM is estimated using 1/√n. Yet you then conclude that Type A measurement uncertainty does not decrease by 1/√n.

If the uncertainty under consideration is random and independent and the measurand is the mean of N observations, then the standard uncertainty of that mean decreases as 1/√N.

Reply to  Eldrosion
October 4, 2026 11:40 am

True measurement uncertainty is quantified as standard deviation, not this 1/root(n) junk.

And where did you hide the non-zero measurement uncertaintieS of all those thermometers?

Averaging throws information in the trash.

Reply to  karlomonte
October 5, 2026 12:00 am

“True measurement uncertainty is quantified as standard deviation, not this 1/root(n) junk.”

1/√N is not an alternative to standard deviation. Again, per 4.2.3 of the JCGM 2008, the estimated variance of the mean is s^2(q_bar) = s^2(qk)/n.

Variance is standard deviation squared. Therefore, taking the square root gives s(q_bar) = s(qk)/√n.

Reply to  Eldrosion
October 4, 2026 8:30 pm

Type A measurement uncertainty is *NOT* the standard uncertainty of the mean.

Measurement uncertainty is the SD of the data. The standard uncertainty of the mean is SD/sqrt(n).

THEY ARE NOT THE SAME. You are gaslighting in trying to say they *are* the same.

Reply to  Tim Gorman
October 5, 2026 12:03 am

False accusations to be ignored.

MrGrimNasty
October 4, 2026 12:49 am

These discussions always pose the question, so what data/facts would my fellow skeptics accept.

The answer is only that which agrees with their belief that the world hasn’t warmed. It’s a shame because such blind intransigence devalues our position.

September was the sixth warmest in the ~360 year long Central England Temperature series, +2.5C (1961-90). We had a record warm night right at the end of September where the minimum loitered around 20C all night over a wide area. Every month Feb-Sep in 2026 has been between +2.5 and +3.5C, and 2026 is on course to be an all time record by about a whole degree C.

Reply to  MrGrimNasty
October 4, 2026 1:58 am

I don’t think there’s anyone on here that doesn’t acknowledge that the earth is warming. However, although the CET data shows that warming, it actually only covers a small area, and hence is effectively a single data point in a global view. The CET data also includes the latter half of the little ice age, hence it would be expected that there would be a steady increase in temperature, however the locations of the thermometers needs to be taken into account as they may have changed from rural to urban over the centuries. Yes, there appears to be a correlation between emissions and temperature rise since the Industrial Revolution but that doesn’t mean a causal relationship. Could the warming temperatures following the LIA have actually triggered the Industrial Revolution? Certainly previous warming periods have coincided with increases in human activity, for example the medieval warm period coincided with an increase in the construction of cathedrals.

Also having been in Scotland and rural Northumbria these last two weeks, there certainly weren’t 20 degree temperatures overnight! There’s more to England than that south of the Watford Gap, which is subject to warm air coming from the south. Currently 2026 is the warmest, 2025 drops to 2nd place and 1976 (which predates the satellite data) drops to 3rd.

bdgwx
Reply to  JohnC
October 4, 2026 7:06 am

I don’t think there’s anyone on here that doesn’t acknowledge that the earth is warming.

There are several people that do not acknowledge it. You don’t even need look any further than the comment section of this very article.

Reply to  bdgwx
October 4, 2026 7:25 am

This is a very contrarian attitude.

Reply to  JohnC
October 4, 2026 8:16 am

“. . . CET data also includes the latter half of the little ice age . . .”

Hmmm . . . the Little Ice Age lasted from roughly the early 14th century to the mid-19th century (c. 1300–1850), so the latter half would be the period of about 1575 to 1850.

Since the first somewhat-accurate liquid-in-glass (LIG) thermometer was invented in 1714 by Polish-born German physicist Daniel Gabriel Fahrenheit, I’m just wondering how accurate the CET data is over that stated time period.

Bottom line, there is no reasonably valid temperature measurement data that predates about 1715 AD, and even so it is only for selected geographical areas where LIG thermometers were being used by meteorologists and mariners.

Reply to  MrGrimNasty
October 4, 2026 8:10 am

It’s a shame because such blind intransigence devalues our position.

We are not intransigent. We don’t believe the whole story is complete. Thermodynamic warming and cooling is not based upon temperature alone. It is based on Qsensible and Qlatent. It is based on absolute temperatures not anomalies. What is the total heat energy in the arctic with very low temperatures and humidity? What is the total heat energy in the tropics with both high humidity and temperatures?

Many of us sceptics believe that temperature has been glommed onto by climate science in order to tell a chapter in the story. However, it isn’t the whole story.

Reply to  Jim Gorman
October 4, 2026 7:02 pm

it’s not even a story. It’s a fantasy tale. All based on convenience. It doesn’t matter to climate science that all other disciplines that I know of, from agricultural science to HVAC engineering, has abandoned climate science methods for being outdated, loaded with garbage assumptions, and irrelevant.

October 4, 2026 10:43 am

I find these ` departure values unsatisfying .
Arrhenius guesstimated mean global temperature at 15c .
What’s the asserted estimate now ?

Reply to  Bob Armstrong
October 4, 2026 11:29 am

According to bellman, it is 4°C in Yemen.

Reply to  karlomonte
October 4, 2026 1:03 pm

Your inability to understand that satellite data is not measuring the temperature on the ground, but in the lower troposphere, is your problem.

Reply to  Bellman
October 4, 2026 2:58 pm

Do you really believe I don’t know this?

Or are you just being snarky?

Reply to  Bob Armstrong
October 4, 2026 11:36 am

Better yet, what is the optimum temperature for the earth?

bdgwx
Reply to  Bob Armstrong
October 4, 2026 3:21 pm

I find these ` departure values unsatisfying .

You can convert them easily using the following anomaly baselines.

Month Value
1 263.18 K
2 263.27 K
3 263.43 K
4 263.84 K
5 264.45 K
6 265.10 K
7 265.42 K
8 265.23 K
9 264.64 K
10 263.95 K
11 263.41 K
12 263.19 K

What’s the asserted estimate now ?

Arrhenius 15 C estimate was for the surface. The UAH values being discussed in this article are for the TLT layer. Anyway, the estimate via UAH is about 264 K or -9 C.