From NOT A LOT OF PEOPLE KNOW THAT
By Paul Homewood
h/t Joe Public
Daily temperature records are meaningless in terms of climate and weather. But they are of immense propaganda value.
So, step forward Marco Petagna, Media Advisor & Senior Operational Meteorologist at the UK Met Office:


Followed later in the day by the ITV weatherman:

The Met Office confirmed 27.0C at Frittenden:

But how do we know what the previous daily record was? Indeed, how does the Met Office?
Are we supposed to take them on trust? If so, that trust is misplaced.
An article in the Times 15 years ago, following a warm spell of weather, reminded readers that it had been much hotter in September 1895! Their archived news reports revealed that temperatures had reached 30.6C (87.1F) on both 25th and 27th of September in Strathfield Turgis, Hampshire.
https://www.thetimes.com/travel/advice/weather-eye-a-topsy-turvy-year-d5m85g66ztd
When challenged about this on X, Marco Petagna replied that Strathfield Turgis was “not on our internal records for some reason”.
How convenient!!!!
In fact, the weather during that last week in September 1895 was exceptionally hot for days on end, much hotter than the 27.0C at Frittenden. The highest readings for the month were variously set on dates between the 24th and 29th at different locations:


Strathfield Turgis was no fluke or outlier.
A number of sites up and down the country exceeded 27.0C/80.6F, on the 24th, 25th, 237th and 28th:


Note that North Foreland recorded 81F on the 25th, the day under discussion.
These are just a small selection of stations, used in the Met Office Monthly Summaries. There will be hundreds of other sites, such as Strathfield, and given the prolonged nature of the heatwave in 1895 and its widespread geographical coverage, it seems inevitable that many other sites topped 81F that day.
Petagna’s comment about “internal records” is revealing. It indicates that the Met Office has simply binned any temperature data it deems to be “too high”.
As one commenter wisecracked:

In the meantime, it is clear that we cannot trust any daily record claims made by the Met Office.
Meteorology at least as practiced in much of the anglophone world has long thrown off the ‘cult of empiricism’ and blended with ‘climate-change science’, joining other non-objective fields like psychology sociology political science anthropology and economics sometimes even resembling parapsychology and psychism.
and what about – ideology?
I know some economists, and at least they try.
Even if it were true that a 26.9C recorded maximum temperature in 1895 had been exceeded by 0.1C, 131 years later, that has no relevance to an argument in support of AGW.
0.1C is a trivial amount, well within the margin of error.
Maximum temperatures are often reported in the media as the worst in 50 years, or 100 years, or 150 years. If such reports are true, then anyone who can apply a bit of logic should understand that such reporting is evidence that the increased burning of fossil fuels has not increased maximum temperatures.
https://www.drroyspencer.com/2025/12/the-record-hot-uk-summer-of-2025-validation-of-the-ukmo-methodology-but-the-record-was-only-in-tmin/
“Despite criticisms of the UKMO data and methods for computing UK-average temperatures, I find that a simple bias-removal method of combining all available UK stations produces essentially identical results to the much more complex UKMO methodology. It should provide some vindication for the UKMO methodology in the context of climate temperature trend monitoring.”
“It should provide some vindication … ” only providing those stations are in UKMets database of temperatures. Unlike the example above. 😉
Then don’t use those stations. That’s essentially the point of Spencer’s analysis: his much simpler reconstruction, using a different station-selection/combination approach, still produces virtually the same result as the Met Office series.
But if the UKMet don’t use those stations they have the wrong temperature for the UK. 😉
What you fail to understand is that the goal is supporting the party, reporting accurate climate data is subservient to that goal.
And I guess Dr. Spencer is a part of that “party.”
Try reading what he wrote and you quote. “…in the context of climate temperature trend monitoring” is not the same thing as identifying record temperatures at specific locations.
Dr. Spencer’s analysis did not include measurement uncertainty. It can only be considered to be back-of-the-envelope accurate. His blog that you provided did not show any error bars nor any calculations concerning measurement uncertainty. Therefore, it can only be taken with a large grain of salt.
“Dr. Spencer’s analysis did not include measurement uncertainty”
Neither does Paul Homewood when he emphasizes just how hot September 1895 was.
Two wrongs don’t make a right.
Yet you only criticize the alleged wrong that happens to show what you don’t like, which rather exposes the lack of genuine concern behind what you write.
It isn’t up to me to address every wrong. Nothing on this page addresses measurement uncertainty. None of the graphs have error bars delineating uncertainty. Not one mention of actual measurements in this thread mention the associated uncertainty.
JCGM 100:2008 addresses it in its very first paragraph
This is an internationally agreed upon standard for measurements, including scientific measurements. Not using this standard means, “measurement results cannot be compared, either among themselves”. Cannot be compared among themselves – this should be evident to you. Meteorologists and climate scientists ignore this daily. It is obvious that they have never been taught nor believe the epistomolgical basis of measurements. As a result we see trends without error bars and “records” that cannot be substantiated scientically.
I dare you to take any of the “records” discussed here and justify the one being higher when evaluating their uncertainty intervals of, say ±0.8°C. In general statistical significance means results in data aren’t explained by chance alone. Show us how you justify a difference of 0.1 or 0.2°C being statistically significant when the uncertainty in each is ±0.8°C
Fake Data — this is impossible.
Funny how removing “bias” always makes the real data closer to what the models say it should have been.
You can read about GHCN here:
https://journals.ametsoc.org/view/journals/bams/78/12/1520-0477_1997_078_2837_aootgh_2_0_co_2.pdf
No interest in reading tortured justifications for Fake Data.
I have read through this document before. Do us a favor and find text that discusses the measurement uncertainty of each temperature in the data base. Then find text the describes how they compensated for the measurement uncertainty between station types and station classes.
I think you’ll find this document just assumed all the data was 100% accurate and required no propagation of uncertainty.
That’s not science. That is statisticians run amok.
You will note that your reference does nothing to assess measurement uncertainty based upon the class of station. Climate science is deficient in using appropriate methods to assess the comparison of measurement uncertainty intervals.
Using my calculations, ASOS stations in the U.S. have a basic accuracy of ±1°C and a standard uncertainty budget of around ±1.5°C. CRN stations in the U.S. have a a basic accuracy uncertainty of ±0.3°C and a standard uncertainty budget of ±0.8°C. These values make comparisons of 0.1°C superfluous even when using the basic accuracy uncertainty.
The very first paragraph in JCGM 100:2008, the GUM, says the following.
Chris Hanley above has pointed out that “climate-change science’, joining other non-objective fields like psychology sociology political science anthropology and economics sometimes even resembling parapsychology and psychism.”. One cannot use the word objective without including the quality of the results.
You’re confusing the uncertainty of an individual temperature measurement with the uncertainty of a spatially and temporally averaged temperature series and its trend.
An instrument having an uncertainty of ±1°C does not mean that the uncertainty of an average constructed from many observations is also ±1°C nor does it mean that changes smaller than 1°C cannot be resolved statistically. Random measurement uncertainties decrease through averaging, while systematic, correlated, sampling and other uncertainties are treated separately.
If you were to follow the ‘logic’ of this argument, then could consider the following: –
Measure your vehicle fuel tank, using a gauge that has ONLY returns on of the following data points, 100%, 75%, 50%, 25% and empty.
Your uncertainty could be up to 25%, (plus and minus half the output division magnitude).
Common sense should confirm that the measurements will not improve the uncertainty. The ‘logic’ presented above implies that the uncertainty can be reduced by the 100 sample points, (surely not to 1%, a simple division due to the 100 sample points).
Why do some people always assume that you can get more precise data when you measure more often?
Because it is all they got. Without it they are bankrupt.
This is from Section 4.2.3 of JCGM 100:2008:
The best estimate of σ^2(/q)=σ^2/n, the variance of the mean, is given by: S^2(/q)=s^2(qk)/n.
If repeated independent measurements of the same quantity have a standard deviation of s = 1°C, and you carry out 100 measurements (n = 100), the equation gives:
s²(/q) = 1^2/100 = 0.01°C.
Take the square root of that as uncertainty is expressed as a standard deviation:
s(/q)=SQRT(0.01)=0.1C, which is identical to 1/√100.
Uncertainty decreases as 1/√n.
You are mixing up standard deviation of the DATA with the standard deviation of the average. A common mistake in climate science. Sigma^2 has NOTHING to do with division by “q”. It is variance of the data, it is *NOT* the variance of the mean. The variance of the mean is SAMPLING uncertainty, not MEASUREMENT uncertainty.
What I wrote was a verbatim quote. It explicitly calls sigma^2(\q)=sigma^2/n “the variance of the mean.”
“not MEASUREMENT uncertainty.”
The GUM disagrees with you.
The variance of the mean is not the dispersion of observed data values surrounding the mean. Variance of the observed data values is the measurement uncertainty.
Do you really think the international body would have missed these references during a number of revisions? I am darn sure they intended the standard deviation of the observations to be measurement uncertainty.
If you need more references I can provide them to you.
” I am darn sure they intended the standard deviation of the observations to be measurement uncertainty.”
Which is why I took the square root of Equation 5.
“Variance of the observed data values is the measurement uncertainty.”
Not necessarily. The standard deviation of the observations can reflect genuine variation in atmospheric temperature, rather than measurement uncertainty.
And more importantly, we’re talking about climate averages, right? If the quantity we’re estimating is a mean, then the uncertainty of the mean IS the relevant quantity.
s^2(q_bar) = s^2(q_k)/n
THIS IS SAMPLING ERROR, NOT MEASUREMENT UNCERTAINTY!
How many times does this need to be explained to you??????
Note CAREFULLY what the equation is finding!
s^2(q_bar) q_bar is the AVERAGE VALUE. This equation is telling you how precisely you can LOCATE the average based on the size of the sample (and even this is a SHORTCUT estimator, it is *not* the actual definition of the real sampling error). It tells you NOTHING about the accuracy of the either q_bar (the average) or of the data itself. What tells you the MEASUREMENT UNCERTAINTY, i.e. the *accuracy*, is s^2(q_,k), not s^2(q_bar)!!!
And s^2(q_k) only tells you the measurement uncertainty if you are doing a Type A analysis of a single measurand under repeatable conditions. If you aren’t doing repeatable conditions then this equation simply doesn’t apply.
Can you even begin to grasp the difference between how precisely you can locate the average from a sample, and the measurement uncertainty of the data used to create that average value?
You can calculate the average value of 1000 pieces of data out to as many decimal places as you want. If that data is inaccurate then the average value you so precisely calculate IS GOING TO BE INACCURATE AS WELL!
Sampling error only tells you how well you can ESTIMATE the average value of the population from a sample. Again, it tells you NOTHING about the accuracy of the average value you calculate. If the data in the population is inaccurate then you are well and truly screwed. Nothing you can do can make the average of that population accurate let alone the ESTIMATED average cacluated from a sample!
#1) Meteorological temperature observations can meet repeatability conditions. An automated station repeatedly sampling temperature with the same sensor, procedure, location and operating conditions is an obvious example. “Repeatability” does not require the physical value of the measurand to remain perfectly constant.
#2) As I told Jim, for climate analysis we are interested in derived averages/trends/ anomalies, not the accuracy of one isolated thermometer reading. That’s why you can’t say, “an individual observation has uncertainty X, therefore a national annual mean has uncertainty X”, like Jim Gorman was.
BZZZZZZZT — only if you are sniffing glue.
I would DEARLY love to assign this guy the job of building a stud wall in a house. I would love even more seeing the wife of the customer take him to task for the waves in the drywall caused by his assumption that all measurement uncertainty is random, Gaussian, and cancels. Or that it is the SD/sqrt(n)!
I repeat my reply I made to you earlier:
“Second of all, there are temperature products that routinely involve multiple observations over time. USCRN measures temperature with 3 independent PRTs and repots 5 minute averages calculated from multiple samples.”
So what? Its a single location, not 50,000, and they still have to implicitly assume the air temperature isn’t changing over the sampling period (which is does, to varying amounts, which inserts a systematic uncertainty).
The measurement uncertainty of a temperature measuring station is *NOT* just the measurement uncertainty of the PRT!
You have NEVER, not once, ever had to develop an uncertainty budget that is involved with a project where civil or criminal liability is involved.
INFLUENCE QUANTITIES for a Measurement station:
I could go on and on and on. BUT YOU CAN’T. You don’t have a clue as to the influence quantities of ANYTHING, let alone a temperature measuring station! You don’t even understand what an influence quantity *is*!
No, they can’t. Repeatability requires THE SAME ENVIRONMENT for all measurements. Since the earth is constantly receiving a changing flux and constantly sending out a changing flux there will *never* be a constant environment for measurements. Repeatability basically defines a non-changing state for the measurand. That will *never* happen with physical measurements of a constantly changing physical object.
The measurement environment has to remain perfectly constant. That is *NOT* possible in the physical meteorological world.
Nor does it make physical sense to try and compare *average* values of changing objects *IF* the difference you are attempting to identify is smaller than the measurement uncertainty. You simply won’t know if the difference exists or not.
Nor does it make sense to try and compare a mid-range metric from one changing object to another changing object.
First, the mid-range value is just that, it is defined by the maximum and minimum value, i.e. the RANGE of the data. The mid-range value is not very useful for a distribution since it ignores practically the entire data values of the distribution. It is *extremely* vulnerable to outliers that can change the mid-range value drastically. The median, the mean, the mode are far more useful statistical descriptors. But it is necessary to have at least a high level function describing the changing property in order to calculate a useful mean and median. E.g. the sinusoidal daytime temperature change versus the exponential decay at night. The average of those functions is decidedly *NOT* a mid-range value!
Second, unless the functional relationship defining the changing property of the object are the same for both, you wind up comparing apples to oranges – of course climate science could care less. They jam coastal temperatures with mountain temperatures with inland plain temperatures willy nilly!
“#2) As I told Jim, for climate analysis we are interested in derived averages/trends/ anomalies, not the accuracy of one isolated thermometer reading.”
Since the averages used to develop trends and anomalies are created from data made up of isolated thermometer readings that have MEASUREMENT UNCERTAINTY, the trends and anomalies INHERIT THAT MEASUREMENT UNCERTAINTY.
All you are doing here is parroting the idiotic climate science meme of “all measurement uncertainty is random, Gaussian, and cancels” so that you don’t have to worry about propagating measurement uncertainty up the averaging chain!
In essence you are using the unstated assumption that all stated values for temperature are 100% accurate – no measurement uncertainty need be considered.
it violates the most very basic concepts of physical science and metrology. You may as well say that averaging all the various measurements of the speed of light can be averaged to find the TRUE VALUE for the speed of light. A mission that physical science has accepted as impossible because of all the various random effects associated with measurement environments and instruments. It’s why the speed of light is, today, a DEFINED constant (rather than a *measured* constant) so that all functional relationships using the speed of light are calculated similarly.
So if I measure 100 2″x4″ boards, all of different lengths, and average the readings; the mean of those hundred lengths won’t have any measurement uncertainty?
Simply unbelievable logic. A 10 year old just learning to do averages would tell you that the calculated average from just the measured values WILL have an uncertainty.
In fact, Jim *never* said the measurement uncertainty of the average has *anything* to do with a SINGLE individual observation! It has to do with the SUM of the measurement uncertainties of ALL of the observations.
How you perform and sum (e.g. direct vs root-sum-square vs ????) is up to you. The point being that it the sum of the whole will be GREATER than any individual component. You can’t reduce the total Great Unknown by averaging component Great Unknowns. Only carnival hucksters with cloudy crystal balls can do that.
Where do you keep *YOUR* cloudy crystal ball?
“No, they can’t. Repeatability requires THE SAME ENVIRONMENT for all measurements. Since the earth is constantly receiving a changing flux and constantly sending out a changing flux there will *never* be a constant environment for measurements. Repeatability basically defines a non-changing state for the measurand. That will *never* happen with physical measurements of a constantly changing physical object.”
Where does the GUM say the environment must remain perfectly constant?
Again, Section 1.2 explicitly recognizes phenomena that depend on parameters such as time and says the measurands used to describe them can be quantities describing that dependence.
Your interpretation would make repeatability essentially impossible for most real world physical measurements, because no physical measurement environment is literally invariant at every level.
You’ve all gone off the deep end.
.
“So if I measure 100 2″x4″ boards, all of different lengths, and average the readings; the mean of those hundred lengths won’t have any measurement uncertainty?”
Yawn. This guy is talking to his wall, not us.
“In fact, Jim *never* said the measurement uncertainty of the average has *anything* to do with a SINGLE individual observation!”
Sorry, but no.
Upthread, Jim Gorman gave accuracy figures for ASOS and CRN measurements:
“Using my calculations, ASOS stations in the U.S. have a basic accuracy of ±1°C and a standard uncertainty budget of around ±1.5°C. CRN stations in the U.S. have a a basic accuracy uncertainty of ±0.3°C and a standard uncertainty budget of ±0.8°C.
Then he immediately concluded:
These values make comparisons of 0.1°C superfluous even when using the basic accuracy uncertainty.”
So, he DID take the uncertainty figures associated with the station measurements and use them to argue that comparisons on the order of 0.1C in the resulting national average aren’t meaningful.
That’s precisely what I objected to.
You cannot simply compare the uncertainty of an individual observation with a difference between derived averages.
The uncertainty of the derived average has to be calculated by propagating the relevant uncertainty components.
You are just like bellman and bdgwx – champion cherry pickers. You’ve never once sat down and actually read the GUM in detail for meaning and context. Just cherry picked bits and pieces that you think agree with your assertions!
——————-
B.2.15
repeatability (of results of measurements)
closeness of the agreement between the results of successive measurements of the same measurand carried out under the same conditions of measurement
———————
MORE cherry picking!
———————-
If the phenomenon of interest can be represented only as a distribution of values or is dependent on one or more parameters, such as time, then the measurands required for its description are the set of quantities
describing that distribution or that dependence.
—————-
The words “dependent on one or more parameters, such as time” imply that a functional relationship exists between the quanties, i.e. a dependent and an independent value defined by the functional relationship.
Can *YOU* give me the functional relationship relating time to temperature? No one else in climate science seems to be able to or they would be able to handle clouds properly!
What in Pete’s name do you think MEASUREMENT UNCERTAINTY BUDGETS are meant to include? You’ve never, not even once, prepared an uncertainty budget for a measurement routine of *anything* in the real world, have you? It’s obvious that haven’t!
Why do you think it is impossible to say that the temperature at a measuring station is constant? And can be described by a Type A measurement uncertainty?
It’s *NOT* just my interpretation. It’s the GUM”s interpretation. And *YOU JUST VALIDATED IT* by saying that no physical environment is literally invariant at every level! You just shot yourself in the foot and didn’t even realize it. It’s what comes from cherry picking!
“So, he DID take the uncertainty figures associated with the station measurements“
No! You don’t get away with changing your assertion. You said “ As I told Jim, for climate analysis we are interested in derived averages/trends/ anomalies, not the accuracy of one isolated thermometer reading.””
Now you are trying to change that into “station measurements”, i.e. MULTIPLE thermometer readings, not a single isolated reading.
You can’t even keep your own comments straight in your head let alone anyone elses!
That’s precisely what I objected to.”
His analysis is correct. If the measurement uncertainty is +/- 0.3C then it is impossible to define a difference between two measurements at the level of 0.1C. IT GETS LOST IN THE GREAT UNKNOWN. You don’t know if it exists or not!
Have you *ever* built a staircase of risers and treads and have it come up short by 1/4″ or more? Why do you think that happens? Have you *ever* built a stud wall and then used it as a support for a drywall sheet? And then have the wife ask why the damn sheet has a wave in it? Does the phrase “cut to fit” mean *anything* to you?
Under Note 2 of section B.2.15, it explains what those conditions include: same procedure, observer, instrument under the same conditions, location, and repetition over a short period. It does not say “every environmental influence must have exactly the same value.”
But it does not say “every environmental influence must have exactly the same value.”
Section 3.1.5 says explicitly that variations among repeated observations arise because influence quantities affecting the result “are not held completely constant.”
“Can *YOU* give me the functional relationship relating time to temperature? No one else in climate science seems to be able to or they would be able to handle clouds properly!”
Yes, the diurnal temperature cycle.
“It’s *NOT* just my interpretation. It’s the GUM”s interpretation. And *YOU JUST VALIDATED IT* by saying that no physical environment is literally invariant at every level! You just shot yourself in the foot and didn’t even realize it. It’s what comes from cherry picking!”
I was pointing out why interpreting “same conditions” as “perfectly identical physical environment” would make the concept practically unusable, and Section 3.1.5 confirms that the GUM does not expect all influence quantities to be completely constant.
“Now you are trying to change that into “station measurements”, i.e. MULTIPLE thermometer readings, not a single isolated reading.”
If you object to “one isolated thermometer reading,” fine. Replace it with “individual station measurements.” That changes nothing about my argument. Jim cited uncertainty figures associated with the input measurements and used them to dismiss 0.1C differences without first establishing the propagated uncertainty of the derived national average.
“Under Note 2 of section B.2.15, it explains what those conditions include: same procedure, observer, instrument under the same conditions, location, and repetition over a short period. It does not say “every environmental influence must have exactly the same value.” “
Why in Pete’s name do you think it says “repetition over a short period.”? That implies that the period over which the measurements are made needs to be short enough to eliminate “changes” from affecting the measurement – be it either changes in the environment or in the measurand itself.
If there *are* changes then the measurand also changes. Thus Type A measurement uncertainty simply doesn’t apply! The standard deviation of the measurements is *NOT* the measurement uncertainty. You must establish the measurement uncertainty of each measurement and propagate them according to something like Eq 10 in the GUM! The measurment uncertainty of the average becomes the sum of the uncertainties of the individual components – sometimes by adding root-sum-square, sometimes by direct addition, and sometimes by using a different method.
Why do you never actually QUOTE your references? Note 2 of B.2.15 says:
—————————-
NOTE 2 Repeatability conditions include:
— the same measurement procedure
— the same observer
— the same measuring instrument, used under the same conditions
— the same location
— repetition over a short period of time.
——————-
What in Pete’s name do you think the words “used under the same conditions” means?
What in Pete’s name do you think the words “the same location” means?
What in Pete’s name do you think the words “repetition over a short period of time” means.
If you aren’t concerned with having the same measurement conditions for all the measurements then why specify that they should be made over a short period of time? They could be separated by minutes, days, weeks, months, or even years using your logic!
“3.1.5 Variations in repeated observations are assumed to arise because influence quantities (B.2.10) that
can affect the measurement result are not held completely constant.”
Thus the dispersion of the reasonable values that can be assigned to the measurand has to be expanded to include the impact of the influence quantities!
STOP CHERRY PICKING STUFF YOU HAVE NO UNDERSTANDING OF!
3.16 STATES: “This lack of knowledge contributes to the uncertainty of the measurement result, as do the variations of the repeated observations and any uncertainty associated with the mathematical model itself.”
If you would READ THE GUM FOR MEANING AND CONTEXT instead of cherry picking things you think support your assertions, you would have picked 3.16 up and understand that variations of the repeated observations due to changing conditions, in either the environment or in the measurand itself, CONTRIBUTES TO THE UNCERTAINTY OF THE MEASURMENT RESULT!
Again, you try to change the subject of the debate here.
I cited 3.1.5 to challenge your earlier claim that repeatability requires a perfectly constant physical environment.
The proposition of whether influence quantities contribute to uncertainty is a completely different subject of debate.
Your quote, specifically the sentence: “as do the variations of the repeated observations” actually confirms that the GUM contemplates repeated observations that vary.
The resulting variability can contribute to uncertainty; it doesn’t mean the observations cease being repeated observations merely because influence quantities weren’t completely constant.
No one is changing anything but YOU!
Repeatability DOES require a constant physical environment.
Can’t you read at all? Your reading comprehension skills are as bad as bellman’s!
GUM:
————————-
“3.1.5 Variations in repeated observations are assumed to arise because influence quantities (B.2.10) that
can affect the measurement result are not held completely constant.”
———————(bolding mine, tpg)
tpg: “Thus the dispersion of the reasonable values that can be assigned to the measurand has to be expanded to include the impact of the influence quantities!”
That means that Type A can’t be done. You have to identify the measurement uncertainty of each influence quantity and propagate those along with the measurement uncertainty obtained from HOLDING THE INFLUENCE QUANTITIES CONSTANT, i.e. a Type A standard deviation obtained under repeatable conditions.
Of course the GUM contemplates that. It’s called PROPAGATION OF MEASUREMENT UNCERTAINTIES. It’s covered well in Section 4 of the GUM.
———————–
4.2.1 In most cases, the best available estimate of the expectation or expected value μq of a quantity q that
varies randomly [a random variable (C.2.2)], and for which n independent observations qk have been
obtained under the same conditions of measurement (see B.2.15), is the arithmetic mean or average q (C.2.19) of the n observations:
———————-(bolding mine, tpg)
————————
repeatability (of results of measurements)
closeness of the agreement between the results of successive measurements of the same measurand carried out under the same conditions of measurement
———————-(bolding mine, tpg)
I’ll tell you again the same thing I’ve told you before.
You are as bad as bellman. Scanning through texts looking for bits and pieces that you think confirm your misconceptions as truth!
Tim: “Repeatability DOES require a constant physical environment.”
Also Tim, responding to the fact that the GUM contemplates repeated observations that vary because influence quantities aren’t completely constant: “Of course the GUM contemplates that.”
And, humorously, Section 4.2 is literally titled “Type A evaluation of standard uncertainty,” while Section 4.2.2 discusses the observed variability of measurements.
If anyone is cherry picking without context here, it’s Tim.
His tactic seems to be accusing others of cherry-picking while selectively quoting the GUM himself.
Tim is right, you don’t understand what you read.
4.2 speaks to variations due to influence quantities. And Section B defines influence quantities as being *NOT* the measurand.
It’s not just that they can’t read, they refuse to read EVERYTHING and understand the definitions of what they want to lecture us on!
The usual circularity of climate pseudoscience.
Section 4.2 is about TYPE A standard uncertainty.
4.2.2 also explains *why* measurements under repeatability conditions can vary. And it says:
1.- The individual observations qk differ in value because of random variations in the influence quantities”
2.- “This estimate of variance and its positive square root s(qk), termed the experimental standard deviation” (bolding mine, tpg)
GUM:
—————————–
B.2.10
influence quantity
quantity that is not the measurand but that affects the result of the measurement
—————————–
Variation in the MEASUREMENT is *NOT* the same thing as variation in the property being measured, i.e. the measurand!
Somehow you always seem to miss this differentiation!
It has nothing to do with me cherry picking. IT HAS TO DO WITH YOU REFUSING TO READ FOR MEANING AND CONTEXT!
” without first establishing the propagated uncertainty of the derived national average.”
Of course he established the propagated uncertainty of the derived national average – at least far enough to know that it is GREATER than the measurement uncertainty of any individual data component!
If you have 100 separate measurands from 100 different stations with 100 different instruments and environments, the propagated measurement uncertainty of the average is the sum of all of the individual measurement uncertainties. The sum *will be* greater than any of the individual parts.
If the measurement uncertainty of the individual part is +/- 0.3C then you can’t discern differences less than that! Especially since the sum of 100 stations will be far larger than +/- 0.3C.
You simply can’t assume that all measurement uncertainty is random, GAussian, and cancels since this is *NOT* a Type A measurement uncertainty. It is a GARBAGE assumption that climate science makes – and apparently one that you buy into because you know so little about metrology baiscs.
“Of course he established the propagated uncertainty of the derived national average”
No, he didn’t. He wrote this:
“Using my calculations, ASOS stations in the U.S. have a basic accuracy of ±1°C and a standard uncertainty budget of around ±1.5°C. CRN stations in the U.S. have a a basic accuracy uncertainty of ±0.3°C and a standard uncertainty budget of ±0.8°C. These values make comparisons of 0.1°C superfluous even when using the basic accuracy uncertainty.”
Where is the propagation calculation, Tim?
“If you have 100 separate measurands from 100 different stations with 100 different instruments and environments, the propagated measurement uncertainty of the average is the sum of all of the individual measurement uncertainties. The sum *will be* greater than any of the individual parts.”
Sums are not averages.
And your own invocation of Equation 10 causes a problem for your statement that the uncertainty of an average must be greater than each individual uncertainty .
For an average, you have y = (x1+x2+…xn)/N so each measurement affects the average by: ∂y/∂xi = 1/N.
Then you get:
u^2(y) = N(1/N)^2u^2 = u^2(y)=u^2/N
Take the square root:
u(y) = u/√N
The average formula is NOT a relationship between differing components of a computed measurement value.
The average formula is NOT a measurement.
I don’t think an average formula is a measurement.
And Tim is the one who wants to use Equation 10 to propagate individual uncertainties into the average.
I’ll let you argue with him.
The argument is inside your skull, because you have zero understanding of metrology basics.
There is no propagation of INDIVDUAL UNCERTAINTIES into the average. There is the propagation of the uncertainty data into a value for the population.
You simply have *NO* concept of metrology, none at all.
As I told you, AN AVERAGE IS NOT EVEN REQUIRED WHEN STATING A MEASUREMENT. All you need is the uncertainty interval.
The use of the “average” comes from statisticians that have NO understanding of measurements and measurement uncertainty. It makes them “feel” better tp see an “average value” whether it is needed or not.
Climate science doesn’t even state in 99.99% of their literature what “mean” they are using! There are arithmetic means, geometric means, harmonic means, weighted means. RMS means, trimmed means, winsorized means, quadratic means, cubic means, power means. Which “mean” are *YOU* speaking of when you use the term “average”?
If you are using the arithmetic mean then it is ONLY meaningful if the parent distribution is random and Gaussian. It’s physically meaningless for multi-modal or skewed distributions.
And its only useful as a BEST GUESS for the value of the measurand. If the distributions are skewed the MODE is usually the BEST GUESS!
Whether you use one of the many mean formulas or whether you just pull it out your backside HAS NO IMPACT ON THE MEASUREMENT UNCERTAIINTY INTERVAL. NONE. None whasoever!
As long as the BEST GUESS is inside the measurement uncertainty interval and you specify how you arrived at it, e.g. I pulled it out of my a$$, it simply doesn’t matter. Of the measurement uncertainty interval is from 10 to 15 and I tell you the BEST GUESS is 14 what refutations can you offer to dispute that BEST GUESS?
As usual, you miss the whole point. The natiaonal measurement uncertainty will be GREATER than the individual uncertainties since they all add.
If the difference you are trying to discern is smaller than the individual uncertainty then it is certainly smaller than the national uncertainty.
If A<B and B<C then A<C
Simple math!
An average is created from a SUM! No sum then no average.
And now we are back to the Equivocation argumentative fallacy. Just use “uncertainty of the mean” phrase so no one will know if you are discussing measurement uncertainty or sampling uncertainty!
Then you can always claim you were talking about the other.
The *measurement uncertainty* of the average is always greater than the individual measurement uncertainty. If the sampling uncertainty, i.e. SD/√n is less than the measurement uncertainty then who cares about it? It just gets subsumed into the measurement uncertainty interval!
“u(y) = u/√N”
You are making the same mistake bellman and the rest make.
It’s {[∂(X1/N)/∂X1]* u1}+ …. –> (1/N)u1 + …..
Each input is separate and distinct. And N = 1.
Therefore 1/N = 1. Meaning your equation becomes
u1 + u2 + u3 …..
For each measurement your sample size is 1.
Again, dividing by √n is ALWAYS an estimator for sampling uncertainty, not measurement uncertainty. It is a shortcut ESTIMATE and is not even very accurate unless certain assumptions hold.
And the AVERAGE is *NOT* a measurand. It is not a part of a functional relationship. It is a STATISTICAL DESCRIPTOR. It is the result of a *functional calculation* and not a functional relationship.
GUM:
———————–
4.1.1 In most cases, a measurand Y is not measured directly, but is determined from N other quantities
X1, X2, …, XN through a functional relationship f :
————————(bolding mine, tpg)
A functional relationship is one where the output is determined by the inputs through a physical or mathematical law.
While an average may be a *function* in the mathematical sense it is *NOT* a functional relationship in the real world. There is no physical law connecting the observations to the mean. The average is an arbitrary tool for describing a collection of values into a single summary value. The “function” doesn’t even require the values to have a physical dimension!
There are all kinds of averages. They are *all* statistical descriptors and not functional relationships. There is absolutely *NO* requirement that temperatures have to be analyzed using the SUM/N statistical descriptor because there is no functional relationship involved.
“For an average, you have y = (x1+x2+…xn)/N”
Do you even have a clue as to what this is?
SUM/N IS AN AVERAGE!!! What you are finding is the AVERAGE VALUE of the Best Estimates!
The AVERAGE UNCERTAINTY IS A VALUE! It is a constant!
What is the partial derivative of a CONSTANT?
∂(SUM/N)/∂SUM = 0!!!!!!
The partial derivative of a constant is ZERO!
THINK ABOUT IT FOR ONE SECOND!
x_1 = BestEstimate1 = 10
x_2 = BestEstimate2 =20
x_3 = BestEstimate3 = 30
Average = 60/3 = 20
20 IS A CONSTANT!!!!!!
So what is the paritial derivative of this?
Your value is ∂(y=20)/∂10 + ∂(y=20)/∂20) + ∂(y-20)/∂30)
What in Pete’s name do you think this evaluates to?
Of course you can! That average has a propagated measurement uncertainty that it inherits from the component data of the data set. The difference between the average and the individual measurement will inherit the SUM of the uncertainty of the individual observation PLUS the uncertainty of the average as determined by the propagated measurement uncertainty.
If that inherited measurement uncertainty is greater than the difference between the stated values of the individual measurement and the average then you don’t know if the difference exists or not.
(6 +/- 2) – (5 +/- 2) = 1 +/- 4.
If your measurement uncertainty is 4 then how do you know the difference of 1 exists?
6 +/- 2 gives a range of 4 to 8. 5 +/- 2 gives a range of 3 to 7.
The value of 4 is a reasonable value for the first component. The value of 7 is a reasonable value for the second component. 4 – 7 = -3!!!
The value of 8 is reasonable for the first component. The value of 3 is reasonable for the second component. 8-3 = +5!
You don’t even know if the difference between the two measurements is positive or negative!
The exact same logic applies to temperature differences. If the difference is less than the measurement uncertainty YOU DON’T EVEN KNOW IF IT IS POSITIVE OR NEGATIVE!
YEP. So why do you keep denying that the measurement uncertainty can’t subsume the differences you are trying to find?
You simply can’t discern the difference between s^2(q_k) and s^2(q_bar)?
s^2(q_k) is the standard deviation of the population!
Standard error = SD(population)/ sqrt(n) ==>
SE^2 = SD(population)^2 / n
Your s^2(q_bar) is the SE^2!!!!
The SE is the variance of the MEAN, it is *NOT* the variance of the population!
The variance of the population, or the SD derived from it, is the MEASUREMENT UNCERTAINTY.
The variance of the mean is SAMPLING ERROR.
SD(population)^2 / n is an ESTIMATOR for the variance of the mean, i.e. for the sampling error. But it has numerous restrictions that must be met for it to be an adequate estimator! IT’S A SHORTCUT! But if those restrictions are not met then that estimator will get stuck in a mudhole trying to describe the variance of the mean!
You keep telling me that s(q_bar) cannot be a measure of the uncertainty of the mean. Section 4.2.3 explicitly says otherwise. See the final sentence.
Sorry, that should say s^2(q_bar).
“You keep telling me that s(q_bar) cannot be a measure of the uncertainty of the mean”
“4.2.3 The best estimate of σ 2 (q ) = σ 2 n , the variance of the mean”
NO ONE HAS TOLD YOU THAT s^2(q_bar) isn’t the variance of the mean!
Here is EXACTLY WHAT I SAID!:
——————
You simply can’t discern the difference between s^2(q_k) and s^2(q_bar)?
s^2(q_k) is the standard deviation of the population!
Standard error = SD(population)/ sqrt(n) ==>
SE^2 = SD(population)^2 / n
Your s^2(q_bar) is the SE^2!!!!
The SE is the variance of the MEAN, it is *NOT* the variance of the population!”
————————–
Show me where in those quotes that I say s^2(q_bar) cannot be a measure of the uncertainty of the mean?
I *SAID:
“Your s^2(q_bar) is the SE^2!!!!
The SE is the variance of the MEAN”
—————————–
The problem is that *YOU* can’t distinguish between the sampling uncertainty of the means, i.e. the SE or s^2(q_bar) and the MEASUREMENT uncertainty of the mean, s^2(q_k).
Again, you have not shown one lick of math that indicates that you have *any* understanding of what s^2(q_bar) *is*.
s^2(q_k) = (1/(n-1) Σ (q_j – q_bar)^2
s^2(q_bar) = s^2(q_k)/n =[(1/(n-1) Σ (q_j – q_bar)^2] / n
What do you think that gives you?
HINT: DO YOU SEE “u_k” in there ANYWHERE?
You are just like the rest of climate science. Throw away the measurement uncertainty portion of the measurement statement and come up with your own definition.
It’s the meme that “all measurement uncertainty is random, Gaussian, and cancels” at play! Just throw it away. Forget about systematic uncertainty effects.
The measurement uncertainty values are VARIANCES!
How do you divide the sum of the variances by “n” and get anything other than the average variance?
You just keep digging your hole deeper and deeper. As the saying goes, you *need* to stop digging and figure out why you are in the hole in the first place!
Note carefully what is stated. The variance of the mean! The variance in the mean is a statistic describing how well the mean will represent the population mean. It is the degree of sampling error.
Measurement uncertainty, however, is the descriptor of the variance in the observations, that is, how spread out the observations are. Here are a number of references from the GUM that should convince you that measurement uncertainty is the experimental standard deviation, that is, the dispersion of observations surrounding the mean. If you need more, let me know, I have several books here to help you out.
From the GUM
The experimental standard deviation of mean will not come close to a half-width interval.
4.1.5 The estimated standard deviation associated with the output estimate or measurement result y, termed combined standard uncertainty and denoted by uc(y), is determined from the estimated standard deviation associated with each input estimate xi, termed standard uncertainty and denoted by u(xi) (see 3.3.5 and 3.3.6).
I am confusing nothing. Uncertainty adds, always. One may assume some cancelation by adding the uncertainties in quadrature (root Sum Square).
Here are two pages from a textbook, An Introduction To Error Analysis, by Dr. John R. Taylor.
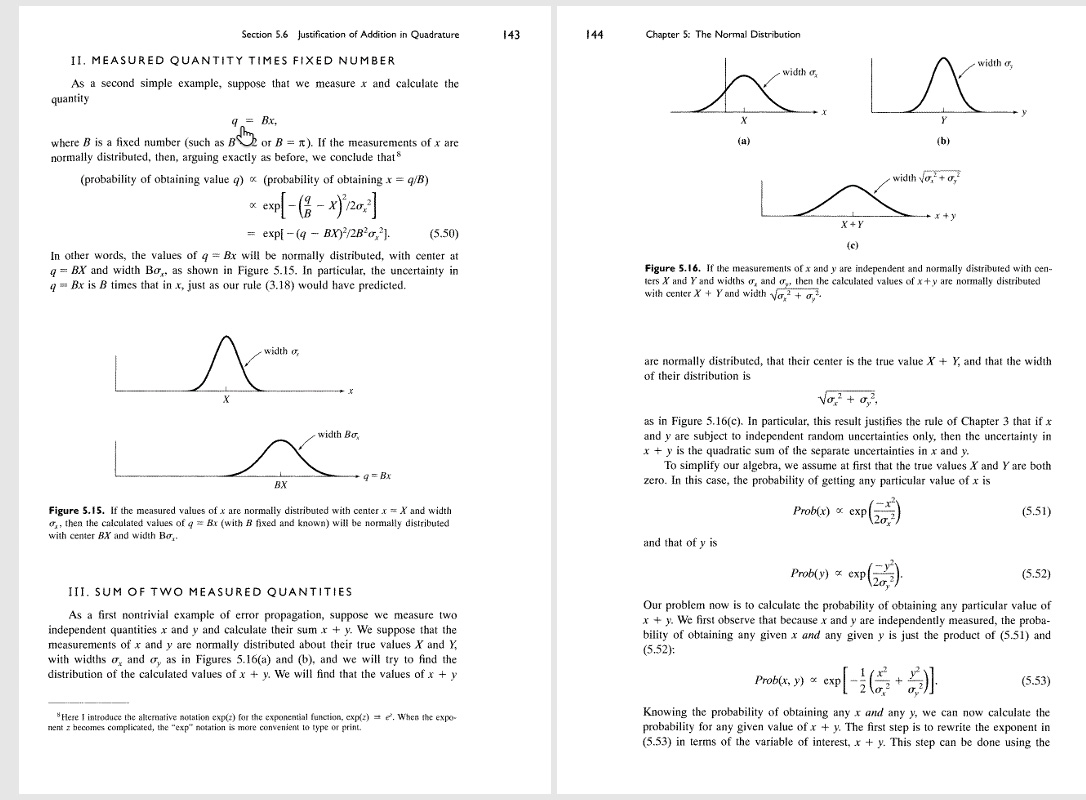
Look at Section III. SUM OF TWO MEASURED QUANTITIES. Page 144 shows what happens when you add two independent measurements. Remember each measurement is a random variable with either a Type A or Type B uncertainty, both of which have a standard uncertainty determined from an assumed Gaussian probability distribution.
Therefore, as the textbook shows, X+Y has an uncertainty of √(u(X)²+u(Y)²).
Now I know you are going to say that when you divide by “N” it reduces the uncertainty just as others here have tried. When you do that, you cannot add in quadrature. You must do a straight sum to obtain maximum values. Why?
Take three blocks 10 ±1 inches.
Three blocks end to end is 30 ±3 inches. Divide each value by 3 and you end up with the original value 10 ±1 inches.
Adding uncertainty in quadrature and then dividing by 3 will give an uncertainty of √3 = 1.7. 1.7/3 = 0.57 for an answer of 10 ±0.57 inches. This is obviously incorrect and proves the method invalid.
Uncertainty adds, always.
Pat Frank: “Who denied that uncertainty due to random error diminishes as 1/sqrtN?”
Jim Gorman: “Uncertainty adds, always.”
Why don’t you include everything I have said. Random uncertainty does not cancel by 1/√n. Sampling uncertainty of determining the mean of a population reduces by 1/√n. However that requires measuring the same thing exactly under repeatable conditions.
Look at Eq. 10 in the GUM and tell me if you see a subtraction sign. Then explain how squaring a value leaves a negative sign.
Lastly, Dr. Taylor’s textbook covers the standard deviation of the mean in Section 5.7.
“””Suppose that the measurements of x are normally distributed about the true value X with width parameter σx. We now want to know the reliability of the average of the N measurements. “””
In other words, how well does the sample mean predict the population mean. It does not change the standard deviation, the measurement uncertainty.
Are still going on about this?
“Look at Eq. 10 in the GUM and tell me if you see a subtraction sign.”
I’ve explained this to you countless times. You don’t need a subtraction sign. What you need is division, and you get that from the partial derivative.
“It does not change the standard deviation, the measurement uncertainty.”
And you still don’t get that the standard deviation of a population is not the measurement uncertainty of the population mean. If you accept that the mean is the measurand, than the measurement uncertainty of the mean is an indication of the range of values that it’s reasonable to attribute to that measurand. In other words it’s what Taylor is describing, how well does your sample mean estimate the population mean.
YMAUA — Yet More Averaging Uber Ales.
And as myself and Tim have repeatedly told you, for temperature measurements, the sensitivity factor (partial derivative) is always “1”. You also refuse to consider that a measurement of a single temperature in an average is also a single input quantity. Your division in each input quantity (a temperature) is a measurement divided by a constant. The uncertainty of a constant is “0” and plays no part in the uncertainty of that input quantity.
Y = X1/3 + X2/3 + X3/3 is an average of three separate input quantities.
The combined uncertainty of X1/3 is”
[u꜀(X1)]² = [u(X1)]² + [u(3)]² = [u(X1)]² + 0
u꜀(X1) = u(X1)
u꜀(X2) = u(X2)
u꜀(X3) = u(X3)
Using equation 10 with sensitivity of 1:
u꜀(Y) = √(u(X1)² + u(X2)² + u(X3)²)
You should note, this is not an average uncertainty. An average uncertainty is just what it says, the total uncertainty apportioned equally to each individual piece. That is not the uncertainty of the whole. Nor is it a reliable indicator for each input quantity.
An average uncertainty is very misleading. If I have 8 piston rods from a motor, determine the uncertainty of each and find the average of the 8 uncertainties, then order bushings based on the average, I’ll have some that are too loose and some that won’t assemble. It is why the GUM never mentions averaging uncertainty.
I must also make a routine comment about averaging intensive properties. Temperature is not a good proxy for the “heat energy” at any given location. Heat energy includes both sensible heat plus latent heat, or enthalpy. Enthalpy is what makes “climate” – climate.
“And as myself and Tim have repeatedly told you…”
… incorrectly.
“for temperature measurements, the sensitivity factor (partial derivative) is always “1”.”
And as I keep telling you, you are wrong. The derivative of X/N is N. It’s basic calculus. If you can’t understand why just accept it, and find an online calculator to verify it. It doesn’t matter if you are measuring temperature, or if N is a constant or not.
“You also refuse to consider that a measurement of a single temperature in an average is also a single input quantity. ”
Stop lying. Not only do I consider it, that’s the main way you would take an average. Measuring individual quantities and averaging those individual measurements
” Your division in each input quantity (a temperature) is a measurement divided by a constant. The uncertainty of a constant is “0” and plays no part in the uncertainty of that input quantity. ”
Are you really this clueless, or do you claim that Taylor etc are all wrong? It’s very basic that scaling a measurement by an exact value always scales the uncertainty by the same result. You can see this by properly evaluating the partial derivatives in equation 10, or by noting that division require relative uncertainties.
If this is wrong, then the entire rational for equation 10 would fail.
“u꜀(Y) = √(u(X1)² + u(X2)² + u(X3)²)”
All based on your incorrect assumption that the partial derivative of X1/3 is 1. Garbage in, garbage out.
Regardless – could you at least try to be consistent. Your claim here is that the measurement uncertainty of the average is the same as the uncertainty if the sum, and hence grows the mire things you are averaging. But elsewhere you claim it should be the same as the individual measurements.
“An average uncertainty is very misleading.”
Back to your usual strawmen. I am not saying the uncertainty of the average is the average uncertainty. That would imply that uncertainty does not reduce when averaging. The uncertainty of the average of 100 measurements each with an uncertainty of 1, would be 1.
“then order bushings based on the average, I’ll have some that are too loose and some that won’t assemble”
Which is why you shouldn’t do that. I can’t help your relusion that an average means everything has an identical value.it’s not what an average is telling you, and it’s not what the uncertainty of an average is telling you.
” Temperature is not a good proxy for the “heat energy” at any given location.”
And yet again, nobody says it had to be. That’s why it’s called temperature and not heat energy.
“Heat energy includes both sensible heat plus latent heat, or enthalpy.”
You are really confused about thermodynamics.
“And as I keep telling you, you are wrong. The derivative of X/N is N. It’s basic calculus.”
The derivative of X/N IS THE SAMPLING UNCERTAINTY!
How many times must this be pointed out to you before it sinks in?
You simply cannot reduce measurement uncertainty by making more and more observations! I’ve given you the quotes from Bevington MULTIPLE times about this. The more observations you make the greater the likelihood of encountering outlier values will become. That alone INCREASES measurement uncertainty!
All you can do is minimize the sampling uncertainty associated with the calculation of the average value!
That has NOTHING to do with measurement uncertainty!!!!!!
You simply refuse to use the terms “sampling uncertainty of the average” and “measurement uncertainty of the average”.
Why?
It’s because you depend on the argumentative fallacy of Equivocation to fool the reader. You hope that by not defining sampling uncertainty as what you are talking about you can convince people that you can reduce measurement uncertainty with greater “n”.
When you start using the terms “sampling uncertainty” and “measurement uncertainty” in your assertions then those knowledgeable about metrology will begin to listen. But if you assert that the sampling uncertainty of the average also defines the measurement uncertainty of the average you’ll get laughed out of the real world discussions on the topic of metrology.
“The derivative of X/N IS THE SAMPLING UNCERTAINTY!“
Completely unhinged. You really don’t understand how any of this works. What on earth do you think 1/N is the sampling uncertainty would mean?
Using the partial derivatives to modify measurement uncertainties in equation 10, is simply the result of saying that when you scale a value the uncertainty has to also be scaled by the same amount.
Equation 10 is not about sampling, it’s about propagating measurement uncertainties. You can get exactly the same result using the specific rules for adding and dividing values, as Taylor tries to explain to you.
“You simply cannot reduce measurement uncertainty by making more and more observations! I’ve given you the quotes from Bevington MULTIPLE times about this.”
I very much doubt it, given that Bevington understands what he’s talking about. Apart from anything else, you originally agreed you could take multiple measurements of the same thing to reduce the uncertainty. I suspect the quotes you are thinking of are the ones where he explains you cannot use this to improve uncertainty indefinitely. This is because there is a law of diminishing returns, as you are dividing by the square root of N, and because this won’t remove systematic errors.
“The more observations you make the greater the likelihood of encountering outlier values will become. That alone INCREASES measurement uncertainty!”
No it does not. If you only have one measurement, how do you know it isn’t an outlier? If you only have two very different measurements, how do you know which one is the outlier? The more measurements you make, the easier it is to identify outliers.
“All you can do is minimize the sampling uncertainty associated with the calculation of the average value!”
Which is what reducing the uncertainty of the average means – whether it’s from measurements or from sampling.
“That has NOTHING to do with measurement uncertainty!!!!!!”
Wow. A six explanation mark level of insanity.
“You simply refuse to use the terms “sampling uncertainty of the average” and “measurement uncertainty of the average”.”
I use them all the time. I’m just not sure you understand what you mean by measurement uncertainty of the average. Is it the process described as the experimental standard deviation of the mean – i.e. multiple measurements of the same thing under repeatability conditions to improve the uncertainty of that thing, or is it the propagation of measurement uncertainties, using equation 10, when you are averaging different things?
When you have division the relative uncertainty is
u (X1) ÷ (X1/3)
When you multiply that by 1/3 the 3 disappears entirely.
That is why the sensitivity is equal to 1.
Remember, you are the one insisting that the input quanity is X1/3. That becomes the denomimator of the relative uncertainty.
I even made an image for youl

“When you have division the relative uncertainty is
u (X1) ÷ (X1/3)”
No.
u (X1/3) ÷ (X1/3)
“That is why the sensitivity is equal to 1.”
You keep making arguments like that, as if you can simply pretend a partial derivative is something it isn’t just to get the result you want. That’s just not how maths works. If the equation is correct, you just need to figure out what each component is, and see what result you get. You can’t change what a partial derivative is, just because you want a different result.
“Remember, you are the one insisting that the input quanity is X1/3. That becomes the denomimator of the relative uncertainty.”
There is no relative uncertainty in equation 10. If you want to use the specific rule for division – i.e. add the relative uncertainties in quadrature to get the relative uncertainty of the result, then you have (I’ll change X1 to X, to avoid confusion):
u(X/3) / (X/3) = √[(u(X)/X)² + (u(3)/3)²] = √[(u(X)/X)²]
hence
u(X/3) / (X/3) = u(X)/X
Multiply by X/3
u(X/3) = u(X)/X * X/3 = u(X) / 3.
QED.
And more generally, if q = Bx, where B is an exact number with no uncertainty.
u(q) = |B|u(x)
All of this is explained by Taylor in section 3.4. I’ve pointed this out to you many many times.
Jeez, I’ve already showed you this once. The uncertainty in X1/3 is:
u꜀(X1/3) = √{[u(X1)]² + [(u(3)]²} = √{[u(X1)]² +0} = u(x1)
Again, the uncertainty of u(X1/3) = u(X1), therefore,
the relative uncertainty is u(X1/3) / (X1/3) = u(X1) / (X1/3)
and finally,
(1/
3) × [u(X1)/(X1/3) = u(X1) / X1“Jeez, I’ve already showed you this once.”
I don’t care how many times you’ve shown me the wrong answer. It’s still wrong.
“Again, the uncertainty of u(X1/3) = u(X1), therefore,”
Therefore Taylor is wrong, the GUM is wrong, Gaiss was wrong.
“u꜀(X1/3) = √{[u(X1)]² + [(u(3)]²} = √{[u(X1)]² +0} = u(x1)”
What part of using relative uncertaintors when you divide it multiply, do you not understand?
Oh yeah suuuuure you do — bellman the great expert of metrology.
“ What on earth do you think 1/N is the sampling uncertainty would mean?”
You are STILL unable to relate metrology basics to the real world. Why do you think climate science uses homogenization and infilling to increase the number of observations used in calculating an average?
It’s because the variance of the mean (as opposed to the variance of the data, i.e. the measurement uncertainty) gets smaller when “n” gets larger! But the variance of the mean is *NOT* the measurement uncertainty of the mean, it is the SAMPLING error of the mean!! For a single sample, the smaller the number of values taken from the population the less precisely you can locate the population mean. More values taken from the population leads to a better representation of the population.
If you do the math, which I know is difficult for you, the peak at the mean of the sample is related to
√n / σ(√2π)
meaning as “n” grows the curve becomes narrower with a taller peak – a more precisely located mean.
But then, you’ve never believed that an increased variance results in a flattened peak where values surrounding the mean get closer and closer to the mean – indicating an increased uncertainty in exactly which value really *is* the mean. But if you substitute σ=√var in the expression above, then it becomes obvious that the peakedness of the curve is inversely proportional to the size of the variance.
The more time you spend on here the more painfully obvious it becomes that your knowledge of statistics (and math in general) is based on rote memorization of formulas with no real understanding of what the math is actually telling you. It’s the “numbers is just numbers” meme. A transfer function with poles and zero’s doesn’t represent a landscape of mountains and valleys to you, it’s just a set of numbers. The numbers 15 +/- 1 and 2 +/- 1 have the same measurement uncertainty and contribute equally to the measurement uncertainty of their product in your statistical world. It simply doesn’t matter that one is a far more accurate measurement than the other, “numbers is just numbers”.
“Equation 10 is not about sampling, it’s about propagating measurement uncertainties.”
Again, you have no real world feel for what Eq 10 is telling you. It’s your “numbers is just numbers” meme at play, and you don’t even recognize it!
EQ 10 is *not* about the variance of the mean. It’s about the variance of the data! You ADD the variances of the data to get the total variance of the sum. There is no addition associated with the variance of the mean, there is just one number and that number is related to the number of values in the sample of the population!
The sum of the variances of the data ALWAYS GROWS. Negative variances don’t exist! The variance of the mean always DECREASES as the sample size goes up! They are polar opposites – which anyone with a feel for what the equations are telling you in the real world can easily understand!
There is no division by √n in summing the variances of the data to get the total measurement uncertainty. You *only* divide the sum by √n in order to find the variance of the mean – which means it is the SAMPLING ERROR related to the size of the sample! It tells you how much the means of different samples, even if they are of the same size, will vary. Again, it goes back to the SEM = SD/√n being an ESTIMATE, a shortcut estimate. The actual SEM is the standard deviation of the means of multiple samples.
As I keep telling you OVER AND OVER AND OVER AGAIN, you need to start specifying what you are speaking of – measurement uncertainty or sampling uncertainty. They are *NOT* the same thing and they have vastly different meanings in the real world. All you do by refusing to separate the two is invoke the Equivocation argumentative fallacy so that you can always say you were taling about the “other one”.
“Again, you have no real world feel for what Eq 10 is telling you. ”
Again, you are unable to argue without these pathetic ad homs. I think good “real world” understanding of it if you disagree, explain why rather than this pretence that you are the expert.
‘EQ 10 is *not* about the variance of the mean.”
I didn’t say it was. You were the one claiming it’s about sampling uncertainty.
“It’s about the variance of the data!”
No it isn’t. It’s about propagating uncertainties. There’s a clue in the title. The variation on the data is irrelevant unless you are multiplying or dividing values.
“You ADD the variances of the data to get the total variance of the sum.”
You need to sit down and try to explain exactly what data you are talking about. The equation involves adding the squares of the measurement uncertainties. These uncertainties may or may not be based on a type A analysis. What you are not doing is looking at the variance of the actual input quantities. If the uncertainties of two values are the same, there is no difference between adding 1 to 1, and 1 to 1000000.
“The sum of the variances of the data ALWAYS GROWS. ”
You keep forgetting the scaling factors, from the partial derivatives. You just don’t seem to get that as the partial derivative of each term in an average is 1/n, and as you are multiplying each squared uncertainty by 1/n², that will result in a sum that gets smaller the larger n is.
This is true whether you are propagating measurement uncertainties in an average, or calculating the SEM for a sample.
“They are polar opposites – which anyone with a feel for what the equations are telling you in the real world can easily understand!”
Which is the problem of you guessing what the result should be based on your “feels”. Reality doesn’t care about what you feel should happen.
“There is no division by √n in summing the variances of the data to get the total measurement uncertainty. You *only* divide the sum by √n in order to find the variance of the mean – which means it is the SAMPLING ERROR related to the size of the sample!”
Just keep speaking. All you do is demonstrate you don’t know what any of these words mean. Somehow you want the rules for averaging random variables to be different when they represent measurement uncertainty than when they represent sampling. Somehow you have convinced yourself that the GUM does not say to multiply each uncertainty by the partial derivative, or you are back to claiming the derivative if X/n doesn’t equal 1/n. Somehow you still don’t understand that you do not divide the variance of a sum by √n to get the variance of an average.
“As I keep telling you OVER AND OVER AND OVER AGAIN, you need to start specifying what you are speaking of – measurement uncertainty or sampling uncertainty.”
I keep telling you. You just refuse to listen. Equation 10 is the general equation for propagating measurement uncertainty. This can be applied to the measurement uncertainty of an average of different things as long as you are only interested in the exact average rather than an estimate of a population average. The description of the uncertainty of a sample average in estimating a population average is the SEM. That’s what I mean by a sampling uncertainty. Measurememt uncertainty would usually mean uncertainty arrising from uncertainties of the individual measurememts. Sampling uncertainty is the uncertainty caused by taking a random sample to estimate the population.
Which you abuse to claim that the simple act of forming an average reduces the variance.
“Which you abuse to claim that the simple act of forming an average reduces the variance.”
You just NAILED IT. They cannot comprehend that the uncertainty of the best guess has *NOTHING* to do with the measurement uncertainty of the data distribution.
If you know the measurement uncertainty interval you don’t even need to know the best guess in order to determine if your subsequent measurement is acceptable or not.
They can’t even conceive of the case of a skewed data distribution with a skewed measurement uncertainty distribution. The CLT will form a Gaussian distribution even from such situation and point to the mean of the distribution. BUT THAT MEAN IS USELESS PHYSCIALLY. It is *NOT* the best guess at the value of the measurand. It is far more likely that the mode is the best guess and the CLT won’t tell you that!
They have never heard of the term “hysteresis” and can’t conceive of how that can form an asymmetric measurement uncertainty interval. Increasing the number of observations in order to more precisely locate the mean of that interval IS USELESS MASTURBATION.
It’s *hard* to do. It’s much simpler to just assume all measurement uncertainty is random, Gaussian, and cancels.
It’s garbage from beginning to end.
“You just NAILED IT.”
Exactly, the variance if an average is less than the variance of a sum.
“They cannot comprehend that the uncertainty of the best guess has *NOTHING* to do with the measurement uncertainty of the data distribution.”
You are just moving the goal posts again. That’s why I keep asking you to define exactly what you mean by “measurement” uncertainty of the mean. If you are averaging a set of values, it’s because you want to know what that average is. The average is the measurand. The measurement uncertainty of the data distribution, whatever you mean by that, is not the measurement uncertainty of the mean.
“They can’t even conceive of the case of a skewed data distribution with a skewed measurement uncertainty distribution. ”
This is just pathetic. You simply can’t argue your case so you just have to resort to lying.
“The CLT will form a Gaussian distribution even from such situation and point to the mean of the distribution.”
No it won’t. The CLT says that a sampling distribution will tend to a Gaussian distribution as sample size increases. It won’t actually be a gaussan unless sample size is infinite. It’s just that in most cases with a reasonable sample size it will be close enough to Gaussian to make a reasonable approximation.
“BUT THAT MEAN IS USELESS PHYSCIALLY”
And there we have it in all caps. You are not actually disagreeing with the uncertainty if the mean, you just can’t understand how it can be useful.
” is *NOT* the best guess at the value of the measurand”
What do you think the measurand is, when taking a mean? And why are you guessing it? An estimate is not a guess.
“They have never heard of the term “hysteresis””
More lies.
“If you are averaging a set of values, it’s because you want to know what that average is. The average is the measurand.”
NO! NO! For at least the thousands time!
The average is *NOT* the measurand. It’s your best guess at the value of the measurand IF the measurement distribution is random and Gaussian!
If the measurement distribution is *not* random and Gaussian, then the average may well NOT BE THE BEST ESTIMATE.
You simply can’t seem to get it into your head that in the real world where measurements of different things using different instruments under different conditions almost NEVER produce a Gaussian distribution.
You just refuse to get outside that blackboard statistical world you live in and join us in the real world.
Do you understand at a gut level that a micrometer can give a different reading if the dial is turn DOWN from a higher reading than when the dial is turned UP from a lower reading? That gives an ASYMMETRIC measurement distribution and an ASYMMETRIC measurement uncertainty distribution! The AVERAGE of those distributions does *NOT* result in being the best guess at the value of the measurand!
Do you understand that at all?
How many times must we go through this before it sinks in?
tpg: “The CLT will form a Gaussian distribution even from such situation and point to the mean of the distribution.”
bellman: “No it won’t. The CLT says that a sampling distribution will tend to a Gaussian distribution as sample size increases.”
Do you understand just how stupid your criticism is?
“tending to a Gaussian distribution” is somehow significantly different than saying it forms a Gaussian distribution?
If the CLT does *NOT* form a Gaussian distribution then its estimation of the standard deviation of the sampling means WILL BE WRONG!
That is the sole reason for using larger sample sizes! To make the CLT get closer and closer to a Gaussian distribution!
It’s also the reason that your assertion that a single sample can give a good approximation of the mean of the population is so wrong! The CLT REQUIRES having more than one sample in order to form a Gaussian distribution. HOW DOES ONE SAMPLE MEAN FORM A GAUSSIAN DISTRIBUTION OF SAMPLE MEANS?
We’ve been down this road before. A single sample, of *any* size, will have an uncertainty greater than 20%.
It’s not obvious that either you or climate science in general have a good grasp of the statistical limitations of the SEM.
For SEM = s/√n to give an accurate estimate of standard deviation of the sample means, you must have a well-defined, stable underlying population and a representative draw from that well-defined, stable underlying population.
The population of global temperatures is so far from meeting these requirements and the sample taken from that underlying population is so small compared to the population size that there is no way to determine if the sample gives *any* accurate representation of the total population.
The global temperature is actually a *field* phenomena and not a discrete value population. The issue becomes how well one sample, regardless of size, represents the field rather than just how many observations are in that single sample.
Since that field is non-homogeneous and is continually varying, i.e. not stable, The SEM = s/√n is actually indeterminate because “s” is indeterminate.
As usual, you and climate science essentially treat the global temperature as a finite size, homogenous, non-varying population – in other words one more GARBAGE assumption.
GARBAGE after GARBAGE after GARBAGE. From one end to the other. From using a daily value defined by the temperature range rather than the temperature distribution to assuming the temperature population is finite and not a field, to assuming that all measurement uncertainty is random, Gaussian, and cancels – IT’S ALL GARBAGE!
And all you and your compatriots can do is say:
“Wow! That GARBAGE sure smells gooooooddddd!”
I hadn’t thought of it that way. It is like laying a bar magnet in a bunch of iron filings. You get a repsentation of the magnetic field. Would someone postulate taking an average of the distance from the bar to represent the magnetic strength of the total field?
You could certainly do that, but what physical meaning would the average actually have? Would it tell you the maximum distance value or the minimum distance value? The earth has a much more complicated field that varies hour-by-hour, day-by-day, month-by-month, season-by-season. The average point would move all over depending on each of these, sometimes in the N. Hemisphere and at other times in the S. Hemisphere. The oceans cover 70% of the earth. Does the Global Mean Surface Temperature (GMST) area weight the oceans much more heavily than the land? It should. Has the ocean temperature risen 1.5°C in the last 100 years.
Then why do you keep insisting that the average is the best estimate of the true value of the measurand and how close it is to the true value is described by the SEM?
Even Bevington says that once the SEM is less than the systematic uncertainty it is useless to go any further. Making the SEM smaller and smaller *is* useless once it is subsumed into the overall uncertainty interval!
AGAIN! The mean is *NOT* the best estimate unless you use the GARBAGE meme of “all measurement uncertainty is random, Gaussian, and cancels”.
You can deny you use that meme but IT IS WITH YOU IN EVERYTHING YOU ASSERT!
“More lies.”
Then show us the math that the mean of a distribution obtained using instrumentation or procedures with hysteresis is useful for estimating the value of a measuand!
Why do you NEVER show the math behind your assertions?
I remember one of bellman’s first whines about the GUM was that it deprecated the SEM and gave it a better descriptor.
Bellman doesn’t even understand what the SEM is or how to derive it from the CLT theorem. It’s a measure of the peakedness of the distribution of the sample means in the sampling distribution! I gave him the math and he, like usual, just blew it off!
SD/√n is only an ESTIMATE. It’s not taught that way in most statistical classes or textbooks. It’s just taught as the one and only metric for the sampling error. And bellman and the rest just lapped it up. It’s why he says ONE sample is all you ever need to determine how precisely you have located the mean!
And of course, after deprecating the SEM, it is never used or needed for anything in a real uncertainty analysis.
“Bellman doesn’t even understand what the SEM is or how to derive it from the CLT theorem. ”
Does this constant lying make you feel better?
“It’s a measure of the peakedness of the distribution of the sample means in the sampling distribution! ”
No it isn’t. You were claiming this a few months ago. You seemed to accept you were wrong then, but you’ve forgotten that by now.
All Gaussian distributions have the same “peakednes” however you define it peakedness is about the shape of the distribution, not its deviation. The SEM is a measure of the dispersion of sampling distribution, not it’s peakedness.
“SD/√n is only an ESTIMATE.”
Yes.
“It’s not taught that way in most statistical classes or textbooks.”
Then you went to some bad classes.
“It’s why he says ONE sample is all you ever need to determine how precisely you have located the mean!
What I have said, and will continue to say, is that you usually only use one sample to estimate the SEM. The fact you don’t even understand why that is demonstrates how bad your statistical classes were – or more likely you just didn’t understand them.
So what? BFD. A giant red herring that nothing to do with real uncertainty analysis.
You may do that for your business. However, it does not meet the strict requirements of the CLT. As Tim has pointed, it can result in a large errors in the resulting SEM.
I will tell you this, in any lab certification or in a legal case, it will not stand scrutiny. If you try to tell auditors that drawing a conclusion of the SEM from one sample and that it represents an accurate view of the accuracy of the mean, you won’t get far.
“You may do that for your business. However, it does not meet the strict requirements of the CLT.”
Show me a single definition or proof of the CLT that says it only works if you take multiple samples.
It makes no sense becasue the whole point of the CLT is to describe what a sampling distribution will tend to. If you take multiple samples in order to experimentally discover the sampling distribution, you don’t need the CLT. If you do something like that through bootstrapping or whatever, you are doing it in order to avoid having to use the CLT.
It’s like you were arguing that you can only use the Pythagorean theorem is to first measure the hypotenuse. If you know what the hypotenuse is you don’t need to use the theorem.
” As Tim has pointed, it can result in a large errors in the resulting SEM.”
You mean uncertainty of the uncertainty – yes. But how much uncertainty would there be is you split your small sample into smaller samples?
“I will tell you this, in any lab certification or in a legal case, it will not stand scrutiny.”
Could you provide a reference to certification that requires samples of samples in order to determine the uncertainty of a mean?
I just gave you one from Dr. Taylor’s book.
From Experimentation and Uncertainty Analysis for Engineers, Dr. Coleman and Dr. Steele
I would also add, in reference to my last post. This book says.
Following the methodology of the ISO Guide [9], the combined uncertainty u, for variable i is
u꜀² = S_Bᵢ² + Sᵢ² where
S_Bᵢ² = systematic uncertainty and Sᵢ² is the random uncertainty
Systematic uncertainty is never discussed in these conversations because adequate uncertainty budgets are never discussed.
None of your quotes are talking about certification, or saying that you have to estimate the uncertainty of the mean by taking multiple samples.
“From Experimentation and Uncertainty Analysis for Engineers, Dr. Coleman and Dr. Steele”
Again, that quote does not seem to be saying that basing the SEM on 5 sets of 50 would make sense. It’s just pointing out that the 5 sets would not be expected to have the same mean, and that their means would be from a probability distribution with a standard deviation of σ/ √N.
You are confusing “sampling distribution” with “single sample”. A single sample does *NOT create a “sampling distribution”.
With a single sample of size “n”, the CLT tells you how precisely you can locate the mean of the single sample. *YOU* always assume that the mean of that single sample is a perfect representation of the parent and has the exact same mean as the parent.
s/√n only closely describes the parent mean if “s” = “σ”.
And then you get into the problem that “s” is from one sample and how well it estimates σ is unknown with one sample. You need multiple samples (i.e. a sampling distribution) in order to estimate how well “s” represents σ.
This is why SEM = s/√n has it’s own uncertainty which can only be resolved with multiple samples.
AND s/√n STILL ONLY REPRESENTS THE PRECSION OF THE MEAN. It does *not* tell you anything about the variance of the data which is the measurement uncertainty – σ.
Bevington: ““It is important to realize that the standard deviation of the data does not decrease with repeated measurement; it just becomes better determined. On the other hand, the standard deviation of the mean decreases as the square root of the number of measurements; indicating the improvement in our ability to estimate the mean of the distribution.” (bolding mine, tpg)
In fact the standard deviation of the data can INCREASE with repeated measurement if it generates data further from the mean.
Your continued focus on the standard deviation of the mean only makes sense if you consider the mean to be the true value. If it is accepted that the mean is *NOT* the true value then as soon as the sampling uncertainty is less than the measurement uncertainty it gets subsumed into the measurement uncertainty and becomes irrelevant.
How do you measure volume? Can you post a picture of the instrument?
See the federal Daubert standard and Rule 702(c).
Rule 702(c): “The Testimony Is the Product of Reliable
Principles and Methods”
Using a single sample value for “s” to represent σ would require justification in order to be accepted. If the testimony involved how accurate the estimate of the mean is, then the use of multiple samples would be necessary. If you do not know the population then using the mean of the single sample as the mean of the population is questionable without multiple samples useful in showing how the estimated mean varies, i.e. the existence of a sampling distribution as opposed to the existence of a single sample. The sample size of a single sample only guarantees that you know the mean of the sample quite precisely, it is not a guarantee that you know the mean of the population precisely.
And then you would be questioned on how well the mean of the single sample represents the measurement being put forth. This requires a method acceptable for estimating the VARIANCE of the population. The SEM says *NOTHING* about how well the variance of the sample represents the variance of the measurement.
An opposing lawyer could quote Bevinton – see above. Multiple samples allows a better indication of the samples being IID.
In addition, if the legal question involves criminal or civil liability you need to show the methodology you used to apply the measurement uncertainty to create a safe and useful product.
Face it. You know nothing about the subject of methodology and refuse to learn anything about it. You keep throwing shite against the wall hoping something will stick and failing at every turn.
Give up your cherry picking and sit down with Taylor, Bevington, and Possolo and ACTUALLY WORK OUT ALL THE EXAMPLES! Read the GUM from end to end and create a journal explaining everything you’ve read.
He will continue to hide behind his facade of meaningless jargon, attempting to hide his true motivations.
“You are confusing “sampling distribution” with “single sample”.”
No I am not. I know what a sampling distribution is and I know what a sample distribution is, and they are completely different.
“A single sample does *NOT create a “sampling distribution”.”
We’ve been here many times before, and I know you will ignore all this again, but nothing “creates” a sampling distribution. It’s a probability distribution that exists in the abstract part of the universe where all abstract concepts exist. It’s the probability distribution that describes the probability of you getting a specific attribute from a single sample. You can calculate the distribution from specific assumptions, you can estimate it from a single sample, or you can estimate it by taking thousands of samples. But none of that is creating the distribution, anymore than calculating the hypotenuse of a triangle “creates” it.
“With a single sample of size “n”, the CLT tells you how precisely you can locate the mean of the single sample.”
Try to think about what you are saying. If you have a single sample you know exactly what it’s mean is, that is not the issue. What the SEM tells you is the probability of getting that sample mean from a known population, which in turn is used to infer the range of possible values the population mean may have.
“*YOU* always assume that the mean of that single sample is a perfect representation of the parent and has the exact same mean as the parent.”
Stop it. This is beneath even your dignity. Try to understand what I’m explaining rather than just make up lies like this. The sample mean is not the same as the population mean. That’s why you calculate the SEM. It’s the SEM that is telling you that they are not going to be the same, and indicates how bigger it’s possible the difference will be.
Not worth reading the rest of your post given you don’t understand that basic point.
It boils down to this. A sample means probability distribution is created from the mean values of multiple samples of size n. The standard deviation of the mean is the standard deviation of the sample means probability distribution.
You can create an estimate of the SDOM by using 1/√n, but it is only an estimate subject to large error.
In the end, the SDOM is not measurement uncertainty except under one condition and even then it cannot be used as a general uncertainty. It is only specific to the single measurand that has followed the rules of multiple experiments of size n.
“It boils down to this.”
That you never listen to what I’m saying?
“A sample means probability distribution is created…”
Wrong.
“You can create an estimate of the SDOM by using 1/√n, but it is only an estimate subject to large error.”
Have you stopped insisting that uncertainty is not error?
Regardless, you never explain how you can improve that “large” uncertainty using your method without taking many more measurements. And if you can take many more measurements, why not just take that as a single large sample with much smaller uncertainties.
“It’s the probability distribution that describes the probability of you getting a specific attribute from a single sample.”
You didn’t even bother to go cherry pick a definition! You just threw shite against the wall.
Wikipedia: “In statistics, a sampling distribution or finite-sample distribution is the probability distribution of a given random-sample-based statistic. For an arbitrarily large number of samples where each sample, involving multiple observations (data points), is separately used to compute one value of a statistic” (bolding mine, tpg)
Exactly what I said. multiple samples, each with multiple observations. In this case those multiple observations are drawn from the parent distribution to form a “sample*.
“used to compute one value of a statistic” – such as the variance of the sample means – the sampling uncertainty of the of the estimated population mean value.
From statisticsbyjim.com: “What is a Sampling Distribution?A sampling distribution of a statistic is a type of probability distribution created by drawing many random samples of a given size from the same population.” (bolding mine, tpg)
If you aren’t even going to cherry pick but, instead, just make things up then you should just leave the thread. No one will miss you. And we won’t have to be bothered with correcting you.
“What the SEM tells you is the probability of getting that sample mean from a known population, which in turn is used to infer the range of possible values the population mean may have.”
Ahhhh! Now we are back to you have a crystal ball that can peer into the Great Unknown.
If you have a *KNOWN* population then 1. how did you come to KNOW it and, 2. why are you bothering with trying to estimate the SEM? It’s ZERO! and, 3. why are you reduced to inferring *anything* about the parent population if it is a KNOWN population?
If it is *NOT* a known population then how do you know your sample is IID? Using your crystal ball again.
Please, PLEASE post a picture of that magical item that can measure volume and peer into the Great Unknow. Everyone here would like to see it!
“The sample mean is not the same as the population mean. That’s why you calculate the SEM. It’s the SEM that is telling you that they are not going to be the same, and indicates how bigger it’s possible the difference will be.”
And why do you care about “how bigger” (or smaller) if that difference is subsumed into the measurement uncertainty of the data?
Malarky! The variance of the sample mean is σ^2/n. If the variance is small then the sample means are tightly clustered around the population mean. That tight clustering generates a very peaked distribution. A wider variance gives a wider spread and a less peaked distribution.
I have *always* said this and am still saying it. *YOU* deny that a distribution with a narrow variance has a smaller uncertainty as defined by the spread of the sample means obtained from the sampling distribution. You were wrong then and you are wrong today!
It is *all* based on having multiple samples which give an “n” value for the number of sample means in the distribution of sample means. The more samples you have the greater “n_sample-distribution” becomes. and the more peaked the distribution of sample means will become. I.e. the location of the population mean from sampling becomes more precise with less uncertainty.
Your continued denial of this simple statistical truth is just more evidence of your lack of training in statistical analysis. You try to generate the aura of being an expert in statistical analysis but every assertion you make on here just puts the lie to that representation!
“Malarky! The variance of the sample mean is σ^2/n. ”
Which has nothing to do with peakedness.
“*YOU* deny that a distribution with a narrow variance has a smaller uncertainty as defined by the spread of the sample means obtained from the sampling distribution.”
Astonishing. The smaller the variance the smaller the standard deviation, and hence the smaller the uncertainty. Why do you think that’s what I’m denying?
“It is *all* based on having multiple samples which give an “n” value for the number of sample means in the distribution of sample means. The more samples you have the greater “n_sample-distribution” becomes. and the more peaked the distribution of sample means will become. ”
You really don’t understand any of this. The number of samples will not change the sampling distribution, anymore than the size of a sample doesn’t change the standard deviation of the sample? In both cases the distribution should tend to the parent distribution as n increases.
“Your continued denial of this simple statistical truth is just more evidence of your lack of training in statistical analysis. ”
Make your mind up. Half the time your insult is that I’m a statistics who only understands statics rather than the real world, and the other half it’s I’m bad at statistics even when they agree with the real world.
“The number of samples will not change the sampling distribution, anymore than the size of a sample doesn’t change the standard deviation of the sample?”
Even after all the references I gave you on what a sampling distribution is you just keep on denying that a sample distribution is made up of multiple samples drawn from the parent distribution. Of course adding samples will change the standard deviation of the sample means distribution generated from the sampling distribution unless each and every sample is IID with the parent distribution.
In essence all your assertion boils down to is that one sample is as good as multiple samples. You don’t need multiple samples to verify IID requirements – you just ASSume your single sample is IID. That might be ok in statistical world but it just doesn’t cut it in the real world.
This is just MORE proof of your lack of understanding of statistics. There is a reason why the GUM defines variance as the measurement uncertainty metric. Based on this assertion of yours EVERYTHING would then have exactly the same measurement uncertainty since the peakedness is always the same. The kurtosis of a normal distribution may be constant but the density of the clustering around the mean is not, i.e. the variance.
The variance is related to (x_i – μ). The greater the difference generated by the relation the higher the variance. The more tightly the values are clustered around the mean (μ) the smaller the variance becomes and the narrower the distribution becomes surrounding the mean. That generates a more peaked distribution around the mean.
This is *NOT* the same thing as the statistical descriptor known as “kurtosis”. The kurtosis descriptor is far more sensitive to the tail values while the density of clustering around the mean is not affected by the tails as much, it is related to the variance. Kurtosis is more sensitive to the tails because it is the 4th power instead of just the 2nd power.
For at least the 5th time, s^2/sqrt(n) is an ESTIMATE. It is not nearly as accurate as is the variance of multiple samples of the parent. It depends on how well “s” of the sample represents σ of the population. Assuming they are the same is just one more garbage assumption and the number of data entries in the single sample cannot fix that especially when the parent population has an almost infinite size and the ratio between the size of the single sample vs the size of the population is very low. A single sample of sufficient size can give a pretty good estimate of the population mean but it cannot provide a good estimate of the variance of the population – which is what the measurement uncertainty is, not the variance of the mean.
You still deny what Bevington says: “It is important to realize that the standard deviation of the data does not decrease with repeated measurement; it just becomes better determined. On the other hand, the standard deviation of the mean decreases as the square root of the number of measurements; indicating the improvement in our ability to estimate the mean of the distribution.”
It is the standard deviation of the DATA that is the measurement uncertainty, not the sampling uncertainty of the mean!
Your continued inability to separate the two has to be willful ignorance. This has been explained over and over to you yet you continue to deny it.
One more time- how precisely you locate the mean of the data is irrelevant unless one believes the mean represents a “true value” instead of just a Best Guess at a central point in the measurement uncertainty interval. If the measurement data is not perfectly Gaussian or the measurement uncertainty profile is not perfectly Gaussian, the mean is *not* the Best Guess, it only represents a convenient reference point that can be calculated conveniently. “Convenience” of calculation does *NOT* have any meaning when it comes to predicting the value of the next measurement. If you can’t predict the value of the next measurement by using the mean then it is useless to waste time on calculating it to a precision greater than the measurement uncertainty. The “mean” of a Type A experimental measurement evaluation may be a good predictor of the mean of a subsequent Type A experimental measurement evaluation because the mean is a measure of the balance point of a distribution, a center of mass. This may not change much in subsequent evaluations but it will *NOT* be a good predictor of the next measurement value unless the first and subsequent distributions are all Gaussian.
Let me repeat. You have *no* real understanding of statistical analysis. You have the climate science dogma of “all measurement uncertainty is random, Gaussian, and cancels couples with “numbers is just numbers”.
I can only hope that others are reading these exchanges and taking advantage of learning some metrology basics. I have no hope whatsoever of curing you of your willful ignorance.
I had a mathematician friend who clued me that the symbol commonly used for expanded uncertainty, U95, is misleading and incorrect because in general the distribution for an uncertainty interval is unknown (and assumes a Gaussian). He recommended using U_k=2 instead.
Your mathematician friend could teach a lot of climate scientists a thing or two!
He could, but they would likely reject it en masse.
“This is just MORE proof of your lack of understanding of statistics.”
Then you provide a statistical document that defines peakednes in terms of the standard deviation.
Here’s a link to the last time we went through this
https://wattsupwiththat.com/2026/05/07/uah-v6-1-global-temperature-update-for-april-2026-0-39-deg-c/#comment-4193484
Where you claimed
And claimed that for a rectangular distribution
Before eventually admitting that
“Then you provide a statistical document that defines peakednes in terms of the standard deviation.”
P( |X – μ| <kσ ≥ 1 – (1/k^3)
The smaller the variance the more tightly the distribution must be concentrated around its mean.
What are Mean and Variance of the Normal Distribution?
The very formula for Variance = E[ (x-μ)^2 ] is an indicator that variance getting smaller means the x values are clustering more tightly around μ. This makes the peak around the mean, μ, more pronounced.
I know you won’t accept these since they contradict your misconceptions. But they are *fact*. And they *do* apply to statistical analysis of measurement data.
You just keep digging your hole deeper and deeper. That’s ok, keep digging. When the light goes out you’ll know what caused it to happen!
“P( |X – μ| <kσ ≥ 1 – (1/k^3)”
What is that meant to mean. It looks like Chebyshev’s inequality, but with missing brackets and a cube rather than a square.
““Changing the Variance: The curve widens or narrows. A smaller σ^2 results in a taller peak, while a larger σ^2 flattens the curve.””
Which is not defining “peakedness”. If all you mean is the variance, why not just say the variance?
“Which is not defining “peakedness”. If all you mean is the variance, why not just say the variance?”
You are still stuck in your statistical world where “peakedness” can only be the statistical descriptor of “kurtosis”.
We in the real world look at the clustering of values around the mean, i.e. the density of the values surrounding the mean, as the peakedeness that describes the UNCERTAINTY of the mean.
If I mis-typed the equation from memory, it really doesn’t matter. The point is that (x – μ) factor.
Think of it this way. The probability density gets more peaked the probability of the mean peaks. It’s proportional to 1/σ. As variance (and σ) gets smaller the probability at the peak stands out more from the surrounding values. In the limit you would get a point with an undefined derivative at the peak – i.e. the mean would really stand out. You get a mountain peak as variance goes down instead of a rolling hill where surrounding values are almost the same probability as the mean – so which one is the *real* mean?
Variance of the data really *is* the metric for uncertainty. The GUM knows that, I know that, Taylor knows that, Bevington knows that – but you keep on denying it.
s/sqrt(n) only tells you how well you estimated the population mean via uncertain sampling. σ tells you the uncertainty of that population mean whether you estimated it correctly or not. They are *NOT* the same thing.
For at least the THIRD time in just this sub-thread, the MEASUREMENT uncertainty is the distribution of reasonable values that can be attributed to the measurand. If the mean is inside that distribution, then the distribution describes the mean just as it does any other value in that distribution! The distribution is the definition of what you can discern about the measurand from the DATA you have collected about it.
What you can discern about the measurand is *NOT* based on how precisely you can calculate some statistical descriptor that may not even predict the most common value collected on the measurand.
At this point it’s obvious that you ae just being willfully ignorant. It’s not a matter of you being unable to learn, it’s a matter of you REFUSING to lean.
ROFL!! You keep saying you don’t confuse “true value” and “best estimate” but here you are, once again, making an assertion that is based on that exact meme!
If the Best Estimate is not a GUESS and it is not the “true value” then what is it? Pick one and stick with it!
Absolutely — he does not want to acknowledge the truth because it would sink his tiny air temperature trends. So instead he tries to “debate” with Stokesian nits, changes-of-subject, bizarre language, smoke-and-mirrors.
In other words, sophistry.
“No it won’t. The CLT says that a sampling distribution will tend to a Gaussian distribution as sample size increases. It won’t actually be a gaussan unless sample size is infinite”
And now you are reduced to nitpicking! As *you* pointed out – the mean won’t change significantly as you add more sample means to the distribution. But the standard deviation WILL. So the better you define the distribution of the sample means from the sample distribution the result won’t change the average much but the standard deviation *will*.
So you don’t need to have as many observations to estimate the population mean as you do to maximize the peakedness of the distribution, i.e.mimize the SEM. You don’t need an infinite number of observations to find the “best guess”.
And if that SEM is less than the measurement uncertainty of the data it’s still nothing but mathematical masturbation – it doesn’t mean anything since it is subsumed into the measurement uncertainty!
“And now you are reduced to nitpicking!”
It’s not nitpicking. With small sample sizes, and non-Gaussian distributions you cannot simply assume you automatically have a Gaussian sampling distribution.
“As *you* pointed out – the mean won’t change significantly as you add more sample means to the distribution.”
It’s not the mean that’s the issue, it’s the shape of the distribution.
” But the standard deviation WILL.”
It’s not the standard deviation – but the SEM and the shape of the distribution that will change with sample size.
“So you don’t need to have as many observations to estimate the population mean as you do to maximize the peakedness of the distribution”
What do you mean by peakedness? It’s obviously nothing to do with any standard definition. As you agreed last time, the peakedness index of a Gaussian distribution is always the same, regardless of its SD.
“You don’t need an infinite number of observations to find the “best guess”.”
Stop this obvious trolling. You know full well that it is not a guess, but an estimate.
Irony Alert, Level 9.
Here is the crux of your problem.
How many Tmax temperatures are in a month? Is that the whole population? If it is, why are we estimating the precision of the mean using the SEM. Is the standard deviation of the population estimated or the calculated value?
Do the individual observations of a monthly Tmax also have measurement uncertainty? Of course they do. This is why GUM F.1.1.2 and H.6 are important. You are obtaining observations of a non-homogenous property.
“I very much doubt it, given that Bevington understands what he’s talking about.”
How many more times do I have to provide Bevington’s actual text on the subject before you internalize it?
This is EXACTLY why I keep telling you that you need to specify whether you are speaking of measurement uncertainty or sampling uncertainty. Measurement uncertainty is *not* dependent on the sample size. Sampling uncertainty *is* dependent on the sample size.
The two are equivalent ONLY when the data is random, Gaussian, and meets repeatability restrictions. That happens almost NEVER in the real world. Even certified calibration labs put out reports that include a MEASUREMENT UNCERTAINTY value – MEANING THAT NO MATTER HOW MANY TIMES THEY MEASURE THE OBJECT IN QUESTION THE MEASURMENT UNCERTAINTY NEVER GOES TO ZERO! Sampling uncertainty can be reduced to a level approaching zero with enough observations. MEASUREMENT UNCERTAINTY can *NOT*.
This is just one more example of you having no understanding of the real world. You live in a statistical world where only the blackboard exists and any assumption you want to make about how measurements work is just fine. “Numbers is just numbers”!
“How many more times do I have to provide Bevington’s actual text on the subject before you internalize it?”
Once should be enough, if you can actually find a quote that agrees if what you are claiming.
“Once should be enough, if you can actually find a quote that agrees if what you are claiming.”
You’ve already been given it TWICE. That would be enough for most people but your memory is apparently very bad.
Bevington:
‘The phrase “nonstatistical fluctuations” can hide a multitude of sins, or at least problems, in our experiments. It is a rare experiment that follows a Gaussian distribution beyond 3 or 4 standard deviations. More likely, some unexplained data points, or outliers, may appear in our data sample, far from the mean. “
The more observations you make the greater the chance that these “nonstatistical fluctuations” will occur. It could be caused by nonstatistical fluctuations occurring in the measurement device, in the recording of the measurements, or even in the measurand itself. For instance, in a volume of gas the temperature is not homogenous throughout the volume. Movement of the gas at the macro level in the volume can cause random fluctuation in the temperature reading. The more observations you make the more likely you are to encounter the very most energetic part of the gas and the least energetic part of the gas at the micro level.
Not only can this affect the mean of the distribution it can affect the standard deviation of the distribution. They may or may not be caught by “outlier” analysis. In fact, some measurements may be missed entirely due to nonstatistical fluctuations in the measurement device or protocol thus creating holes in the distribution that can *NOT* be caught by outlier analysis.
In Bevington’s very first chapter, in Section 1.1, he states:
“There are practical limits to these improvements. In the measurement of the length of the table of Example 1.1, the student might attempt to improve the precision of his measurements by using a magnifying glass to read the scale, or he might attempt to reduce statistical fluctuations in his measurements by repeating the measurements several times. In neither case would it be useful to reduce the random errors much below the systematic errors, such as those introduced by the calibration of the meter stick or the correction for his initial faulty reading of the scale.”
By ignoring the systematic uncertainty of the temperature measuring devices you and climate science attempt to use the sampling uncertainty as the measurement uncertainty because it can be arbitrarily reduced with more measurements. That is how you and climate science attempt to justify being able to find differences in temperatures in the hundredths digit from data with systematic uncertainty in the tenths or unit digit.
It’s the meme of “all measurement uncertainty is random, Gaussian, and cancels”.
No provision for systematic uncertainty at all. It’s just arbitrarily reduced to zero so it can be ignored.
GARBAGE AFTER GARBAGE AFTER GARBAGE! From statisticians who see “numbers is just numbers”.
Yes, that’s the section of Bevington I thought you meant. I even quoted it to you just now. The problem is still what I originally told you, you are seriously misunderstanding it.
He is not saying measurement uncertainty increases with the number of measurements, or you can’t reduce measurement uncertainty by averaging multiple measurements. What he’s saying is there are limits as to how far you can take this before it ceases to be useful.
“The more observations you make the greater the chance that these “nonstatistical fluctuations” will occur.”
And the less important they will be to the overal average. Having a small number of observations means you have less chance of getting an outlier, but if you do it will make your average much worse, and will be more difficult to detect. Having a large sample means you are more likely to get a number of outliers, but there overall effect will be smaller, and they are easier to detect.
Your point about systematic error is a better point, and one I keep making. But it still doesn’t mean that uncertainty doesn’t improve with larger samples, just that any improvements will be limited by the systematic error. As Bevington points out, there’s little point improving the precision to the hundredths of a unit if the accuracy is only one unit.
Your problem is none of this justified any of your arguments, the ones I keep questioning you about. First you claimed that the measurement uncertainty of an average increased due to the random independent uncertai ties in each measurement. Then you switch to saying the measurent uncertainty of an average is the variance of all the values. Then when those claims fail you suddenly start saying, but what about systematic errors – followed by lies about me not believing they exist.
It’s a disingenuous way of arguing.
I am seriously certain the misunderstanding lies elsewhere.
Not possible to argue with climastrology trendologists…
“He is not saying measurement uncertainty increases with the number of measurements, or you can’t reduce measurement uncertainty by averaging multiple measurements.”
You *still* aren’t reading for comprehension!
I’ve already given you the quotes that the greater number of observations you make the higher the odds are of obtaining an outlier – which can be a point far from the average or can be a missing data point
Bevington also has this statement, part of which I’ve already provided you.
“Removing an outlying point has a greater effect on the standard deviation than on the mean of a data sample because the standard deviation depends on the squares of the deviations from the mean”
So Bevington says both that with more observations you *will* get more outliers and that those outliers have a larger impact on the measurement uncertainty (i.e. on the variance) than on the mean!
The conclusion is that the the larger the number of observations you make the greater the measurement uncertainty will become. EXACTLY what I said – because *I* have studied Bevington for meaning and context and not just as a cherry tree.
And he *does* say you can’t reduce measurement uncertainty by averaging multiple measurements.
He derives the exact same equation for the propgation of measurement uncertainty of different measurements as the GUM has. It’s in Equation 3.14 in my book.
For two different measurements u and v his equation is:
σ_x^2 = σ_u^2 (∂x/∂u )^2 + σ_v^2 (∂x/∂v )^2
Just like the GUM!!!!!!
NO AVERAGING. NO DIVIDING BY sqrt(n). No dividing by (n).
Even in Type A experimental situations you do *NOT* average measurement uncertainties to reduce the measurement uncertainty! THERE IS NO MEASUREMENT UNCERTAINTY FOR EACH MEASUREMENT. The distribution of the measurements determines the standard deviation of the measurements which is the MEASUREMENT UNCERTAINTY. You average *nothing*. No “n”. No sqrt(n). No “n” at all. No “n” anywhere!
What average? Do you mean the BEST ESTIMATE of the value of the measurand?
The measurement uncertainty is the VARIANCE OF THE DATA, it is not the average of the DATA!
You just said “the less important they will be to the overall average”!!!! So which is it? Pick one and stick with it!
No you don’t. You *NEVER* make that point. If you did you would understand that the systematic uncertainty cannot be analyzed using statistical methods – including averaging!
And here we go again with the Equivocation fallacy. Which UNCERTAINTY are you speaking of? The sampling uncertainty or the measurement uncertainty.
THE MEASUREMENT UNCERTAINTY WILL *NOT* IMPROVE WITH LARGER SAMPLES!!!
You *need* to get that into your head some day. You *still* haven’t studied the CLT, it’s implications, and what it means for the ability to locate the mean of a population. GOT THAT? “LOCATING THE MEAN”.
How precisely you locate the mean of the population has NOTHING to do with the measurement uncertainty! Got that? NOTHING!
You cannot decrease measurement uncertainty using statistical analysis. It ADDS. It *always* adds. It’s a metric for the capability of the measuring process and equipment. It is *NOT* sampling uncertainty.
The mean is not even the BEST ESTIMATE in many actual physical situations – so how precisely you locate it is meaningless! And it only applies if the population is random, Gaussian and stable! You don’t even understand the restrictions that go along with the CLT let alone what the metric it provides for actually is! It’s how peaked the distribution of the sample means are. Nothing more. It has NOTHING to do with measurement uncertainty. It is *NOT* a metric for the standard deviation of the data.
You can’t even read what I write. You just make this all up as you go along!
The measurement uncertainty is associated with the MEASUREMENT. The average is *NOT* the measurement. The average is just a BEST GUESS at the value of the measurand. As such, it is associated with the measurement uncertainty of the MEASUREMENT. Which is the standard deviation of the distribution.
As I keep telling you, you don’t even *need* the Best Guess value in order to know if your subsequent measurement fits in the dispersion of the reasonable values for the measurand. If you don’t know what the Best Guess is but your measurement is in the uncertainty interval IT IS A REASONABLE VALUE ATTRIBUTABLE TO THE MEASURAND BY DEFINITION.
How does finding out how closely you have located the mean help you in any way in determining if your subsequent measurement is acceptable?
Stop being willfully ignorant. It’s the worst kind of ignorance there is.
The measurement uncertainty IS A VARIANCE. It says so right there in the GUM. That variance represents an interval. Any value in that interval is reasonable – BY DEFINITION. If the average lies in that interval then it is associated with the interval – it’s just one of an infinite number of acceptable values.
Get the damnable memes of “true value +/- error” and “all measurement uncertainty is random, Gaussian, and cancels” OUT OF YOUR HEAD!
Until you do you aren’t going to understand measurement uncertainty at all!
The average of a set of Best Estimates is *not* the true value. How closely you locate the population average doesn’t make it any closer to being the true value. The metric for how close you are to the population average is *NOT* a metric for “error”.
Got it?
Repeat that back! Write it on your statistics blackboard 100 times. Maybe it will sink in!
“No it does not. If you only have one measurement, how do you know it isn’t an outlier?”
You *still* don’t understand measurement uncertainty! The measurement uncertainty of one single measurement is driven by the measurement uncertainty of the instrument and the environment. It requires the use of a Type B measurement uncertainty budget!
This just highlights your continued stubbornness in refusing to study the GUM and other metrology texts for meaning and context.
GUM:
———————-
3.1.1 The objective of a measurement (B.2.5) is to determine the value (B.2.2) of the measurand (B.2.9),
that is, the value of the particular quantity (B.2.1, Note 1) to be measured. A measurement therefore begins
with an appropriate specification of the measurand, the method of measurement (B.2.7), and the
measurement procedure (B.2.8).
———————–
Whether a measurement is an outlier or not is determined by the appropriate specification of the measurand. This would include specifying the boundaries (positive and negative) expected for the measurement.
The “outlier” condition is determined by the specification of the measurand and *NOT* by the measurement uncertainty of the instrument (i.e. the method of measurement) or the measurement procedure.
If your measurement lays outside the expected value of the property being measured then it is the OBJECT that is the outlier, not the measurement itself!
You keep throwing shite against the wall hoping something will stick. All that is actually happening is an exposition of your lack of basic understanding of metrology principles. You can’t even distinguish between an object being measured and the measurement itself!
“The measurement uncertainty of one single measurement is driven by the measurement uncertainty of the instrument and the environment.”
I was asking about outliers. That’s different from a tye B measurement uncertainty. An outlieright come from writing 71 when you meant 17. Your type B uncertainty isn’t going to include all possible outliers, and if it did they wouldn’t be outliers.
“This would include specifying the boundaries (positive and negative) expected for the measurement. ”
Then outliers are not a problem, they can just be rejected in any analysis.
Huh? You just made this mess of dog food up and spilled it on the kitchen floor.
Thank you for finally admitting you have zero clues, experience, and understanding of formal uncertainty analysis. But I’m confident you’ll keep right on puffing up your chest and hollering like you’re the world’s expert.
N.B. — This mess is from the person who claims to use Type B uncertainties “all the time”.
All you have done here is point out that you have no idea of what specifying the measurand means.
Transcription errors are not MEASURMENT OUTLIERS!
Both Taylor and Bevington have entire chapters on this subject. My guess you haven’t studied either one for meaning and context.
“Transcription errors are not MEASURMENT OUTLIERS!”
I said it was an example of an outlier. From Bevington
A statistical fluctuation is *NOT* always an outlier. Once again, you cherry pick and refuse to read for context and meaning. A statistical fluctuation CAN ALSO BE A HOLE IN THE DATA!
Consider a transcription error where you leave out a data value. How do you identify that and account for it? The more observations you have to transcribe the higher the risk of skipping a line!
THESE ARE TRANSCRIPTION ERRORS, they are *NOT* measurement outliers. Transcription errors can be identified and FIXED, Measurement outliers can sometimes be identified but they can *NOT* be fixed.
Remember, Bevington also states:
“In any given time interval there is a finite chance of any positive (or zero) integral number of events.”
“We should be very cautious about changing data unless we are confident that we understand the source of the problem we are seeking to correct, and repeated point deletion is generally not recommended”.
Once again: READ THE ENTIRE BOOK FOR MEANING AND CONTEXT. STOP CHERRY PICKING!
Yes, it is an outlier. It is commonly called a “blunder”. It is usually caught by data quality checks.
As I said, it covers a multitude of sins. The problem you still won’t address is why they make large samples more uncertain than small ones.
Who cares? Absent the context of an actual uncertainty analysis of a real measurement, it is meaningless.
bellman believes the mean of a set of measurements is the TRUE VALUE. The more precisely you can locate the mean the more precisely you can know the TRUE VALUE. He’s never been able to understand measurement uncertainty because he refuses to abandon the “true value +/- error” meme. Just like he can’t abandon the “all measurement uncertainty is random, Gaussian, and cancels” meme.
gorman believes if he repeats a lie often enough people will believe it’s TRUE.
The truth is you try to keep whatever nonsense it is that you believe obfuscated under a cloud of meaningless jargon.
Here is what Dr. Taylor says about the Standard Deviation Of the Mean (SDOM) derivation. It explains why the size of a sample is important and why multiple samples are important.
The big things here is multiple experiments (samples) each with “n” measurements. Exactly what the CLT requires. Dr. Taylor also points out that each sample must have the same mean and same σ for the derivation to work. Temperature measurements at weather stations will never meet these requirements. The value of ‘n’ will always be ‘1’. The measurement uncertainty of single measurements will always require an uncertainty budget. Combined uncertainty will have the uncertainty of each measurement propagated into an average and the standard deviation of the measurements will be added also per F.1.1.2 and H.6.
“Here is what Dr. Taylor”
Try answering the question. Nothing in your lengthy cut and paste says anything about why outliers will make larger sample sizes less certain than small samples sizes.
And you still don’t get that just because Taylor uses the concept of taking multiple samples in his proof, and to illustrate what a sampling distribution is, that does not mean you actually have to take multiple samples in order to calculate the “SDOM”. If you want illustrations of how you actually use it look at the examples in 4.5.
“And you still don’t get that just because Taylor uses the concept of taking multiple samples in his proof, and to illustrate what a sampling distribution is, that does not mean you actually have to take multiple samples in order to calculate the “SDOM””
You are a willfully ignorant troll.
The mere fact that the data points in the sample each have an uncertainty component in addition to the estimated value (which are used to define the standard deviation) makes the standard deviation “s” itself uncertain.
Statisicians use a blackboard assumption that a single sample is *always* perfectly representative of the population and thus “s” = “σ_population”. It’s just one more garbage assumption that *never* holds in the real world because each data point in the sample is uncertain. It requires the use of the GARBAGE assumption of “all measurment uncertainty is random, Gaussian, and cancels”. You just can’t get that meme out of your head.
“You are a willfully ignorant troll.”
He says, before going of on another rant which ignores my point.
You do not have to use multiple samples to estimate SDOM. There would be no point in explaining the equitation for estimating SDOM if you never used it. Taylor gives examples of how to use the equation with a single sample. See the examples in 4.5.
Will there be uncertainty in your best estimate of SDOM when using a sample SD? Yes.
Does that mean the estimate using the sample will not be the best estimate given the data you have? No, it’s still your best estimate given the data.
Would it be better to take multiple samples to estimate SDOM. No. Splitting the data into subsets still leaves you with uncertainty. You are still estimating SDOM from a sample standard deviation. But more importantly you are now getting SDOM for a smaller sample size.
Are there any advantages of determining SDOM experimentally, from samples of samples. Yes, but this will always be at the expense of having to take many more measurements. Maybe this is done in the laboratory conditions the Gormans are used to, where time and money is not an issue. But in the real world you have to always balance the desire to have the most accurate result, with the cost and harm that too much sampling can do.
Where the experimental approach works is when you do it in simulations. That’s where Monte Carlo techniques come in.
HAHAHAHAHAHAHAHHAH — please stop its too much.
I have highlighted the operative word in your sentence.
The issue is how well that estimate describes the distribution. You are asserting that a single, sparse sample of a large population can represent that population than multiple samples using sparse sampling.
It’s a joke from beginning to end and you simply can’t grasp that!
The SDOM *can* be useful in severely restrictive situations. Commonly known as Type A measurement uncertainty situations – and even then calibration labs *still* put out certificates containing uncertainty statements for their results. But you refuse to grasp what those severe restrictions consist of and how they must be applied in the real world.
No one cares about your blackboard, statistical world where you can assume systematic uncertainty doesn’t exist and every distribution is random and Gaussian and all measurement uncertainty cancels. We don’t *live* in that world of yours. Neither do you – but you can’t shed the delusion that you live in a blackboard, statistical world.
Then why are you such a champion of single samples being the only way to do things no matter what they are?
And why do you continue to champion the SDOM when it gets subsumed into the measurement uncertainty of the data distribution making it irrelevant?
Why do you assume that the SDOM gives the BEST ESTIMATE of the next measurement when, in the real world, it is far more likely to encounter a skewed distribution of measurements than a Gaussian one?
Wrong. It’s *always* better. The issue isn’t whether it would be better. The issues is one of “IS IT NECESSARY”.
If your estimate is going to be subsumed into the measurement uncertainty of the data YOU DON’T NEED IT to begin with! No one really cares if 12.2 or 12.5 is the *BEST ESTIMATE* if the measurement is given as 12 +/- 1!!!! Both 12.2 and 12.5 are within the measurement uncertainty interval and are reasonable values to attribute to the measurand.
Yet you and climate science somehow think that the difference of 0.3 is somehow significant and accurate – WHEN YOU DON’T REALLY KNOW IF EITHER ONE IS THE TRUE VALUE!
So what? If that uncertainty is subsumed into the measurement uncertainty of the data it’s meaningless to begin with! You and climate science just blow away the measurement uncertainty and ignore it. THAT is why the SDOM means so much to you!
You say you never use the meme of “all measurement uncertainty is random, Gaussian, and cancels” yet here you are USING IT!
It’s why you absolutely refuse to use the terms “MEASUREMENT” uncertainty and “SAMPLING” uncertainty unless forced to. You even have a hard time admitting that the SDOM *is* sampling uncertainty and not measurement uncertainty!
The standard deviation of the single sample is *NOT* a very good estimator of the SD of the population unless you just ASSume it to be. Justifying that ASSumption requires MULTIPLE samples with multiple variances to be compared to see what the distribution of the variances are. If you will, a sampling distribution of the variances instead of the means.
The problem with this for you and climate science is that if you start figuring variances it will demonstrate that the measurement uncertainties associated of all the components combine into a total that makes finding differences in the means out to the hundredths digit into a joke! Enter again, stage left – “all measurement uncertainty is random, Gaussian, and cancels”.
Again, SO WHAT? Either they are required in order to make proper judgements concerning the measurement data or they aren’t. If they *are* required you can’t just ASSume them away using the “all measurement uncertainty is random, Gaussian, and cancels”. If they aren’t required then do you even need *any* SDOM at all when it just gets subsumed into the variance?
“I have highlighted the operative word in your sentence.”
The operative word was “not”, but if you’ve just noticed I keep talking about estimates, well done. Maybe there will be no more lies about me thinking it’s the “true value”.
“You are asserting that a single, sparse sample of a large population can represent that population than multiple samples using sparse sampling. ”
For an equivalent number of measurements yes. And before you drag this down another rabbit hole, sparseness is not the issue. The population is treated as infinite, most samples are infinitely sparse.
“Maybe there will be no more lies about me thinking it’s the “true value”.”
If you don’t think it’s the true value then where is the importance you give the SEM coming from? It’s still going to be subject to the measurement uncertainty – which you always want to assume cancels since there’s no other way the sampling error becomes a significant factor.
If your measurement is X.0 +/- 1_measurement +/- .001_sampling then what’s the point of chasing the sampling error down a rathole when it is insignifcant?
“And before you drag this down another rabbit hole, sparseness is not the issue. The population is treated as infinite, most samples are infinitely sparse.”
Sparseness of sampling of a field means you cannot accurately represent the field. No average you calculate from the sparse sampling can adequately represent the field. The “numbers is just numbers” meme simply doesn’t cut it. Time and space varying fields driven by time/space varying factors doesn’t represent a fixed population that can be sampled.
The sampling you want to do requires drawing data from a STABLE population and that population must represent the object under study.
In statistical world you can ASSUME homogeneity, stationarity, and that averages over time and space are all equivalent. In the *real* world, those are almost always garbage ASSumptions.
And that applies to the temperature field of the earth as much as it does to any electric field from a radio antenna system being driven by time/space varying factors.
What it means is the mathematical requirement for an accurate calculation is that multiple samples are required in order to form a “our many answers for x̅ will be normally distributed”. In other words, a set of mean values of x̅ that are normally distributed, i.e., the standard error distribution of the mean. .
The argument here is about an estimate of the mean, SD, and SEM. Your position is that using one sample will provide estimates of a monthly average with a CV in the range of 10% – 20% and is good enough. Those of us interested in science believe that is not good enough. A value of standard deviation of ±2C with a CV of 10% would give an interval of1.8 to 2.2°C. It would also give an SEM 0.3 to 0.4°C. That is not a very precise estimate of the mean or of the standard devviation.
But here is the big problem. Each measurement has uncertainty and the standard deviation of the random variable with the observations is and ADDITIONAL component of uncertainty. This is addressed in the GUM F.1.1.2 and H.6 for non-homogenous measurands with changing conditions. The propagated uncertainty of each measurement should be done determine one component of the combined uncertainty and the standard deviation of the total should also be added.
u꜀ = u_meas + u_diff
“What it means is the mathematical requirement for an accurate calculation is that multiple samples are required in order to form a “our many answers for x̅ will be normally distributed”.
You just keep repeating yourself and ignoring my point. There is nothing in the proof about multiple samples being required for accuracy. He simply says we may imagine taking multiple samples. The proof is simply to use this with the general equation (the same as equation 10 in the GUM) with the mean as the function. You see that the partial derivative for each term is then 1/n. And the uncertainty of the average is then just the individual uncertainties divided by √n. The point a out multiple samples is just to visualise how σ is the uncertainty for each measurement. It’s really not necessary for his proof.
Regardless, he finishes that section saying
My emphasis.
There’s little point showing how to calculate the SDOM from a single sample if all you ever do is take it from multiple samples.
Which is your usual abuse of the GUM to get the answer you want.
An arithmetic mean is NOT a functional relationship, regardless of how often you assert that it is.
“Which is your usual abuse of the GUM to get the answer you want.”
Weren’t me guv, it was Taylor.
“Your position is that using one sample will provide estimates of a monthly average with a CV in the range of 10% – 20% and is good enough.”
Firstly, I said nothing about monthly average. I’ve said before I thought using the SEM for the uncertainty of a monthly average is questionable.
But generally, yes a sample size of of 30 will have an uncertainty of the sample deviation of about 25% (assuming a normal distribution). But you will have that uncertainty whether you take a single sample of size 30, or 30 samples of size 30. You want to estimate the SME by looking at the standard deviation of your 30 means – and the uncertainty of that standard deviation is going to be the same 25%. The only difference is you took 900 measurements rather than 30. If you combined those 900 measurements into a single sample you would have a much smaller uncertainty interval, and the uncertainty of that uncertainty will only be around 5%.
“But here is the big problem. Each measurement has uncertainty and the standard deviation of the random variable with the observations is and ADDITIONAL component of uncertainty.”
That’s not a big problem, for reasons I keep trying to explain, and is also just a distraction from your claim. That measurement uncertainty will be in each of your 30 samples. The same if there is a systematic error. It will have the same effect on a single sample as on your sample of samples.
“of a quantity x (that is normally distributed),”
This should have been bolded as well. It means you are measuring the SAME thing under repeatability conditions. This gets skipped over so many times by bellman and the others that it has to be a conscious decision to skip it.
And moves into the realm of SPC, which has nothing to do with gloming gobs of temperature data together and throwing the variance into the garbage can.
“Which is what reducing the uncertainty of the average means – whether it’s from measurements or from sampling.”
Here we go again! You are trying to conflate measurement uncertainty with sampling uncertainty by refusing to specify what you are talking about.
“uncertainty of the average” is EQUIVOCATION at its finest.
Measurements define the MEASUREMENT UNCERTAINTY – no division by √n. Sampling uncertainty is defined by the peakedness of the sample, which *is* related to √n.
“You are trying to conflate measurement uncertainty with sampling uncertainty by refusing to specify what you are talking about.”
I was literally separating two different type of uncertainty. If you don’t like that, you need to explain exactly what you mean by measurement uncertainty.
Your only requirement for so.eyhongbyo be a measurement uncertainty is for it to never require dividing by √n. You keep using the word “measurement” as a talisman to ward of that danger. Nothing you say has anything to do with the actual descriptions of uncertainty (of measurement) in the GYM or anywhere else.
This one of the biggest bellman howlers of all time (and followed by an unintelligible dense-pack of handwaving and random ASCII).
No, you weren’t. You were trying to conflate sampling uncertainty with measurement uncertainty by not defining what you were disucssing.
You got caught at it and now you are just whining about getting caught.
JUDAS H PRIEST! How many times do you have to be given the definition? You’ve been given that EXACT definition right out of the GUM MULTIPLE TIMES!
GUM:
————————-
2.2.3 The formal definition of the term “uncertainty of measurement” developed for use in this Guide and in
the VIM [6] (VIM:1993, definition 3.9) is as follows:
uncertainty (of measurement)
parameter, associated with the result of a measurement, that characterizes the dispersion of the values that could reasonably be attributed to the measurand.
—————————-
The “dispersion of the values” is *NOT* the same thing as the best estimate of the value of the measurand.
The sampling uncertainty, i.e. the uncertainty of the mean, is *NOT* in any way associated with the dispersion of values that could reasonably be attributed to the measurand!
The uncertainty of the mean, i.e. SD/√n, ONLY tells you how precisely you have located the mean of the population. It is based on the peakedness of the sample means distribution. In many cases that “mean” value obtained from the sample means distribution is *NOT* even the best guess at the value of the measurand. It is only the best guess if the distribution of the measurements is Gaussian. If the distribution of the measurements is skewed then the mode may very well be the best guess at the value of the measurand.
Somehow this difference just can’t get into your brain. Your brain is too ingrained with the meme of all measurement uncertainty is random, Gaussian, and cancels. You claim it isn’t but it just comes through in EVERYTHING you assert on here. You just can’t seem to get away from it!
I daresay scores of times, and it still don’ sink in.
“Your only requirement for so.eyhongbyo be a measurement uncertainty is for it to never require dividing by √n. You keep using the word “measurement” as a talisman to ward of that danger. Nothing you say has anything to do with the actual descriptions of uncertainty (of measurement) in the GYM or anywhere else.”
I just gave you the definition of measurement uncertainty. It is based on the dispersion of reasonable values of the MEASUREMENTS. It has nothing to do with the sampling uncertainty of the mean! Measurement uncertainty actually has nothing whatsoever to do with the mean at all!
The mean, and how precisely you can locate it, has NOTHING, absolutely NOTHING, to do with the dispersion of reasonable values that can be attributed to the measurand.
I can give you just the measurement uncertainty interval WITH NO BEST GUESS AT ALL and you can *still* decide if your subsequent measurement of the measurand lies within the dispersion of reasonable values.
You simply refuse to learn what the sampling uncertainty of the mean is! It is the standard deviation of the sample means in a set of multiple samples. The equation of SD/√n is an ESTIMATE of the standard deviation of the sample means in a sampling distribution. Get that into your head if you can. It’s an ESTIMATE, a GUESS at what the actual standard deviation of the sample means is.
“It is based on the dispersion of reasonable values of the MEASUREMENTS.”
Then that has nothing to do with any definition I’ve seen. The definition in the GUM is the range of values that can reasonably be attributed to the measurand. If you are talking about the volume of a water tank, then the volume is the measurand and the uncertainty is determined by what values it would be reasonable to attribute to that volume. It has nothing to do with the dispersion of the values of the measurements you used to determine the volume. The hight and radius may be identical or very different. It does not affect the measurement uncertainty of the volume.
Yep, it don’ sink in.
“ It has nothing to do with the dispersion of the values of the measurements you used to determine the volume.”
You just can’t get worse off than this.
Bellman thinks he has some kind of measuring device that can magically measure volume of water in a barrel and he can know the measurement uncertainty of that device.
When I say bellman has no point of congruence with the physical world, that is *EXACTLY* what I mean.
This is exactly the problem — the mythical volume gauge.
The lack of congruence is painfully and glaringly obvious.
“You just can’t get worse off than this. ”
I’m sure you can manage it.
“Bellman thinks he has some kind of measuring device that can magically measure volume of water in a barrel and he can know the measurement uncertainty of that device.”
Huh? I’m not even sure if that counts as a lie or just demonstrates you inability to read. The example was about measuring the volume if a water tank, not the volume of water in a barrel, and I said you calculated the volume by measuring the radius and the height.
Of course if you did want to measure the volume of water you don’t need magic.
You said: ““ It has nothing to do with the dispersion of the values of the measurements you used to determine the volume.””
And now here you are saying that it DOES.
Which is it? Pick one and stick with it!
“then the volume is the measurand and the uncertainty is determined by what values it would be reasonable to attribute to that volume. “
NO! NO! NO!
The volume may be the measurand being determined but it is *NOT* a measurement!
The measurement uncertainty of the volume is propagated from the measurement uncertainties of the components in the functional relationship!
You don’t say the volume of the barrel has this measurement uncertainty BEFORE doing the measurements!
The values that can be reasonably attributed to that volume are determined by the values that can be reasonably attributed to the diameter and height of the barrel!
You don’t MEASURE volume. It is a derived value obtained FROM measurements of the object’s properties through application of a functional relationship.
GUM:
———————–
4.1.1 In most cases, a measurand Y is not measured directly, but is determined from N other quantities
X1, X2, …, XN through a functional relationship f :”
———————–
Wow! You can’t even get this obvious distinction straight!
Again: READ THE GUM FOR MEANING AND CONTEXT! STOP CHERRY PICKING!
Which is fundamentally and completely different from stuffing numbers into the average formula!
It has nothing to do with the dispersion of the values of the measurements you used to determine the volume.
It has everything to do with the dispersion of the values of measurements for both radius and height.
The Possolo example says the following:
Look at that 3rd item. The standard uncertainty should reflect contributions from ALL recognized sources of uncertainty. In other words, an uncertainty budget with categories you never discuss.
Remember, the probability distribution of multiple observations of the same measurand and repeatable conditions only allows a Type A evaluation of random differences in value. The combined standard uncertainty must include many more items. Accuracy, shelter influence, drift, calibration, wind, humidity, and other systematic errors in the standard uncertainty. Averaging temperature measurements from different times requires analyzing both the standard uncertainty AND the standard deviation of observations from a non-homogenous property. See GUM H.6.
“It has everything to do with the dispersion of the values of measurements for both radius and height. ”
Yes. That’s the measurement uncertainty.
He still refuses to understand that his hallowed averaging sweeps variance under the rug where he assumes he no longer has to worry about it.
“I use them all the time. “
NO! You do *NOT* use them all the time. You just refused in this very post to use them.
bellman: “Which is what reducing the uncertainty of the average means”
WHICH ONE ARE YOU ADDRESSING? You cannot reduce measurement uncertainty with more observations. As in Eq 10, there is no √n division. Measurement uncertainty GROWS, it ALWAYS grows, it never reduces. The *only* way to reduce measurement uncertainty is with better instruments or measurement procedures – sample size won’t do it!
“I’m just not sure you understand what you mean by measurement uncertainty of the average.”
Because you absolutely refuse to study the metrology texts for meaning and context!
The average is just a BEST ESTIMATE for the value of the measurand. It doesn’t matter how precisely you locate that average, IT REMAINS A BEST GUESS!
As the GUM says, the measurement uncertainty interval defines the reasonable values that can be attributed to the measurand. IT DOSN’T SAY THAT THE AVERAGE IS THE TRUE VALUE! The GUM does *NOT* say that the more precisely you locate the average the closer you get to the true value!
The measurement uncertainty interval is what defines the measurand, not the value you pick inside the interval as the BEST GUESS. If the distribution of values is skewed the MODE may be the BEST GUESS for the value of the measurand, not the average!
You have *NEVER* understood the difference between the true value +/- error and best estimate +/- uncertainty. You just continue to see them as the same! We had that discussion several times. It’s right there in the GUM! They may give the same values IF YOU KNOW THE TRUE VALUE – but you *never* know the true value!
“Because you absolutely refuse to study the metrology texts for meaning and context!”
This is so typical of your style of argument. I try to pin you down as to exactly what you think you mean, and you just say I need to study more.
“The average is just a BEST ESTIMATE for the value of the measurand.”
You are just a broken record at this point. You can repeat it as many times as you like, and the response will always be the same. “Yes, that’s why there is uncertainty.”
“IT DOSN’T SAY THAT THE AVERAGE IS THE TRUE VALUE!”
Yes, that’s because it’s not – even if you accept there is such a thing as a true value, you can never know it exactly because there is always uncertainty.
“The measurement uncertainty interval is what defines the measurand…”
And you are back to your usual contradiction. You want a measurement uncertainty if the mean, but also insist the mean is not a measurand.
In any case I don’t accept your claim. The measirand is not defined by the interval. The interval defines your lack of knowledge of the measirand based on your measurement.
“If the distribution of values is skewed the MODE may be the BEST GUESS for the value of the measurand, not the average!”
Now you are pointing out a valid issue with the concept of maximum likelihood. Using max likelihood as a definition of best estimate is not necessarily a good choice for some distributions. Using that definition the mode always is the “best estimate”, but the mean will often be better. As so often “it depends”.
“You have *NEVER* understood the difference between the true value +/- error and best estimate +/- uncertainty.”
I keep forgetting your psychic abilities. I thoughtbIthought I undetstoodunderstood the distinction quote well, but as you know mY thoughts better than I do, could you explain what I’m misunderstanding.
“You just continue to see them as the same!”
Really. I didn’t realise that was what I was thinking. I assumed I thought they were different based on the language they used. One is true value and error, the other a best estimate with uncertainty.
“They may give the same values IF YOU KNOW THE TRUE VALUE – but you *never* know the true value!”
And now my psychic powers tell me you are the one not understanding something.
You’re the actor who calls people stooopids, not Tim.
*I* don’t want a “measurement uncertainty of the mean” — YOU DO! I want the measurement uncertainty of the DATA! How many times must I repeat that to you for it to finally sink into your cranium?
It *is* the measurement uncertainty of the DATA that defines the measurand. The sampling uncertainty of the mean does *NOT* define the measurand – it defines the calculation of the mean! The calculation of the mean is *NOT* finding the true value! Therefore how precisely you locate the ARITHMETIC mean tells you NOTHING about the measurand! The only use for finding the sampling uncertainty is to make sure it is less than the measurement uncertainty! If the sampling uncertainty is less than the measurement uncertainty of the data then it gets subsumed into the measurement uncertainty interval and it then is meaningless! If the sampling uncertainty is greater than the measurement uncertainty, then either your specification of the measurand is sadly lacking or your measurement instrument/process is sadly lacking.
How in Pete’s name do you reconcile your assertion here with what the GUM says: “uncertainty (of measurement) – parameter, associated with the result of a measurement, that characterizes the dispersion of the values that could reasonably be attributed to the measurand“
If the values that could reasonably be attributed to the measurand doesn’t define the measurand THEN WHAT DOES? It’s not just the BEST GUESS that defines the measurand – it’s the entirety of the values that the BEST GUESS could be!
This is just one more example of your ingrained meme of the BEST GUESS being the “true value”! You just can’t seem to abandon that meme!
“*I* don’t want a “measurement uncertainty of the mean” — YOU DO!”
What? No. I keep saying the uncertainty of a sample mean is (at the first approximation) the SEM. Sampling uncertainty. You keep insisting that’s equivocating, and I should really be talking about measurement uncertainty.
“I want the measurement uncertainty of the DATA! How many times must I repeat that to you for it to finally sink into your cranium?”
Once would be a start. You’ve been talking about the uncertainty of the mean since the start. Your claim was the measurement uncertainty of the mean increased the more measurements you took.
“It *is* the measurement uncertainty of the DATA that defines the measurand.”
That makes no sense. uncertainty does not “define” a measurand. The uncertainty reflects your lack of knowledge of measurand – it does not define it.
“The calculation of the mean is *NOT* finding the true value!”
That’s the point. That’s why there is uncertainty. I keep telling you this, but you just keep repeating this nonsense.
“How in Pete’s name do you reconcile your assertion here with what the GUM says”
By being able to read and understand what the definition is. I’ve suggested before that you are misunderstanding the phrase “attributed to”.
“If the values that could reasonably be attributed to the measurand doesn’t define the measurand THEN WHAT DOES?”
The definition of the measurand is part of the measurement process. It’s defined by what it is you are trying to measure. What measuring and uncertainty does is define a probability distribution of possible values the measurand may have, based on the state of your knowledge.
“This is just one more example of your ingrained meme of the BEST GUESS being the “true value”!”
What’s the point? It’s obvious that nothing I say will every be considered by you. It’s just so much easier for you to argue against things nobody has ever said.
So – just for the record, I do not think you should guess the average, you should estimate it based on your measurements. The only place you might use guesswork is in the prior of a Bayesian analysis. And you absolutely should not think that your best estimate, let alone a guess, is the true value. That’s why you need to look at the uncertainty.
More irony, climatology, and you, ignore measurement uncertainty entirely.
You don’t “look” at measurement uncertainty, this is dumb — it is to be reported as part of a real measurement.
The armchair jawing and word salads you post mean nothing.
“What? No. I keep saying the uncertainty of a sample mean is (at the first approximation) the SEM. Sampling uncertainty. You keep insisting that’s equivocating, and I should really be talking about measurement uncertainty.”
You’ve confused how precisely you have located the mean and the measurement uncertainty of the data in just this one paragraph!
The equivocating is using the term “uncertainty of the mean” without specifying either sampling uncertainty or measurment uncertainty – and then continue on to talk about the SEM so when you get chalenged on that not being the measurement uncertainty you can say you were talking about the measurement uncertainty.
You just did it here. “uncertainty of the sample mean”. What uncertainty of the sample mean? is it how precisely you estimated the sample mean based on the SEM or the standard deviation of the sample data?
You just can’t help yourself, can you?
“The equivocating is using the term “uncertainty of the mean” without specifying either sampling uncertainty or measurment uncertainty”
I literally specified it was sampling uncertainty.
You said: “ I keep saying the uncertainty of a sample mean is (at the first approximation) the SEM. Sampling uncertainty.”
“UNCERTAINTY OF A SAMPLE MEAN”
The MEASUREMENT uncertainty of a SAMPLE MEAN is the standard deviation of the sample population, not the SEM of the sample mean.
The data in that sample is drawn from a population of values given as “stated value +/- measurement uncertainty”. You *have* a set of measurement uncertainties to sum in order to determine the MEASUREMENT uncertainty of the sample mean. I will guarantee you that the MEASUREMENT UNCERTAINTY of that sample will be far larger than the sampling uncertainty of the sample mean.
That means the measurement uncertainty will subsume the SEM making the SEM irrelevant.
But you don’t care about that do you? You just want to gaslight everyone that the SEM is the measurement uncertainty so you can make the “uncertainty of the mean” as small as you want.
You just can’t help yourself, can you?
“The MEASUREMENT uncertainty of a SAMPLE MEAN is the standard deviation of the sample population, not the SEM of the sample mean.”
You can keep asserting that all you like. It doesn’t make it true.
“You *have* a set of measurement uncertainties to sum in order to determine the MEASUREMENT uncertainty of the sample mean. ”
You can keep asserting that all you like. It doesn’t make it true.
But what you really have to explain is which of those contradictory incorrect assertions is the one you actually believe.
Take your 100 readings each with an uncertainty of ±0.5°C, and suppose the standard deviation of those temperatures was 10°C.
Is your measurement uncertainty of the sample mean ±5°C or ±20°C?
Now say you repeated that experiment with 10000 readings, still the same standard deviation. Is the measurement uncertainty of the mean now ±50°C or is it stil ±20°C?
“You can keep asserting that all you like. It doesn’t make it true.”
It *is* true. The SEM of the sample only tells you how precisely you have located the mean of the sample. It does *NOT* give you the standard deviation of the sample distribution which is the MEASUREMENT UNCERTAINTY of the sample.
As usual, you just employed the argumentative fallacy of Argument by Dismissal. Declare something wrong but never actually show what is wrong.
For a Type B measurement situation, which this is since the measurements have a measurement uncertainty attached to them, the measurement uncertainty is the propagated individual measurement uncertainties. u_c^2 = Σu(x_i)^2
The standard deviation of the data is the measurement uncertainty ONLY for a Type A situation which this is clearly not.
This is just one more example of you being unable to read for meaning and context. You can’t even comprehend the difference between Type A and Type B situations because you have *never learned the basic concepts of metrology. So you *always* want to assume Type A because it fits your assumption of everything being Gaussian which supports your meme of “all measurement uncertainty is random, Gaussian, and cancels”!
It still remains a Type B situation where u_c^2 = Σu(x_i)^2. The standard deviation of the data simply doesn’t apply.
You have to READ FOR MEANING AND CONTEXT. And that applies to EVERYTHING. Your cherry picking just doesn’t cut it!
“You’ve been talking about the uncertainty of the mean since the start. Your claim was the measurement uncertainty of the mean increased the more measurements you took.”
No, it’s *YOU* that keeps talking about the sampling uncertainty of the mean – based on SD/√n!
It was *me* that gave you the quote from Bevington that addressed this. You didn’t find it because all you ever do is cherry pick. Must I provide it for you again?
Bevington: ““It is important to realize that the standard deviation of the data does not decrease with repeated measurement; it just becomes better determined. On the other hand, the standard deviation of the mean decreases as the square root of the number of measurements; indicating the improvement in our ability to estimate the mean of the distribution.”
*MY* claim was that the measurement uncertainty of the data is not decreased by 1/sqrt(n) and that any uncertainty of the value of the mean is subsumed in the measurement uncertainty, especially since that mean is only a BEST GUESS and that BEST GUESS is part and parcel part of the data respresentation.
“No”
Really? You didn’t say
https://wattsupwiththat.com/2021/02/24/crowd-sourcing-a-crucible/#comment-3193339
And exactly what is wrong with that statement?
It’s the MEASUREMENT UNCERTAINTY.
We’ve spent the last 5 years explaing what’s wrong with statement. But in this case it was just used to refute your “no” when I said
There is nothing wrong with that statement. And you have yet to actually *SHOW* what is wrong with that statment.
All you ever offer is the Argument by Dismissal fallacy. Say it’s wrong and run away without showing how it is wrong.
Is that the *best* you got? Argumentative fallacies?
“There is nothing wrong with that statement. And you have yet to actually *SHOW* what is wrong with that statment.”
I can’t help you with your poor memory. If you can’t remember how many times I’ve explained to you that you have to divide the uncertainty of the sum by N to get the measurement uncertainty of the mean. I can’t help you if you think looking up the part of your text books that explain why you have to do that is just “cherry-picking”. I can’t help you with your belief that the partial derivative of x/n is one. And I can’t help you if you refuse to accept that it’s physically impossible for the measurement uncertainty of a mean to he bigger than any of the individual measurement uncertainties. You are beyond help.
But don’t claim this is an Argument by Dismissal, just because I don’t repeat all the arguments every single time you assert the same nonsense.
Don’t look in the mirror, dude.
“That makes no sense. uncertainty does not “define” a measurand.”
More shite!
GUM:
——————————
uncertainty (of measurement)
parameter, associated with the result of a measurement, that characterizes the dispersion of the values that could reasonably be attributed to the measurand”
————————-
You are just incapable of learning aren’t you?
If the values that could reasonably be attributed to the measurand doesn’t define the measurand then what does? Your crystal ball?
“The definition of the measurand is part of the measurement process. It’s defined by what it is you are trying to measure.”
Why do you *NEVER* give any quotes?
GUM:
——————————
3.1.3 In practice, the required specification or definition of the measurand is dictated by the required
accuracy of measurement (B.2.14). The measurand should be defined with sufficient completeness with
respect to the required accuracy so that for all practical purposes associated with the measurement its value
is unique. It is in this sense that the expression “value of the measurand” is used in this Guide.
————————-
The operative words here are “requried specification of definition of the measuand”
This does *NOT* mean that you can determine the measurement of a measurand before you measure it – merely by “definition”. It means you have to specify what the measurand *is* in enough detail to determine what measurements must be made. If you are performing an experiment on a mouse then you have to specify *what* strain of mouse, what genetic traits it has, how large it is in 3D and weight, etc. You define *what* you want to measure. Then the measurements DEFINE the measurand. E.g. weight gain per calorie input, electric potential at 1″ from an object that is 1″x1″x1″, etc.
This is just more evidence of your inability to read for context and meaning!
“Why do you *NEVER* give any quotes?”
I assume you’re intelligent enough to look things up, just not smart enough to understand them.
Your own quotes demonstrate that. Nothing saying the uncertainty defines the measurand.
And you are apparently not smart enough to write clearly, and proofread.
Funny you chose about the one sentence where I haven’t made a bad typo.
“So – just for the record, I do not think you should guess the average, “
Then why do you do so when it isn’t needed?
I don’t. Why do you constantly lie about me? Is ti becasue you know deep down you know are wrong about many things?
“ Using that definition the mode always is the “best estimate”, but the mean will often be better.”
Do you EVER stop to think about the garbage you assert for reasonablness?
The value that appears most often in a distribution is *NOT* the BEST GUESS in a skewed distribution? That a value that appears *less* is actually the BEST GUESS of the value of the measurand?
You are displaying the biases of a statistician. The average is a “center of gravity”. It makes it convenient in calculating other statistical moments. The issue is that it is *NOT* always the best descriptor of a distribution! Measurement, on the other hand, is not focused on “convenience” but on the best description of the measurand. The best descriptor of a measurand is the value that occurs the most often. Measurements, to be useful in the real world, must concentrate the actual measurand, not on “statistical convenience”.
Measurements are useful in predicting the future and, therefore, must consider the values that happen the most often. Statisticians are more focused on values that make statistical analysis more convenient whether they actually describe reality or not. Thus the garbage assumption that all distributions are random, Gaussian, and cancel.
Numbers is just numbers don’t you know?
“The value that appears most often in a distribution is *NOT* the BEST GUESS in a skewed distribution?”
I was talking about maximum likelihood – not the value that appears most often in a distribution. And I was talking about best estimate – not guess.
But to you point – no I don’t think the maximum likelihood is necessarily the best estimate, even if that’s how it’s usually defined.
“I was talking about maximum likelihood – not the value that appears most often in a distribution. And I was talking about best estimate – not guess.”
So the maximum liklihood is *NOT* the value that appears the most often in a distribution?
If I give you a measurement distribution of 2, 2,2,5,5,9 you would say that the maximum liklihood for the next measurement is what? 4? 5? 4 is the mean but 2 is the mode. *I* would expect 2 as the maximum liklihood for the next measurement based on this skewed distribution.
And I keep telling you that you are living in a blackboard statistical world rather than in the real world with the rest of us. It just never seems to sink in!
You just continue exhibiting a statisticians bias along with the rest of climate science. And you won’t listen to reason.
Statisticians like to work with the mean, e.g. Max Expectation because it is more stable since it is the center of gravity of a distribution and doesn’t change much when adding the next data point. So they see the mean as the max liklihood value.
For someone using measurements and living in the real world the maximum liklihood is the measurement value most likely to appear with the next measurement. In a skewed distribution this is usually the MODE, and not the mean.
If you don’t set bounds on your “estimate” then it remains in the bounds of a guess. This is why I keep telling you that you can specify a measurement as an interval instead of as a value. Giving me a Best Estimate is a waste of time.
-I *estimate* 600 marbles are the jar. – useless guess
-I estimate the number of marbles to be between 550 and 650 – an interval in which bounds are set but an exact count is not provided.
From a metrology world the second statement is *much* more informative and useful. I don’t need to know where in that interval the true vale might lie, I don’t need a GUESS at what it might be.
I can use the boundaries to assess safety, cost, difficulty, etc. The first statement provides none of that. With the interval I don’t *need* the guess at a value. I just need to make the process so that it can adequately process 650 marbles on the high side and 550 marbles on the low side.
“So the maximum liklihood is *NOT* the value that appears the most often in a distribution?”
Correct.
I’m beginning to suspect you have no idea what a likelihood is let alone a maximum likelihood.
Values don’t “appear” in a likelihood, it isn’t a probability distribution.
“If I give you a measurement distribution of 2, 2,2,5,5,9 you would say that the maximum liklihood for the next measurement is what?”
I would say “nothing” becasue a maximum likelihood is not about predicting the next value, and there is too little information in your abstract example to even know what you want as a likelihood. Is it an increasing sequence, or a roll of a die. Are they actual integer measurements or just rounded to the nearest integer. Can you assume they are from a Gaussian distribution or not? There’s just too little information.
“And I keep telling you that you are living in a blackboard statistical world rather than in the real world with the rest of us.”
OK. So in your “real world” you just guess at things, whilst in my statistical world I prefer to look at evidence and make estimates based on that. Probably explains a lot about your wild assumptions.
Maybe you want to look through the GUM, Taylor, etc, and tell me how often they say you should “guess”.
“For someone using measurements and living in the real world the maximum liklihood is the measurement value most likely to appear with the next measurement.”
Only if that someone doesn’t understand what the term means.
Therein lies the word of someone living in statistical world and not the real world.
The purpose of a measurement in the real world is to communicate what the value of the next measurement will be – not what the center of gravity of the distribution is.
For a random, Gaussian distribution the mean=mode=median. That is the assumption *YOU* always make. For a non-Gaussian distribution mean ≠ mode ≠ median.
That means that in order to communicate what the next measurement can be expected to be is the *MODE*. The mode works for Gaussian as well as non-Gaussian distributions.
*YOU* remain stuck in Gaussian world.
I know EXACTLY what I am talking about. I am talking about communicating the information needed to compare measurements and predict what the next measurement will be.
That is *NOT* the center of gravity of the distribution! Statisticians living in statistics world use the center of gravity as the Expectation value because it remains more stable as new data is added to the distribution than does other descriptors like the Mode.
But that is a definitional product of STATISTICAL WORLD. It is *NOT* applicable to the real world where it is more important to be able to compare measurements and predict what the next measurement will be.
For a non-Gaussian distribution the prediction of the next measurement is *NOT* the center of gravity, it is the value that happens most often!
You would say nothing because you live in statistical world and not the real world!
Current measurements ARE MEANT to communicate a prediction of what the next measurement will be!
Your estimate of the center of gravity is of little use to those using actual measurements in the real world.
And using the mode instead of the mean as the general descriptor is no more of a guess than is using the assumption that all distributions are Gaussian and the center of gravity is the best estimate!
In the real world it is *YOU* that are not looking at the evidence and making estimates based on the estimate. The mode works for both Gaussian and non-Gaussian distributions in predicting what the next measurement will produce. But you don’t care, you just want to stick with the center of gravity – STATISTICAL WORLD at its finest.
You’ve been given the quote from Taylor about how his text is based. And, like usual with your cherry picking, you just blow it off and go down the road with your misconceptions.
“The purpose of a measurement in the real world is to communicate what the value of the next measurement will be ”
Maybe in your version of the real world. Other versions would say that the purpose of a measurement is to determine as closely as possible the actual value of what you’re measuring.
But that’s a philosophical rabbit hole I’m going to avoid.
The problem is, even taking your view is that you are mixing up different measurements. You are only really interested in individual measurements and are only using the average as a way of determine the standard deviation and the centre of a prediction interval.
I’m talking about the mean as the thing you are Interested in. If you want to use it to predict the next measurement, that measurement is the next mean, not the next individual measurement. It I take the average height of a sample of a population, the prediction is that this will indicate the average of another sample from the population. And for that you need the uncertainty of the mean.
And make sure you ignore all other sources of uncertainty so you get the tiny numbers you want.
“And make sure you ignore all other sources of uncertainty so you get the tiny numbers you want.”
What? No! Why on earth would you want to do that?
Bevington: “Usually we do not know the “true” value; otherwise there would be no reason for performing the experiment. We may know approximately what it should be, however, either from earlier experiments or from theoretical predictions. Such approximations can serve as a guide but we must always determine in a systematic way from the data and the experimental conditions themselves how much confidence we can have in our experimental results”
This is from the second paragraph in his book. THE VERY START!
And yet you have not bothered to even read the first two paragraphs. Once again you make assertions based on either your backside or on cherry picking.
Taylor: “It is important to recognize that the statement of a single measured number is completely uninteresting. Statements that the density of some metal was measured as 9.3 +/- 0.2 grams/cm^3 or that the momentum of a cart was measured as 0.051+/- 0.004 kg/m-s are, by themselves, are of no interest. An interesting conclusion must compare two or more numbers, a measurement with the accepted value, a measurement with theoretically predicted value, or several measurements, to show that they are related to one another in accordance with some physical law”
Finding the average value, the center of gravity, of a distribution is not sufficient to allow comparison with another number in accordance with some physical law. Multiple distributions can give the exact same center of gravity while being determined from completely different measurements. It’s why statistical descriptors aren’t functional relationships.
What is important is comparing measurements in both the stated values and in the accuracy to judge acceptability of both. To do that you *must* present your measurement to others with an appropriate “best estimate”, taking into consideration what the distribution is, and with an appropriate estimate of accuracy. Only then can a comparison be made.
In the real world it simply isn’t helpful to use your meme of all distributions be Gaussian. The best estimate is the predictor of what the next measurement result will give, *NOT* what the center of gravity is for all distributions.
This is captured in the very same paragraph of Bevington. The FIRST review in assessing confidence in your results is comparing it to other results of the same measurand! That means those other results have to be communicated in a standard, common way along with an attached assessment of confidence!
You are confusing the design of the measurement process, including the equipment needed, and the measurand specification with the result of the measurement. It is the design of the process and the measurand specification that result in the determination of the actual value as closely as possible. The measurement value itself doesn’t do that, it is a RESULT, not a cause.
This is just one more piece of evidence that you simply do not live in the real world. You can’t discern cause from effect. It’s no different than saying correlation is causation.
“This is from the second paragraph in his book. THE VERY START! ”
Yes, I know. What has it got to do with your claim that the only purpose of measuring something is to predict what the next measurement will be?
“Taylor: “It is important to recognize that the statement of a single measured number is completely uninteresting. Statements that the density of some metal was measured as 9.3 +/- 0.2 grams/cm^3 or that the momentum of a cart was measured as 0.051+/- 0.004 kg/m-s are, by themselves, are of no interest.”
Somewhat dubious to say it’s of no interest, but the point is reasonable. Numbers in themselves are not useful unless you have something to compare them with (or you are using them in some other computations).
That’s what I keep telling you about averages. The purpose of an average is not to give you a meaningful value – it’s to allow you to compare two samples to see if their populations are different. Nobody cares what the actual average temperature of the earth is, what matters is if it’s significantly different to what it was in the past.
“Multiple distributions can give the exact same center of gravity while being determined from completely different measurements.”
You still don’t see why that is mostly irrelevant. The purpose of confidence testing is to find evidence that one population is different than another, not to see if they are identical. If their averages are different you know the populations are different. If you don’t have a significant difference you don’t know if that means they are identical or not. At that point it makes sense to test other factors, but it’s ludicrous to ignore the mean just becasue it won’t tell you everything.
“To do that you *must* present your measurement to others with an appropriate “best estimate”, taking into consideration what the distribution is, and with an appropriate estimate of accuracy. Only then can a comparison be made.”
What do you think we’ve been talking about. The only issue is whether you use the uncertainty of the mean, or of an individual measurement.
“In the real world it simply isn’t helpful to use your meme of all distributions be Gaussian.”
You are the only one who keeps repeating that – it’s your meme.
Wow! Your reading comprehension skills are totally non-existent. How can I be only interested in individual measurements when it is *I* that is talking about being able to communicate results to others so they can use the results to compare with their results?
If I think the distribution is Gaussian then finding the average is way to go. But I do *NOT* do like you and ASSume that all distributions are Gaussian. I told you, in just the past 24 hours, how to specify a measurement result for a Gaussian, for a left skew, and for a right skew!
The average and the standard deviation are linked by DEFINITION. So what? Have you forgotten so quickly that I have told you MULTIPLE times that the 5-number statistical description is much more preferred by me and that it can be used to compare accuracy just like the standard deviation. It provides a *better* comparison in some ways!
The GUM says the measurement uncertainty should be specified AS a standard deviation, not that it has to *be* a standard deviation. For a Type B uncertainty there may not be (and probably won’t be) multiple data points available to even define a standard deviation. But you still show the measurement uncertainty as an equivalent to a standard deviation.
STOP LECTURING US ON THINGS YOU KNOW NOTHING ABOUT. Do I really need to tell you how you are coming off here on WUWT as a “purported” expert on statistical analysis and metrology?
“And now my psychic powers tell me you are the one not understanding something.”
That’s the exact problems. You have psychic powers that let you see into the Great Unknown and discern things that most humans can’t.
You can discern that the best guess of a measurand that has two measurements of 19 and 20 is 19.5. It doesn’t matter what the actual physical limitation on knowing that is, you just KNOW it. It’s what a Gaussian distribution would give and *everything* can be assumed to be Gaussian.
“That’s the exact problems. You have psychic powers that let you see into the Great Unknown and discern things that most humans can’t.”
You might believe you have. Most of us understand that there is uncertainty in everything. Why do you think we’ve spent the last million years arguing about uncertainty if you think you can just know the true value?
“You can discern that the best guess of a measurand that has two measurements of 19 and 20 is 19.5.”
Why would you guess? You don’t need to guess what the average of 19 and 20 is, it’s a simple calculation for most of us. I suspect this is your problem understanding equation 10. Rather than work through the maths, you just guess at an answer and then try to come up with illogical contortions in order to fit in with your incorrect guess.
What 19.5 is, is the best estimate of the measurand given the data available. It doesn’t require a crystal ball or psychic powers to understand that. Just some basic maths and a definition of best estimate.
“It’s what a Gaussian distribution would give and *everything* can be assumed to be Gaussian.”
It does not have to be a Gaussian distribution, but in this case Jim did state it was a Gaussian distribution, and later it was assumed to be a rectangular distribution. If you can assume a different distribution then it may well be that the average is not the best estimate, but then you would need some explanation of what these hypothetical measurements were actually of. If you don’t have a crystal ball to tell you what the distribution is, it’s probably best to assume it’s Gaussian.
Who are “us”?
As per standard operating procedure in bellman-world and climastrology.
“Who are “us”?”
People who don’t believe we have psychic powers.
“As per standard operating procedure in bellman-world and climastrology.”
Yes, as Jim Gorman said
And what you refuse to acknowledge is that an uncertainty interval does NOT have a probability distribution attached to it.
Of course, you and climastrology don’t even bother to attach the uncertainty interval to a value.
“Number is numbers!”
Yes, I did say that. That is not to imply that that is correct. You and climate science ignore systematic uncertainty with a passion. Here again is a sample uncertainty budget from https://www.isobudgets.com/
There are many, many influence quantities that are not Gaussian. Most are systematic which are not amenable to a Type A evaluation. If you were really interested in measurement uncertainty you would not be concentrating on Gaussian distributions.
“You and climate science ignore systematic uncertainty with a passion.”
Apart from your obsession with lying about what other people believe, what have systematic errors got to do with whether the distribution is approximately Gaussian or not?
WFT is “the distribution”??
More fuzzy handwaving.
The probability distribution, as in is it Gaussian or not. I would have thought that was obvious from the context.
“The probability distribution”
— of what? Frogs in the rainforest?
“what have systematic errors got to do with whether the distribution is approximately Gaussian or not?”
Because they can cause the distribution to be skewed if the systematic effect is asymmetric.
In my 60 years of building frequency generating and frequency measuring equipment, I have never seen two pieces of similar equipment drift in opposite directions in equal amounts. NEVER.
yet bellman thinks it is a common occurrence. Everything cancels everywhere – the entire world is Gaussian so ASSuming Gaussian is a justified decision.
More lies.
You’ve been given an explanation of why, in the real world, asymmetric distributions are encountered more often than Gaussian distributions. But, like usual, you just blow them off!
The bias of a statistician living in Statistical World instead of the real world.
Calibration drift is almost *always* asymmetric. Hysteresis is almost always asymmetric.
For measuring instruments assuming Gaussian distributions is just idiotic in the real world. You don’t *need* to know the exact distribution to determine the mode of the data. If that data is Gaussian, the mode will equal the mean. If the data is not Gaussian, the mode will communicate the value expected for the next measurement far more completely than the mean. Using the mode is a far better, generalized method for stating the best estimate. It typically works for *ALL* cases where the mean does not.
“TINY NUMBERS! WE MUST HAVE TINY NUMBERS!” — CEO pounds his fist on the boardroom table…
I forgot to add that it is appropriate if not required that you provide a citation when you quote someone. Just cherry picking a sentence without context is not exactly ethical behavior.
Please provide the location of where this question was asked so that context is available.
Bellman: “Sure a badly thought through large sample can give you a worse result than a well designed small sample. But that isn’t the point Tim makes and I’m disagreeing with, that even with random independent measurement uncertainties the uncertainty of the mean inevitably grows with sample size.”
Pat Frank: “RE:“even with random independent measurement uncertainties the uncertainty of the mean inevitably grows with sample size.”
It diminishes, actually. With 1/sqrtN.”
Bellman: “Thanks. Interesting to note how many people disagree with this comment, compared to the numbers who attack me whenever I say the same thing.
It would be nice to think this means now Dr Frank has said it they realise they were wrong all this time, but somehow I suspect it will be quickly forgotten and we will be going through all the same arguments next time.”
Pat Frank: “Who denied that uncertainty due to random error diminishes as 1/sqrtN?”
Bellman: “Tim Gorman for one. I’ve been arguing with him about it for over 2 years, and he still insists that the the uncertainty of the mean is the same as the uncertainty of a sum, i.e. multiplied by root N.
It’s what got me interested in the idea of uncertainty in the first place.”
And what you trendology pseudoscientists always conveniently neglect is this is for a Type A uncertainty evaluation, in which multiple repetitions of the same measurement, done on the same sample under unchanging conditions are averaged and the variance of the multiple measurements are calculated.
None of these apply for air temperature measurements, N is always exactly equal to one! So divide all you like by 1/root(N) if it makes you happy.
Section 4.2.1 of the JGCM 2008 does not say Type A evaluation can only be applied when repeatedly measuring a physically unchanging sample.
Second of all, there are temperature products that routinely involve multiple observations over time. USCRN measures temperature with 3 independent PRTs and repots 5 minute averages calculated from multiple samples.
Cherry picking again I see.
I should add that a Type A evaluation is based on a probability distribution of observations of a single measurand. Adding two measurand observations into single random variable ends up not proved information about each. You have no way to know what either the best estimate is for each, not what measurement uncertainty for each actually is.
He must have learned the art from bellman.
Your quotations establish the same measurand, not a physically unchanging sample. Those aren’t synonymous.
A measurand is the particular quantity intended to be measured. The GUM explicitly warns that a measurand may depend on quantities such as time and that its specification may require stating the time at which it applies. So an environmental quantity doesn’t have to be physically constant forever for measurement science to apply to it.
This is from Section 1.2:
“1.2 This Guide is primarily concerned with the expression of uncertainty in the measurement of a well-defined physical quantity — the measurand — that can be characterized by an essentially unique value. If the phenomenon of interest can be represented only as a distribution of values or is dependent on one or more parameters, such as time, then the measurands required for its description are the set of quantities describing that distribution or that dependence.”
Do you know what a functional relationship is? Do you know what a time series is?
Time is included in uncertainty if it is an input quantity to a functional relationship. Time is not an input quantity to temperature. The measurand of temperature does not depend time.
If you know what dimensional analysis is then you will understand how time is involved in this functional relationship – “d = v × t”. No such relationship exists between temperature and time.
You left this out of your reasoning. “then the measurands required for its description are the set of quantities describing that distribution or that dependence.” Show your idea of how the measurand of time has some relationship with temperature.
You are mixing up different ideas.
When the GUM says a phenomenon can be “dependent on one or more parameters, such as time,” it means that the phenomenon’s value can vary with time.
“Show your idea of how the measurand of time has some relationship with temperature.”
The diurnal temperature cycle.
“The diurnal temperature cycle.”
Where is your mathematical formulation for that functional relationship?
What you’ve provided is *NOT* sufficient to determine the temperature at any point in time.
If the difference between writing T = f(a,b,c,t) and writing T = a*b*c*t
One means you suspect a functional relationship. The other means you *KNOW* what the functional relationship is!
I am mixing nothing up. Read this carefully: “a phenomenon can be “dependent” “. Dependent means dependent in a formula for calculating the measurand.
The GUM is addressing a functional relationship involving time. What you are describing is a relationship such as, f(X,t). Like I showed d = f(v,t) = v × t.
You are describing a “time series” where time is not an independent variable in the calculation of temperature. Time in a time series is the value of something measured at unique intervals such as (1,2,3,4,5). A time series is a sequence of data points recorded or observed at successive, usually equally spaced, points in time, used to analyze patterns such as trends, seasonality, and cycles.
I asked you to show your idea of how the measurand of time has some relationship with temperature. I will ask again. Show us your idea of a formula for temperature that includes time.
Your statement is ludicrous.
Exactly what does “particular quantity” mean to you. Don’t argue about things you know nothing about.
A measurand may be: Y = f(X1, X2, …, Xn). X1, X2, and Xn may also be measurands made up of other variables.
You really need to learn what a measurand is. The width of your screen is a measurand. The height of your screen is another measurand. The area of your screen is another measurand using a functional relationship of: Area -> Y = f(w,h) = w × h.
You need to read JCGM 2008 for comprehension rather than cherry pick passages and then accuse me of cherry picking. Your tactics are becoming obvious.
This is from Section 3.1.5, and it also contradicts your claim that repeatability requires a perfectly unchanging physical environment:
“3.1.5 Variations in repeated observations are assumed to arise because influence quantities (B.2.10) that can affect the measurement result are not held completely constant. “
No one disagrees that atmospheric temperature varies with location, height, time, etc. That’s precisely why you specify exactly which temperature quantity is being measured. Climate science routinely does this.
Daily TMAX at a specified station and date is one example of a specifically defined temperature quantity. That is entirely consistent with B.2.9’s own note that specification of a measurand may require statements about time.
““3.1.5 Variations in repeated observations are assumed to arise because influence quantities (B.2.10) that can affect the measurement result are not held completely constant. “”
Variations in observations GENERATE MEASURMENT UNCERTAINTY!
“affect the measurement result” means that the dispersion of reasonable values that be attributed to the measurand becomes GREATER if the influence quantities are not held completely constant!
You just keep shooting yourself in the foot with your cherry picking! You can’t keep from coming up with assertions that INCREASE the measurement uncertainty instead of decreasing it!
You’re attacking a strawman. You guys claimed repeatability requires a perfectly constant physical environment and that meteorological measurements therefore cannot satisfy repeatability conditions.
3.1.5 was cited to rebut that claim. It explicitly discusses variations in repeated observations arising because influence quantities “are not held completely constant.”
Whether those variations contribute to the uncertainty budget is a separate question. That doesn’t rescue your claim that repeatability requires a perfectly invariant environment.
Stop cherry picking. You are doing yourself no favors by doing so. I would tell you to obtain some metrology textbooks and study.
Repeatability does require the same conditions period. Same temperature, pressure, voltage, whatever environmental conditions you can think of.
Reproducibility on the other hands requires the same thing but under changed conditions of measurement. A daily figure over a months time comes closest to this, but the measurand also changes. This is really covered in the GUM F.1.1.2 and H.6. You will see that the standard deviation of the observation is added to any other uncertainties determined from an uncertainty budget.
These assess two different things. They are separate influence quantities in an uncertainty budget. Here are two sample uncertainty budgets.
You should note you cannot find an uncertainty budget included in a climate science related document. It is ignored on purpose.
You’re still not addressing Section 3.1.5. Nobody disputes that variations in influence quantities can contribute to an uncertainty budget.
The dispute is your categorical claim that “same conditions of measurement” means temperature, pressure, voltage, etc. must all remain literally constant, such that meteorological measurements cannot satisfy repeatability conditions.
Yet 3.1.5 explicitly discusses variations in repeated observations arising because influence quantities affecting the measurement “are not held completely constant.”
So “repeatability conditions” and “every influence quantity has exactly the same value” plainly aren’t synonymous.
Citing uncertainty budget treatment of those variations doesn’t establish otherwise.
3.1.5 Variations in repeated observations are assumed to arise because influence quantities (B.2.10) that can affect the measurement result are not held completely constant.
B.2.16 reproducibility (of results of measurements)
closeness of the agreement between the results of measurements of the same measurand carried out under changed conditions of measurement
Do you think these may go together?
Look at the items in the uncertainty budget, it has both catagories. How do you think reproduibility uncertainty is calculated? Again, look at F.1.1.2 and H.6 and tell us what they mean.
“So an environmental quantity doesn’t have to be physically constant forever for measurement science to apply to it.”
If the environmental quantity is *NOT* constant then that is a contributor to the measurement uncertainty.
From GUM, Section 3.1.3:
————————–
EXAMPLE If the length of a nominally one-metre long steel bar is to be determined to micrometre accuracy, its specification should include the temperature and pressure at which the length is defined.”
————————-
If that temperature and pressure changes then the length of the rod can be assumed to have also changed. And the dispersion of values that can be reasonably attributed to the length of that rod should take the variability of the environment in which the bar is being measured into consideration!
Why do you think they put cuts in concrete slabs? What do you think those cuts represent?
If the measurand has a changing property over time then it is *NOT* the same measurand for each measurement!
A physically changing measurand does *NOT* remain the same measurand over time.
That means that you can’t do a Type A measurement uncertainty. It becomes a situation where the standard deviation of the data is *NOT* the measurement uncertainty of the average. The measurement uncertainty of the average is the propagated measurement uncertainty of each individual measurement according to Eq 10.
Too many statisticians and climate scientists think correlation applies to the actual physical temperature. Two stations separated by 20 miles both warm at the same rate and the slope of the temperature curve is the same for both – strong correlation.
The issue for the measurement uncertainty is that it is the correlation of the MEASSURMENT UNCERTAINTY that determines the correlation factor used in measurement uncertainty propagation. In Eq 13 it is u(x_i) and u(x_j) that are in the correlation factor of the equation. While the temperature *values* may be highly correlated that does *NOT* mean that the measurement uncertainties are correlated at all! x_i and x_j may be highly positively correlated or u(x_i) and u(x_j) may be highly negatively correlated – or may not be correlated at all!
Look at Eq 14. The correlation coefficient equation is:
r(x_i, x_j) = [ u(x_i,x_j) ] / [ u(x_i) u(x_j)]
The correlation factor is based solely on uncertainty correlation, not on the correlation of x_i and x_j.
Section 5.2.2 is *very* hard to read. You have to read for context and meaning – which our climate science supporters are simply unable or unwilling to do. All they can do is cherry pick bits and pieces.
Look at Eq 15. It might be more explanatory. The correlation component is given as:
u(x_i) u(x_j) r(x_i,x_j)
If you substitute Equation 14 into Eq 15 you get:
u(x_i) u(x_j) [ u(x_i,x_j) / u(x_i) u(x_j) ]
The only components in the equation are the uncertainties and the correlation between the uncertainties u(x_i,x_j).
Climate scientists and statisticians tend to use the equation:
σ(A-B)^2 = σ_A^2 + σ_B^2 – (2 * r * σ_A * σ_B)
And then apply the garbage assumptions that
1.- A = X + ẟ and B = Y + ẟ
2.- so then σ_A =σ_B = σ_ẟ
3.- r = 1, high correlation
So then
σ(A-B)^2 = σ_ẟ^2 + σ_ẟ^2 – 2σ_ẟ^2 = 0
Voila! Measurement uncertainty cancelled!
It gets even worse when you consider that X doesn’t have to equal Y. That means that the relative uncertainties of ẟ/A and ẟ/B are different and the assumptions totally ignore that and make no allowances for it at all.
When climate science supporters start talking about correlation of temperatures tell them they are full of shite. The correlation of the temperatures has *NOTHING* to do with the correlation of the measurement uncertainties. As Hubbard and Lin found out, temperature measurement stations have to be evaluated on a station-by-station basis because the microclimates can be so different and have such an impact on the individual measurement uncertainties.
Correlation of the *values*, x_i and x_j, does *NOT* mean equality of values either. Two locations may be highly correlated as far as the slope of their temperature curve while their values can be significantly different. When values are significantly different you can’t just substitute one value for another. The price curves of US postal stamps and New York Giant tickets may be closely correlated, but you can *NOT* substitute the US postal stamp price for the price of NY Giant tickets! Yet climate science does so *all the time*!
It’s just garbage assumption after garbage assumption when it comes to metrology and measurement uncertainty. All so they can pretend that measurements recorded in the units digit can magically produce values in the hundredths digit and that they can reduce measurement uncertainty by taking more and more measurements allowing them to use a crystal ball to peer into the Great Unknown and divine the unknowable. When the truth is that sticking more and more measurements into the crystal ball just makes it more and more cloudy – it actually makes it harder to see into the Great Unknown!
Even Type A measurement protocols have uncertainty. Even for Type A the GUM looks upon the average of the data as a BEST ESTIMATE of the value of the measurand. It is *still* a sampling process and assuming the mean is the BEST ESTIMATE requires assuming that the distribution of the data is Gaussian and the measurement environment is non-changing over the measurement interval. The operative letters in this are bolded. Sticking a probe in a pipe to measure flow or in a substance to measure its temperature can change the flow or the temperature of the substance. That change may or may not be significant enough for the measurement device to identify but *that* is why significant digit and resolution rules exist.
“Bellman: “Tim Gorman for one. I’ve been arguing with him about it for over 2 years, and he still insists that the the uncertainty of the mean is the same as the uncertainty of a sum, i.e. multiplied by root N.”
You can’t even get this one straight.
An ESIMATOR for the uncertainty of the mean of a population obtained from sampling *is* the SD of the population divided by the square root of n. Note carefully that word *ESTIMATOR*.
If you have ONE sample, then estimating the sampling error of the mean requires
Some of the assumptions are that the population is normally distributed, that there are no systematic effects at play, and that the sample is a complete representation of the population, and that the sample is properly obtained.
This is the old estimation formula of:
SE = SD(population)/sqrt(n). It is an ESIMATOR for the sampling error. If you don’t know the SD(population) then you have to guess at what the SD is by sampling. For ONE sample, that introduces HUGE uncertainty all of its own.
The ACTUAL way the sampling error should be found is to generate MULTIPLE samples and find their means.
You then group those means together into a data set and find *its* average as an estimator for the population average. The SD of that set of data made up from the means of the multiple samples then becomes your much more accurate estimate of the variance/SD of the mean obtained from sampling, i.e. the Standard Error of the Mean.
AND NONE OF THIS HAS ANYTHING TO DO WITH MEASURMENT UNCERTAINTY. It is SAMPLING error. In fact, the SAMPLING error should be added to the measurement uncertainty.
It seems that *NO* one trying to support climate science’s use of the standard error for measurement error has ANY idea that the value given for a measurand is a BEST GUESS. For convenience’s sake far too many people just automatically make the assumption that the measurement uncertainty is a normal probability distribution and therefore the “average” is the best estimate of the value of a measureand.
NOTHING, ABSOLUTELY NOTHING could be further from the truth in the real world. For almost *all* things physical in the real world, the measurement uncertainty is asymmetric. Similar electronic components tend to drift in the same direction when they are heated, either by external heat or internally generated heat during operation. ResistorA will almost always drift in the same direction as ResistorB. That makes calibration drift ASYMMETRIC. You will simply not find that the electronics in measurement station A will drift in an equal and opposite direction from measurement station B. Therefore you cannot just automatically assume that all measurement uncertainty is random, Gaussian, and cancels. Nor can you just assume that a single sample represents the population where asymmetric uncertainty occurs.
“Pat Frank: “RE:“even with random independent measurement uncertainties the uncertainty of the mean inevitably grows with sample size.”
MEASUREMENT UNCERTAINTY does not diminish. SAMPLING error does.
But no amount of sampling can turn inaccurage measurements into accurate ones. No amount of averaging can turn inaccurate data into accurate data. And if the data is inaccurate then so will be the mean of that data.
Bellman has *never* been able to grasp the difference between sampling error and measurement uncertainty. It’s pretty damn obvious that you can’t either! But you have lots of company, neither does 99% of the climate scientists.
“MEASUREMENT UNCERTAINTY does not diminish. SAMPLING error does.”
You are in disagreement with both the GUM and, now, Pat Frank. The context is clear: Pat Frank’s point is that measurement uncertainty diminishes as the number of independent measurements increases.
“But no amount of sampling can turn inaccurage measurements into accurate ones. No amount of averaging can turn inaccurate data into accurate data. And if the data is inaccurate then so will be the mean of that data.”
No one disputes this point. Your confusion comes from misunderstanding what climate science actually says.
“ Pat Frank’s point is that measurement uncertainty diminishes as the number of independent measurements increases.”
That is *NOT* what Pat’s point is unless you are doing a Type A evaluation.
You simply keep on cherry picking stuff and throwing shite against the wall hoping something will stick.
I’ve had enough conversations with Pat on *exactly* this subject to know his position. It is no different than that of Taylor, Bevington, Possolo, or any other metrology expert.
It is the SUM of the physical effects of an LIG thermometer that result in the measurement uncertainty of the instrument. EXACTLY what Pat went into in his treatise on the measurement uncertainty of LIG thermometers. It’s the *same* exact logic dictating that iterative models add measurement uncertainty at each step rather than the measurement uncertainty of the final result being the same as that of the initial condition values.
You simply don’t know enough metrology basics to even intelligently discuss the subject.
“That is *NOT* what Pat’s point is unless you are doing a Type A evaluation.”
Right but this exchange you have not read is surrounding these statements by Jim:
” Uncertainty adds, always”
That’s obviously false as a general rule. In a Type A evaluation based on independent repeated observations, the uncertainty of the estimated mean decreases as the number of independent observations increases.
“You simply don’t know enough metrology basics to even intelligently discuss the subject.”
Well, I’ll readily admit I’m not a metrology expert and certainly have more to learn. But you’re clearly in the same position.
More cherry picking with no context I see. The very first time I said that was in describing measurement uncertainty (not uncertainty of the mean) and even showed you a textbook explanation of why the addition of the means (X+Y) results in the addition of the variances, in quadrature.
In case you are still confused, the variance in a probability distribution IS NOT the standard deviation of the mean.
As you can see the dispersion of the indication values (observations) is the measurement uncertainty.
“That’s obviously false as a general rule. In a Type A evaluation based on independent repeated observations, the uncertainty of the estimated mean decreases as the number of independent observations increases.” (bolding mine, tpg)
The uncertainty of the estimated mean only tells you if your guess at the BEST ESTIMATE of the value of the measurand is appropriate or not – and it depends on ASSuming that the distribution of the data is random and Gaussian. If the data distribution is *NOT* Gaussian then the mean is *NOT* the best estimate of the value of the measurand!
Do *YOU* know what the data sets used to determine the GAT is GAUSSIAN? The most obvious assumption *should* be that it is multi-modal because of combining high temperature locations with low temperature locations – each of which have different variances, even the ANOMALIES will have different variances thus forming multiple modal combinations!
Your “uncertainty of the estimated mean” is *NOT* the measurement uncertainty of the data distribution. The measurement uncertainty is the distribution of reasonable values that can be attributed to the value of the property being measured! That is a DIFFERENT THING than the “best estimate” of the value.
You are just like bellman – you can’t get the “true value +/- error” meme out of your brain! In that meme the best estimate is the true value and its uncertainty is determined by evaluating the sampling uncertainty associated with it. THAT IS NOT THE MEASURMENT UNCERTAINTY MEME.
In the uncertainty meme you don’t really even have to provide the best estimate in order to communicate the accuracy of the measurement data and what is an acceptable value in subsequent measurements.
If I tell you the measurement uncertainty interval is 20C to 22C exactly what does providing a “best estimate” offer? If a subsequent measurement shows 21C IT IS STILL AN ACCEPTABLE VALUE! It is part of the dispersion of reasonable values that can be attributed to the measurand! If the subsequent measurement is 20.25C IT IS STILL AN ACCEPTABLE VALUE for the measurement! You simply don’t need to know what the best estimate is!!!!!
Read the preceding paragraph carefully. Read it multiple times. Read it till you understand it. The “uncertainty of the estimated mean” doesn’t even come into play when determining if a measurement is acceptable or not!
In fact, any use of the MEAN and its associated sampling uncertainty SHOULD ALWAYS BE ACCOMPANIED BY ONE OF THE FOLLOWING:
You, bellman, bdgwx, and nyolci all like to portray yourselves as preeminent statisiticans but none of you have even a clue as to what the uncertainty of the estimated mean actually *is*. I’ve posted the math here. Obviously NONE of you could understand it at all.
The uncertainty of the estimated mean is derived from the characteristics of the central limit theory. The distribution derived from the CLT has a peakedness that defines the standard deviation of the distribution. The more peaked it is the smaller the standard deviation is, i.e. the more “accurate” the estimation of the mean becomes. And that peakedness is proportional to the number of observations. It is a measure of SAMPLING uncertainty since it is derived from the use of the CLT!
And SAMPLING uncertainty is *NOT* the same thing as MEASUREMENT uncertainty.
Again: YOU DON’T NEED THE BEST ESTIMATE TO KNOW IF A SUBSEQUENT MEASUREMENT IS ACCEPTABLE OR NOT. This makes finding the sampling error a useless masturbation! What you *really* need to know is the interval of acceptable values and that is defined by the measurement uncertainty interval! Not by the sampling error!
But it does allow them to pretend that gloming random and diverse temperature measurements into a gob is just like doing a Stats 101 sampling.
Yes. That’s the very exception Jim Gorman denied when he said, “Uncertainty adds, always.” You are now spending paragraphs explaining circumstances under which the uncertainty of an estimated mean decreases as the number of independent observations increases.
So you’re arguing against me while simultaneously demonstrating why Jim’s categorical “always” is wrong.
At this point, you’re rebutting Jim more effectively than I am.
“uncertainty of an estimated mean”
The uncertainty of an estimated mean is *NOT* the measurement uncertainty of the mean!
You are still using the argumentative fallacy of Equivocation.
Once again, a measurement is given as v +/- u.
The precision with which you calculate “v” has no bearing what so ever on “u”.
The SEM is a statistical descriptor of “v” and has no bearing on “u”.
“u” remains the measurement uncertainty of “v”. No division by sqrt(n).
You are lost in the woods and don’t even know it!
Measurement uncertainty adds, always. You obviously have downloaded the GUM. Search for the term “combined uncertainty”. See if you can find any reference that shows subtracting input quantity uncertainties when calculating a combined uncertainty. I’ll bet you find a lot of references to u². Do you know why? Squaring a value makes any negative sign go “Poof”. You will never find adding a negative number except for covariances in uncertainty which don’t apply to temperature measurements.
“Well, I’ll readily admit I’m not a metrology expert and certainly have more to learn. But you’re clearly in the same position.”
You don’t know enough to judge what I know. You have yet to provide ANY math supporting your positions. I have provided the math over and over and over. No one can refute it. Not you, not bellman, not bdgwx, not nyolci, NO ONE.
You don’t even know enough to discuss the CLT and how it applies! See my just posted answer on what it is and what it tells you! REFUTE IT IF YOU CAN!
I have asked several times now.
When are you going to provide the source of this statement.
I have yet to see a response from you about where Dr. Pat Frank made this statement so context can be discovered.
Note for the record: no citation has been supplied.
It was provided upthread.
I have examined all 103 posts, as of this time, that has your name.
YOU HAVE NOT given a citation of the quote you are using. Quit dodging and answer the question!
Show us a citation of the quote you have given for Dr. Pat Frank so the proper context can be examined. Failure to do so, indicates you have made up the quote.
No, it was NEVER provided!
I don’t know where you are getting you information, but you looking in the wrong place. Lets look at these separately.
As I showed you above, you are incorrect. If all the measurements are ±1°C, the average uncertainty must also be ±1°C. Lay 10 bricks 10 ±1 inches. It is physically impossible for the average to be anything except 10 ±1 inches.
Funny how you are making all these assertions but have no resources to support you.
This is where intervals are appropriate to discuss. An uncertainty interval has two components. A best ESTIMATE and an interval representing where the true value may lay. One sigma tells you where there is a 68% chance and two sigmas tell where there is a 95% confidence that the true value is in the interval.
You are trying to say that the average of 19 and 20 can give you an average of 19.5. This ignores the resolution of the measuring device that can only measure to the units place. YOU CANNNOT MEASURE TO THE TENTHS DIGIT. Pretending that you know the true value of the tenths digit is unethical. Sit in front of a digital display with only a units digit. Do you know the tenths digit. No, it could anywhere from 19.5 to 20.5. Same with the other 18.5 to 19.5. Do those intervals overlap? If not, then how can a value of 19.5 be correct?
Ultimately, the definition of uncertain applies. It means you don’t know where in an interval the true value lays. Consequently, 26.1 ±1°Cand 26.3 ±1°C is essentially the same temperature. There is no way to statistically show that you KNOW they are different.
You need to provide some metrology references to support your assertions.
“You are trying to say that the average of 19 and 20 can give you an average of 19.5.”
Yes – that’s what the average of 19 and 20 is.
“YOU CANNNOT MEASURE TO THE TENTHS DIGIT.”
You are not measuring to the tenths digit, you are calculating the average to the tenth digit. (Or more accurately to a half in this case.)
“Pretending that you know the true value of the tenths digit is unethical.”
Is it unethical to say you know the two values are 19 and 20, when you have an uncertainty of ±1? You don’t know what the unit values are “true” values.
And is it ethical to claim that the average is 20, when you know it’s more likely to be 19.5?
“No, it could anywhere from 19.5 to 20.5. Same with the other 18.5 to 19.5. Do those intervals overlap? If not, then how can a value of 19.5 be correct?”
Yes. They overlap at 19.5.
Actually they don’t. The interval is really 18.5 to 19.49̅ which rounds to 18.5.
This is just another sign that you have never dealt with exacting physical science measurements.
Let’s deal with a digital display the gives the values 19 and 20 multiple times. Read the references below. The last digit displayed is the units digits. That is where the uncertainty must be. In other words ±1.
The National Weather Service required temperatures to be rounded to the nearest integer. That is exactly what a digital instrument does when there is only a units display.
Here are three references. You have never shown a reference that says you can add resolution through averaging.
NIST.HB.44-2026.pdf.pdf
Experiment 2: Measurements and Significant Figures – CHEM 1014: Chemistry in the Environment and Society Laboratory
https://eng.libretexts.org/Bookshelves/Electrical_Engineering/Electronics/DC_Electrical_Circuit_Analysis_-_A_Practical_Approach_(Fiore)/01%3A_Fundamentals/1.2%3A_Significant_Digits_and_Resolution
“Actually they don’t. The interval is really 18.5 to 19.49̅ which rounds to 18.5.”
Talk about not living in the real world. You are claiming your measuring device is capable of resolving a difference between 19.499999 and 19.500000, yet is only be reported to the nearest unit.
And you are assuming a finite distribution, yet just before you claimed
Implying a Gaussian distribution. If the 19 ± 0.5 represents a 95% confidence interval, then there’s a 2.5% chance it’s greater than 19.5.
“This is just another sign that you have never dealt with exacting physical science measurements. ”
How exact do you think they are? Regardless, everything you say after this is irrelevant to my point. An average of 19.5 is not the result of a measurement made to a tenth of a unit – it’s the result of calculating two or more measurements measured to the nearest unit value.
Nice try but those have nothing to with resolution, they have to do with rounding.
Yes, it assumes a Gaussian distribution. Even NIST assumes many measurement distributions are Gaussian especially when there is no reasons to assume otherwise. There are tests on the data that can be run, an AI is very useful for this.
You need to study. The last digit in a digital display is considered the uncertain digit. The uncertainty will be in the units digit. It is generally shown as ±0.5, a half-interval.
This a rectangular distribution and the standard uncertainty is 0.5/√3 = 0.3. The expanded uncertainty is 0.3 × 2 = 0.6.
Use this page if you don’t believe me.
https://metricgate.com/calculator/instrument-resolution-uncertainty
You should realize that when you get into standard uncertainies and uncertainty budgets, NIST and most bodies require the use of expanded uncertainty with a factor of 2.
You should get to know this site.
Never going to happen (unless he finds a way to cherrypick the answers he wants).
“Nice try but those have nothing to with resolution, they have to do with rounding.”
Your determination to avoid the obvious is outstanding. Let’s put it this way. You claim to have made two measurements of the same thing using an instrument that reports a result in units. One time you got a 19 the other 20. Why do you think you didn’t get the same result each time?
If an actual size was 19.5 or greater would have always been reported as 20, and any value strictly less than 19.5 would have been rounded to 19, then your two results are impossible, and the only conclusion is that your instrument is defective.
If, on the other hand there is some random variation each time the instrument is used, before it rounds the result, it is possible that you will get the two different results, and an average of 19.5. This random variation increases the interval and means you have an overlap, and so using set theory you can determine the size of the intersecting intervals.
For instanced, you also claimed that the uncertainty was ±1. That means your result of 19 indicates the value as being between 18 and 20, whilst your result of 20 puts it at between 19 and 21. Combining the two results means you can rule out anything below 19 or above 20, so you know now the value is between 19 and 20 – that is 19.5 ± 0.5. By using two results you have fixed the “true” value more precisely and reduced the uncertainty interval.
Given that, why do you think it’s better to report the result as 20 ± 1? You are just giving the impression that you still think the result may be as large as 21, when that is impossible given the result of 19.
ROFL! You can’t even tell the difference between rounding and resolution. How in Pete’s name did you come up with 19.5 if the resolution is in the units digit?
This is what is called a circular argument. You assumed the result and then used it as the input!
Jim said: “Let’s deal with a digital display the gives the values 19 and 20 multiple times.”
So where did you get 19.5? You have NO idea of how the instrument came up with the displayed value – BECAUSE OF THE UNCERTAINTY. It could have displayed 19 while the true value was 19.6 because the uncertainty is 0.6!
You wouldn’t last a DAY in a job requiring physical measuring.
How do you get an average of 19.5 when you have no idea of what the tenths digit is?
If you took 10 measurements and 9 of them were 19 and one was 20 what would the average be? How do you know that average has any physical meaning if you can’t measure with that resolution?
You keep assuming a result and using that to justify your assumptions! How do you know the true value of the average isn’t 19.4? or 19.6? or 19.2? If you can’t measure the tenths digit then how do you KNOW?
You keep saying that significant digit rules and resolution rules are “suggestions” and not reality based. That may be true but they exist to keep people like you from doing what you are doing. Like the saying goes, you don’t know what you don’t know – unless, that is, you are a climate scientist or a statistician.
“How in Pete’s name did you come up with 19.5 if the resolution is in the units digit?”
What do you think the word “if” means? I was talking about the actual size of the object, not the measurement result.
“This is what is called a circular argument. ”
Your inability to understand simple logic is breathtaking. And also a massive distraction from the point.
“Jim said: “Let’s deal with a digital display the gives the values 19 and 20 multiple times.””
That was the second argument I’m still addressing the first, 2 measurements one 19 the other 29, each with an uncertainty interval of at least 0.5, and the question that there is no interception between the two intervals.
If you have multiple measurements of 19 and 20 you can make a better statistical argument for the most likely true value.
“So where did you get 19.5? ”
It was the average of 19 and 20, and if the uncertainty interval is exactly ±0.5 it’s the only possible solution.
“You have NO idea of how the instrument came up with the displayed value – BECAUSE OF THE UNCERTAINTY.”
Yes, that’s why I suggested the I trrvals were going to be bigger than ±0.5. Hence the claim that there is no intercept is absurd.
“How do you get an average of 19.5 when you have no idea of what the tenths digit is?
”
You add the two numbers together and divide by two.
You never answer the question as to what you think the average if 19 and 20 should be. You say it’s dishonest to report it as 19.5. I think it’s more dishonest to report it as 20.
“If you took 10 measurements and 9 of them were 19 and one was 20 what would the average be?’
Can’t you figure that one out yourself? You claim to have done every exercise in every text book yet don’t even seem to be able to do a simple average.
The answer is 19.1.
A useful tip for you is to guess an average then average the differences. As most of the numbers are 19, start by assuming the answer is 19. 9 of your results have a difference of 0, one has a difference of +1. Add those together, divide by 10 and add that to your original guess.
“How do you know that average has any physical meaning if you can’t measure with that resolution?”
You don’t know if it’s correct, that’s why there is uncertainty. What you say is it’s the best estimate given the data. It’s a better estimate than the 20 you might have got if you only measured once, and a slightly better estimate than 19 you would get if you rounded to the nearest integer.
“How do you know the true value of the average isn’t 19.4? or 19.6? or 19.2? ”
Because I was using a hypothetical example to illustrate the absurdity of Jim’s claim.
“You keep saying that significant digit rules and resolution rules are “suggestions” and not reality based.”
Yes, I think that’s a reasonable summery of my position. I’m not saying it’s one everyone would agree with, but I like to think for myself.
“That may be true but they exist to keep people like you from doing what you are doing. ”
What have I done? I’m just pointing out the absurdity of your position. I’m not even sure you know what your rules are.
“unless, that is, you are a climate scientist or a statistician.”
You still refuse to accept that all your rules about uncertainty are statistics.
The rules are in textbooks and the GUM and are on many websites. It is unusual for an “expert” such as yourself to never show any resources that confirm your position.
The fact that you don’t understand the rules is not anyone’s fault but your own.
Keep in mind most of these discussions don’t even meet the broader categories of uncertainty budgets and what is included in them. It doesn’t reach standard uncertainties associated with other probability distributions. There are many that are Type B and considered rectangular or triangular. It doesn’t reach using expanded uncertainties which most industries and laboratories use.
You want to do something to show your chops, here are categories in an uncertainty budget for ASOS stations. Tell what you calculate for the uncertainties and sensitivities and expanded uncertainty.
Repeatability
Sensor accuracy
Radiation loading (shield)
Ventilation / wind dependence
Digital resolution / rounding
Temporal sampling (30 s → 1 min)
Representativeness / siting
Long‑term microclimate drift (land‑use, shield aging, RTD drift)
Then show the reproducibility uncertainty as calculated by a given month.
“The rules are in textbooks and the GUM and are on many websites. ”
None of the rules you quote are in the GUM. All the GUM and other text books say is that the calculated uncertainty should be the basis for determine the number of decimal places written. The main difference between text books is the number of digits in the uncertainty. From memory, Taylor says normally only one digit unles the first is a 1 or possibly a 2 in which case you should use 2 digits. Bevington says usually 2 digits unless the first digit is large in which case only one, whilst the GUM says not too many digits, at most 2. Though they all say you can add an extra digit to avoid rounding errors.
I’ve always said this is a much better system then that of implied uncertainties based on orders of magnitude, and simplistic rules that ignore the actual propagation of uncertainty.
” It is unusual for an “expert” such as yourself to never show any resources that confirm your position.”
Not an expert, but I have quoted resources. I did so the last time you were whining about this. You dismissed them by claiming they must have been written by mathematicians and not physists.
“The fact that you don’t understand the rules is not anyone’s fault but your own. ”
I understand them. I don’t agree with them. And I certainly don’t think they are laws of nature on the way you imply.
Again demonstrating nicely your abject (or willful) ignorance.
Yes, you still are unable to comprehend that uncertainty is not error.
Actually, the real value could 18.6 or 18.8. All you know is that, by itself, the value could be 18.5000 to 19.4999. And, you could be averaging 19.5 for the 20 value. It is why the last digit is the uncertain position.
Again, nice try, but I have yet to see “set theory” mentioned in any discussion of measurement uncertainty in JCGM documents, in any of my metrology books, or in any NIST document.
Did you not read my post? On a digital display, the last digit is the uncertain digit. That means ±1 at a minimum. Rounding is following a well used practice that says to round to the uncertain digit.
“Again, nice try, but I have yet to see “set theory” mentioned in any discussion of measurement uncertainty in JCGM documents”
It isn’t. They use probability theory. However you were specifically asked
Which is asking about set theory.
It is sometimes used in uncertainty quantification when dealing with epistemic uncertainties, something I think Pat Frank was alluding to in his analysis.
“Did you not read my post? ”
Still not answering my question. The mean is not a single measurement from the device it’s the best estimate of the value based on multiple measurements. If your best estimate is 19.5 based on two instruments why is it more honest to quote an average of 20, with an implied ±1 uncertainty? How honest is it to ignore half your data?
“You need to study.”
And you need to address my point, rather than go of on these distractions. The point was that the 0.5 is not directly measure, it’s the result of averaging two direct measurements. Nothing you say is relevant to that point.
If it’s not measured then its part of the Great Unknown.
Where is your crystal ball that you use to peer into the Great Unknown? Be careful someone doesn’t steal it from you!
I said it wasn’t measured directly. But of course the true value is unknown. That’s true if you take an average or measure it directly. If you can know the value there would be no uncertainty.
As always, you hide behind these cute catchphrases, and pretend I’m saying something I’m not, rather than address the point I’m making.
The “points” you make are unintelligible.
If you can’t measure it then it is part of the GREAT UNKNOWN. You can’t determine it by any means other than guessing!
” That’s true if you take an average or measure it directly.”
The average is *NOT* a piece of measurement data. It is not a measurand. It is a STATISICAL DESCRIPTOR of a set of data. It does not determine the value of the any of the data. It is not a functional relationship with the data. It is part of describing the SHAPE of the actual data distribution. If the actual data distribution is skewed it is not even useful in determining a “best estimate” for the next measurement!
They are not “catchphrases”. They are statements of basic metrology concepts. The fact that you can’t seem to grasp those basic concepts is *YOUR* problem, it is not an issue with the basic concepts.
“If you can’t measure it then it is part of the GREAT UNKNOWN. ”
It doesn’t matter if it’s measured directly or not, it’s still “unknown”. That’s why there is uncertainty.
If you have some deeper meaning by calling it great and writing it in capitals, is your problem, unless you actually want to explain what you think “GREAT UNKNOWN” actually means.
“You can’t determine it by any means other than guessing!”
Really? I’ve got an idea – why not add up all the measurements and divide by N? No need to guess.
“It is not a measurand. ”
And we are back to this point. If it’s not a measurand it can’t have a measurement uncertainty.
“They are not “catchphrases”. They are statements of basic metrology concepts.”
Could you provide a metrological reference that define “the great unknown”?
You STILL can’t grok the difference between error and uncertainty.
But you said you could know the 0.5 WITHOUT measuring it? How? And here you are saying that you *can’t* know it, that it is unknown.
So which is it? Pick one and stick with it!
The Great Unknown is that dimension that we can’t see, measure, or know. All we can know is that the Great Unknown exists.
If you have two measurement values of a measurand, one being 19 and the other 20, the actual value of that measurand is part of the Great Unknown! It exists. But we can’t see it, can’t measure it, can’t know it.
Your problem is that you are stuck in the “true value +/- error” meme just like you are stuck in the “all measurement uncertainty is random, Gaussian, and cancels” meme.
The “average” value becomes the “true value” for you and the measurement uncertainty then somehow becomes an error term for you.
How precisely you can calculate that average becomes a metric for how close you are to the “true value”.
You simply can’t get it into your head that the average is a best GUESS, just like a carnival fortune teller GUESSES at your future. It doesn’t matter that the distribution may not be Gaussian, in your world EVERYTHING is Gaussian so the average is the true value. It never occurs to you that sometime the long shot wins – the long shot is actually the true value, not the average.
The measurement uncertainty interval defines the boundary of the Great Unknown of measurements. You simply can’t know if 19.5 is the “true value” or not, it’s just a best GUESS that only works part of the time and probably not often in the real world!
You’ve not been able to shake that “true value +/- error” meme in going on three years. At this point it can only be due to willful ignorance. You don’t *want* to shake it because it makes your belief in things like the GAT into garbage and you can’t have that! It’s a religious truth, a matter of dogma to you that all measurement uncertainty is random, Gaussian, and cancels so that the SEM tells you how close you are to the TRUE VALUE – i.e. GOD.
“Really? I’ve got an idea – why not add up all the measurements and divide by N? No need to guess.”
And what if the distribution is not Gaussian? What if it is highly left tailed? Is adding up the measurements and dividing by N applicable to anything? Is the average then the expectation for what the next measurement will be? Or is a better guess the MODE?
You are *still* stuck in that meme of “all measurement uncertainty is random, Gaussian, and cancels”. That’s the ONLY thing you know. It’s the only thing that lets you consider the average to be the TRUE VALUE!
Who ever said that?
If you can’t MEASURE IT then it doesn’t have a measurement uncertainty.
You don’t *measure* an average, not even by measuring components that *can* be measured. The average is a statistical descriptor, not a measurand.
How many times does this has to be explained. The shape of a distribution of values IS NOT A MEASURAND. It is a statistical descriptor.
It is many times called an “average” but there are MANY different kinds of average. Why do you assume that the arithmetic average is even applicable to a temperature measurement data set? Perhaps a logarithmic average would give a better description of the shape of the temperature data.
The point being that since there are many different types of average then there is no functional relationship based on physical theory or law that defines what the “best guess* actually is.
It’s a DESCRIPTOR, not a measurand. It’s like saying a scribble on a piece of paper is a drawing of a nose. Maybe it is, maybe it isn’t. It’s a GUESS at the Great Unknown!
So far you have provided no sources other than yourself that one should not quote measurement values that were not measured, even when averaging.
Ask yourself why ASOS stations have accuracy uncertainty of ±1.8°F when their resolution is 0.1°F. Ask yourself why you can’t find a climate science paper that shows an uncertainty budget for the measurements they use. Ask yourself why you have never posted a measurement uncertainty for a typical Tavg value.
*raises hand* — because climastrology throws all the variance in the garbage can!
This is an easy one, he’s got a line into the bellman cloud of confusion.
Random measurement uncertainties do not decrease through averaging. An average of values with different uncertainties may end up with a combined uncertainty somewhere in between but that is unlikely unless you are averaging stations with vastly different uncertainty values. As I showed you in a prior message, if you are averaging different uncertainties you must do a direct addition of all the uncertanties then average.
You obviously have not studied metrology nor the GUM. If you had, you would know that a combined uncertainty contains all those. Perhaps you need to ask your favorite AI what an uncertainty budget is and what components are included. Here are a few.
Calibration – systematic
Sensor accuracy – systematic
Resolution – systematic
Radiation sheild effects – systematic
Ventilation effects – systematic
Data logger – systematic
Sensor drift – systematic
Sampling uncertainty is added to the budget. It is the standard deviation of multiple observations of the properties of a measurand. See the GUM F.1.1.2 aand H6 that discuss this.
How do you average 1 measurement?
A fact the averagers always run away from?
The GUM defines an input quantity as a specific measurement used to determine value of a measurand. An input quantity may be a measurand itself. A measurement can consist of a single input quantity, which is what I think you are asking.
A Type A statistical analysis of a single input quantity requires multiple observations of the same thing using repeatable conditions. Those multiple observations will form a probability distribution from which a mean and standard deviation can be determined.
A Type B measurement uncertainty is also a common type of uncertainty. It is developed from documents, experience, etc. This is where an uncertainty budget is used. An uncertainty budget contains different influence quantities that can affect observations. It is especially needed when only a single measurement can be taken. Atmospheric temperatures are generally considered single measurements since they can rapidly change in time and because they are reported as a unique value.
The end result is that a measurand has two values, the best estimate or central value and an uncertainty interval.
The premise of the article is that a comparison of 1 reading on 1 instrument on 1 specific day is either higher or lower than the equivalent reading on an equivalent instrument on a specific equivalent day 130 years apart. Averages have nothing to do with that comparison.
“Averages have nothing to do with that comparison.”
Uh, they do if it is climate science. They use the mid-range value of Tmax and Tmin as their temperature for the day. A statistical idiocy. Tmax and Tmin define the *range* of the data, not its shape or distribution. The mid-point of the range can be far, far away from the center of gravity of the distribution or even the mode of the distribution.
The GAT “anomalies” are based on subtracting the daily mid-range value from a long term, daily mid-range average value.
It’s averages all the way down.
Every one wants to make this more complicated than necessary. What we are looking for a comparison of T-Max on one day vs. T-Max for a different day. It has nothing to do with averaging. It has nothing to do with the average daily temperature. One might question the calibration of the various instruments and the sensitivity of one vs. the other, but nothing else.
It isn’t complicated once one realizes that measurement uncertainty intervals exist around even single measurements. It is where climate science propagandizes the common folk. They should simply say there is no measurable difference between the two, instead of indicating there is a difference.
But then how do they scare people and continue getting their grant money?
Mr. 31: I read the premise to be that one of the readings was excluded from the data that is “averaged”. Don’t you wonder why??
The problem is that a single reading with a measurement uncertainty of ±1°C means you can have an interval from 26 to 28 °C. Remember, you don’t where in the interval the “true value” actually is, only that it is likely that it is in the interval. Comparing it to another measurement with a slightly different value inside essentially the same interval, one cannot say one is higher (or lower) than the other. They are essentially the same, in other words, no statistically significant difference.
This is where “climate science” runs off the rails with physical science. Claiming to know the difference between temperatures to the 100ths decimal place is a joke.
bellman falsely assumes the uncertainty interval also gives a probability distribution (you know which one) that allows him to peer into the unknown.
You are again making a fool of yourself.
See above. Look, you idiot, the uncertainty of an arbitrary linear combination with positive weights and pairwise independent measurements is sqrt(SUM u_i^2 w_i^2)/(SUM w_i). The only constraint is pairwise independence. There is no constraint on the distribution, they do not have to be Gaussian, the weights do not have to be equal, the uncertainties do not have to be equal, all the bs you usually come up with is irrelevant. Independence is the only requirement, and I know you get confused by (among many other things) the fact that the measurand is correlated among measurements. But measurement uncertainty is about the _error_ of the measurement, not the measurand itself, and uncertainty is certainly independent, ie. the non-systematic error from two thermometers (or two measurements with the same thermometer a few minutes apart) are not correlated.
BTW if w_i=w_j and u_i=u_j and SUM w_i = 1 you get the familiar square root law: sqrt(SUM u_i^2 w_i^2)/(SUM w_i) = sqrt(n*u^2/n^2)/1 = u/sqrt(n). I hope a simple substitution into a simple formula is not something that’s beyond you. Well, I have doubts, you have always demonstrated hair rising stupidity.
Oh gee, the trendology-troll pulls out Prof. Ad Hom. You better hope Banton the Hypocrite doesn’t see this.
Well, this is debatable. Jim displays a high level of stupidity, diligence, and self confidence, and these together result in the complete poisoning of any meaningful debate. This old cretin cannot handle a formula, he fails to grasp sometimes the simplest thing. And voila, he and his retarded brother are always in the comment section.
More ad hom from the nasty troll person.
*click*
As I expected, you’ve again failed to react in substance. The debate here is about uncertainty and its propagation through various operations (foremost importantly, weighted averaging). You have nothing to add to that, and Jim has such a profound inability to understand this that it only matches his urge to write posts in the subject drowning even the simplest debate about facts/measurements/data in a sea of bs. Jim is objectively a duckhead, and I’m just pointing that out while giving actual information in the subject.
Propagation of measurement uncertainty has nothing to do with division by the number of measurements. NOTHING! You are just like the others, trying to claim that sampling error is measurement uncertainty.
IT ISN”T.
Yet you have yet to show any references at all from any metrology source to substantiate your assertions. One can only assume that you consider yourself the untmost expert in the subject and therefore need no further references.
Guess again. Show us something from the JCGM documents that show measurement uncertainty is not the standard deviation of the observations.
measurement uncertainty ≠ standard deviation of the mean
I sincerely expect that you cannot supply the derivation of when the standard error of the mean is useful or the requirements for when it applies. Believe me, it is not often. I will give you a hint, it is in a metrology textbook which you obviously don’t have.
Why should I give any references when you are unable to understand them? You even quote them without understanding what you quote, see above:
It essentially always the stdev of the empirical distribution that was obtained during calibration. In other words, this is just the stdev of a random variable, and thus it behaves like the stdev of random variables when we apply operations to them (like averaging). From this point on this is just essentially high school level maths to get these formulas like the square root law.
“It essentially always the stdev of the empirical distribution that was obtained during calibration. In other words, this is just the stdev of a random variable, and thus it behaves like the stdev of random variables when we apply operations to them (like averaging). From this point on this is just essentially high school level maths to get these formulas like the square root law.”
Meaningless word salad!
Exactly how does anything you’ve said here apply to measurement uncertainty?
Are you simply unable to admit that the GUM defines measurement uncertainty as the standard deviation of the data and *not* the sampling error associated with the average?
And you simply can’t tell the difference between sampling error and measurement uncertainty. Just like erosion and bellman!
nyolci is just like bellman and erosion. None of them understand the difference between sampling error and measurement uncertainty!
And they don’t care, all they want are tiny numbers to make their data gyrations look good.
This all boils down to the ingrained meme of “all measurement uncertainty is random, Gaussian, and cancels”.
They continually deny they assume that meme but it comes across in EVERYTHING they assert.
No systematic measurement uncertainty exists and if it does it is random and cancels as well. No asymmetric measurement uncertainty exists and if it does it is random and cancels as well.
That means that the average becomes the TRUE VALUE if you can just take enough measurements.
They don’t even recognize that since variance is the metric for uncertainty, the more measurements they take the more outliers they will generate and the wider the variance will become (see Bevington on this).
None of this trio has ANY understanding of the physical world and physical measurements. They are blackboard statisticians living in a statistical world. Any assumption you want to make is valid.
YEP! If they actually groked how uncertainty is quantified by variance, they would step away from 1/root(N) like it was a pile of doggie doo-doo.
Meanwhile bellman is claiming he uses relative uncertainties “all the time.”
And yet he couldn’t understand how Possolo used relative uncertainties in his example on the measurement uncertainty of a barrel. He even claimed the GUM doesn’t provide for the use of relative uncertainty in the propagation of uncertainty.
He *still* hasn’t figured out that relative uncertainty is not just for multiplication/division but also for when there is a large difference in the stated value, e.g. a typical one-man canoe can have a ratio as high as 7:1 for length vs width. When calculating the area or volume of the canoe the use of relative uncertainties is appropriate. 15′ +/- 1″ compared to 2′ +/- 1″ for a canoe has similar absolute uncertainty values but not equal contribution to the measurement uncertainty of the volume. The 15′ +/- 1″ is a much more accurate measurement. 1″/180″ is much smaller than 1″/24″. It simply wouldn’t make any sense when calculating area or volume to just add the absolute values of 1″ for both measurement uncertainty.
“And yet he couldn’t understand how Possolo used relative uncertainties in his example on the measurement uncertainty of a barrel”
I’d say stop lying, but then you wouldn’t have any arguments.
“He even claimed the GUM doesn’t provide for the use of relative uncertainty in the propagation of uncertainty. ”
There you go again. What I’ve tried to explain to you many times is that you can only use the simplified equation involving relative uncertainties, when your function is if the correct form, and that an average is not the correct for for that.
“He *still* hasn’t figured out that relative uncertainty is not just for multiplication/division but also for when there is a large difference in the stated value…”
Then you need to explain why you think that the GUM, Taylor, etc got it so wrong.
“When calculating the area or volume of the canoe the use of relative uncertainties is appropriate”
Because area and volume are obtained through multiplication.
“The 15′ +/- 1″ is a much more accurate measurement. 1″/180″ is much smaller than 1″/24″. ”
Tisch, confusing accuracy with precision.
What you are saying about the differences in relative uncertainty isn’t wrong for muktiplication. But an easier way of seeing it is to start with equation 10 and see that when you multiply two numbers together, the absolute uncertainties will be multiplied by the size of the other value. This means the same absolute uncertainty on the smaller side will have more impact on the combined uncertainty.
This doesn’t apply when adding two values, which is why the relative uncertainties don’t affect the combined uncertainty of a sum.
“You are again making a fool of yourself.”
The only fool is you. Measurement uncertainty does *NOT* decrease through averaging.
Just do the basic 2-board experiment. If I add a board of 1′ +/- 1″ to a second board of 1′ +/- 1″ does the sum of the two boards wind up with a measurement uncertainty that is somehow smaller.
1′ +/- 1″ becomes 12″ +/- 1″ or an interval from 11″ to 13″. 11 + 11 = 22, 13 + 13 = 26
Two of them together form a length that will be the sum 12″+12″ = 24″. The uncertainty interval will be 4″ (22″ to 26″) or +/- 2.
The measurement uncertainty doesn’t decrease. IT GOES UP!!
“ Look, you idiot, the uncertainty of an arbitrary linear combination with positive weights and pairwise independent measurements is sqrt(SUM u_i^2 w_i^2)/(SUM w_i).”
Have you EVER seen climate science use a weighted average?
My guess is that you don’t even understand that, when it comes to measurement uncertainty, there can’t be a common weighing factor. You want to weight the most accurate measurement with a larger weighting factor than the least accurate measurement.
e.g. The weighting factor for each measurement should be related to 1/σ_i. Or, if you like, to 1/u_i)
Doing this gives the least accurate measurement, i.e. u_i is larger, less weight than the most accurate measurement where u_i is smaller.
What you are trying to do is turn SAMPLING error into measurement error! It isn’t. Your weighting has to do wtih sampling error!
And, as predicted (ie. “sea of bs”), the retard barrage has been on the way already. Tim, you are again lost in the sauce. Without much commentary, the gems:
(No one was talking about sampling error)
(The fact that even this above is false is beside the point. We were talking about (weighted) averages, that is not a simple division.)
(As for “Gaussian” and “cancels”, I explicitly stated that the only requirement is pairwise independence of measurements. Regarding “random”, uncertainty is by definition obviously that, random, this is the part of the error that is modeled with a random variable)
(This sentence is a true gem)
(Uncertainty means something different. Hint: it involves probability.)
(Yes, eg. area weighting in average temperature calculations.)
(For the 1000th time, weighting is not a tool to _reduce_ uncertainty.)
You use of 1/sqrt(n) IS the very definition of sampling error! The more observations you have in a sample the smaller the sampling error gets! That is the exact opposite of measurement uncertainty! With measurement uncertainty random effects will create outliers as the number of samples is increased. This INCREASES the measurement uncertainty by expanding the pool of values that can be reasonably attributed to the measurand.
—————————-
2.2.3 The formal definition of the term “uncertainty of measurement” developed for use in this Guide and in
the VIM [6] (VIM:1993, definition 3.9) is as follows:
uncertainty (of measurement)
parameter, associated with the result of a measurement, that characterizes the dispersion of the values that could reasonably be attributed to the measurand
—————–(bolding mine, tpg)
Dispersion of the values *increases* as more observations are made. Just a fact of life, it doesn’t matter whether you like it or not or whether you believe it or not.
And for measurements, you weight the more accurate measurements more heavily. The exact opposite of what you asserted! They are weighted by 1/u(i).
You have STILL not learned *anything* about metrology.
1.- uncertainty is *NOT* totally random. Systematic uncertainty is *NOT* random and is not amenable to statistical analysis of observation data. It is *only* identifiable by calibration to a known standard. It is why high level machinists many times calibrate their measurement devices BETWEEN MEASUREMENTS.
2.- Error is *NOT* uncertainty. Error implies you know a true value which, as the GUM states, is unknowable. Nor does a random variable “model” a measurand. You have a real problem with thinking the map *is* the territory. Sorry, but that just isn’t the case. Even highly asymmetric distributions can be “random”. However, there may be little “cancelling” of random effects on the measurements making up the distribution. That makes even root-sum-square questionable when determining final measurement uncertainty.
3.- Total measurement uncertainty is a sum of the random and systematic effects. u_total = u(random) + u(systematic). Since u(systematic) is *not* amenable to statistical analysis there is no way to determine u(total)-u(systematic) in order to define u(random). You can, however, develop a measurement uncertainty budget that identifies as many components of systematic uncertainty as possible and apply corrections to the measurements to account for them – IF they can be quantified. Hubbard and Lee found clear back in 2002 that you simply cannot develop a common “systematic correction factor” for a grouping of temperature measuring stations. There are simply too many effects that are different at different times and different places. Applying regional corrections factors in such a case *increases* measurement uncertainty, it doesn’t eliminate it. They found that corrections must be done on a station-by-station basis, preferably by using a calibrated standard. Again, “guessing” at a correction only *adds* to the measurement uncertainty, it doesn’t make it smaller.
That’s YOUR meme, not mine. I merely observed your continual use of the meme.
When it comes to metrology and measurements it means *exactly* what the GUM defines it as being:
—————–
parameter, associated with the result of a measurement, that characterizes the dispersion of the values that could reasonably be attributed to the measurand
—————-
There is *nothing* that requires that dispersion to be symmetrical, Gaussian, or anything. It may be highly skewed left or highly skewed right. it may even be multi-modal!
You seem to think that “probability” always means Gaussian so you can ignore what form it actually takes. The assumption of a statistician, not of a physical scientist or engineer who has to work with measurements and measurement uncertainty in the real world.
And here we go AGAIN. Area weighting is to minimize SAMPLING ERROR! Read that for meaning and context – S A M P L I N G E R R O R. It does *NOTHING* for reducing measurement uncertainty! Climate science thinks that because the temperatures are *correlated* that they are equal. Just one more garbage assumption by climate science.
If you don’t weight the more accurate measurements higher than less accurate ones when calculating the measurement uncertainty of the average, then you let the less accurate measurements with larger variance (e.g. more outliers) make the measurement uncertainty appear larger than it actually is. It’s like saying you would put multiple measurements done with an old, porous wood meter stick together with a single measurement from a titanium meter stick just calibrated against a known standard and let the measurement uncertainty of the wood meter stick dominate!
It’s what I would expect of a statistician and a climate scientist.
Jesus… The usual thing. It’s very hard to debate you for all the wrong reasons. Again: this is the uncertainty of an average of measurements if measurements are independent, the uncertainties are the same and all are are weighted with 1/n.
No one was talking about systematic error, your fokkin strawmen are annoying. The uncertainty (the actual spread if when all other things are equal, eg. when you truly measure the same thing with the same instrument but you inexplicably get slightly different results) on the other hand is modeled as a mathematical random variable in metrology.
We don’t care about that in an analysis where we are interested in the propagation of the “random” part. Again, I explicitly stated this.
And it is not required to be. Again, I explicitly said that the only requirement was pairwise independence. No other requirement exists for the square root law (or its generalization).
CAN YOU COMPREHEND IT AT LAST?
This is hilarious. So apparently you can calculate the propagated uncertainty. But again the confusion and convolution of your thinking. Weighting has nothing to do with decreasing uncertainty, and it does not even make sense if you used your brain a bit ‘cos weighting skews the average, it does not affect solely the uncertainty. The most important application of weighting here is a “conversion” of the intensive temperature to an extensive quantity so that it can be averaged. You are constantly crying about this, and we constantly point this out.
“Again: this is the uncertainty of an average of measurements if measurements are independent, the uncertainties are the same and all are are weighted with 1/n.”
You are as bad as all the rest. Here you are lecturing people on a subject you know NOTHING about.
There are two types of measurements. Those done in a Type A measurement uncertainty process and those done in a Type B measurement uncertainty process.
For Type A the measurements HAVE NO MEASURMENT UNCERTAINTY associated with them. They are stated values only. The standard deviation of the stated values becomes the measurement uncertainty.
For Type B the individual measurements have an applicable measurement uncertainty AND THEY ARE NOT ALL THE SAME! They might be but that is *NOT* a requirement or even a good assumption in 99% of cases!
There is *NO* weighting of any of the measurement uncertainties done in either case other than weighting by 1/u_i in order to give the more accurate measurements (i.e. smaller uncertainty interval) a higher contribution to the total than less accurate measurements.
Like I keep telling your compatriots on here:
READ THE DAMN GUM FOR MEANING AND CONTEXT.
“Again: this is the uncertainty of an average of measurements if measurements are independent, the uncertainties are the same and all are are weighted with 1/n.”
Boy is this an understatement.
“No one was talking about systematic error, your fokkin strawmen are annoying.”
If you are talking about measurment uncertainty then you are talking about:
u_total = u_random + u_systematic
You can’t discuss measurement uncertainty without discussing BOTH u_random and u_systematic!
Even if you assume that u_systematic = 0, you do *NOT* weight u_random by 1/n.
u_random is what it is! Period. Exclamation point. It is the dispersion of reasonable values that can be attributed to the measurand. You don’t weight the dispersion interval by 1/n!!!
For any single measurement “n” = 1. That measurement is given as “best estimate +/- dispersion interval”. There is only ONE BEST ESTIMATE. “n” equals 1!
You can assume the dispersion interval to be zero. But then there is NO UNCERTAINTY TO DIVIDE BY “n”!
“We don’t care about that in an analysis where we are interested in the propagation of the “random” part. Again, I explicitly stated this.”
You do *NOT* propagate the “random” part. You propagate u_total! ALWAYS! If you don’t know what u_systematic is then how do you even know what u_random is? It may be different for each measurement!
A given measurement consists of “best estimate +/- measurement uncertainty”, e.g. v +/- u. There are no other components. If you consider the measurement uncertainty to be a standard deviation, which the GUM does, then u/√n is a statistical descriptor for “v”. It doesn’t affect “u” in any way.
If you assume that the average is the BEST ESTIMATE, the u/√n gives you an accuracy estimate for the average value, i.e. for the Best Estimate – IF THE UNCERTAINTY INTERVAL IS GAUSSIAN. If it isn’t Gaussian, and many times in the real world it isn’t, then all bets are off since the average probably will *NOT* be the Best Estimate.
The measurement uncertainty interval, “u” is not affected in any way! The measurement uncertainty of “v” remains “u”! And it is “u” that gets propagated – NO DIVISION BY “√n”, not even if “u” is totally u_random.
“And it is not required to be”
If it is not then dividing by √n is meaningless. The mean of a multi-modal distribution is meaningless. It does *NOT* properly describe the distribution. If the distribution is skewed then the mean is meaningless. It doesn’t properly describe the distribution. It may tell you how precisely you located the mean of each distribution but the mean is useless.
“ No other requirement exists for the square root law (or its generalization).”
There is *NO* “square root law! As I’ve tried to explain to bellman but he just doesn’t understand (and apparently neither do you), dividing the standard deviation of the population by √n is a short cut estimator for the standard deviation of the sample means distribution. If you have only one sample then you only have one sample mean – and one mean does *NOT* create a sample means distribution. How closely SD(sample)/ √n describes the average depends on a number of things. Some are that the sample is a perfect representative of the population (typically IID), that the population is non-varying (i.e. totally stable), and that the population is Gaussian.
NONE of these are met for any global temperature data set. My guess is that you don’t even understand that the SD/√n descriptor is based on the CLT theorem and describes the peakedness of the Gaussian distribution derived from the sample means distribution. bellman doesn’t, nor do any of the others on here trying to justify using the SEM as the measurement uncertainty of the global temperature data sets.
“The most important application of weighting here is a “conversion” of the intensive temperature to an extensive quantity”
Conversion from an intensive property to an extensive property is almost ALWAYS a scaling process, not a weighting process.
You can’t even get this one correct!
You are now just slinging shite against the wall trying to gaslight everyone that you know something about the subject of metrology.
And weighting by 1/√n is *NOT* scaling anything from an intensive property to an extensive property.
Your math sucks.
First, u꜀(Xᵢ) must have its uncertainty propagated across all the “i” values used in the weighting. You cannot take just use the value at one station and multiply it by a fractional weighting. In other words, for 5 stations in the weighting,
u꜀(Xᵢ) =√[u(X₁)²+u(X₂)²+ …+u(X₅)²]
If you had done this when finding the average of 5 stations, you would have the correct uncertainty to multiply by a fractional weighting.
Here is a copy of pages from a textbook on measurement uncertainty. X and Y can be the same or different it doesn’t matter. They can be X+Y or X-Y, it doesn’t matter. The uncertainties can be the same or different, it doesn’t matter. What matters is that the uncertainties add in quadrature. That is, √[u(X)² + u(Y)²]

There is no such thing as “simple” bias. What climate scientists claim as bias is a difference in trend between a prior measurement device and a new one, whether due to a move, new device, or even land use change. That is not bias. It is measuring different measurands and/or using different devices. The measurements can all be 100% accurate but different due to different influence quantities. The old record should be stopped and a new one started. I am sorry that means you cant claim a 100 year record. That is life.
I have never been allowed to adjust data based on something like this in school or career. It is noted in the record and why if available. Data is sacrosanct. If you cant trust it, so be it. Declare it not fit for purpose.
One commenter on Dr. Spencer’s blog post actually generated a temperature anomaly series for the UK region using UAH LT grid cells and compared it with a GHCN surface station series:
https://www.drroyspencer.com/2025/12/the-record-hot-uk-summer-of-2025-validation-of-the-ukmo-methodology-but-the-record-was-only-in-tmin/#comment-1726175
Both agree remarkably well on the accelerated warming since 2000: +0.31 ± 0.06°C/decade for GHCN versus +0.30 ± 0.08°C/decade for UAH LT.
And, as the commenter noted, their running means show similar ups and downs despite the two series being derived from fundamentally different observations—surface stations versus satellite-derived lower-tropospheric temperatures.
In short, three substantially different datasets/methodologies (UKMO, the GHCN surface-station analysis, and UAH LT) produce mutually consistent recent temperature trends over the UK.
Thanks, downvoter, for validating my post!
“exceeded 27.0C/80.6F, on the 24th, 25th, 237th”………Sure was a long hot month.
Regardless of general daily records; In the ~360 year CET, 2026 is a massive record breaker. By far the warmest year. Very few individual days have had a mean temperature at or below their average, and lots have posted new daily records.
You aren’t going to discredit that. (But no doubt the belief blinded posters will still down vote and refuse to accept.)
So what was the instrument accuracy 360 years ago, during the LIA?
Who cares when modern temperature change is already quite rapid.
Define “rapid”
No. please don’t.
Yes, please don’t expose deniers to reality. That would be absolutely awful.
No, wait—it’s the most fun thing!
“Who cares when modern temperature change is already quite rapid.”
Where ???
Nothing new under the sun …
The reality is that there is no way to know if it is more rapid than previous eras.
You never show that any difference from long past temperature changes rapididly to todays such as year 1700 or 1600 or 1500……
You are being silly in this.
I nominate this post for Understatement of the Day.
The population of England in 1650 was ~5 million, population of England in 2025 was ~59 million.
That is at least one massive confounding factor.
Yep. Every extra body adds 98.6 F to the temp counted at heads.
Plus all that extra exhaled CO2.
🤣🤣🤣🤣🤣🤣
The CET long term trend is overall ~ +1C, mostly due to warmer winters.
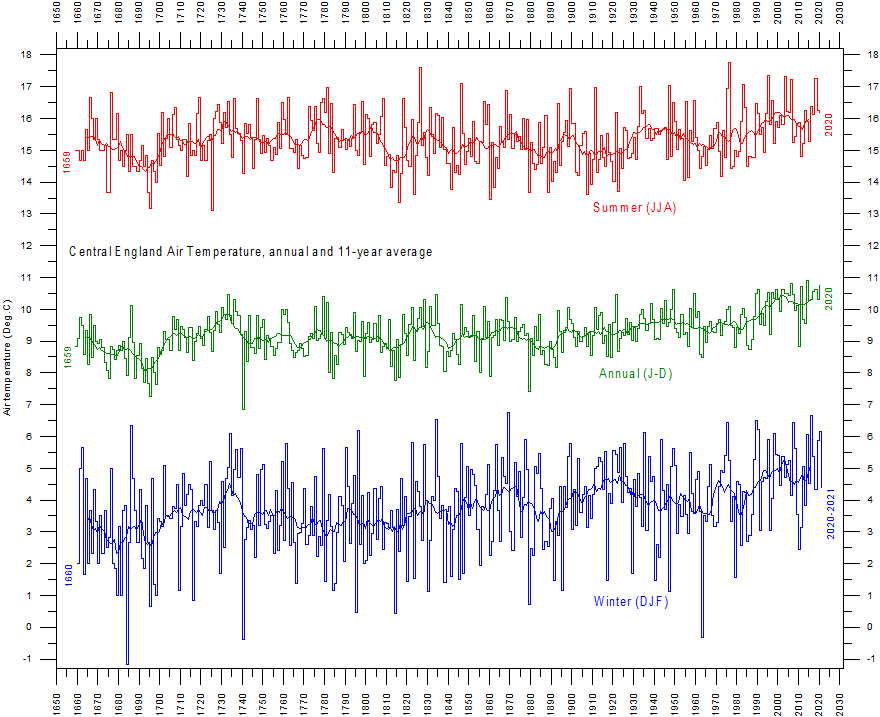
Warmer Winters = less deaths during Winter.
As, relato weather, Winter kills most people, the Malthusians consider warmer wetter a catastrophy.
“The CET long term trend is overall ~ +1C, mostly due to warmer winters.”
In fact summer temps have risen ~1.5C in 145 yrs.
The sun rises in the east and water freezes at 0 °C. Both of those statements are about as trivially true as your graph. Summer temperatures have risen ~1.5 °C in approximately 150 years since the little ice age. So, what’s your point.
Half of that warming occurred prior to any significant increase in CO2.
It is even more damaging when you start at the beginning of the warming trend at year 1700 running to 1880 when there was 180 years of warming without ANY corresponding CO2 increase in the atmosphere at all.
This the time when the LIA cooling trend ended as the planet has been crawling out the 350-year cold phase ever since.
This is constantly ignored by the climate cultist.
“The CET long term trend is overall ~ +1C, mostly due to warmer winters”
That’s covering a 360 year period with many different trends.
This graph is a bit clearer, using a rolling 30 year average.
It’s noticeable that during the 19th century (and a decade or two either side), summer temperatures were tending to cool, whilst winters were warming.
The linear trend from 1780-1920
Winter: +0.08 ± 0.05 °C / decade
Summer: -0.03 ± 0.03 °C / decade
The other seasons where essentially flat over that period.
But the period of modern global warming, say since 1970, both summer and winter have been warming at a fairly similar rate.
Trends 1970 – 2026
Winter: +0.27 ± 0.18°C / decade
Summer: +0.28 ± 0.14°C / decade
But it’s spring where the fastest rate of warming has been happening.
Spring: +0.37 ± 0.12°C / decade
Autumn: +0.28 ± 0.12°C / decade
Another violation of the Deadly Sin of Reification.
Mr. Nasty: You say we aren’t “going to discredit that.” Didn’t read the article, did you? It’s discredited already by binning data that may show higher temps excluded from your “record”. You are discredited.
“Didn’t read the article”
You mean the article pointing out that September 1895 was really hot, apparently to imply that modern extreme heat is nothing unusual?
According to deniers, isn’t the preindustrial record supposedly too uncertain to draw any conclusions from?
“modern extreme heat”
Where ??
IN YOUR OVEN ?
Mr. whatever: Yeah, that’s the article he didn’t read, usually you’re not so quick on the uptake. Mr. Homewood is not a denier, then?
As usual, you have no understanding of anything. Especially what those who aren’t party members are saying.
The argument is that those who have made a career out of torturing data, have proclaimed an accuracy for historical data that is unjustified by the data itself.
If indeed those records have been ‘binned’ then a crime was committed because destroying public, what those records are, property is a felony. What about an FOI to request those records to see if they still exist?
Will there come a time when an army of volunteers will descend on the nations libraries to scrutinise newspapers dating as far back as they go in order to collect the reported temperatures, thus restoring a temperature record more reliable than what the philistines have homogenised out of it?
I fail to understand why Paul Homewood is so fixated on the dry bulb temperature data collected from terrestrial weather stations. At best they can be indicative of trends. Is he maintaining that there is no rising trend in UK temperatures, or that the increase in temperatures is slower than reported? Climate crisis, if, when and where it occurs will be much more associated with wet bulb temperature.
No, he is signalling that the MET are data fiddlers.
Mr. Corcoran: Homewood reports that gov’t office is lying to you. Those same liars are telling you there’s a “climate crisis” to be found elsewhere, and you appear to buy that lie. Why don’t you consider it significant that they lied to you?
yep Everywhere Is Warming Faster Than the Rest of the World !
All of the places are warmer than average.
September 1895 was certainly very hot. According to the Met Office it was the equal warmest September for maximums, tied with 2023.
Minimum temperatures were much cooler though.
Of course all high temperatures in the UK and Europe are not caused by heat generated there. The hot air will always arrive there from Africa due to the pressure systems at that particular time directing the airmass up over Europe.
In fact it can be said that all warm to high temperatures originate around the world over inland areas where semi arid, rocky mountains and deserts areas absorb the solar radiation and the heat is then dissipated by the pressure systems
Was the 1895 measurement made in Fahrenheit and later converted? if I read correctly, the British did not start using Celsius and the Metric system until the early 1960’s. Comparing measurements that were made under different systems are iffy.
Nothing new. Clearly for many years part of the unofficial and unpublicized mission statement of the UK MET has been deception in support of a political objective.
They have already been caught doing this, repeatedly. If nothing is done to punish them then they will keep doing it.
A warmest date, day, month or even year is a meaningless observation, even if it is somehow correct. Might as well be looking for the warmest ten minutes in the last hundred years. Then it is for a specific location only.