From Dr Roy Spencer’s Global Warming Blog
by Roy W. Spencer, Ph. D.
The Version 6.1 global average lower tropospheric temperature (LT) anomaly for August, 2026 was +0.68 deg. C departure from the 1991-2020 mean, up from the July, 2026 value of +0.48 deg. C. It appears the effects of the strengthening major El Nino event are beginning to appear in the global average tropospheric temperature, with an August temperature anomaly of +0.9 deg. C in the tropics. This month I’ve added a plot of tropical temperatures (below).

The Version 6.1 global area-averaged linear temperature trend (January 1979 through August 2026) remains at +0.16 deg/ C/decade (+0.22 C/decade over land, +0.13 C/decade over oceans).
The following table lists various regional Version 6.1 LT departures from the 30-year (1991-2020) average for the last 32 months (record highs are in red).
| Year | Mon | Globe | NHem | SHem | Tropic | US48 | Arctic | Aust. | Can. |
| 2024 | Jan | +0.80 | +1.02 | +0.57 | +1.20 | -0.19 | +0.40 | +1.12 | +0.97 |
| 2024 | Feb | +0.88 | +0.94 | +0.81 | +1.16 | +1.31 | +0.85 | +1.16 | +2.45 |
| 2024 | Mar | +0.88 | +0.96 | +0.80 | +1.25 | +0.22 | +1.05 | +1.34 | +1.12 |
| 2024 | Apr | +0.94 | +1.12 | +0.76 | +1.15 | +0.86 | +0.88 | +0.54 | +1.39 |
| 2024 | May | +0.77 | +0.77 | +0.78 | +1.20 | +0.04 | +0.20 | +0.52 | +0.67 |
| 2024 | June | +0.69 | +0.78 | +0.60 | +0.85 | +1.36 | +0.63 | +0.91 | +0.19 |
| 2024 | July | +0.73 | +0.86 | +0.61 | +0.96 | +0.44 | +0.56 | -0.07 | +1.15 |
| 2024 | Aug | +0.75 | +0.81 | +0.69 | +0.74 | +0.40 | +0.88 | +1.75 | +1.36 |
| 2024 | Sep | +0.81 | +1.04 | +0.58 | +0.82 | +1.31 | +1.48 | +0.98 | |
| 2024 | Oct | +0.75 | +0.89 | +0.60 | +0.63 | +1.89 | +0.81 | +1.09 | +0.89 |
| 2024 | Nov | +0.64 | +0.87 | +0.40 | +0.53 | +1.11 | +0.79 | +1.00 | +1.61 |
| 2024 | Dec | +0.61 | +0.75 | +0.47 | +0.52 | +1.41 | +1.12 | +1.54 | +1.65 |
| 2025 | Jan | +0.45 | +0.70 | +0.21 | +0.24 | -1.07 | +0.74 | +0.48 | +1.04 |
| 2025 | Feb | +0.50 | +0.55 | +0.45 | +0.26 | +1.03 | +2.10 | +0.87 | -0.35 |
| 2025 | Mar | +0.57 | +0.73 | +0.41 | +0.40 | +1.24 | +1.23 | +1.20 | +0.80 |
| 2025 | Apr | +0.61 | +0.76 | +0.46 | +0.36 | +0.81 | +0.85 | +1.21 | +0.45 |
| 2025 | May | +0.50 | +0.45 | +0.55 | +0.30 | +0.15 | +0.75 | +0.98 | +0.81 |
| 2025 | June | +0.48 | +0.48 | +0.47 | +0.30 | +0.80 | +0.05 | +0.39 | -0.22 |
| 2025 | July | +0.36 | +0.49 | +0.23 | +0.45 | +0.32 | +0.40 | +0.53 | -0.23 |
| 2025 | Aug | +0.39 | +0.39 | +0.39 | +0.16 | -0.06 | +0.82 | +0.11 | +0.62 |
| 2025 | Sep | +0.53 | +0.56 | +0.49 | +0.35 | +0.38 | +0.77 | +0.30 | +2.44 |
| 2025 | Oct | +0.53 | +0.52 | +0.55 | +0.24 | +1.12 | +1.42 | +1.67 | +2.59 |
| 2025 | Nov | +0.43 | +0.59 | +0.27 | +0.24 | +1.32 | +0.78 | +0.36 | +1.47 |
| 2025 | Dec | +0.30 | +0.45 | +0.15 | +0.19 | +2.10 | +0.32 | +0.37 | -1.86 |
| 2026 | Jan | +0.35 | +0.51 | +0.19 | +0.09 | +0.30 | +1.40 | +0.95 | +1.17 |
| 2026 | Feb | +0.39 | +0.54 | +0.23 | +0.03 | +1.91 | -0.48 | +0.73 | +0.32 |
| 2026 | Mar | +0.38 | +0.33 | +0.42 | +0.07 | +3.74 | -0.48 | +1.14 | -3.17 |
| 2026 | Apr | +0.39 | +0.43 | +0.34 | +0.23 | +1.20 | +0.30 | +0.70 | -0.89 |
| 2026 | May | +0.53 | +0.46 | +0.60 | +0.58 | +0.21 | +0.34 | +0.10 | +0.21 |
| 2026 | June | +0.46 | +0.54 | +0.38 | +0.57 | +0.64 | +1.01 | +0.38 | +0.99 |
| 2026 | July | +0.48 | +0.68 | +0.27 | +0.85 | +1.14 | +0.53 | -0.22 | +0.78 |
| 2026 | August | +0.68 | +0.76 | +0.59 | +0.90 | +0.60 | +0.80 | +0.39 | +0.71 |
| Year | Mon | Globe | NHem | SHem | Tropic | US48 | Arctic | Aust. | Can. |
Time Series Plots for Tropics, USA48, Canada, and Australia


The full UAH Global Temperature Report, along with the LT global gridpoint anomaly map for August, 2026 and a more detailed analysis by John Christy, should be available within the next several days here. John officially retired with emeritus professor status on July 1, 2026, and is now working as a part-time employee of UAH.
The monthly anomalies for various regions for the four deep layers we monitor from satellites will be available in the next several days at the following locations:
El Niño kicking in, but still cooler than 2024.
In Aug 2024, the El Niño had maxxed in April and was on the way down. A better comparison is with Aug 2023, when, as now, the El Niño was building. Then T was 0.61°C, now 0.68°C.
It’s nearly freezing everywhere now?
Almost down to zero?
Jeez, I’ll stop the air conditioner pumping away at 21C then.
(Lousy weather forecasts we’re getting on the tv now – too much color saturation!)
We are coming out of one of the most uncomfortable year for a decade, the entire summer was so cool we never once turned on our air-conditioners and the whole winter has been cold, overcast and rainy with surprisingly fewer frosts.
I am talking from the eastern mountain range just below the Qld/NSW border in Eastern Australia.
The “New England Tableland” – a very pretty place to visit.
Me? Shotover Range, southwest of Rockhampton, September 1963. The creek was about 8″ deep, 20 feet across. Six inches of ice on both sides first thing in the morning. (Oil exploration, fly camp. I was a few years younger then.)
An ‘aside’: according to AEMO, at 1500hrs, August 4. 2026, electrical generation was 60% ‘renewables’.
And Australia August 23 was +1.25, now +0.39. That’s cooler.
But I know it is supposed to be GLOBULL. 😉
The prediction is for Super El Niño this year, as in 1998 and 2016.
Nick,
Measurement uncertainty estimates were?
Geoff S
Geoff,
This is so mechanical and tiresome. If you are really concerned with uncertainty, take it up with Roy. They are his figures that WUWT is promoting here.
You misspelled “publishing”.
Would you like specific examples of Anthony Watts promoting UAH? I can provide them.
Have no desire to see any more of your lies.
It’s not a lie of any sort. These are past statements made by Anthony Watts concerning UAH.
It’s displayed on the right panel on every page include the home page.
And you interpret this to mean it is the official rubber-stamped WUWT air temperature numbers, of course.
This could be a new high since measurement began. Should we expect the beginnings of regional extended droughts and population die off, yet? Perhaps a turning point in crop production? Or trending ocean island land area reductions?
A separate issue. If you want to discuss how we accommodate ourselves to the ACC energy being added to the earth, do so when it is the topic of discussion.
FYI, I remember Nick (correct me if my memory is flawed, Nick) in the past opining that sea level rise is not the worst outcome from ACC, so, if there’s ever a WUWT post admitting ACC and voting for acclimation instead of prevention, I’m sure that he would share his thoughts.
I’m making it a topic of discussion prefixed by the upcoming likelihood of the warmest global temperatures ever measured.
The point is that so far the warming has been accompanied by both positives and negatives with no clear winner. Nearly everyone has been literally brainwashed into thinking climate change must be a change for the worst.
Nobody even thinks to question that and its about time there was genuine discussion of both the pros and cons of the changes.
I don’t think there are too many pros for this outlook.
How many more times are you going to spam your cherished hockey stick?
I’ll always post peer reviewed science in response to the lies and distortions of Climate Deniers.
Even if you don’t know what you’re am posting is pertinent or not .
I’m sure it is often viewed as not pertinent by Deniers.
Case in point. All you see is disaster looming and dont see record population and record crop production. You dont see the increasingly greening earth from CO2 fertilisation. You dont recognise cold deaths are worse than hot ones. You dont recognise that people migrate towards warmer regions, not colder ones.
You want to associate every weather event to “climate change” but the fact is that science cant do that because it isn’t enough of a change to be seen after 70+ years.
You want to believe everything you read on the internet instead of peer reviewed scientific sources.
That’s pretty much what I’d expect from you. I posted a number of positives that are easily verifiable from many sources including scientific papers. You post an ad hominem argument.
You don’t address the elephant in the room; that the NET O effects of human caused climate change are 1) strongly negative 2) forever worsening as long as man continues to burn fossil fuels and cause the emission of methane, N2O, and hfcs into the atmosphere.
Not my conclusions, but rather the universal findings of scientific research.
What elephant? Be specific. What strongly negative effect?
Here you go:
The Intergovernmental Panel on Climate Change (IPCC) Sixth Assessment Report highlights widespread adverse impacts, economic vulnerabilities, and irreversible damages to human and natural systems caused by human-induced climate change.
Human and Health Impacts
Ecosystem and Environmental Damage
So you’re just a shill for the IPCC, got it, BFD.
A particularly nasty one to be sure, but just a shill.
Yes, I’m a “shill” for reliable science. For your nonsense, not so much.
As I thought. You have nothing and believe the rhetoric put out by the IPCC summary for policy makers which isn’t reflected by the science itself in many cases.
For example how do you square a non specific claim about biodiversity damage against the measured greening of the earth?
Is this where you go off on some claim or other about projection the greening will stop or only impacts some plant types? Because that’s your complete desire for negativity.
This is why you’re called Deniers.
I’m a denier? I’ll repeat the question for you in case you missed it
How do you square a non specific claim about biodiversity damage against the measured greening of the earth?
That’s a good question. I suggest you read the IPCC 6th Assessment to find out.
I suggest that you should do the same if you cant answer the question. I’ll give you a hint. The IPCC report is one sided, there is no analysis of pros and cons, the report is written to maximise the alarm. The summary for policy makers is especially one sided.
I’ll give you a hint: The IPCC Assessments are the work of real scientists who spend years earning a PhD, then dedicate their lives to research , and then submit their work to experts in the field for critique and refinement. Deniers do none of those things, then expect us to accept their non expert non critiqued work products as more reliable than the work of professional scientists.
Furthermore, Science Deniers have produced no consistent or credible physics-based explanation for modern day rapid warming of the planet. (You can attend all the Heartland Conferences you want and never hear any such analysis, much less consistency from one speaker to another. They even refer to people like Steve Milloy and Lord Monckton (!) as scientists!)
I will agree with you on one point: the IPCC reports are indeed one sided — because there is only one set of the Laws of Physics. When you guys learn to apply those Laws, get a science education, submit your work for peer review, and stop treating science as an amateur’s project, you’ll start to understand the behavior of earths climate system.
Garbage-In-Garbage-Out computer models can pass “peer” review, who would have thought it possible?
Since the models replicate current warming, and Deniers can’t even produce a consistent physics-based explanation, who could possibly think Deniers have any credibility?
*plonk*
You’re no scientist. You dont even know the science because you cant even begin to answer the simple question I posed.
So here you are claiming I’m something with no evidence and I’m using the evidence of your lack of response to make my claim about you.
Science works like that. If you have evidence, you can make a claim.
Yes, establishing a well accepted scientific theory requires evidence. Such as has been achieved for relativity, the theory that smoking can cause cancer, that earth orbits the sun , and that man’s burning of fossil fuels is causing the fastest warming of the planet in millennia. And debunking that theory requires evidence that contradicts the theory…. which no Denier (or anyone else for that matter) has ever done.
Every time there is cooling in the presence of increasing CO2 is evidence that CO2 is not a control knob.
You are too young to remember old electronic radios and other instruments that had controls with ganged potentiometers attached to the shaft that a knob turned. I even saw one with four “pots” on one shaft and guess what, not all the pots increased or decreased together. Three increased while the other decreased as the shaft turned clockwise.
Temperature is no different. There are multiple “pots” that all have their job in controlling temperature. CO2, water vapor, albedo, clouds, seasons, volcanoes, etc. Some go up and some go down. Claiming that one small concentration of gas, CO2, is the control knob for global temperature is falling by the wayside. That is why people keep ranking it lower and lower in their concerns.
If you want to do something useful, quit trying to justify that the temperature trend is caused by CO2 and discuss what is causing it to fall when CO2 is not falling.
You are a flaming ignoramus on the role of CO2. NO scientific sources claim CO2 is the only factor affecting the planet’s temperature: there are plenty of other sources cited and evaluated by Science: eg, emissions of methane, H2O, N2O, HFCs, sf6, clouds, the sun, earth’s albedo, etc. But the 40 gigatonnes of annual CO2 emissions caused by human action account for about 80% of the climate forcing currently seen by planet earth, and so it is currently the dominant control knob — due to mankind’s intervention in the climate system.
.
If CO2 is the dominate control knob, then it should be easy to evaluate a functional relationship of CO2 as the independent variable and temperature as the dependent variable.
I want to see what factor applied to rising CO2 handles both rising temperature amid rising CO2 concentration and falling temperatures amid rising CO2 concentration.
Amazing claims require amazing evidence.
What I find amazing is that you don’t know something so basic, well known and documented in science. Here is a graph showing the correlation. If you want more, read any of the peer reviewed sources I’ve given you — or just pickup a University textbook on atmospheric physics .
Look closely at the graph. Which is cause and which is effect in most cases?
Not so fast. Do you acknowledge that the graph shows evidence in support of my “amazing claim”?
No. The consensus from this ice core is that CO2 concentration follows temperature increase by about 600 – 800 years. The time resolution is pretty poor. However, it is obvious that temperature precedes CO2. You might explain how this concurs with your ‘amazing claim”.
Here is a paper that indicates that temperature precedes CO2. That makes it tough to use an ice core to prove CO2 is the independent variable and temperature is the dependent variable.
CO2-climate relationship as deduced from the Vostok ice core: a re-examination based on new measurements and on a re-evaluation of the air dating | Tellus B: Chemical and Physical Meteorology
1)Correlation with a time lag is correlation and is clear from the data.
2) Shakun analyzed the ice core data and found that the data confirmed the behavior predicted by physics: that warmingprecedes atm CO2 rise (due to outgassing from the warming oceans) and also that a second larger warming follows the rise in atm co2 (due to the increase in the greenhouse effect).
Cause and effect is partially dependent on temporal relationship. The issue here is that there is a lag from a temperature rise to when CO2 rises. Temporally, this would place temperature as the cause and CO2 the effect. Does this mean that another variable could be in play that caused both? Certainly, but one must find this variable that has a causal link to both and the ability to have a delay in CO2. Good luck with that.
Does CO2 cause temperature to rise further than it would by itself. This graph cannot answer that question primarily because it doesn’t have the necessary time resolution. I believe the Vostok time resolution is on the order of 2000 years. Why don’t you compare the average temperature in the interval from 0 to now and se where it lies.
The Laws of physics provide the answer. I described how the warming induces CO2 rise, and then the CO2 rise induces a second, larger warming. Read this https://skepticalscience.com/co2-lags-temperature.htm
or the paper by Shakun, J. D., Clark, P. U., He, F., Marcott, S. A., Mix, A. C., Liu, Z., … & Bard, E. (2012). Global warming preceded by increasing carbon dioxide concentrations during the last deglaciation. Nature, 484(7392), 49-54.
Whereas your argument seems to be, “Chickens do not lay eggs, because they have been observed to hatch from them”.
Then why isn’t climate science coming up with ways to turn the effect of these other sources UP so as to offset CO2?
Why is the only focus on turning down the effect of CO2?
Water vapor is only 20% of the climate forcing on earth?
This sounds more like climate science religious dogma than physical science.
“Then why isn’t climate science coming up with ways to turn the effect of these other sources UP so as to offset CO2?” Those “other sources” are natural — eg, the sun. Do you know how to turn off the sun?
Water vapor doesnt contribute to the rising temperature trend of the planet (except as a positive feedback) because its not increasing since it condenses out.
I believe you were saying that higher temperature means the atmosphere can hold more water vapor. Something to do with VPD.
Funny how water vapor can be both aclimate change cause and then change to – nothing.
I said this: “Water vapor doesnt contribute to the rising temperature trend of the planet (EXCEPT AS A POSITIVE FEEDBACK) because its not increasing since it condenses out.”
Which means that because the atmosphere’s ability to hold water changes only with temperature, its the warming of the atmosphere caused by rising CO2 concentration that allows a slow increase in water vapor and a postive feedback to the warming trend
“Which means that because the atmosphere’s ability to hold water changes only with temperature, its the warming of the atmosphere caused by rising CO2 concentration that allows a slow increase in water vapor”
If water vapor in the atmosphere is going up then why is cloudiness going down? More water vapor should produce more clouds.
if water vapor is going up then it should cause more rain and fewer droughts. Yet climate science says we are going to see more droughts. Huh? How does that explain the greening of the earth? Greening not only requires more CO2 but also more precipitation. Yet climate science says “less” precip?
Do *you* have an explanation for these two facts? It sounds like you are just parroting excerpts from your global warming bible without first checking on physical reality.
This explanation of how water vapor acts as positive feedback should keep you busy for a while: https://science.nasa.gov/earth/climate-change/steamy-relationships-how-atmospheric-water-vapor-amplifies-earths-greenhouse-effect/
From the first paragraph of your reference.
Water vapor is removed from the atmosphere by condensation. That is why it is called a condensing gas. You have even commented that water vapor is in the atmosphere for a short time.
How does a molecule like water vapor TRAP HEAT? The entire concept is ridiculous. It would require a water vapor molecule to remain in the upper troposphere forever.
It Requires water vapor to EXIST in the troposphere for sustained periods. In fact, it exists there permanently.
But if you truly believe the absurd nonsense you are wont to post, submit them to a peer reviewed journal, if you have the cojones.
“It Requires water vapor to EXIST in the troposphere for sustained periods. In fact, it exists there permanently.”
Let’s see your math. When an H2O molecule making up the water vapor condenses and precipitates out the latent heat energy is transferred to the air parcel surrounding it. That makes the air more buoyant and it rises and the energy is eventually radiated to space. That air parcel contains a lot more substances that H2O.
The heat is not “trapped” somewhere in the system.
Again, let’s see your math showing that the heat energy is permanently retained somewhere in the system and, even more specifically, in the water vapor in the atmosphere.
LOL.
“This explanation of how water vapor acts as positive feedback should keep you busy for a while”
-This article states: “Water vapor is Earth’s most abundant greenhouse gas. It’s responsible for about half of Earth’s greenhouse effect“.
This seems to contradict your claim that CO2 is 80% of the forcing.
-The article also states: “ gases in Earth’s atmosphere trap the Sun’s heat”. (bolding mine, tpg)
This is just more climate science claptrap. If the gases TRAP heat that means *retained* heat goes up on a continual basis – and over the millennial history of the earth would have resulted in a molten rock orbiting the sun.
If the greenhouse gases TRAP heat then how did the glacial periods in the history of the earth ever happen?
The truth is that the greenhouse gases only SLOW down the cooling of the earth, they do *NOT* result in permanently trapped heat in the biosphere.
-from the article: “The water vapor then absorbs heat radiated from Earth and prevents it from escaping out to space.”
Prevention of heat loss results in retained heat in the biosphere. Why isn’t the earth not a molten rock from all of the retained heat that must have happened over the past millenia?
-from the article: “While making up around 0.05% of Earth’s total atmosphere, they play major roles in trapping Earth’s radiant heat from the Sun and keeping it from escaping into space.” (bolding mine, tpg)
More claptrap from climate science.
If the heat is *NOT* trapped, i.e. does not become retained heat, then it must lose that incoming heat at some point and in some manner. Otherwise the glacial periods could never have happened.
What that means is that climate science is looking at a short period of time, even if it might be a century in length, covering a very low frequency cycling biosphere – and are then projecting the conditions in that short period of time into the future as being a permanently existing state for the biosphere. No possibility of another glacial period because of permanently retained heat in the biosphere – even though that has never happened over the millennia.
Does your global warming bible tell you that heat is permanently trapped in the biosphere?
. You’re even more dimwitted than I thought, Gorman. You’re confusing two different phenomenon– the sustained elevation of earths temperature above the temperature it would be in the absence of any greenhouse gases (about 60F) — caused by the PRESENCE of greenhouse gases, including water vapor– vs the TREND of rising temperature, caused by the trend of rising greenhouse gas concentrations. Note that water vapor concentration rises only in response to atmospheric warming and thus far slower than co2 concentration which rises in direct response to the 40 gigatonnes of CO2 emitted annually. That’s why water vapors effect is considered a positive feedback from the warming of the climate, not a cause of the warming.
And if you can’t understand how the lifetime of a specific H2O molecule in the atmosphere is irrelevant to this discussion, you’re beyond help
Cooling is cooling. “higher than it would be” does *NOT* define warming, it defines slower cooling!
Just exactly where do you think that retained heat is retained?
Without greenhouse gases to ameliorate the day/night temperature, conduction/convection would still exist. Air movement would still exist. The earth would not cool to absolute zero.
The earth would still absorb insolation just as it does today from sunrise to sunset. The surface would still warm the atmosphere through conduction/convection.
Now here is the real question. N2/O2 could not cool by greenhouse radiation so how would it cool? Conduction back to the earth that could radiate the energy away? How long would that take? What would the diurnal temperature range be?
Your response tells one that you have read the warmists bible and have accepted its doctrine without any creative thinking whatsoever.
You are reading from the warmist bible again. That is a bogus temperature calculated from a bogus way of calculating the sun’s absorbed insolation.
Here is a part of Practical Meteorology, by Dr. Roland Stull, University of British Columbia. If you study it carefully, you will see that the earth intercepts a plane wave, that has the same intensity at all points. Every point on earth receives the same insolation and the only difference is that the absorption varies by the angle of incidence, i.e. cos(θ) or sin(θ) depending on which angle from perpendicular you use. Similarly, the insolation during sunlight varies as a sine wave whose period varies by the time of the year. At nighttime, the decay from the daytime is some kind of exponetial function, like a capacitor discharging.
Here is a page from the textbook.
Here is a page showing insolation during a 24 hour period.
Believe me, a proper analysis is NOT (1365*0.7)/4 = 240 W/m². No way does that give an adequate average temperature over a 24 hour period for EVERY point on earth.
“Believe me, a proper analysis is NOT (1365*0.7)/4 = 240 W/m². No way does that give an adequate average temperature over a 24 hour period for EVERY point on earth.”
This type of analysis would indicate that the poles and the equator will have the same climate. No ice at the poles. No oppressive heat at the equator.
Physically wrong. Like much of climate science.
“Believe Me, Gorman the Janitor, that the 10s of thousands of peer reviewed climate research papers are all wrong. Because I are a geenyus!”
The noise you post is disgusting.
The acolyte telling unbelievers in the CAGW Bible that they are forever damned! LOL!
“ Do you know how to turn off the sun?”
How about seeding the upper atmosphere with reflecting particles?
How about global “boilers” that would seed the atmosphere with more water vapor thus inducing more cloud cover? It’s no more far-fetched than saying that windmills and solar panels are going to save us from climate change.
If the IPCC and all the other climate alarmists would spend HALF the money and energy on planting trees around the globe that they have spent on windmills and solar panels you would see a large offset from any supposed CO2 induced climate change.
Throw away your global warming bible. It was written by false prophets and charlatans. Think for yourself just a little bit!
“Water vapor doesnt contribute to the rising temperature trend of the planet (except as a positive feedback) because its not increasing since it condenses out.”
Is water vapor decreasing? It would seem so since the condensation (i.e. cloud cover) is getting less. That means less sun insolation absorbing material in the atmosphere which, in turn, means more heating from the sun.
Again, throw away your global warming bible. It was written by false prophets and charlatans. Think for yourself just a little bit!
In 1887 a more sensitive Michelson–Morley interferometry experiment definitively laid to rest the then-popular “luminiferous aether” conjecture.
No “credible physics-based explanation” was put forward until a Swiss patent clerk (third class) tentatively put forward a “relatively” simple alternative in 1905.
All subsequent experimental tests of that proposal have failed to contradict it, leading to “special relativity” now being considered as close to a “Law of Physics” as you can reasonably get.
From 1887 to 1905 the “luminiferous aether” conjecture came under the “Proven wrong, no alternative found … yet …” category.
.
“I would rather have questions that cannot be answered than answers which cannot be questioned.” — Richard Feynman
Advances in science in general, and physics in particular, come from “mavericks” asking questions along the lines of “What if the current paradigm is wrong (in this extreme corner-case) ?”
Alternatively there’s the classic ” Science doesn’t advance when people in lab coats shout ‘Eureka !’, but when they quietly murmur ‘That’s odd …’ “.
Quoting Richard Feynman again, this time about The Scientific Method :
In the domain of “climate science” there are multiple checks of actual empirical data versus the (climate computer) models which show that “the thing is wrong”, from the precise numbers of “the tropospheric hotspot” to vague fear-mongering of “Food Insecurity” when compared to the actual “total production” and “yield per acre” data from the FAO since 1965.
.
“Religion is a culture of faith; science is a culture of doubt.” — Richard Feynman
“Numerical models, however complex, cannot be a perfect representation of the real world.” — IPCC, AR6, WG-1 assessment report (2021), section 1.5.4, “Modelling techniques, comparisons and performance assessments”, page 221.
So far, all of the tonnes of evidence confirm the scientific theory that Man’s burning of fossil fuels is causing the fastest rate of planetary warming in millennia. No contradictory evidence has ever been found. And no Denier (or anyone else, for that matter) has produced any. So the theory stands, just as relativity, the theory that smoking causes cancer, or that earth orbits the sun.
But thats not the question this thread is addressing. The question is whether the anthropogenic CO2 and any associated warming is net good for the planet or net bad.
So far you’re so far brainwashed, you haven’t even tried to assess that. You have no capacity to do so and no desire to even consider the possibility that warming might actually result in a better earth. Its not even on your radar.
Sorry, but you are wrong. My post answered Mark BLR’s specific argument about the theory of man -caused climate change.
Regarding your hangup on its effects, read the IPCC 6th Assessment and subsequent peer reviewed papers. I did my best to summarize the IPCC’s finding’s in a prior post, which I now repeat below. If you disagree with IPCC’s findings, please cite peer reviewed sources that contradict these findings.
“The Intergovernmental Panel on Climate Change (IPCC) Sixth Assessment Report highlights widespread adverse impacts, economic vulnerabilities, and irreversible damages to human and natural systems caused by human-induced climate change.
Human and Health Impacts
Extreme Weather and Mortality: Between 2010 and 2020, human mortality from floods, droughts and storms was 15 times higher in highly vulnerable regions, compared to regions with very low vulnerability.Food and Water Insecurity: Rising temperatures and extreme events have exposed millions of people to acute food shortages and reduced water availability, impacting livelihoods globally. Disproportionate Inequality: Climate change is exacerbating existing inequalities, severely affecting marginalized communities, low-income households, and Indigenous Peoples who contributed the least to global emissions. Ecosystem and Environmental Damage
Irreversible Ecosystem Loss: Climate change has caused substantial damage and near-permanent loss across terrestrial, freshwater, coastal, and open ocean marine ecosystems. Biodiversity and Species Decline: Ocean acidification is accelerating while local species extinctions and mass mortality events on land and in oceans become more frequent due to severe heat extremes.Melting Ice and Rising Seas: Global temperatures, melting glaciers, and sea levels continue to rise rapidly, threatening coastal regions. “
I already posted a question regarding one specific aspect of the IPCC SPM claim that you previously posted and have reposted above. And you refuse to address it. Hence…you cant. And that makes this conversation a waste of time.
Ive already responded: ‘Read the IPCC Assessments so you learn what Scientific research has to say about the topic.’
And that makes this conversation a waste of time.
It’s a waste of time if you refuse to read or assess what the scientific research has found. (Or maybe just incapable of understanding it if you did read it.)
I’ve already done that. Its how I know there is no consideration of positives. Its only you that hasn’t actually read the science as evidenced by the fact you cant address the question yourself.
And…that makes this conversation a waste of time.
Since “you know” there is no consideration of positives, then your questions were non-serious, as they are for most Deniers.
All I’ve done is establish you’re still an ignorant troll.
There’s a reason why Nick never responded and that’s likely to be because he’s intelligent and knowledgeable enough to know this is a gaping hole in the climate science message. He usually only responds if he has an effective argument and believes himself to be right.
I did some checking, and sure enough, I found proof you don’t read the IPCC Assessments. Here is a summary:
The IPCC evaluates potential positive effects of rising temperatures, though it finds they are vastly outweighed by negative impacts.
Consideration of Potential Benefits
The Scientific Conclusion
As noted by analysis of the findings, climate change will amplify existing risks and create new risks, making it clear that potential benefits do not dominate [“to a lesser extent, climate change is projected to have some potential benefits — but it makes it clear they don’t dominate.” — [Carbon Brief].].
You’re still not addressing the question. Your reference is about assessing risk of rising temperatures and not actual measured increased greening of the planet.
If you want an answer to your narrow question, “do your own research”. It will be good for you.
As I said, I’m well aware of positives and I’m well aware they never make it into mainstream scientific reporting because they would dilute the narrative.
Consequently most people aren’t even aware there are any positives and that includes you. Its a special kind of denialism you’re displaying.
Good grief. When the IPCC says NET negative, do you not understand the word NET? And then you have the ignorant gall to whine that the IPCC doesn’t consider positives, and yet refuse to look into the IPCC reports in detail and ask someone else to find the details for you.
You haven’t changed one bit.
You dont understand what you’re reading
The IPCC reference you gave is assessing the risk associated with increased temperatures against localised or short term advantages. It gives you context, it says
It apparently concludes that the risk outweighs those short term advantages.
Now, what has that got to do with the measured benefit of global greening?
OMG. This is from YOUR earlier post:
Q: How does the Iatest IPCC summary report treat the greening of the earth?
Ie, greening DOES NOT HAVE A POSITIVE EFFECT
Nope. The greening earth has been measured and is real. The reference you’re using is specific in its context of short term and localised effects. Global greening is neither of those.
You believe what you want because it doesn’t matter what I say and what you read. Your belief is steadfast.
The fact is that the positives are non existent in the climate change narrative and that is completely obvious even to you even though you’ll twist and turn to believe it isn’t true.
I’ll be more explicit
No, it doesn’t, thats the point. And yet the greening is about 15% increase and that, by any standard is an enormous positive effect for the earth.
According to the IPCC, it’s positive effect is outweighed by the negative effects of climate change.
No its not. That is entirely your imposed “understanding” and its wrong. Your own reference covers it
Not only is it not highlighted, its barely mentioned at all. If the IPCC reports were genuine, they’d have a section regarding the pros and cons and a balanced argument for and against each but that just doesn’t exist.
I ask you once again…
How do you square a non specific claim about biodiversity damage against the measured greening of the earth?
I accept the peer reviewed finding of the IPCC that the greening of the earth is primarily a function of improved agricultural practices , not increased atmospheric CO2.
No wonder you didn’t want to comment. This becomes a prime example of the carefully crafted messaging that excludes benefits from CO2. The greening planet is attributed primarily to the CO2
For example, its summarised by the NASA article that looks at a paper
Carbon Dioxide Fertilization Greening Earth, Study Finds
Its a major benefit of the CO2 and you didn’t even know.
Your link says “While rising carbon dioxide concentrations in the air can be beneficial for plants, it is also the chief culprit of climate change. The gas, which traps heat in Earth’s atmosphere, has been increasing since the industrial age due to the burning of oil, gas, coal and wood for energy and is continuing to reach concentrations not seen in at least 500,000 years. The impacts of climate change include global warming, rising sea levels, melting glaciers and sea ice as well as more severe weather events.”
The IPCC apparently assesses that the impact of climate change due to rising atmospheric CO2 has a larger negative effect on humanity than the positive effect of the greening. So do I.
No it doesn’t. The IPCC ignores it as much as it can because it goes against the narrative.
You’re quoting the inevitable disclaimer that goes along with any effect that can even possibly be perceived as positive, again to maintain the message.
I trust the peer reviewed scientists writing for the IPCC more than I trust one non expert with an agenda who claims he knows more than they know
The only person around here who is claiming to know more than they actually know is you.
If I were you and I’d just learned that the earth has greened about 15% primarily due to CO2, I’d be taking a step back and wondering why I didn’t know that.
If you genuinely thought you knew about climate change then that’s a huge wakeup call for you.
Beeton’s troll/kook dance has become highly boring.
According to the IPCC, it’s positive effect is outweighed by the negative effects of climate change.
Quit using the generic term climate change. It is meaningless. Climate has to do with temperature, precipitation, soil, flora, fauna, etc.
Temperature is meaningless in terms of climate. Similar temperatures would mean Miami and Las Vegas have the same climate. It is ridiculous and not scientific.
Any scientist who uses such a term is immediately identified as a cult member.
Just for you, Gorman, I’ll substitute the words “rapid warming of the planet”. We wouldn’t want you to die on that hill.
The data goes not exist for “millennia” with sufficient resolution to determine the rates of warming on timescales of ~50 (since the 1970s) to ~150/175 years (since 1850).
That is, technically, correct.
The “contradictory evidence” would have to consist of finding a (new) “proxy” that goes back millennia with a resolution on the order to 10 to 50 years.
No such “temperature reconstruction” exists, or ever will exist.
Your statement amounts to an “unreasonable request” logical fallacy.
.
AR6 WG-I, “The Scientific Basis” = 2409 pages.
AR6 WG-II, “Adaptation” = 3068 pages.
AR6 WG-III, “Mitigation” = 1990 pages.
When you, or anyone else, makes specific bald assertions it is incumbent on you to provide detailed references — i.e. page numbers and copies of the specific paragraphs containing the “supporting evidence” for your specific bald assertions — not for the people questioning those bald assertions to read through OVER SEVEN THOUSAND PAGES of “assessment reports” to filter out what you believe is containing therein.
If you are unable to provide the specific paragraphs from the OVER SEVEN THOUSAND PAGES of “assessment reports” for each one of those bald assertions individually then it means that your “supporting evidence” does not in fact exist.
1) Your statement that ‘contradictory evidence will never exist’ is a nice tacit admission that the theory is bulletproof.
2) I’ve cited the conclusions of all the peer reviewed scientific sources i can lay my hands on: The National Academy of Sciences, the IPCC Assessments, and NASA. While, you’ve found NOTHING in the peer reviewed literature that contradicts ANYTHING i’ve said.
3) Your statement about ‘insufficient resolution in the proxies’ is an old tired complaint about Dr Mann’s work –which has withstood all the statistical arguments and has been validated and replicated multiple times in the scientific literature.
4) As said, I rely on peer reviewed sources — primarily the NAS, the IPCC, and NASA. I’m not checking their work. Hundreds of expert scientists ready did. (do you know what the words ‘Peer review’ mean?) . So learn something, and read it for yourself.
+100
It is why I always TRY to include quotes from the resources I use. It shows I have read them to extract the necessary information. Sometimes I falter in doing that after having posted some of it multiple times!
If you disagree with the scientific arguments for global warming, please submit your reappraisals to the appropriate scientific journals. I suggest: The Quarterly Journal of the Royal Meteorological Society, the International Journal of Climatology, the Journal of Atmospheric Chemistry, and Nature, among others. Your arguments will be carefully and expertly peer-reviewed. Work that involves misleading or erroneous arguments or that does not properly cite its references will be rejected. Do not expect to be taken seriously until you show, using accepted experimental and analytical techniques, that you have a credible explanation for the data on climate change. The world’s scientific community awaits your response
In other words, you have no answers to give. And you can’t find any.
Peer reviewed? By those with monetary conflicts of interest?
The same thing applies for you! All you are offering up is parroting of claptrap from the global warming bible. You can’t offer a credible explanation of anything.
They prefer staying under this warm, wet, mossy Rock. They all follow Pat Frank and know how thoroughly he gets intellectually eviscerated whenever he tries to pass off his bad wiring as alt.statistics in superterranea.
Didn’t have your Fruit Loops for breakfast this morning, bob?
Funny you should aks. I don’t eat them, and we don’t keep them around. But they are a staple of free midwest budget motel breakfasts, and the missus LOVES them there. We’ve stayed in a few lately, as part of our desertion of Missouri and 2nd round to the Cal central coast. Just 2 more STEMmers moving to Cal – which gets them at twice the rate it loses them. Happy to help with the brightsizing…
“Just 2 more STEMmers moving to Cal – which gets them at twice the rate it loses them.”
My mistake. Cal is indeed losing population, but those leaving are half as likely to have a STEM degree as those arriving. So, a smaller, smarter flock of residencers.
Don’t need to. I have already given several preeminent people who disagree. You ignore them like you have the knowledge to adequately assess their work as being worthless. That shows where you come from whether you know it or not.
Maybe you can show us some peer reviewed papers that DIRECTLY refute information in their papers. Not peer reviewed papers that you think give different answers, but papers that DIRECTLY address theirs.
Nice!
And then spend their careers following the consensus so they can obtain grants.
Here is my hint. Out of the tens of thousands of papers and reports, including the IPCC, how many deal with the mechanisms and results of how land absorbs, stores, conducts, and radiates energy all over the globe. That is the very first mechanism that occurs on this earth and has little to no attention from the climate science discipline and its scientists. How do you justify climate science ignoring this important mechanism?
I can assure you that the topic you mention has been studied to a fare thee well by scientists for decades. But I’m not surprised at all that you lack the interest to search it out and read it. You live in a silo, and know only what your mind conjures up.
In other words, you can’t give a simple answer, probably because there isn’t anything really there.
Here is a summary from CoPilot.
Q: How does the Iatest IPCC summary report treat the greening of the earth?
Exactly! And are you accepting this finding of science, or rejecting it because you can’t accept anything from outside your silo?
You miss the entire point. The report does not highlight greening as a major positive effect. Why do you think that is.
Greening is not just in agriculture, it is everywhere. Forests, deserts, savannahs. Yet you and climate science want to diminish the biodiversity increase of both flora and fauna in order to continue a “consensus’ view that more CO2 is an environmental disaster.
You do realize that every day that goes by with CAGW warmists continuing to tell the public, “don’t believe your lying eyes”, fewer and fewer people are believing the lie.
I think the IPCC doesn’t highlight greening as as a major positive because the bulk of scientific research says it isn’t.
Uh, oh . . . “global average lower tropospheric temperature (LT) anomaly for August, 2026 was +0.68 deg. C . . . up from the July, 2026 value of +0.48 deg. C”. That’s +0.20 deg-C in just one month . . . and please note that I’m honoring keeping the precision-of-measurement to the nearest .01 degree-C!
I’m telling you, it’s got to be all that stratospheric water injected by the January 2022 Hunga-Tonga eruption that’s finally showing up . . . again!
But wait, maybe it’s really just the onset of the dreaded, sure-to-be-catastrophic Super El Nino?
Or perhaps the direct result of so very few hurricanes-to-date in the Atlantic?
Or maybe, just maybe, it’s because we did finally break through the IPCC declared tipping point of exceeding pre-industrial global temperatures by 1.5 deg-C? The end is neigh.
Another possibility: the result of all those recent heat waves in Europe and North America (but then, is it cause or effect?)?
Maybe a warning sign that too many data centers are being put into operation around the planet too quickly?
So very many options to choose from!
Given that it’s an average of millions to billions of passive microwave radiometer observations, the level of precision is modest.
If you check any decent currency exchange site you’ll see figures quoted to four or five decimal places for any given moment on the basis of far less data.
Numbers is numbers!
Money precision is not the same as scientific precision.
You know this. You are merely trolling.
Scientific notation makes it very, very clear that the computed result can not a precision no greater than the least precise value used in the computation.
1 + 2.1 = 3
1.0 + 2.1 = 3.1
Gee, I never knew (even imagined) that precision-of-measurement was dependent on the number of measurements. You need to publish immediately on this statistical mathematics claim!
You’re serious in claiming the precision used for currency values justifies the asserted precision of satellite-derived temperature measurements? Seriously??? Talk about apples-to-oranges!
In comparison, consider the following:
— The highest number of significant figures for a non-trivial measured physical constant is 12 to 13 significant figures, achieved by constants like the Rydberg constant and specific atomic transition frequencies (Ref [1] (https://physics.stackexchange.com/questions/497087/what-is-the-most-precise-physical-measurement-ever-performed ), [2] (https://chem-textbook.ucalgary.ca/version2/appendices/appendix-fundamental-physical-constants/ ), [3] (https://phys.org/news/2024-12-electron-energy-fundamental-constants.html )
— Fine-Structure Constant: Its inverse is measured to 12 significant figures (approximately 137.035999206) using rubidium atom interferometry and quantum electrodynamics
— Hydrogen Hyperfine Transition (21 cm line): Measured directly to about 13 significant figures (1420405751.7667 Hz)
Of course all of these examples of measurement precision are based on far, far less than “millions to billions” of measurements. That’s science for you.
ROTFL!
Another climastrologer/trendologist pushing the magic of averaging.
The climastrologer/trendologist being TFN, just to be sure.
Precision is NOT accuracy.
I just can’t believe educated scientists let this type of mumbo jumbo go on in climate science. My professors would have chewed me up. The Challenger exploded because we didn’t take enough measurements. Bridges collapse because we don’t take enough measurements. The satellite that missed Mars entirely did so because we didn’t take enough measurements. LOL.
I could go on, but these folks simply don’t understand the epistemological difference between preciseness, accuracy, and resolution in measurement versus the statistical fantasy that more measurements allow one to put those real, physical measurement characteristics in the trash bin.
Since thousands of scientists have used temperature anomalies for years to reduce measurement error, Gorman, maybe the outlier is you.
One more use of the Bandwagon argumentative fallacy. Coupled with the “Tradition” argumentative fallacy.
I can show you how multiple measurements of different things are incapable of reducing measurement error. Are you willing to listen?
I am amazed at the self-delusion of a non-expert believing he has discovered fundamental errors in the work of scientists who have dedicated themselves to decades of research and publish their work in top peer reviewed scientific journals.
HAHAHAHAHAHAHAHAGAGGG
Don’t you wish. Do you know how many folks on this site have actual experience in making measurements under product and safety legal requirements? Do you know how many have had to meet NIST, 17025, and other official requirements to be considered responsible for delivering accurate information.
I’ll give you one example that you can use to show that climate science does an adequate job of observing and propagating measurement uncertainty. You are firmly in the camp believing that peer reviewed papers are the only possible scientifically proper documents to believe.
Find a peer reviewed paper using raw data from an accepted data provider that has an uncertainty budget developed and calculated and then uses that expanded uncertainty value to obtain a combined uncertainty for a monthly anomaly. The paper should include GUM references for the appropriate determinations.
As for your Appeal to Anonymous Authority concerning everyone doing the same thing, did your mother ever ask you if you would jump off a cliff if everyone else was doing it? There is a lesson in there.
Here’s a lesson for you and your reliance on blogs instead of peer reviewed research:
And exactly where in this image is an uncertainty budget shown and where the values originated.
The sources are listed. Check out their research papers.
Nope. You need to provide the information right here. I am sure you know how to cut and paste.
Also, this is not pertinent to making current surface temperature measurements this century. You are trying to deflect away from the subject being addressed. Take the MET or NOAA data and show where they have uncertainty budgets shown. Then find some papers that have used those uncertainty budgets in their data.
Nope. It’s time you read the work of real scientists and learn something.
No Answer, No Knowledge.
All you ever have are Argumentative Fallacies.
This is the Appeal to an Anonymous Source. Because the source is not named or verified, you cannot assess their credibility, expertise, or the reliability of the information.
You lose!
Precision describes how tightly repeated measurements cluster together. It reflects random variation — the small, unpredictable differences that occur even when measuring the same thing under the same conditions.
A highly precise instrument (note that means just one instrument, not several) gives nearly identical readings each time. An imprecise instrument produces a spread of values. Precision does not guarantee accuracy: an instrument can be consistently wrong but has high precision.
Precision matters because it determines how stable and repeatable your measurements are. Even without a full statistical treatment, recognizing the presence of random variation helps you understand why repeated readings differ and why no single measurement should be treated as exact.
Precision includes the following measurement processes:
Precision is important in assessing uncertainty that exists in a measurement. When measuring the same thing under the same conditions and you obtain consistent readings in the tenths digit, then the instrument is no doubt very precise at that resolution.
However, if the readings vary in the hundredths digit, it is not precise at that resolution. Variation in the hundredths digit indicates that the random component of uncertainty is at least one hundredth. Any readings of values beyond the hundredths digit are spurious and unknowable regardless of the number of readings being averaged.
The other two pieces of a measurement are accuracy and resolution.
You should be aware that comparing different instruments and their readings of different things does not allow one to add precision to readings. UAH does use different satellites and certainly measures different things. Your assertion that millions of readings being averaged can somehow change the characteristics of precision that an instrument has is folly.
If millions of readings being averaged can add decimal places to a measurement, then why do we need micrometers or laser measurements? A number of readings with a yardstick would suffice for most machine shops.
Here is a question for you. If averaging can add decimal places, what rule do you use to decide how many decimal places are too many?
“UAH does use different satellites and certainly measures different things.”
The problem with the satellite network is that the satellites have a calibration process that partially includes comparing each other. Somehow there is a belief in climate science that this should reduce measurement uncertainty. The truth is that all it does is spread calibration drift around the whole network of satellites.
It’s one more use of climate science’s meme of “all measurement uncertainty is random, Gaussian, and cancels”. Climate science just assumes that all calibration drift is random in direction and amount and cancels out.
The truth is that most calibration drift in similar electronic devices in similar environments is in the same direction and has similar values. Electronic components heated from current flow usually suffer the same effect on their physical composition; one resistor doesn’t go up in value while a second one goes down in value. Expansion from heating doesn’t cause the coating on one component to peel while it causes the coating to adhere more tightly on a similar second component. Etc.
Terminologically, precision relates to the spread of values about the mean, when as much as possible is kept constant.
Accuracy is the term for how close that mean is to the best determined expectation of that mean.
The key question here is “Is this reported temperature accurate?”
The answer at this time is that we do not know because there are no other methods of measurement that are comparable.
This is a “hard” science response. Geoff S
This is so important. It requires measuring the same thing under repeatable conditions in order to assess the ability of the measuring device. If you measure different things, there is no way to separate precision of the device from different values of the different things. Most of my equipment has precision evaluated at calibration and is included in the total uncertainty of the device. Most have a relative relative uncertainty of something like 1% of full scale.
But if you’re bellman or bgx, if someone else ignores uncertainty, this gives you a free pass to follow suit.
Thanks for that specification: Tropics as lying within ±20 degrees [N/S latitudes]
My early-morning-y’day post was error-filled, to which [we] must add, Es irrt der Mensch, solang man strebt [‘One errs, [only] as long as he strives’ — The Legend of Doktor Faustus — Goethe]
But this afternoon, being again clear-headed, I would like to share, with Drs. Spencer & Christy, the following brief Tropical-Topics-Transcriptions, enquiring for one Dr. A. Friend:
0. True or false — “If I was young enough, I would invest in a coconut palm farm on the north coast of Alaska”? Oops, that one was a pro-tip from an Investment Advisor, ‘Limited’-(LLC)-was-his-Name-Oh.
1. Your “Linear Trend +0.14 C per decade” label seems a bit high for the Tropical Lower Troposphere, as compared to the portrayal posted by R. Clutz ‘Observations from Radiosondes, 20 S – 20 N, 1979-2015)’, from which one may eyeball these stats (slopes)
+0.08 C (± 0.05) per decade (at ~850 mbar / 85 kPa)
+0.10 C (± 0.06) per decade (~70 kPa)
+0.12 C (± 0.06) … (~50 kPa)
…
+0.17 C (± 0.05) … (~32-kPa)
Could this difference (+0.14 C >> +0.08 C) reflect mainly the effective altitude zone of your thermometry (weighted twd mid / upper)?
2. Of course, that one (#1.) concerns primarily the legendary ‘Stability of the Tropical Lower Troposphere’, aka the (missing) Hot Spot (thermal runaway) evident in the output (predictions) of nearly every GCM run, especially the +0.50 C [±?!?] C per decade associated with the Manabe-Hansen et al. camps (Charney ’79 & ever-since) but moreover …* [Lost my train of thought here, must refer to notes*]
3. Is it true that your Satellite-based microwave spectrometers yield ‘meaningful’ readings ONLY during clear-sky (non-stormy) and / or nocturnal conditions? One recalls reading such a stipulation in your publications, and regret having to pose such a pesky question today.
(Always pleased to be directed to the relevant documentation.)
————
Gratefully-sincerely-&-respectfully yours,
— RLW
*P.S. [Recovered note – transcription for #2. above] One suspects that the IR-Catastrophe (‘HotSpot’) Problem (afflicting GCM parametrizers) is even worse, were that possible, in the Rainy Season of the Tropical Lower Troposphere. That within said limited (LTD) Zone & Season, the change is effectively null, ~ +0.01 C (±0.01) per decade, below +5-km altitude (> 55 kPa). Have inferred such insight from an ancient posted dialogue Spencer-Eschenbach. [Something also about diminishing lapse-rates associated thereunto]
If the current El Nino persists, the Nino34 trend will turn positive for the satellite era. To June the trend was still minus but well within any measurement error of flat. No climate model can replicate a flat trend in the Nino34 region for the last 45 years.
Climate modellers maintain the belief that cloud parameterisation is useful. It avoids understanding the microphysics of atmospheric ice formation.
Much obliged for this delightful factoid, as served with a source (link), beyond the UAH.
Also for this declaration: “No climate [GCM] model [has yielded] a flat [null] trend in the Nino34 region [over] the last 45 years.” ( +47 years now, post-Charney ), post
So, a (~zero) trend, or ~ –0.01 per decade, in the Satellite Era (c/2) for Region Niño3.4.
Region encompasses 120-170W and (-)5S to (+)5N, is that right?
So it serves as an excellent proxy for [the stability of] the tropical equatorial zone, despite (or because of) its proximity (exaggerated)to the Ring-of-Fire volcanic zone.
Proviso: Is it clear whether this applies ‘all the way up’ or only at / near sea-level / SST?
A reduction in ‘lapse rate’ (per J Bastardi)would require warming aloft (> +0.01 C/dec?)
Whereas Christy & Spencer specify their [equatorial] Tropics belt as (0,360) and within ±20 N/S, as compared to other conventions (± 22.5 N/S, or even ±30 N/S) … a vastly larger region that may include the wet-tropical highlands of E Africa & the lowlands of Amazonia, plus the Maritime Continent nearer to your home-base, no?
Please comment further, as you are able, and [until then], gratefully yours,
[the other] RW
It allows the effect of clouds to be whatever the modeler, ie computer gamer, wants it to be.
Speaking (as he does) from an observational meteorology stance, Mr Bastardi (Joe) of weatherbell.com has stated repeatedly that we are in an era of ‘permanent [La]Niña‘ (negative trends of temperature over time, in this prime ENSO region).
By which he means that successive positive (Niño) events start from an ever-declining baseline.
I think we can understand what his phrases mean — after all, he is pointing to charts (graphs) that should be publicly available for inspection — while still rejecting the implication …
… because it runs directly counter to the Satellite trends (which JB also highlights) for the TLT (tropics) more broadly, as captured by the second Figure presented by Spencer-Christy this week (above), in which …
… the slope (+0.14 C per decade) is clearly noted as positive, not nearly ‘flat [zero]’ much less negative / downtrending.
So it seems like another case of Why Temperature (as averaged & reported) is a Deceptive Metric, unless there’s some huge disjunction between the Zones sampled either in altitude-range, as questioned above, or lati- and longtitude, or both / all (3).
Most vexing is the hard-to-discern step or sequence in the averaging: at what stage are the implied subtractions of (against) seasonal or other norms.
‘Unsettled’ is the feeling one is left with from even the best reporting of trends.
Which is probably why they (reports) are followed by expert requests to ‘share the code’ or inspect-the-algorithm, not so much by intention to question or to repeat (recalculate) the results, but simply to determine whether one has (mis)understood what the writer has attempted to convey.
Struggling to know, am I making sense here, or does this also read like some *AI*-generated gibberish?
Second warmest August
1 2024 0.752 2026 0.68
3 2023 0.61
4 1998 0.39
5 2025 0.39
6 2016 0.32
7 2020 0.30
8 2017 0.29
9 2019 0.25
10 2022 0.24
Looking likely that 2026 will finish close to 2025 for annual average. Probably 2nd or 3rd warmest year on record.
Needed correction: second warmest August since 1979, the start of UAH satellite-derived GLAT measurements/records.
Ummmmm . . . that would represent considering just 47 years (or 0.4%) of the last 12,000 or so years since Earth entered into to current Holocene interglacial period.
Please get back to me when you are willing to consider “the bigger picture”.
Credit people with a bit of intelligence. The post is about UAH data. You can probably guess that my comment was about UAH data.
If you have data that says exactly what the anomaly was during every month of the last 12000 years, then by all means tell us how this month ranked over that period.
The usefulness of UAH and the other data sets is that they tell us what is happening now and in the recent past.
Hah! No need for me to guess as I specifically stated ” . . . second warmest August since 1979, the start of UAH satellite-derived GLAT measurements/records.“
But maybe you simply did not understand what that means? Seems to reinforce my comment about you missing “the big picture”.
BTW, it is a logical fallacy to state a position/point and then require another person to provide data to confirm/discredit your position beyond what you yourself stated. Debating 101.
“No need for me to guess…”
Why is everyone so literal minded. Let me rephrase my comment.
The first rule of holes is, when you’re in one stop digging.
The language of science absolutely requires precise, concise definitions.
Using common/social language context derived definitions creates a serious signal to noise ratio problem in the communications.
Why is everyone so literal minded? Because it is proper in science and engineering to be so.
It’s not just proper, it is REQUIRED, especially when human safety is involved.
all who use “anomaly” are talking bullshit.
Normality is subjective, there is no evidence that the weather for the last 100 years is the optimal weather for the earth for all time.
Other words difference drop rise all do the job much better
“all who use “anomaly” are talking bullshit.”
Good to know your opinion on Dr Spencer.
I must admit that using anomaly in these reports is itself an anomaly. An anomaly in data is a datum that unexpectedly stands out from the rest, like the datum labelled WOW in the SETI (?) data set.
It is just some more evidence climate science bastardizing the traditional use of a physical concept. And, in this case, it is even bastardizing what statisticians define an anomaly to be.
Correct. Using the delta between short time averages versus long term averages is not identifying anomalies.
This is another case of the Trans-Reality Lexicon hijacking a word and changing the useful meaning into something they can use to promote one side of a debate.
Common language is fluid. Language is STEM subjects requires concise definitions.
So your criticism of Dr. Spencer’s work boils down to the choice of words he uses to describe the product provided as opposed to the methods, procedures, and concepts in play?
I invite you to propose a new word that you find less offensive on Dr. Spencer’s blog. Who knows…maybe he’ll give you the time of day and hear you out.
Just for the record, I was definitely not criticizing Dr. Spencer or anyone else.
I was commenting on the abuse of language.
It’s language Dr. Spencer uses frequently.
Prefer ‘Deviation’ >> ‘Anomaly’, anytime anywhere.
It’s not just for Deviants; it’s for everyone, especially in Maths.
The verb ‘to deviate’ prompts the right question –
From what (Norm) does this Measure deviate?
cf. ‘deflect’, ‘differ’ or ‘differentiate’, ‘divert’, do ‘depart’ from the ‘norm’.
Plus ‘Anomalous’ sounds like ‘Anonymous’, being the enemy of trust.
‘A-Nom’ means ‘No-Name’, Name-Negated.
A-words in English had better have positive content: Ago, Apace, Afar, Away, Afoot, Aghast, (but maybe not) Adore & Abhor, Abjure
Bad practice phonetically (in Indo-European languages) to start with an “A-“, <=> “No-Ne-Nah-Nada-Null-&-Void, Negatory”
Examples (from a former life): The slippery slope from Nano[Nah-Noh]-Science to Non-Science to Non-Sense.
Anomalies was chosen because of its association with abnormal.
Abnomaly. Anormally.
It’s all clear now!
Sparta Nova 4: we checked that the common German verb zu ablenken (or abzulenken / lenken ab) indeed translates as ‘to distract, deflect, [or] divert’, so I see where your ‘Ab-‘ <=> ‘A-‘ association is coming from. Ab-normal as deviant , or diverted (away) from normal(cy)
Alright, we’ve checked the records that show: Just at -6 ka (six short millennia ago or halfway across your ‘12,000 years’ challenge) …
… Why, we can practically remember that day when [somewhere along coastal Thailand] Mother-Eve worked joyfully at the Eden-Gardens commune, fitting her first set of fig-leaf undies & sponge-sandals.
Besides & in the lagoon, & all around, it was a moist +28 celsius all that absolutely globally-averaged day, or [deviation aka anomaly] +9.00±0.01 degrees celsius (vs. +0.90 degrees today) on the UAH tropical-lower-troposphere scale, meaning she had to stay near the shady lagoon, most of the daytime hours, awaiting the gathering cloud-cover & its cooling showers.
“Good thing,” she consoled herself, “that we haven’t been evicted from this Garden-Paradise into the dry-barren-cold-world of thousands-years hence, …
… With the sea-level 10′ lower, and we’re out there exposed, earning our bread by the sweat of our brows under the blazing hot sun, then freezing in the dark all icy-winter-long, burning deadwood just to stay alive … bearing our children in pain, and all the rest!
Now then, where was that Tree-of-all-Knowledge-Climatical with its lovely ripe fruit? Ah, the serpents Manabe-Hansen will help me find it.”
And that, according to Prof F. Q. Gumpf, is what we can conclude, from best available records*, about how it actually was, back then & there at the Holocene-Climate-Optimum Yacht Club (proprietor: one Father-Adam, the mariner- & fisherman-extraordinaire).
*Seriously, the local cave’s stalactites & -mites, drip-drip-dripping at their isotopically differentiated rates, as modulated by the local temperature.
Let’s say there is a certain special person, not necessarily this diligent ‘Bellman’ fellow (who we believe exists) but perhaps the code ‘BM’ could serve for his a-NOM-ally de Guerre (War-Ally No-Name).
Anyway, he is a sincere ‘numbers-guy’, quite demanding both of details and of context, in every matter.
And so, this one fine day he demands that [we] state The Temperature of the Earth, at our choice of date & time. It goes something like this:
Us: Okay. At the surface of the Earth? How about now?
BM: Yes. And Yes.
Us: Okay, it’s 21-degrees Celsius, right here on Earth, right now.
BM: State your Source, with precision.
Us: Well, today, 3rd of Sept., it reads ~ 21.18 C, or about 70 F. That’s a deviation of +0.94 C over the ‘Climatology 1982 – 2010’ Average, for the Daily Sea-Surface Temperature (SST), over the range ±60 (N/S) in latitude.
BM: Why the Sea?
Us: It has a surface, it’s at sea-level.
BM: Why not Land?
Us: No thanks, not really; doesn’t flow much; so we never touch the stuff.
BM: Why not latitudes > |60| S/N?
Us: Sea Ice is a good insulator. It’s always -2 C below, i.e. at the actual Sea Surface, if that’s what you want.
BM: Sure. Correct for that.
Us: Alright, take 3.75 C off the 21.18 C, to obtain ~ 17.5 C ±, and leave be the deviation.
BM: That’s quite a rapid rate of change, +0.94 C over ~ 3 decades.
Us: If you say so. It’s certainly warming somewhere.
BM: What do you mean by that?
Us: Well, in the warm Tropical (Equatorial) Zone, latitude < |±30 N/S|, there’s been no change at all, always around ~ or a bit of cooling, 26.70 C down to 26.65 C, that’s -0.05 C per decade. Extra-Tropical, a big temperature increase, sure, on its yr-round avg. Polar, loads of heat (energy, or enthalpy) but zero temperature rise, zero sea-level rise.
BM: [Seems alarmed, for the first time] What?!?
Us: That’s how it works. Look it up under ‘Latent Heat-of-Fusion (melting)’
BM: Well, then, I shall certainly do so. Just one final question: What’s the ultimate future temperature of this so-called [checks notes] ‘SST’ measure?
Us: Future? Now that will cost you dearly [checks the ice-crystal ball]. Assuming we can green & irrigate the lands, and re-fertilize & unclog the seaways, then the Tropics should be around +29 C, year-around, the extra-tropics ~ +22 C, while each pole swings seasonally between -2 and +28 (avg. +13 C). Global average SST should work out to ~ 22 or 23 C, or ~ 72 F. Up about +5 C vs. the present-day ~ 17.5 C [Sotto voce: Just don’t say Return to the Eo-Cen-o-zöic-Optimum, Buddy!]
BM: Hah! That sounds to me like a Runaway Greenhouse Warming, a veritable Infrared Catastrophe straight into Hot-House-Hades! You are my Brother-in-Arms, indeed. Much obliged.
Us: Any time you like. Have a Nice Day, Mr. BM. And please deposit your cheque (my usual fee), at the door.
Maybe where you are, certainly not where I am.
It’s been a goldilocks summer.
It’s a global average – not “where I am”. We won’t know the exact pattern of the anomalies until the gridded data is uploaded.
As it happens though, it’s definitely been very hot “where I am” in Southern England.
“As it happens though, it’s definitely been very hot “where I am” in Southern England.”
So you have had some fine warm WEATHER for a change..
Enjoy it while you can.
and it has been quite unusually cold here where my farm is located
“Very hot”?
I had a spell of high 30C days in London in 1990, and you Poms were staggering around like you were in 50C in the UAE in the desert outside Dubai (where I went next, and I’ll admit THAT was f’n HOT!)
But 35C – 39C? Enjoy!!
Yes, we know you like to cherry-pick regional anomalies, weather, etc. and present them as though they cast doubt on global warming.
Catnip.
We are laughing at you.
Your post is to ridiculous to warrant further comment.
Global average 😉
global average is just as real and pertinent as unicorn
I’m always fascinated why people insist on pointing this out to me, rather than complain about these monthly articles which are all about global average anomalies.
If you really don’t like global averages, why not complain about the UAH data and this article, rather than objecting to me pointing out it’s a global average?
Because you propagate the fantasy, without qualms.
In what way do I propagate the global average?
WUWT is, according to its own heading “The world’s most viewed site on global warming and climate change”. It publishes UAH fantasy global anomaly averages every month, with the global figure appearing in the headline. Back in the day there were also monthly updates in WUWT about how long the “pause” in this fantasy global average was.
I on the other hand make a few posts in the comment section, referencing the same global anomalies, and you think I’m the one responsible for promoting the dubious UAH data.
I think you need catnip now, how many posts to this thread have you already made with your charts attached…
Find someone else to whine to, not interested.
“how many posts to this thread have you already made with your charts attached”
2.
“not interested”
Yes, that’s evident.
“Where I am” is the only thing that counts. I don’t have to wait until the global average pattern of anomalies are gridded and uploaded to be told what to think.
Here’s the graph of UAH anomalies for the month of August (from 1979 to 2026).
WOW! 47 years of data out of the 12,000 years or so since Earth entered into the current Holocene climate epoch.
So impressive . . . NOT!
Yet it was only a few years ago when everyone was obsessing over the last 6 or so years.
Are you justifying idiocy by pointing out worse idiocy?
Consider the trend since 1900 (the vertical line)
The grid data is now out. Here’s my map based on it. For the official version follow the link in the head post.
Highest anomalies by country continue to be dominated by central and eastern Europe. Only exceptions in the top 20 are Eritrea and Bolivia.
Here are the 20 countries with the lowest anomalies. Only Uruguay and the Scandinavian countries had a below average August.
It’s surprising to see UAH put the UK as one of the lowest anomalies. The MO put the ground mean temperature at 1.4°C above the 1991-2020 average.
According to my estimates a surprisingly large number (53) countries had a record warm August this year. (Records going back to 1979, if it isn’t obvious).
No country had a record cold August.
Yawnnnnn, Zzzzzzz.
The US had its warmest summer on record (UAH_TLT, 1979 start, for the sensitive).
US also set to have its warmest year on record, by a country mile (UAH…. etc,)
Good catch. Summer for USA48 averaged +0.89°C breaking the record set in 2024 of +0.73°C.
Forget the above. I forgot the are data has been updated yet. This summer was 0.79°C for the USA48 according to UAH. Still a local record, but a lot cooler than I previously said.
Here’s the corrected graph. (Sorry it’s too late to edit my previous comment)
A prudent person would graph these values using only one place after the decimal. Also, lines showing the estimate of measurement uncertainty would be traditional. (And useful). Geoff S
It’s amazing how much Dr Spencer is hated around here. First he’s talking BS as he uses anomalies, now he’s imprudent for not rounding his graphs to one tenth of a degree.
Putting uncertainty bars would be a better option, but as I have to keep pointing out UAH does not provide any uncertainty analysis. Note the lack of uncertainty bars in any of the stated figures or in the graph on this or any other post.
For some reason you never seem to object to that, it’s only when I post my amateurish graphs, you think it’s an issue.
Maybe you would like to take up your accusations of imprudence with a certain Geoff S, who posted this
https://wattsupwiththat.com/2024/06/04/uah-global-temperature-update-for-may-2024-0-90-deg-c/#comment-3920875
Not only no error bars on the anomalies, but no confidence interval on the trend, and the intercept stated to 4 decimal places.
Funny how you admit that error bars and uncertainty should be shown on every graph. Next time you post a graph, I expect to see those items included.
Funny how you just make stuff up. I never said that error should be shown “on every graph”.
Bellman,
The reason for no uncertainty estimates on my graph is simple. I was unable to find them. They have to be estimated by the producer of the data, not by a user like I was.
As well you know.
Geoff S
“They have to be estimated by the producer of the data, not by a user like I was.”
And there’s your answer.
It isn’t an answer, it is a reason. It is really a condemnation if you don’t recognize it. It means climate science simply ignores measurement uncertainty thereby creating doubt in what is being shown.
A real scientist is going to look at the claim that averaging eliminates uncertainty and wonder where you got your degree. That is exactly one of the reasons for the replication crisis occurring in many disiplnes.
Do you ever wonder why climate science with tens of thousands of papers, trillions of dollars, and thousands of scientists have never won a Noble physics prize when they are supposedly dealing with an existential threat to mankind. Could it be the shoddy way they treat data and totally ignore uncertainty in the calculations? Could it be that a preoccupation with time series coorelations willl never provide a deterministic functional relationship between a set of variables.
“It isn’t an answer, it is a reason.”
It’s a reason why he didn’t put uncertainty estimates on his graph. It’s the same reason I didn’t put them on my graph. It’s because the “producer of the data”, i.e. Dr Spencer, doesn’t provide them.
“A real scientist is going to look at the claim that averaging eliminates uncertainty…”
Nobody claims that.
Do like I do.
LIG –> ±2.5C –> U = ±5.0C with k=2
ASOS (Automated) –> ±1.0C –> U = ±2.0C with k =2
CRN (reference stations) –> ±0.6C –> U = ±1.2C with k=2
Somehow climate science never gets around to using expanded uncertainty like most science. Using k = 1 only provides a 68% confidence interval. Most national reference bodis recommend a 95% confidence interval by expanding the interval by k = 2 (or 1.96 if you want to be anal)
But beyond your mistaken assertion, it is TRULY AMAZING that anyone wanting to engage in rationale debate/discussion would mistake difference-of-opinion for the emotion of hate.
There’s an adage here . . . ah, yes . . . “Physician, heal thyself!”
The estimated measurement uncertainty for satellite measurements is +/- 4K. I’ve given you this before including a breakdown of where the measurement uncertainty exists, e.g. the hot source used for calibration.
Repeat your graphs using a +/- 4K (4C) measurement uncertainty boundary and see what they look like.
He won’t, he’ll just fall back on the “Anthony Watts does it!” crutch.
“The estimated measurement uncertainty for satellite measurements is +/- 4K.”
Estimated by whom?
Where was this estimate when everyone was sayingbtgat satellite data proved all the terrestrial data sets were wrong?
“The error can’t be this big!!” — bellman
I’m not sure what the context for that quote is, but it’s about a global monthly anomaly error of ±4K I’d have to agree.
“All error is random, Gaussian, and cancels!”
Why would you think that?
Did the quote marks confuse you?
Who were you quoting, and do you agree with them? It would help if you provided a link to the exact quote.
Do you need a wee violin now?
No one specifically. A conglomeration from several sources.
Here is my summary of information I have gleaned.
Catagory Uncertainty Result
Radiometer NEΔT ±0.1 °C negligible
Calibration drift ±0.01 °C/yr negligible
Cloud emissivity ±0.02–0.05 ±2–4 °C
Cloud optical depth ±0.1–0.2 ±2–4 °C
Cloud height ±0.5–1 km ±1–3 °C
Cloud microphysics variable ±1–4 °C
As you can see a combination of factors dealing with clouds can easily be as much as ±4 °C.
Here is one comprehensive paper with lots of good information.
https://journals.ametsoc.org/view/journals/clim/38/22/JCLI-D-24-0633.1.xml
One important fact from this paper is that a lot of modeling is done in order to take into account the variable nature of clouds and moisture in the atmosphere. If actual conditions do not match the model assumptions, you end up with systematic error that is unknowable.
Another fact that I found was that 5-number statistical analysis was done to determine median differences and Interquartile Range differences. Both Tim and I have postulated that the 5-number statistics might give a more reliable and consistent description of non-normal distributions.
Lastly, just to show where the ±4C originates, the paper gives a range of 2 ±14 W/m² for Long Wave Upwelling (LWU). That doesn’t end up being a ±4C, more like ±2C, but other data and papers lead one to estimate a ±4C in general.
One needs to remember, this is modeling error, not actual instrument measurement uncertainty. Clouds and atmospheric moisture are variables that aren’t measured but instead estimated. If you want to entertain a smaller uncertainty because you think clouds and moisture have less of an effect, be my guest.
“No one specifically. ”
In other words you made the quote up. It’s certainly not something I’ve ever said. Tim says it all the time, but only as a phoney quote. It’s just your usual straw man argument.
Estimated by whom?
You can do your own research. Ask any AI how clouds can affect satellite measurement of IR. There is lots of information about the types of cloulds and their prevalence.
“You can do your own research.”
In other words you made it up.
“He won’t”
Another prediction that may well proved wrong, when I get a chance
“He’ll just fall back on the “Anthony Watts does it!” crutch.”
You still don’t get this do you? I’m not in any way defending Watts or Monkton or even Spencer. I do not think UAH is accurate, in fact I think it’s probably the least accurate of all the main data sets.
All I’m doing is drawing attention to the general hypocracy around here. I haven’t seen you once comment directly to Spencer or Watts asking why they are publishing such inaccurate information, or why they are not drawing graphs with 4 degree uncertainty intervals. Yet every time I post using the same data, suddenly that’s the problem.
And it’s particularly amusing whem the person attacking my lack of uncertainty bars was posting exactly the same data with no uncertainty intervals only a few years ago.
There is no hypocrisy. How many posts have Tim, binice, km, and I made criticizing all climate science for their ignoring the fact that measurements are never 100% accurate. Pointing it out on each and every post is a pain in the arse.
If you want to receive less criticism then:
Not once have I seen you publish an uncertainty budget for any of your trends. Is that an indication that uncertainty doesn’t exist?
This is the dude who claimed that it is possible to increase the resolution of an optical microscope by “averaging” multiple images.
“This is the dude who claimed that it is possible to increase the resolution of an optical microscope by “averaging” multiple images.”
…
Noise averaging and measurement resolution (or “A little noise is a good thing”)
“scanning microscope”
This is a huge cherrypicked red herring. You can’t get information beyond the limits of the optics.
But you might understand this if you had any real lab experience.
“noise averaging”
Ah yes, it is back to the tried-and-true “all error is random, Gaussian, and cancels!” crutch.
What if all the images are the same?
You claim it’s impossible to increase the resolution of s microscope by oversampling. I provide a paper that says you can. Call that cherry picking if you want. There are plenty of other resources that explain how oversampling works.
“What if all the images are the same?”
Then it won’t work.
You don’t understand optics, at all.
The example you pulled out of the ether only increases the resolution of the stepping motor that performs the scanning.
Big difference, try again.
You are out of your wheelhouse on this one. You don’t appear to know what quantization noise is. It is when an ADC (Analog to Digital Converter) has errors in its sampling. I learned about this in 1972 as AT&T was beginning to digitize voice signals. Nyquist gives the minimum sampling frequency but that can leave large steps between each sample, introducing noise. Using a higher frequency sampling, i.e. faster rate, can reduce the difference between each step thereby lowering the noise introduced when reconstituting the signal in a DAC (Digital to Analog Converter).
In a metrology environment this occurs basically as a rounding error. It can be reduced by oversampling when you have single measurand. That is sampling at a higher rate.
Here is what CoPilot has to say.
Here is what the abstract of the paper has.
This in no way applies to averaging temperatures to eliminate quantization uncertainty. You need multiple measurements of the same thing using oversampling to help eliminate the LSB (Least Significant Bit) factor.
You are trying to say that using a photo from a sunflower field in North Dakota and another from a field in Kansas and we can eliminate uncertainty by averaging them. I’m not sure what you would get, but it would certainly be meaningless.
Where this applies is to CRN stations. They use 3 PRT devices that are averaged at each measurement. That is similar to oversampling the same thing. That is one reason their admitted accuracy uncertainty is ±0.3C versus ASOS stations with only one device and an accuracy uncertainty of ±1.0C.
The grating sound of moving goalposts.
You really need to list all the ways in which you think averaging can increase resolution Vs all the cases where it can’t. It’s completely illogical to say you can improve resolution by measuring the same thing, but not when you are measuring different things. All your “university lab” rules are about measuring the same thing multiple times. Common sense, as well as any mathematical knowledge, should tell you resolution will be less of a problem when measuring a larger spread of temperatures.
“Where this applies is to CRN stations. They use 3 PRT devices that are averaged at each measurement.”
Except they use a median, not a mean. In that care you can’t increase resolution. The result will only be as good as your middle measurement. And in any case an average of just three measurements will not increase the resolution by much.
“You are trying to say that using a photo from a sunflower field in North Dakota and another from a field in Kansas and we can eliminate uncertainty by averaging them.”
I am not saying anything of the sort. I’ve no idea where you get this nonsense. What I am saying is that the average if multiple measurements taken across a region can be a good estimate of the average for that region, and that often this average can be known to a higher resolution than the individual measurements.
This has nothing to do with spatial resolution of photographs, beyond the fact that it is possible in some cases, to improve the resolution by averaging multiple photos. This can be done in the camera, or by using a program.
You wish.
And this is BS — the camera with a translation stage is not increasing the optical resolution of the microscope as you claim, which is impossible. It is interpolating between steps of the stepper motor moving the stage.
¿Comprende?
Your lack of reading comprehension skill is showing again.
What was said is: “This uncertainty can be reduced by oversampling and averaging multiple measurements, but only if there is some noise on the measurand.”
You simply left off the “oversampling” restriction in the sentence – probably because you don’t understand what that is!
It won’t increase it at all unless it is true oversampling.
Oversampling can be done three ways: 1. a higher sampling rate than is required to meet Nyquist requirements, 2. multiple sensors measuring the same thing, or 3. somehow synthesizing additional data. 3 is hard to do with physical observations of the property of a measurand. The measurement uncertainty *must* be mostly random with no significant systematic effects, it must have a stable parent distribution (which lets out most temperature measurements), the measurement uncertainty *must* be symmetric, no asymmetry allowed. Since most calibration drift is asymmetric as is sensor response this is a very limiting restriction.
While CRN may use multiple sensors, the measurement uncertainty distribution is *not* random, Gaussian, and does not cancel. It is questionable oversampling at the very least.
“What was said is: “This uncertainty can be reduced by oversampling and averaging multiple measurements, but only if there is some noise on the measurand.””
Yes. That’s what I keep telling you.
If you’re measurements are all of different things, how much noise do you think there will be?
The amount is unknowable until a real uncertainty analysis is performed (i.e. a lot more than dividing by the magic root-N).
“Yes. That’s what I keep telling you.”
There won’t be any NOISE. There may be a variance in the measurement values but that is *NOT* noise. It is UNCERTAINTY.
You *still* haven’t actually studied what “oversampling” actually means, have you?
You didn’t even bother to actually read my post! I told you why oversampling doesn’t apply. Temperature doesn’t define a stable parent distribution. Temperature has systematic effects, it is *not* totally random (although your meme of “all measurement uncertainty is random, Gaussian, and cancels” assumes just that). Temperature measurement devices typically have an asymmetric measurement uncertainty.
NONE of this has a single, solitary thing to do with “noise”. A systematic effect is *NOT* noise, it is part and parcel of the measurement.
An uncertainty interval does *NOT* define an amount of noise!
“There won’t be any NOISE. There may be a variance in the measurement values but that is *NOT* noise.”
That’s what noise means in the context of an average. But regardless of what you call it, the point is that if there is enough variance in your data the resolution becomes largely irrelevant.
When you average a large number of things which vary by multiple degrees, it doesn’t matter if the resolution of the individual measurements is 1 degree or 1 millionth of a degree – the average will tend to be the same.
Always fall back on the magic of averaging, it is all you gots.
The average of the *best estimate* values, treated as if they are 100% accurate. Just ignore the measurement uncertainty that goes along with the best estimates – “measurement uncertainty is random, Gaussian, and cancels”.
bellman adamantly claims that meme is not baked into his brain but it shows up in EVERYTHING he ever asserts!
Variance is *NOT* noise. That’s just you trying to say that anything that is not a constant is noise! That means everything whose sound volume changes is noise. Typical garbage from you.
And here is your statistical world showing up again. Numbers is just numbers. Measurements with a resolution of 1degree are equal to measurements done with a resolution of 1 millionth of a degree. You can just average the measurements with a resolution of 1 degree out to the millionth decimal place. “Numbers is just numbers”.
“criticizing all climate science for their ignoring the fact that measurements are never 100% accurate.”
I’m not talking about your attitude to climate science, I’m talking about WUWT. How often do you criticise them for publishing articles that don’t use your preferred level of uncertainty?
” Pointing it out on each and every post is a pain in the arse. ”
Then stop doing it. It should be clear after the last 5 years that I think your arguments are wrong. It’s just a waste of both our times just repeating your mistakes.
“start agreeing that adding resolution via averaging that is beyond what was measured is incorrect,”
Why? It would be a lie. I don’t agree. I’ve explained and demonstrated to you how you can improve resolution by averaging. I’ve quoted your own sources saying you can improve resolution by averaging. You are just insisting you are right and demanding everyone agrees with you.
You still don’t understand, very likely will never understand, nor will ever make the effort to understand.
The onus for providing uncertainty estimates lies with the producer of data, not on anyone looking at their results.
And your magic averaging claims remain pseudoscientific technobabble.
And I have continually asked you to show references from university labs or textbooks in physical science that allow that. I am not interested in you justifications.
Resolution is the smallest change in the measurand that produces a detectable change in the instrument’s indication. It is a hard limit on the information available in any single reading. Resolution defines the smallest distinguishable increment, which sets a lower bound on the uncertainty of a single reading. It should be noted that resolution is only one component of uncertainty. Total uncertainty includes other components that must be considered also.
Because resolution defines the smallest distinguishable increment, it also defines the minimum uncertainty inherent in a single reading. For example, a digital voltmeter one decimal digit that is displaying 1.0 V cannot reveal whether the true value is 0.95 V, 1.02 V, or 1.04 V. The instrument simply lacks the resolution to show the next digit.
This also explains the reason for rounding analog measurements to the nearest graduation. If an analog device has graduations every 0.1 (one-tenth), it is equivalent to a digital device with one decimal digit. By rounding to the nearest one-tenth graduation, the base uncertainty becomes the same as the digital device above, 1.0 V with an interval of 0.95 to 1.05.
No amount of arithmetic — including averaging — can create information that the instrument never captured. Resolution is the floor beneath all other measurement considerations.
It is why measurements have a best estimate AND a surrounding interval around that estimate. Both must be given to correctly state a measurements value.
Here is a good document to review. As it shows, the resolution of a measurement controls the resolution of the best estimate. You cannot add extra digits that are not known.
Would you like a Coke and cheese with your Whopper?
“Repeat your graphs using a +/- 4K (4C) measurement uncertainty boundary and see what they look like.”
Here you go – for the August Anomalies.
And here’s what the graph in the head posting might look like.
In other words, the actual trend is unknown!
The actual trend is never known. Are you finally beginning to understand how uncertainty works?
Regardless it has nothing to do with your fantasy ±4K uncertainties.
But the lesson you should be taking is how on earth does Spencer manage to get all his monthly anomalies so close together when there’s such a large uncertainty on each one? The next question is why do they agree so closely with all the other data sets if there is such a huge uncertainty?
“The actual trend is never known. Are you finally beginning to understand how uncertainty works?”
Then why do you keep posting graphs with trends that are never actually known as if the trend line *is* known?
The +/- 4K uncertainty is *NOT* fantasy. Do your research!
Here are some:
radiance uncertainty – instrumental 0.3K
path loss uncertainty – 2K
hot/cold target calibration drift – 0.5K
This alone give you almost 3K of uncertainty.
Must I list out *all* of the components? Doing your research for you is tiring as all git out!
This isn’t fantasy. It is the *REAL* world – which you have little understanding of.
Rules for thee, but not me.
Here is a post where Monckton stated the trend to 3 significant figures and didn’t use error bars. This is but one example. Many of his posts were begging for the significant figure and uncertainty police to lay into him. Silence. That includes you.
https://wattsupwiththat.com/2023/01/04/the-new-pause-lengthens-100-months-with-no-warming-at-all/
So this cherrypicked example makes it ok for YOU to ignore significant digits.
Got it.
First…I’m not the one obsessed with significant figures so there’s no hypocrisy on my side.
Second…this isn’t some cherry-picked example. It is typical of WUWT posts. Regardless this one happens to have both you and Geoff bitching about my use of significant figures yet there was nary a peep about Monckton’s use.
Like I said…Rules for thee, but not me.
So you justify doing something wrong because you saw someone else do it. Anarchy by any other name is what you propose.
Do it right the first time and you won’t have to justify it at all.
That’s just blatant gaslighting. I’m not the one who did something wrong here. That was Monckton. And don’t think the irony of you bitching because I stated a value using significant figure while ignoring Monckton’s use of 3 went unnoticed.
Like I said…Rules for thee, but not me.
BTW…I standby my position in that post that using 0 significant figures is about as absurd as it gets.
Lets go over what Monckton was trying to show.
That amid constantly rising concentration of CO2, there was no temperature rise.
That alone shows that CO2 is not a control knob. Attempting to correlate temperature and CO2 just isn’t possible. There must be other variables at work.
That is what time series analysis is for. You start off with a stationary trend as the base model and then add trends of other variables until you obtain the original trend.
You have tried this with your ENSO model. Starting with a base and adding other pieces. Show us a paper or study in climate science that has attempted this.
Continuing to use the worn-out adage that increasing CO2 is going to cause catastrophic global warming no longer cuts the mustard. It is why climate change is continually falling in people’s concerns.
They will never understand CMoB’s method, ever after he tells them directly.
If you don’t think CMoB is finding the longest period in which the linear regression trend <= 0 C.decade-1 ending at the most recent month then what is it exactly that you think his method is doing? And why is that Monckton never disagreed with my understanding of his method? And why is that my understanding produces the EXACT same result as his? And if you don’t think the current Monckton pause sits at 43 months then what do you think it really is?
And you STILL don’t understand what he was doing…
Let me get this straight so that I’m not accused of putting words in your mouth. You’re defending Monckton’s use of 3 significant figures as justified because his intent was to make a statement about the relationship between CO2 and temperature. Yet my use of 1 significant figure was inappropriate and that the calls for me to have used 0 instead were justified. Yes or No?
No, I’m trying to communicate through your thick trendology mind block that you don’t understand what he was doing, even after he told you directly what he was doing.
And WTH are “0 significant figures”? Sounds like some kind of nit you’ve decided to obsess about. OTOH, 0 is about right because trendology is not a quantitative physical science.
“Lets go over what Monckton was trying to show. ”
Good grief are you still trying to defend this nonsense.
‘That amid constantly rising concentration of CO2, there was no temperature rise. ”
Not even Moncktin said that. He doesn’t deny there is warming, just tries to distract with these so called pauses. What he kept saying was along the lines that all the pauses meant warming was slower.
“Attempting to correlate temperature and CO2 just isn’t possible”
It’s entirely possible as has been demonstrated countless times.
” There must be other variables at work.”
Of course there are other variables. Who says there aren’t? It’s just another one of your strawmen.
” You start off with a stationary trend as the base model and then add trends of other variables until you obtain the original trend.”
Then do it. Show your own model that gives you the temperature trend without using CO2.
In the meantime you completely ignore the fact that Monkton was using exactly the same data you say is meaningless. You’ve claimed there is a ±4K uncertainty on it. It uses anomalies which you say have no value, and global averages which you insist are both impossible and physically meaningless. And it’s all based on linear regression with no stated confidence intervals. Yet somehow you think you can reliably detect statistically meaningful pauses, string enough to prove the CO2 is not causing warming.
Neither does the bellman grok CMoB, and never will.
That’s because I’m limited by everything I’ve seen him say and do. You presumably can fully grok him being an acolyte in his cult. Only you know the hidden truths.
If you can’t read, I can’t help you.
Climate science, as it stands today, *IS* a farce. I can’t believe that trained physical scientists will even consider being included in the clique known as “climate scientists”.
Anomalies generated from averages of INTENSIVE PROPERTIES have no value because the averages have no value! That’s not a hit on the use of anomalies – but the anomalies have to represent reality in order to have meaning!
No one is trying to detect statistically meaningful pauses – they are trying to falsify the claim that CO2 is the control know for “global temperature”. If CO2 goes up but “global temperature” doesn’t then the claim that CO2 is *the* control know is falsified. If there are *other* control knobs then why isn’t climate science identifying them and developing a functional relationship using *all* of the control knobs to generate “global temperatures”?
“No one is trying to detect statistically meaningful pauses”
You mean apart from the monthly articles here saying Lord Monckton has discovered the pause has extended by another month. If you now accept that they never had any statistical significance – then that’s progress. As I kept saying, they were statistically meaningless.
“they are trying to falsify the claim that CO2 is the control know for “global temperature”.”
Not even Monckton is daft enough to claim that. Honestly, can you find a single example of him saying that? What he claimed was that in some way the pauses were a useful way of demonstrating that the rate of warming was slower than predicted. He never claimed it falsified the hypothesis that rising CO2 was warming the planet.
“If CO2 goes up but “global temperature” doesn’t then the claim that CO2 is *the* control know is falsified.”
I don’t think you understand what control knob meant in this context. Calling it a control knob does not imply a literal one-one month by month correlation between CO2 and temperature. It means it’s the most important greenhouse gas in the atmosphere with regard to climate change. It is not saying that other factors such as ENSO and other weather events will not result in short term fluctuations.
“If there are *other* control knobs then why isn’t climate science identifying them and developing a functional relationship using *all* of the control knobs to generate “global temperatures”?”
Why do you think climate scientists keep going on about the coming El Niño? But, again, this is not something that “controls” the climate. El Niños do not cause climatic warming, just a hot year or two.
“Buh buh buh the averages!?!??”
Could someone check on karlo, he doesn’t sound well.
I understand perfectly what climate science thinks is the control knob for their “global average temperature”.
Really? More important than water vapor? Water vapor *IS* a greenhouse gas also.
Climate science doesn’t even have a functional relationship for water vapor and global cloudiness. So how do we know that water vapor isn’t the most important in “climate change”?
This is just one more of your assertions that have nothing to do with reality.
I go by the evidence – number of posts on WUWT written by people untrained and ignorant. Including you, Gorman, who doesn’t even know that atm CO2 concentration is both a cause and effect of planetary warming.
BINGO — someone who can read English.
Could you point me to Monckton saying that in English, or even Latin?
It should be obvious that if the pause is not statistically significant, it cannot be used to falsify anything. It makes as much sense as claiming that a positive but not significant trend falsifies the claim there has been no warming.
Malarky! Once again, statistical descriptors define the *shape* of a set of data, they are not themselves part of the data.
If the theory disagrees with reality then it is reality that rules. The climate models are built assuming CO2 is *the* control knob for temperature. If reality shows that it is *not* the control knob because in reality temperature does *not* follow CO2 then the theory is falsified.
Feynman said: “It doesn’t matter how beautiful your theory is… if it doesn’t agree with experiment, it’s wrong.”
If the model theory doesn’t agree with reality then the theory is wrong – i.e. falsified.
“Malarky! Once again, statistical descriptors define the *shape* of a set of data, they are not themselves part of the data.”
Did you get an AI to write that? It doesn’t have any relevance to the point I was making.
“If the theory disagrees with reality then it is reality that rules.”
True. But the problem is nothing in all those meaningless pauses insignificant pauses shows that reality is disagreeing with theory. That’s the point about statistical significance. It isn’t good enough to find some data that is different to theory, you have to show it’s significantly different to theory, otherwise the difference could just be down to chance.
“The climate models are built assuming CO2 is *the* control knob for temperature.”
Nope. The control knob metaphor comes from the models. But it’s obvious you still don’t understand what the metaphor is saying. As so often you are trying to falsify a strawman, and failing.
your point: “It should be obvious that if the pause is not statistically significant, it cannot be used to falsify anything.”
My reply: “Malarky! Once again, statistical descriptors define the *shape* of a set of data, they are not themselves part of the data.””
It is the OBSERVATIONS, i.e. the DATA that is compared to the theory in order to falsify or confirm a theory.
In addition, if you don’t consider the measurement uncertainty you don’t *KNOW* from the statistical descriptor of the “best estimate” whether it is statistically significant or not!
Why do you *always* go to the “best estimate” and ignore the measurement uncertainty?
Huh? If the model doesn’t match the observations, then reality does agree with theory. The theory is that CO2 is *the* control knob. If it is *NOT* the control knob then what is? What has climate science identified as other possible control knobs? Control knobs that need to be controlled as well as CO2? Are there some that could be turn UP in order to offset CO2?
Do *you* know?
Nope, you can’t read.
“Nope”
It’s alright – I knew you couldn’t because he never said it.
OK, now resorting to tossing out lies, goooood job.
And DYOFH.
If I’m lying you should have no problem providing the quote.
If you can prove he did say it, then I was wrong and I’ll apologize.
But until then I can only say that I don’t remember him saying anything of the sort.
“DYOFH”
You do realize how difficult it is to prove a negative, don’t you?
*plonk*
“Let’s go over what Moncton was trying to show”.
If there ever was an appeal to authority, this is it, Gorman. And an appeal to an obvious fraud to boot. Monckton claims to be a Lord and isn’t (The House of Lords disavowed his claim), and positions himself as an expert on science, but has no scientific training at all. And you fell for it. Which is not surprising since you fall for every internet Denier meme — which makes you one of the finest examples of Dunning Kruger on WUWT. And that’s saying something.
“fraud” … “Denier” … “Dunning Kruger”
This one is aiming for the biggest liar award on WUWT.
Let’s see.
Albert Einstein achieved his PhD in 1905 along with his papers on special relativity and the photoelectric effect. So much of his work was done before achieving his doctorate.
Freeman Dyson never achieved his PhD, he must have been stupid according to you.
Srinivasa Ramanujan, only achieved a BA after much of his work was already done. He must have been stupid too.
Thomas Edison, no college degree. He must have been stupid too.
Nikola Telsa dropped out of college. He must have been stupid too.
Bill Gates dropped out of college. He must have been stupid too.
How many experiments does it take to falsify a theory? Seems like your conclusion is faulty. One’s college degree doesn’t does not translate into a deductive truism.
And one of your global warming bible prophets, Al Gore, is an expert on science?
Are all of the climate scientists that believe an average of the intensive properties of different things located in vastly different environments has actual physical meaning also experts on physical science?
Perhaps *YOU* can tell me the physical meaning of the average temperature of ten different water baths located in ten different spots on the globe. If the global average temperature has physical meaning then the average temperature of those ten water baths must also!
Have at. Explain it.
Are all the climate scientists that believe an EFFECTIVE temperature calculated from the S-B equation is an actual physical temperature somewhere on the surface of the earth also experts on physical science?
Have at it. Explain how the EFFECTIVE temperature from the S-B equation is an actual physical temperature.
“US also set to have its warmest year on record, by a country mile (UAH…. etc,)”
That’s going to pose a problem for Tom whose favourite saying is to tell us the US was warmer in the past.
Temperature is now measured in miles.
Copy that.
I would like Dr. Spencer and Dr. Christy to address how this El Nino temperature increase, especially in the tropics, illustrates a real “warming” (increased energy) of the globe from a thermodynamic standpoint.
My research into this phenomena shows that there is no new energy being added to the Pacific. Warming in the Pacific is due to warm water that has already been heated spreading from the western Pacific into the central and eastern Pacific. Averaging this wider area that now has a higher temperature simply raises the average yet doesn’t address the fact that the stored energy has not changed.
This makes temperature a very poor indicator of the total energy contained in the Pacific and of warming of the globe.. All this when there is no energy being added to the globe.
It is like putting a glob of peanut butter near the crust of a piece of bread. If you taste the other end, alas, no peanut butter. But, use a knife to spread the glob over the whole piece, voila, peanut butter everywhere without adding more.
“I would like Dr. Spencer and Dr. Christy to address how this El Nino temperature increase, especially in the tropics, illustrates a real “warming” (increased energy) of the globe from a thermodynamic standpoint.”
Have you tried asking him, politely, on his own web site?
Averaging this wider area that now has a higher temperature simply
raises the average yet doesn’t address the fact that the stored energy has not changed.increases the amount of thermal energy being transferred into and retained by the lower atmosphere (which is the physical media-of-focus in the above article specific to UAH temperature data, NOT surface water/land temperatures).Looking at it another way, Dr. Spencer and Dr. Christy release data on atmospheric temperatures, not total, or even relative, terajoules of atmospheric energy . . . and for good reason.
Sorry, but the Sun’s radiation adds energy to the Earth’s thermodynamic system each and every second of every day.
If you look at the last two monthly maps.. you can see the general warming spreading out form the tropical Pacific.. ie.. an El Nino style bulge…
… so it is NOT caused by CO2, but by the increase in absorbed solar radiation into the tropical ocean..
There are of course the usual “warmer” and “cooler” patches around the NH due to the jet stream.
UK has been lucky enough to get some warm weather out of it.. other places around the NH have been decidedly cooler than “usual”
And the earth radiates heat away every second of every day. As T gies up linearly from added heat, energy out goes up by T^4.
You keep saying that, but never explain what you think it means.
Here’s T^4 on for T from 280K to 300K. It’s pretty close to linear.
Close, but no cigar.
That’s a relief. I really don’t want to take up smoking at my age.
Here is a better graph.
What is that supposed to show? What are your axis?
Poor presentation, but accurate. I’m guessing that the l.h. axis is T^4/1,000,000. The r.h axis is degK. It validates Bellman’s elementary observation, while trying to obscure it. Another in the bag o’ tricks, after silly scaling, truncated data, and so on.
I was more concerned about the x-axis. But, I suspect it doesn’t mean anything.
But yes, I think it’s just using two different arbitrary scales on the same axis and looking at a much larger temperature range.
A body at -30°C will be emitting less than half the energy as a body at +30°C. Not sure what that has to do with Tim’s argument.
It has to do with the shape of the curves. Can you not see that one is linear and one is not?
It is not just arbitrary scales. For being a number guy, you have a blind spot to what is occurring.
For every linear increase in temperature, the 4th power grows at an ever increasing rate. See my response to bigoilbob. Starting at 100K and increasing by a delta of 100K you get the following differences.
ΔT⁴ = 1.5×10⁹
ΔT⁴ = 6.5×10⁹
ΔT⁴ = 17.5×10⁹
ΔT⁴ = 36.9×10⁹
It really is as simple as graphing “y = x” and “y =x⁴” for x>0.
If you want to get more sophisticated, take the derivatives.
(y = x) –> dy/dx = 1
(y = x⁴) –> dy/dx = 4x³
The slopes are totally different, and the exponential grows based on a power.
Take off your statistician hat and put on a physics hat to see what really happens in the world. This is all old hat to engineers who deal with calculus based phenomena.
All true. All deflecting from Bellman’s valid, animated, point.
https://wattsupwiththat.com/2026/09/03/uah-v6-1-global-temperature-update-for-august-2026-0-68-deg-c/#comment-4236904
Do you disagree with it?
I do disagree with it. The graph appears to show there is a linear relationship between temperature T and T⁴. But that isn’t true.
280 –> 6.15×10⁹
290 –> 7.07×10⁹
300 –> 8.10×10⁹
Notice, the temperatures go up by +10. The T⁴ growth, however, is not linear.
7.07 – 6.15 = +0.92
8.10 – 7.07 = +1.03
If you don’t understand the relationship between a linear increase and an exponential increase, graphs can be misleading. Because of the difference in values it is difficult to show the actual change. Here is a graph from desmos.com.

” The graph appears to show there is a linear relationship between temperature T and T⁴. ”
Then you are not looking closely enough. But the fact you can’t see much if a deviation from linear is the point.
“If you don’t understand the relationship between a linear increase and an exponential increase…”
Once again it is not an exponential increase. If you are going to lecture people on different curves, you need to understand the terms yourself. A polynomial is not an exponential.
And that point is incorrect which I showed.
If you want to do science, then do science. Beng precise and correct is part of what is learned in a physical science discipline.
Close only works in horseshoes and hand grenades.
“And that point is incorrect which I showed.”
You have not shown anything. The graph I produced showed a T^4 curve for T from 280 to 300. It is curved, but not enough for you to see it. You drew a graph over a much larger range of T which does show more of the curve – that is expected.
“If you want to do science, then do science.”
I’m not “doing” science. I’m asking you to explain why you think T^4 is relevant. How much of difference would it make if it was T^4 or T, with regard to a couple of degrees of global warming.
“Beng precise and correct is part of what is learned in a physical science discipline.”
Says the person who also thinks all global temperatures should be rounded to the nearest degree.
But it’s a bit difficult to argue about correctness unless you actually give me a single practical example of what you are arguing about. Give me your particular issue and we can see how much of an effect T^4 has.
You just admitted that T⁴ is a curve and not linear. That is exactly what I said and showed.
That means as T increases linearly, the radiation increases exponentially which is what you originally questioned.
Here is an example. Let’s examine what occurs each day when temperature starts at 293 and rises to 308.
(293⁴)(5.67×10⁻⁸) = 418 W/m²
(308⁴)(5.67×10⁻⁸) = 510 W/m²
(308 – 293)× 100÷293 = 5%
(510 – 418)× 100÷418 = 22%
What is different here?
“You just admitted …”
Pathetic. There’s nothing to admit. It’s always been a curve. I’ve never said it wasn’t. What I keep asking you is why you think it matters. What is the exact problem you are trying to solve?
“That means as T increases linearly, the radiation increases exponentially which is what you originally questioned. ”
No. I pointed out it does not increase “exponentially”. But what I questions was what difference it made. And that depends on you actually stating your problem.
“Let’s examine what occurs each day when temperature starts at 293 and rises to 308.”
Again, so what? What exactly is your point? Why do you care about the percentages?
Moreover, this has nothing to do with the global increase in temperature. That isn’t changing by 15K.
Your logic is failing again. You just admitted that you pointed out that radiation does not increase exponentially after I said it does. Then you turn around and it doesn’t increase exponentially.
The slope of the curve at 293K is 5.7. The slope of the curve at 308 is 6.6. That can only happen with a curve.
You can call it a polynomial function if you like, but the end result is a curve, not a line.
“You just admitted that you pointed out that radiation does not increase exponentially after I said it does. Then you turn around and it doesn’t increase exponentially.”
Did you mean to say that?
It’s either Willie or Andy who keep admonishing us to respond to what we said and not what you think we said. Here’s what Bellman said:
“Here’s T^4 on for T from 280K to 300K. It’s pretty close to linear.
In fact the correlation between the 2 data sets is 0.9996, so I’m calling that “pretty close”. Do you disagree?
” For being a number guy, you have a blind spot to what is occurring.”
Your usual patronising ad hominem. I am completely aware that T⁴ is not the same as T¹, just as I understand the difference between a polynomial and an exponential. The point you keep dodging is that it is largely irrelevant when you are talking about a change of a fraction of a percentage point.
And neither you or Tim have explained why you think it’s relevant to your argument.
‘ Starting at 100K and increasing by a delta of 100K you get the following differences.”
And why are you starting at 100K. That’s -173°C.
Let’s start with an Earth at 288K. To rise it by 1K you need an increase of energy in of
289⁴ – 288⁴ = 96 mega units.
To go from 289 to 290 you would need an additional
290⁴ – 289⁴ = 97 mega units.
To go to 291 you need an additional 98 M units.
To go to 292 you need an additional 99 M units.
There isn’t an exactly linear relationship, but it’s only an increase of about 1% for each K of temperature increase.
Really this does not seem to be a big issue when seeing how temperatures will rise in response to increasing CO2. The more important issue is that CO2 is not going to increase linearly and the increase in energy is not linear to increasing CO2. That’s why climate sensitivity is based on the log of CO2, not linear to it
You just made my point!
I’ll correct your phrase, “There isn’t a
nexactlylinear relationship …”If you want to do government work, I suppose “not exactly” is close enough. It isn’t in my profession. You want to do science or engineering or machinist work, ‘close enough” just doesn’t cut it.
“You want to do science or engineering or machinist work, ‘close enough” just doesn’t cut it.”
Remind me about your significant figure rules.
One large purpose of significant digit rules is to prevent measurement reports from exceeding what was actually measured. That is, staying within the resolution range of the measuring device.
It is tiring to repeat and repeat this over and over. You asked me for resource about the uncertainty in OLR. Well, it is time for you to find a teaching resource that allows you to show a value that wasn’t measured.
Here is an example. I have digital voltmeter that only displays to the units digit. The ADC is set to round based on the weighting of 100,000 measurements per second.
I measure 7, 8, 9, 10. The average is 8.5V.
Did I measure 8.5? No, the meter won’t display that to me.
If the meter determined it was 8.5 it will show 9V. What else would show 9V? Why 9.499999 might do it! My interval becomes 8.5 – 9.5. How do I show that?
9 ±0.5V
Analog measurements work the same way if they are rounded to the nearest graduation. Why do you think LIG readings were rounded to the nearest graduation?
The whole point here is that you convey what was measured and the interval that would support it.
You obviously missed the sarcasm. You insist that “close enough” isn’t allowed but then say you should round down to a “close enough” value.
No wonder you have trouble understanding uncertainty and error analysis, Gorman. Your world is one in which you require both to be zero before you’ll begin to think about observed phenomena.
Says the guy whose never had to sit in a deposition to defend measurements being used in engineering a system. Or had to justify capital and expense budgets based upon measurements.
(243⁴ × 5.67×10⁻⁸) = 198 W/m²
(303⁴ × 5.67×10⁻⁸) = 478 W/m²
This should have been your first clue that something funky is going on.
60 ÷ 243 = 25% increase in temperature
280 ÷ 198 = 140% increase in radiation
This is not a linear relationship!
This is just getting pathetic. Argue with what I’m saying not what you imagine I said. T⁴ is not a linear relationship. Nobody, especially not me, has ever argued that it is. What I keep repeating I’d that the non-linearity is not very relevant when talking about a change of a few degrees.
You keep trying to justify something that is incorrect. If you feel “close enough” is a viable scientific conclusion, then be my guest. I will however call you on it.
“You keep trying to justify something that is incorrect.”
What do you think I’m saying that is incorrect? You really need to try reading what I’m saying rather than making these wild accusations. I am not saying T^4 is linear, I am not saying you can make it linear by looking at realistic global temperature changes.
What I am asking is why you think T^4 matters with regard to global temperature changes.
You are trying to justify that it is linear within a small percent. It is not, T⁴ is an exponential function any way you cut it. I gave you the difference between -30C and +30C.
-30C –>(243⁴ × 5.67×10⁻⁸) = 198 W/m²
+30C –>(303⁴ × 5.67×10⁻⁸) = 478 W/m²
60 ÷ 243 = 25% increase in temperature
280 ÷ 198 = 140% increase in radiation
Do you really think this is close to a linear relation?
We can also look just at T⁴.
-30C = 243K –> 3.487×10⁹
+30C = 303K –> 8.428×10⁹
(303-243)×100)÷243 = 24.7%
(8.428-3.487)×100)÷3.487 = 141.2%
Does this really look like a near linear relation to you?
“You are trying to justify that it is linear within a small percent.”
Yes, it’s close to linear. Linear is a reasonable approximation – for small changes in temperature. You should understand this – it’s exactly the same approximation that Equation 10 of the GUM makes.
“It is not, T⁴ is an exponential function any way you cut it.”
Unless the way you cut it is to use the actual meaning of exponential.
“I gave you the difference between -30C and +30C.”
I’ve really no idea why you are arguing this. I made exactly the same point earlier.
https://wattsupwiththat.com/2026/09/03/uah-v6-1-global-temperature-update-for-august-2026-0-68-deg-c/#comment-4237429
“Do you really think this is close to a linear relation?”
I think I see the problem. You are talking about the relationship in percentage terms. I’m talking about how much energy you need to make a local change.
Consider my graph showing the relationship as you move from 280K to 300K. You admit it look linear. But calculate it your way, and you need a 32% increase in energy to raise the temperature by 7%. But the question is, so what?
When I say it’s almost linear I’m talking about how much additional energy you need for a specific increase in temperature. Not what that is as a percentage of 0K.
If you could only explain when you think the percentage change will matter I will probably agree. But it doesn’t seem relevant to a question about how much warming will occur for a given rise in energy.
I’ve already given you an example when the percentage does matter. The simple model for the greenhouse effect. In that unrealistic model the Earth gets twice as much energy flow with a greenhouse effect than without. That translates into a temperature rise of 2^(1/4). About a 20% increase in temperature.
Not trying to hide anything. ΔT is a linear increase. ΔT⁴ is exponential.
T = 100 T⁴ = 0.1×10⁹
T = 200 T⁴ = 1.6×10⁹
T = 300 T⁴ = 8.1×10⁹
T = 400 T⁴ = 25.6×10⁹
T = 500 T⁴ = 62.5×10⁹
I could go on, but you should be able to see the result.
You MUST be kidding, right? The x-axes is measurement interval. It can be seconds, years, centuries, or millenia. Doesn’t really matter. The graph shows the relationship between T and T^4. One is linear, one is not.
Ah, so it’s a time series. You could have saved a lot of confusion by stating this at the start.
The question now is, why is temperature increasing linearly over time? One possibility is that the energy in is increasing at a fourth order to match the energy out. But that doesn’t seem likely. I think your point would be made better if you plotted temperature change in response to energy increasing linearly over time.
Regardless. It’s still missing the point, which is for realistic temperature changes of a few K, the fourth order is close to linear.
It’s not a time series, other than interval 1, interval 2, etc. for T and interval 1, interval 2, etc. for T⁴. The point is to show the different slopes of the two variables, T and T⁴.
Jeez, the x-axis is nothing more than an iteration of each value in T vs T⁴. The two different y-axis’ don’t even correlate. My purpose was to show that one increases exponentially while the other is linear.
Your graph leads one to believe that they increase linearly and that just isn’t true.
” My purpose was to show that one increases exponentially while the other is linear. ”
Then you failed. T⁴ is not increasing exponentially.
“Your graph leads one to believe that they increase linearly and that just isn’t true.”
And what conclusions do you draw from the apparent linear increase? Is it that you think my graph is misleading? Or is it that there is very little difference between linear and T⁴ when you are looking at small relative changes?
Your graph is showing a change of about 60K, a 25% increase in absolute temperature. Even then the line isn’t highly curved. Zoom in on a change of a few degrees and you will see it becomes pretty close to linear.
Really?

“Really?”
Yes, really. But I’m going to guess “exponentially” is another one of those words you throw around without actually knowing what it means.
Here’s a graph comparing the polynomial x^4 in blue, and the exponential 1.15^x in red. Value chosen just to fit the two on the same graph.
If you want to call one an exponential and the other a 4th degree polynomial, feel free to do so. For most, they are both exponential
functions because their slopes are not constant.
The point is that their derivatives are non-linear and constantly increasing when x>0. Whereas a linear function has a constant derivative that never changes.
“If you want to call one an exponential and the other a 4th degree polynomial, feel free to do so.”
Thanks, I will, because that’s what they are.
” For most, they are both exponential functions because their slopes are not constant.”
Ah, so you are saying it’s OK for you to make that mistake, because other make the same mistake.
“The point is that their derivatives are non-linear and constantly increasing when x>0. ”
The point is that the derivative of an exponential is itself an exponential.
That is true as I showed you. That is why it is a constantly increasing slope and is a curve.
Seriously? Did you never learn any of this?
No. 4x^3 is not an exponential function, any more than x^4 is. Something that should be obvious if you keep taking the derivatives.
(y = x⁴) –> dy/dx = 4x³
(y = 4x³) –> dy/dx = 12x²
(y = 12x²) -> dy/dx = 24x
(y = 24x) -> dy/dx = 24
(y = 24) -> dy/dx = 0
If you accept that the derivative of an exponential function has to be exponential, then logic should tell you that none of those functions are exponential. If zero isn’t exponential then 24 cannot be, and so 24x isn’t and so on.
But seriously, just take the time to look up exponential function on the internet, or if that’s too much trouble get your AI assistant to do the thinking for you.
y = x⁴) –> f(x) = x⁴, in physics it is position
y = x⁴) –> f⁽¹⁾(x) = 4x³, in physics it is velocity
(y = 4x³) –> f⁽²⁾(x) = 12x², in physics it is acceleration
(y = 12x²) -> f⁽³⁾(x) = 24x, in physics the rate of change in acceleration
(y = 24x) -> f⁽⁴⁾(x) = 24, curvature has stabilized
(y = 24) -> f⁽⁵⁾(x) = 0, the curvature has collapsed
You keep concentrating on what you call something rather than the underlying meaning. Any value with an exponent above 1 generates a curve. A linear change in x, results in a greater and greater value of y. End of story.
Simple answer. As temperature increases, radiation grows correspondingly faster. You are blind to the consequences as is most climate science. We are dealing with a constantly changing variable. You can use a state equation to define a point at an instantaneous point in time but it gives you no idea of the gradients involved.
If, at 300K, a body radiates at 460 W/m², it is cooling. What is the gradient involved? In other words, it will drop how many degrees in the second of time it is radiating at 460 W/m²? How many Joules are left in the 1m² after losing the 460 Joules in that 1 second? How far did the temperature drop if there was 1,000,000 Joules stored? These all require accurate calculations, not fly be the seat of the pants.
He doesn’t care, if its not an average he’s not interested.
“You keep concentrating on what you call something rather than the underlying meaning.”
The underlying meaning is the point. An exponential function is very different to a polynomial. But if you want to avoid learning anything and just expose your own ignorance, don’t let me stop you.
“If, at 300K, a body radiates at 460 W/m², it is cooling.”
Only if it’s receiving less than 460 W/m². Or you are are using the Gorman definition of cooling, in which case everything above 0K is continuously cooling.
“In other words, it will drop how many degrees in the second of time it is radiating at 460 W/m²?”
Again, that depends on how much energy it’s receiving. Also on its heat capacity.
“These all require accurate calculations, not fly be the seat of the pants.”
Then do some. I’m still waiting for your explanation of why you think it’s important.
“You are blind to the consequences as is most climate science.”
Are you really claiming that climate science doesn’t know the Stefan–Boltzmann law?
Where is the averaging in the Stefan–Boltzmann law?
They don’t even understand what the S-B equation defines.
The S-B equation defines an EFFECTIVE temperature. It is what the temperature would be of a black body emitting a certain TOTAL flux.
The effective temperature is *NOT* a physical thermodynamic temperature. Trying to relate the EFFECTIVE temperature given by S-B to the actual physical temperature of an object is impossible.
But that is what climate science tries to do by saying the S-B equation can be used to find the physical temperature of the earth, e.g. as defined by a non-physical “global average temperature”.
Two objects with very different physical temperatures can have the same S-B “EFFECTIVE” temperature. While it is a piss poor metric for climate, physical temperature is at least somewhat related to climate while the S-B *effective* temperature is not related at all.
It’s just one more piece of garbage from so-called “climate” science.
People try to do this with the extraterrestrial solar spectral irradiance, and quickly find out it is not a blackbody curve, even though it resembles one.
You have learned nothing over your years here. Absorption and emmission are two different processes. If an object emits energy it is cooling, it is losing energy.
You mention heat capacity. That has mass as a component. It is part of determining time gradients. Why do you think I asked the question:
“In other words, it will drop how many degrees in the second of time it is radiating at 460 W/m²?”
Why didn’t you answer that?
Many do not use it correctly. Gases are not black bodies. They do not radiate integrated Planck curve power. It is not unusual to see folks using the SB to calculate the power that CO2 radiates at a given temperature. They should be using the Planck Law to do that.
“If an object emits energy it is cooling, it is losing energy.”
As I said, by the Gorman definition. By any other definition an object that is getting hotter is not cooling.
“Why do you think I asked the question”
As a way of avoiding answering mine. Just explain when you think the T^4 function is relevant. What are you trying to explain?
“Why didn’t you answer that?”
Because there’s no way of answering it without knowing how much energy is being absorbed, what it’s mass is, and what it’s specific heat capacity is.
“As I said, by the Gorman definition. By any other definition an object that is getting hotter is not cooling.”
You simply cannot understand basic physics, can you? No matter how simply it is explained to you.
Net heat loss/gain = Heat gain – heat loss.
Heat gain causes warming. Heat loss causes cooling. Total heat change is the net of the two.
As a process, an object can do both, it can warm while it is also cooling.
T does not define heat gain or loss. It is a state variable. It is not a rate. It is not an amount. it is not a process variable.
T^4 *is* part of the heat loss rate equation (the other being conduction). It defines a process. It defines the COOLING process.
This is the PHYSICS definition. It is used in physical science and in engineering of all types.
“You simply cannot understand basic physics, can you? No matter how simply it is explained to you.”
We had all this two months ago. It was the most pointless and bitter argument I think I’ve ever had with you, and I’ve no intention of going through it all again.
Looking back over it, you couldn’t even keep your own arguments straight. Sometimes you claim that an object cools if there’s a net loss of energy, and warms if there’s a net gain, and other times you say any object that emits energy is cooling even if it’s temperature is increasing.
Unless you can provide a reference that says physicists define cooling as any energy loss even if an object is warming, then this argument is pointless.
“It was the most pointless”
It was *NOT* pointless. Rates are rates. State variables are state variables.
Net heat change = heat gain – heat loss.
You *still* can’t accept that as a physical reality.
It’s why you make an idiotic assertion like ““As long as energy in keeps increasing then temperature will keep rising, just at a slower rate.”
It’s because you refuse to accept that the temperature will only keep rising until heat gain – heat loss = 0.
“Unless you can provide a reference that says physicists define cooling as any energy loss even if an object is warming, then this argument is pointless.”
“Çengel & Ghajar — Heat and Mass Transfer: Fundamentals and Applications” specifically shows in Chapter 1: “Rate of energy change = (rate of energy in) – (rate of energy out)
The same textbook says: ““Cooling of a body occurs as it loses heat.””
I.e. Heat-loss is cooling.
How about Holman – Heat Transfer:
“Cooling is accomplished by heat loss from the surface.”
Jeesh, doing your research for you is a losing battle. You won’t read and understand what you are given.
“It’s why you make an idiotic assertion like ““As long as energy in keeps increasing then temperature will keep rising, just at a slower rate.”
It’s because you refuse to accept that the temperature will only keep rising until heat gain – heat loss = 0.”
To be clear, I was talking about the rate of energy increasing.
“The same textbook says: ““Cooling of a body occurs as it loses heat.”””
“Cooling is accomplished by heat loss from the surface.”
Do you have an exact quote, with context, and preferably page numbers.
“To be clear, I was talking about the rate of energy increasing.”
What the hell does that mean? Where in the sun-earth system is there a source of heat where the rate of energy is increasing?
“Do you have an exact quote, with context, and preferably page numbers.”
I gave you the EXACT quotes. What do you think the quotation marks mean?
If you want to read the books then *YOU* get them and study them. It’s not up to me do it for you! Jeessshhhhh!
“I gave you the EXACT quotes. What do you think the quotation marks mean? ”
Are you sure? I found online copies of your books and couldn’t find either of those exact quotes.
Regardless, it doesn’t appear from your quotes that they are saying cooling is defined as any emission of energy, just that losing heat is how an object cools.
I’m positive. We all know you can’t read. Look again.
““Cooling of a body occurs as it loses heat.”” That says it all. All bodies above 0K lose heat by one method or another. Cooling happens. It simply doesn’t matter that you believe that cooling only happens when it can be measured as a decrease in temperature.
” Look again.”
If you are positive then just give me the chapter and page number, or a bit more context.
“That says it all.”
It really doesn’t. It doesn’t explain what “loses heat” means in this context, e.g is it a net difference in heat flow, or a reduction in internal energy.
And it isn’t clear if sentence is intended to define the word “cooling” or just indicating why a specific body is cooling.
I am *NOT* going to indulge your prediliction for cherry picking. Study the textbook and do the examples!
I’ll draw my own conclusions. How hard can it be to look at the page number at the same time you are looking at the sentence.
Nothing new here.
IDMOFH.
Was this supposed to be some manner of insult?
The equation is:
ΔU=Q−W
“Q” is a separate process from “W”.
ΔU is the change in internal energy.
The equation applies to real bodies and theoretical black bodies.
The earth is a real body. Incoming energy, “Q”, absorbed into soil is not all radiated, some is stored. “W”, outgoing eenergy, does not necessarily match “Q” during the day or night.
This equation can be expanded into a dynamic system using gradient and integration.
A neet gain in sensible energy, ΔU, will raise the temperature, what some call warming. That does not mean that “W” did not also occur, that is, a loss in senesible energy or cooling. THEY ARE TWO DIFFERENT PROCESSES!
If you can’t understand that absorption and emission are different processes, you have no business correcting me or anyone else about thermodynamics.
If you take an object that has no external thermodynamic heat source providing input to the object, and compress it, i.e. do work on it, the temperature can go up while the only thermodynamic process in operation is COOLING. The cooling process never stops, not even during compression. In fact the rate of heat loss will INCREASE as the temperature goes up!
As we keep trying to tell bellman, temperature is a state variable. It does *NOT* tell you *how* the state was arrived at. If you don’t know how the state was arrived at you really don’t know if you have net heat loss or gain. Temperature simply won’t tell you.
But bellman and bdgwx are never going to believe that simple fact of physical science.
The only way you know it is getting hotter is by a continuous measurement of the radiation being emitted – determining the gradient.
At the moment you measure the 460 W/m², the object is at a specific temperature. It is a state value determined by a state equation. It is not a declaration about the next moment in time.
Ultimately, it means the object has lost energy – losing energy is cooling.
In a following moment, if it radiates more than 460 W/m², then you know it has absorbed more than 460 W/m². In a following moment, if it radiates less than 460 W/m², then you know it has absorbed less than 460 W/m².
If you had studied physical science you would know whate a state value is. It is a single moment in time where the components coming to give a single value. You do not know the path that was taken to achieve that moment in time. That is determined by gradient expressions either adding or subtrating from the state value.
Your hypothesis of warming is outside the issue of a state value. You need to state a gradient for that. The gradient could have been either positive or negative. That is why I asked you the question that you failed to answer.
The point is that at the moment in time when the radiation was created it was at a given temperature – a state.
I would urge you to start your study at this page:
en.wikipedia.org/wiki/Thermodynamics
This page states the following:
The link to “function of state”, (en.wikipedia.org/wiki/State_function) has a good description of what this means.
The SB equation is a state function.
ΔU=Q−W
Is the equation that is appropriate for your question.
ΔU –> is the change in internal energy.
Q –> is the amount of energy added as heat
W –> is the work done externally, I.e., the energy released
Q is absorbed energy
W is emitted energy
“The only way you know it is getting hotter is by a continuous measurement of the radiation being emitted – determining the gradient. ”
Or by using a thermometer.
“In a following moment, if it radiates more than 460 W/m², then you know it has absorbed more than 460 W/m². In a following moment, if it radiates less than 460 W/m², then you know it has absorbed less than 460 W/m².”
And the question is, do you consider that toean it’s warming it cooling?
” That is determined by gradient expressions either adding or subtrating from the state value. ”
How many more of these distractions are you going to go through before accepting that by any definition, if the state value is increasing over time then it’s warming not cooling?
“Your hypothesis of warming is outside the issue of a state value. ”
It’s not a hypothesis, it’s a definition. If the temperature increases over time it’s called warming.
It is only a distraction to you. You are still showing that you have no idea what a state function or state value is. A state function gives a single value based upon a given set of values for the other variables.
Can you get the same value with other variable values, sure.
Can you change a variable and get another state value, sure.
But here is the issue, you have no idea of the path to get to the new set of variable values.
Here is a state equation. P1V1 = P2V2. I solve for P1 and get
P1 = P2V2/V1
Now I tell you P1 changes from 10 psi to 10 psi with a change in the other variables. Tell me how it got there and the path it took.
No, it means the net sensible energy has increased from t0 to t1. It doesn’t mean that the body didn’t both absorb energy (warm) and emit energy (cooled) from t0 to t1.
This is exactly the conundrum one has in designing a heat sink for a power transistor. The energy in is constant, what do you need to emit (cool) more. They ARE different processes.
“It is only a distraction to you.”
It’s so sad. You whine about how I’m distracting just becasue I try to get you to accept the correct definition of exponential, but you don’t think it’s a distraction to to keep claiming that a rising temperature is called cooling. I’m quite prepared to accept there is some specialist definition of cooling, but so far you have both failed to provide any evidence of such.
No, it means the net sensible energy has increased from t0 to t1. ”
I reminder of what you said three months ago.
https://wattsupwiththat.com/2026/06/17/do-los-ninos-cause-climatic-cooling/#comment-4209600
https://wattsupwiththat.com/2026/06/17/do-los-ninos-cause-climatic-cooling/#comment-4210622
https://wattsupwiththat.com/2026/06/17/do-los-ninos-cause-climatic-cooling/#comment-4208358
Here’s a quote from Tim in that same discussion
https://wattsupwiththat.com/2026/06/17/do-los-ninos-cause-climatic-cooling/#comment-4209033
Ahhh! Now you are starting to get into correct thermodynamic area.
Does Joules_in > Joules_out mean a higher temperature?
Does Joules_In < Joules_out mean a lower temperature?
Hint: Think about latent heat which is non-sensible energy.
Think about bodies that have different specific heats. Does temperature adequately address the Joules being moved?
Then think adiabatic expansion in the atmosphere where energy is not gained or lost, but temperature drops. In other words, Joules_in + Joules_out = 0. Does temperature adequately address the quantity of Joules.
You have a simplistic view of warming and cooling being associated with temperature alone. Nothing wrong with that, but it illustrates a lack of knowledge about thermodynamics.
And I stand by that given the context. When a “body” changes temperature it has cooled or warmed due to the net energy change. However, the temperature does not provide the path the body took to get to the final temperature. The equation:
ΔU=Q−W
Tells you path it took. For ΔU to be negative, Q < W. In other words, the internal sensible energy has reduced.
You are trying to justify the thought in your head that ΔU defines heating and cooling. It DOES NOT. The PROCESSES required to reach the state value of final temperature are not defined by the final temperature being a positive/negative value.
Think back to what started this. I said that if a body emits 460 W/m² that it is cooling. You responded how could it be cooling if it was receiving more than 460 W/m².
This is a discussion of what causes net sensible energy to increase or decrease. To evaluate this, one needs to make a distinction between energy in and energy out. ΔU = Q – W.
If a body has a temperature rise, Q > W, which means more energy has been put into the body than removed.
If a body has a temperature fall, Q < W, which means more energy has been removed from the body than put into it.
You may say a body has cooled or warmed by analyzing ΔT, but you cannot determine the energy path it took to get there.
Your refusal to accept that a body can both emit energy and absorb energy simultaneously is incorrect.
“You are trying to justify the thought in your head that ΔU defines heating and cooling.”
No. The thought I my head is that cooling normally means a reduction in temperature.
“ΔU=Q−W”
Could you keep to a single subject. The question wasn’t about work. It was about whether an object radiation energy is cooling, even if it receives more energy than it emits.
“Think back to what started this. I said that if a body emits 460 W/m² that it is cooling. You responded how could it be cooling if it was receiving more than 460 W/m².”
Correct, nothing to do with enthalpy or work. Maybe you are just arguing something different to your brother. His argument is that any emission of energy is cooling. Arguing that there might be ways of increasing internal energy without increasing temperature is beside the point.
“You may say a body has cooled or warmed by analyzing ΔT, but you cannot determine the energy path it took to get there. ”
This is just more deflection. I’m not trying to determine the energy paths at this point. I’m just trying to keep the conversation sane by sticking to a recognized definition of cooling.
“Your refusal to accept that a body can both emit energy and absorb energy simultaneously is incorrect.”
This strawmanning is of the charts. I have absolutely not refused to accept that. On fact it’s the whole point of my argument. An object is always radiating energy but it can simultaneously absorborr energy. If it absorbs more than it emits it is warming not cooling.
You refuse to admit that you have not studied thermodynamics.
Consequently, you cannot lose your preoccupation with temperture.
A change in thermometer readings will not tell you how much energy was absorbed (heating) and how much energy was emitted (cooling). It will only tell you the net energy (the difference between the in and the out).
Did you not absorb Tim’s example of heating a steel rod with a match? Assume the rod never changes temperature. How many Joules did the match put in? How many Joules did the rod emit? Can you tell that by the temperature change?
“How many Joules did the match put in? How many Joules did the rod emit? Can you tell that by the temperature change?”
You won’t get an answer.
“You refuse to admit that you have not studied thermodynamics. ”
This isn’t a question of thermodynamics but what the word “cooling” means. If you think thermodynamics says that an object that is increasing in temperature is cooling, you just need to provide a reference and I’ll accept your usage. Just as you accept that you used an incorrect definition of exponential.
“A change in thermometer readings will not tell you how much energy was absorbed (heating) and how much energy was emitted (cooling).”
I’m not interested in that. All I’m interested in is is it getting colder.
“Did you not absorb Tim’s example of heating a steel rod with a match?”
What’s there to absorb. It just suggested he’s talking about a constant energy source, not a linearly increasing source. That’s why I kept askin you to explain exactly what you were talking about.
” Assume the rod never changes temperature. How many Joules did the match put in?”
Stop asking these meaningless questions. If the rod doesn’t change temperature it’s in a state of equilibrium and so receiving and emitting equal amounts of energy. But I’m not going to guess how many were emitted specifically by a match. It would depend on a lot of factors.
Cooling is a loss of energy. It can be from radiation or conduction. You’ve been given the quotations on this from thermodynamic textbooks.
I already gave you the references and DIRECT QUOTES. And you just turned around and implied they weren’t direct quotes. And then you wanted me to study the books for you instead of you doing it yourself.
If I have a rock at temperature T1, split the rock in half, and throw one half away what is the temperature of the remaining half a rock in my hand? Did the temperature of the rock piece change? Did the amount of joules of energy in my hand change? I raise my hand holding the rock from chest high to over my head. Did the joules of energy in my hand change? Did the temperature of the rock change?
What you are interested in is irrelevant from a thermodynamics standpoint. You don’t know enough to even ask the right questions.
For at least the third time, where is your linearly increasing energy source in the sun-earth thermodynamic system?
“Cooling is a loss of energy”
This is an ambiguous use of language, which is why these discussions get increasingly confusing.
What do you mean by a loss of energy. It could mean,
a) An object starts of with 100J of energy but ends up with 80J, and there fore has lost 20J and is cooler. Whereas if it ends up with 120J it has gained energy and so is warmer.
or
b) An object that is radiating thermal energy is losing energy even if it gains more energy than it loses. And therefore by your logic is cooling even as it gets hotter.
“And you just turned around and implied they weren’t direct quotes.”
And I’m supposed to take your word for that. All I asked was that you provide some context for them and preferably a page number. I’m not sure why you can’t do that.
I spent some time last night finding copies of the works online, I’ve searched them for you exact phrase, for parts of the phrase, or just for the word cooling, and can find nothing resembling your quotes. That’s why a chapter, and page number would be useful. Maybe the search isn’t working, maybe I have a different edition to yours. But if you want to convince me it means what you think it does, you need to at least give a clue as to where I can find it.
“If I have a rock at temperature T1, split the rock in half, and throw one half away what is the temperature of the remaining half a rock in my hand?”
You raise a good point. If your definition of cooling was correct, you could cut a rock in half and say you had cooled it. Obviously cooling means a change in temperature not in total energy. That’s like saying you could make your house cooler by selling half of it.
“For at least the third time, where is your linearly increasing energy source in the sun-earth thermodynamic system?”
Have you heard of this thing called CO2?
Nothing confusing about it. Nor is it ambiguous. It is the thermodynamic definition. The fact that you know nothing about thermodynamics doesn’t make the definition confusing or ambiguous, it just means you don’t understand.
And what does “temperature” have to do with any of this? I’ve given you the example where the energy can change with no change in temperature.
Here again your focus is on *temperature* as the defining state variable for energy in a system. You simply refuse to understand what the equation ΔU=Q−W defines.
It is not my responsibility to do your research for you. Several of us have tried to do that in the past on topics of metrology. And it turned out to be a useless activitiy – a waste of time.
There are at least six different editions floating around on the internet. They have all been edited over time. So what?
This is just one more example of your predilection for cherry picking instead of reading and comprehending the meaning and context of the material. STUDY YOUR COPY TO SEE WHAT IT SAYS – in context and for meaning!
My definition of cooling is CORRECT. The internal energy of each half of the rock is half of the total before splitting. But the temperature didn’t change. It stems from the fact that temperature is an INTENSIVE property while internal energy is related to *mass*, an EXTENSIVE property.
If you have half the internal energy in your hand than before the split then why is that not “cooling”? Did you even bother to read the title of the first reference I gave you? “Heat and Mass Transfer”.
If you would STUDY your copy of the book instead of just cherry picking you will find a definition of thermodynamic systems. Tell us what the definition of an “open system” is. Tell us what the definition of a “closed system” is. Tell us what the definition of an “isolated system” is.
Your statement “Obviously cooling means a change in temperature not in total energy.” is just wrong.
You simply didn’t understand my example about compression of a material. You don’t understand what ΔU=Q−W means.
And yet here you are, trying to lecture us all on cooling having to mean a change in temperature.
Do you have a Venmo account? I’m just about to the point of having to charge you tuition for teaching you basic physical science via an online course.
“It is not my responsibility to do your research for you.”
And it’s not my responsibility to believe any nonsense you spout without evidence. It’s sop obvious that what you claim is wrong given your inability to find a single unequivocal statement saying that an object can cool even if it’s temperature increases.
“This is just one more example of your predilection for cherry picking instead of reading and comprehending the meaning and context of the material. STUDY YOUR COPY TO SEE WHAT IT SAYS – in context and for meaning!”
You claimed you provided an exact quotation. Now you say I need to study the book to find it’s hidden meaning. Maybe it wasn’t the exact quote you claimed.
“My definition of cooling is CORRECT.”
Yes, we get it. You are infallible. Writing words in capitals prove it.
“If you have half the internal energy in your hand than before the split then why is that not “cooling”?”
Maybe your definition is correct – I’m just not sure how useful it is. Cool is a word denoting temperature. Most people would find it confusing to say that a 500g rock at 30°C was cooler than a 1kg rock at 10°C.
But, as with concepts like exponential, what most people assume is not necessarily how science describes things. So I keep asking you to produce evidence.
But first, could you at least be consistent. So far you’ve said at least three things about the word cooling, only one of which I expect is true to an extent.
First you claim that cooling means emitting energy, and therefore everything is cooling all the time, even as it warms.
Then there’s the claim that it’s based on internal energy and not temperature. And that I think may be correct in some definitions – hence a distinction between sensible cooling and latent cooling.
Then you argue that cooling is just a reduction in internal energy, cutting of part of a stone will cool it. That seems at best dubious.
Also, I missed one point from your previous comment
“I raise my hand holding the rock from chest high to over my head. Did the joules of energy in my hand change?”
The answer there is no. Internal energy does not include kinetic or potential energy of the system as a whole.
I’ve given you references and quotes. I’ve given you the math. You have provided neither in support of *ANY* of your assertions.
And maybe it doesn’t even matter! The problem is that you can’t refute the math! Losing heat is a cooling process. It happens 24/7 for everything that exists at a temperature greater than 0K. It doesn’t just stop the minute another object begins to transfer heat to it!
Why do you think we keep telling you to do the examples in the textbooks? If you are going to analyze the thermodynamics of a car radiator you have to evaluate the heat loss as well as the heat gain! Somehow you seem to have settled on the cognitive dissonance that heat loss is warming!
There is no hidden meaning. It’s all right there in the math. ΔU = Q + W where Q = Qin – Qout and W = Win – Wout. Qout doesn’t just stop if Qin > 0. And Qout *is* heat loss – i.e. COOLING.
Cooling is *NOT* a word denoting temperature. I’ve given you TWO examples showing this. Temperature is a state variable, cooling is a process. They are *NOT* the same.
If you are ever going to understand a subject, YOU HAVE TO DO THE WORK! You’ve continually refused to do the work to learn metrology, you just cherry pick things you think support you with no regard for the meaning or context of what you have cherry picked.
And now you are doing the same thing with thermodynamics. Cherry picking things like “cool denotes temperature”. I don’t even know where you came up with this.
And most people have no real understanding of physics or thermodynamics. Including YOU. A 500g rock at 30C *can* have either less or more energy than a 1kg rock at 10C. You won’t know if you don’t know the PATH each of those rocks have traversed. Knowing the path means identifying and quantifying the PROCESSES involved in arriving at a certain state. Temperature, a state variable, tells you NOTHING about the processes involved in arriving at the state.
And yet here you are, lecturing everyone on thermodynamics – a subject you know nothing about. Just like here you are, lecturing everyone on metrology – a subject you know nothing about.
And when people try to educate you it just goes in one ear and out the other without even slowing down in the slightest!
“The problem is that you can’t refute the math!”
It’s nothing to do with the maths, it’s to do with what people call things.
“Losing heat is a cooling process.”
And now you’ve moved it back a step and need to define losing heat. First, if you insist on correct thermodynamic terms an object cannot lose heat, it doesn’t have any heat to lose. All it can do is emit energy in the form of heat. More importantly, you never explain whether your made up quotes are referring to net loss of heat, or not. I’ve already given you a quote where it’s plain they are talking about the net change in energy, not just any emissions.
“Cooling is *NOT* a word denoting temperature.”
Some random examples from Heat and Mass Transfer
…
…
…
“Cherry picking things like “cool denotes temperature”. I don’t even know where you came up with this. ”
From the dictionary
cool (adjective)
cool (verb)
https://www.collinsdictionary.com/dictionary/english/cool
“A 500g rock at 30C *can* have either less or more energy than a 1kg rock at 10C.”
And you need to find a thermodynamic definition that says that the first rock is cooler than the second.
Maybe you could start with the second law of thermodynamics. If you put the two rocks in contact, which way will heat flow?
And if you call an elephant a giraffe does that make it a giraffe?
ROFL!!!
This is just you living in statistical world instead of physical reality.
Wow. You just can’t resist the urge to keep digging the hole deeper and deeper, can you?
That “energy” being emitted is *NOT* heat, it is an electromagnetic wave or waves. Radiative flux is a transport mechanism, it is not “heat” in and of itself.
Conduction, on the other hand, is a direct transfer of heat, ẟQ.
ΔU = ẟQ + ẟW
I don’t know of any way to make it simpler for you.
Would it help to write it as
ΔU = Q_in – Q_out + Win – Wout?
where
Q_in – Q_out = ẟQ
W_in – W_out = ẟW
Do I need to break it down further for you?
More cherry picking without reading for context and meaning!
Cooling is a PROCESS, not a temperature. Cooling means heat loss.
More cherry picking without reading for context and meaning.
ΔU = ẟQ + ẟW
If that 500g rock at 30C has been raised against gravity from the surface of the earth to an altitude of 10m what is it’s potential energy (i.e. latent heat). If that 1kb rock at 10C has been raised against gravity from the surface of the earth to an altitude of 20000m what is it’s potential energy (i.e. latent heat)?
The 500g rock will have latent energy of 50J. The 1kb rock will have latent energy of 2×10^5 Joules.
Which one has less total energy?
You are also caught between a rock and a hard place here. The temperatures of the rocks are intensive properties that define a thermodynamic *state*. That temperature does *not* define the total energy in the rock. To know that you need to know the composition of the rock and the path it has taken to reach that temperature.
You just can’t resist the urge to lecture people about things you know nothing about, can you?
You don’t understand heat transfer at all do you? It comes from cherry picking instead of actually studying the subject. Can you even define which heat transfer processes would be involved with bringing the two rocks into contact?
Heat transfer is *always* from Th to Tc. But you *must* know all kinds of variables to determine the actual rate of transfer and the total amount transferred. For instance, if rock2 is moving it has mechanical energy that gets converted to heat at the point of collision. The final temperature of each rock will depend on things like the area of contact, the composition of each rock, etc. It is possible for rock2 to absorb enough heat to raise its temperature above that of rock1 so that the heat transfer will be from rock2 to rock1.
Thermodynamics requires knowing a *lot* of things. You can’t just simplify it to temperature as you and climate science try to do!
“This is just you living in statistical world instead of physical reality. ”
Just provide an actual reference to your definition of cooling. Just laughing is not an argument.
“That “energy” being emitted is *NOT* heat, it is an electromagnetic wave or waves.”
Really? To avoid another distracting nitpick from you, let’s just call it thermal radiation.
“ΔU = ẟQ + ẟW
I don’t know of any way to make it simpler for you.”
You could try answering the question. Is the heat loss that causes cooling in you view, a net loss of heat or not?
“ΔU = Q_in – Q_out + Win – Wout?”
I think the answer you are groping for is “yes”. In which case your imaginary quotes are not saying all objects are cooling all the time they emit thermal radiation.
“Cooling is a PROCESS, not a temperature. ”
And that process is a change of temperature. Your claim was that cooling was about a change in energy, not temperature. If you are now admitting it means a change in temperature rather than a change in energy, we are in agreement.
“If that 500g rock at 30C has been raised against gravity from the surface of the earth to an altitude of 10m what is it’s potential energy (i.e. latent heat).”
I’ve already explained why this is nonsense, even if you think cooling is about total internal energy. Moving a rock does not change it’s internal energy. That specifically does not include energy coming from the object as a whole.
https://en.wikipedia.org/wiki/Internal_energy
“You don’t understand heat transfer at all do you?”
You always say something like this whenever your nonsense is exposed. You just can’t imagine being wrong about anything, so you just resort to ad hominems.
It does not matter what mechanisms are in play. It’s simply the point that heat flows from the warmer to the cooler object. If coolness was defined by total internal energy rather than temperature you would need heat to flow from the colder more massive rock to the smaller hotter one.
What other reference do you need than
ΔU = ẟQin – ẟQout + ẟWin – ^Wout
Tell us what Qout represents if it isn’t cooling. And show us how Qout = 0 when Qin>0.
It’s still an electromagnetic wave and is defined by Maxwell’s Equations. You’ve never actually read Planck’s treatise have you?
You just run around lecturing people on things you actually know nothing about!
Heat loss is *NOT* required to be a net heat loss. Qout is *NOT* a net value. But it still represents a cooling process nevertheless.
In other words you have nothing to offer as to what Qout represents. There is a reason why you never show the actual math on anything!
If Qout > 0 then a cooling process is occurring. Whether you like it or not.
It is a change in internal energy, ΔU.
You can’t read. All you can do is make up words to put in my mouth and cherry pick.
Here’s a quote from “The Father of Lies Hijacking Climate Science: Global Mean Surface Temperature Does Not Exist”, J. Cohler:
————————–
True warming, as understood in basic thermodynamics, represents a net transfer of energy into a system, measured in joules or watt-seconds—not degrees Celsius. Warming is fundamentally about internal energy increase (ΔU) in the system. Temperature, conversely, is an intensive state property defined only in equilibrium systems through the relationship 1/T = (∂S/∂U) at constant V and N, where S represents entropy, U internal energy, V volume, and N the number of particles. This thermodynamic definition makes clear that temperature exists only in equilibrium systems and is neither additive nor averageable across non equilibrium systems.
————————-(bolding mine, tpg)
I don’t expect you to understand this nor do I expect you will even bother to read it.
1/T ≠ ∂S/∂Q
You’ve not actually explained ANYTHING. You’ve shown not one lick of math supporting any of your assertions.
If warming is about ẟU then so is cooling. It even explains why you can get negative temperatures. But, again, I don’t expect you to understand this or to even bother reading it.
Can you move a rock without accelerating it from rest? Force = mass x acceleration,
Tell us what F * d is. (where the bolding indicates a vector)
Does the formula E = mc^2 ring any bells?
What do you think gravity is?
“What other reference do you need than
ΔU = ẟQin – ẟQout + ẟWin – ^Wout”
The one that says thermodynamic science has refined cooling to mean Qout.
You’ve been told that repeatedly, but you just keep dodging that simple point. It’s obvious why.
“The one that says thermodynamic science has refined cooling to mean Qout.”
If losing heat isn’t cooling then tell us exactly what you think it is!
The cooling process doesn’t stop just because a warming process co-exists with it.
Qout doesn’t just go to zero when Qin > 0.
Cooling is a reduction in temperature over time. To quote your brother
That’s what most people would assume you meant by cooling and is what most of the uses made in your text books.
The only refinement made in some sources is that this can refere to internal energy rather than temperature, i.e. you can cool something by removing latent heat without reducing temperature.
I’ve given you the specifics on internal energy. It is at least a 3-dimensional vector.
As usual, you didn’t understand a single thing I’ve tried to teach you.
Warming and cooling is proportional to THREE different axes, not just ẟQ.
Even on the temperature axis it is proportional to ΔU, not ẟQ.
1/T = ∂S/∂U.
Does that mean nothing to you?
Take your favorite AI. Type this in:
-what does 1/T = ∂S/∂U imply
You’ll get a reply similar to this:
“means that inverse temperature is the rate at which entropy changes as internal energy changes, while volume and particle number are held constant.” (bolding mine, tpg)
It isn’t a “refinement”. It is the physics, the EXACT physics represented in mathematical form.
Those are equilibrium temperatures. No one is denying that equilibrium temperatures are invalid. However, you cannot use those two temperatures to determine what thermodynamic processes were in play to arrive at equilibrium temperatures.
If Tₜ is less than Tₜ₋₁, then the end result was a cooling in the equilibrium temperatures at that point in time. However, you have no way to determine the values of Qout vs Qin. There are an infinite number of combinations that would provide the Tₜ temperature.
Here is a problem to solve that shows the difference.
I have two 1 m³ blocks. One has a typical soil at 300K, the other has 1.79 kg of CO2 at 300K. They are both at 1 atm. I flip a switch that lets the sides be transparent to IR for one second. You don’t even need to do the math. Just outline what you would do to compute the temperature drop. A hint. How do you compute what the total power radiated by each would be?
“True warming, as understood in basic thermodynamics, represents a net transfer of energy into a system, measured in joules or watt-seconds—not degrees Celsius. Warming is fundamentally about internal energy increase (ΔU) in the system. Temperature, conversely, is an intensive state property defined only in equilibrium systems through the relationship
”1/T = (∂S/∂U) at constant V and N,
“where S represents entropy, U internal energy, V volume, and N the number of particles. This thermodynamic definition makes clear that temperature exists only in equilibrium systems and is neither additive nor averageable across non-equilibrium systems.”
Sound familiar? Right out of the Cohler paper.
There are lots of internet references discussing all this.
Lecture Notes on Thermodynamics and Statistical Mechanics (A Work in Progress) Daniel Arovas, Department of Physics, University of California, San Diego
Temperature cannot determine the overall size of the system. A measure of water vapor must be included with atmospheric temperature (enthalpy) in order to know the size of the energy in the system.
” No one is denying that equilibrium temperatures are invalid. ”
Did you mean to say that?
“However, you cannot use those two temperatures to determine what thermodynamic processes were in play to arrive at equilibrium temperatures.”
And my point is you don’t have to know that to say something is cooling, anymore than you need to know someone’s income and expenditure to know if they are getting richer or poorer.
Here’s a reference
Thermodynamics – an Engineering Approach
Yunus A. Cengel, Michael A. Boles, Mehmet Kanoglu
The potential energy of the rock caused by raising it is part of the total energy of the system, but not its internal energy.
You know, you could learn a lot if you would quit cherrypicking and actually do some studying. From your book.
“Work is also a form of energy transferred like heat and, therefore, has energy units such as kJ. “
Bellman doesn’t recognize work as energy.
Internal energy is ΔU = ẟQ, not ΔU = ẟQ + ẟW
Just stop lying.
Yes, that’s what I’m trying to tell you.
“Internal energy was defined …It is related to the molecular structure and the degree of molecular activity…”
It concerns the molecular structure of the object. Internal energy is the microscopic energy internal to the system, the energy you get by throwing or raising a rock is macroscopic energy. Part of the total energy, not part of the internal energy. Unless moving the rock transfers energy into the molecular structure of the rock, it will not change the internal energy.
Look at equation 2-6 for total energy
E = U + KE + PE
PE is the potential energy you are adding by raising the rock. KE is the kinetic energy caused by throwing the rock. Both are distinct from U the internal energy.
“the energy you get by throwing or raising a rock is macroscopic energy. Part of the total energy, not part of the internal energy.”
You are missing the part of how KE happens! You are missing the part of how PE happens.
You still haven’t explained how ẟW is *not* part of ΔU.
As usual, you simply don’t understand the basic physics.
The discussion is about WARMING AND COOLING. These involve the TRANSFER of energy. They involve ΔU, not U.
E = U + KE + PE
is the total energy in the system. It is a STATE function.
ΔU = ẟQ + ẟW
is a TRANSFER functional relationship.
Moist air and dry air at the same temperature have a different U. But they can be in thermodynamic equilibrium because equilibrium depends on heat FLOW, not total energy.
It is GETTING SO TIRESOME of having to explain the simplest basics of physical science to you.
You just keep digging your hole deeper and deeper! STOP IT!
“You are missing the part of how KE happens! You are missing the part of how PE happens.”
I know how it happens. But that does not turn it into internal energy.
“You still haven’t explained how ẟW is *not* part of ΔU.”
That’s because it is part of ΔU. What do you think the equations are saying?
“It is GETTING SO TIRESOME of having to explain the simplest basics of physical science to you.”
Then stop doing it, and actually address the points I’m making.
You OBVIOUSLY don’t know how it happens.
KE = (1/2) mv^2. You don’t even understand how that works.
W = ∫ F dx
F = mass * acceleration, ma
∫ma dx = ∫(mv) dv = (1/2) mv^2
So ẟW is related to the work expended to accelerate a mass, i.e. to change its kinetic energy.
It’s a question of *how* a change in KE happens, not what the total KE *is*. You still can’t differentiate between a state and a process. KE ≠ ẟKE, W ≠ ẟW
ΔU = ẟQ + ẟW
They are saying that a CHANGE in KE or PE requires the application of force across a distance which is WORK! And work is a component in the change of internal energy.
You are *still* stuck in the meme that only ẟQ determines cooling and warming. It’s the same as the meme of “all measurement uncertainty is random, Gaussian, and cancels”. You just can’t get past these memes no matter how hard you try! You deny it but it just comes out in everything you get on here and assert – and then try to justify using cherry picked pieces and parts that you think confirm your memes!
The point you were making was that cooling and warming are purely ẟQ related, i.e. the transfer of THERMAL energy. That’s just plain wrong. Cooling and warming are defined by the change in internal energy. And that change, ΔU, has both THERMAL and non-thermal components.
Nor is E have ΔU as a component. E is a state variable. ΔU is a *process* variable.
“They are saying that a CHANGE in KE or PE requires the application of force across a distance which is WORK! ”
Work or thermal energy. But you still refuse to understand the point. For internal energy KE and PE are the internal energies at the molecular level. KE is the movement of molecules within the system, PE is the bounds between the molecules within the system. Gravatational potential energy, or how the object is moving, are not part of it’s internal energy. You do not change the internal energy by moving it. (Unless of course that results in additional work such as from friction or impacting something.)
Assume your interpretation was correct. What effect do you think this added internal energy would have on the thermodynamic properties if the rock?
“You are *still* stuck in the meme that only ẟQ determines cooling and warming”
Just pathetic. It’s the only way you seem to be able to argue – just make stuff up and use it as an insult. Try making a point without resorting to lies if you want me to take your claims seriously.
No, the KE of a rock is related to the velocity of the system known as “the rock”. It *adds* to the internal energy of the rock.
The internal energies of the rock are a STATE DESCRIPTION, defined as part of “E”. The CHANGE in the internal energies of the rock are a PROCESS DESCRIPTION, defined as part of ẟW and ẟQ, i.e. ΔU.
You are *still* trying to conflate a STATE variable with a PROCESS variable. They are *NOT* the same thing!
“Gravatational potential energy, or how the object is moving, are not part of it’s internal energy.”
Oh, malarky! If I drop a rock onto your head from 10m of altitude will you incur a ΔU of the same value as if I drop it from 100m of altitude?
Will your skull deform the same amount?
If your skull deformation will be different then what causes the difference? Could it be from the ẟW done to your skull? And what determines the ẟW of the rock just before it hits you in the head? Could it be from the gravitational force acting on the rock through two different distances?
Have you even taken basic high school general science yet?
you still haven’t internalized that *MOVING* something requires the application of a force over a distance! And F x d is WORK! Moving a rock requires a ẟW component to be included in ΔU.
And now you are back to trying to equate ΔU to only ẟQ. PE is part of the ẟW component!
I’m *NOT* just making things up. You don’t even realize when you are using your ingrained memes! See above – you are speaking to THERMODYNAMIC properties and ignoring the ẟW component. Just as if
ΔU = ẟQ
instead of ΔU = ẟQ + ẟW
It’s a meme you can’t get out of your head!
PE and KE are *NOT* thermodynamic properties although they *can* affect temperature. ẟW is not a thermodynamic property although it too can affect temperature.
When you insist on speaking only of thermodynamic properties you are limiting ΔU to only being related to ẟQ.
And you don’t even realize you are doing it! Just like with the meme of “all measurement uncertainty is random, Gaussian, and cancels”.
Again, if I drop a rock from 10m on your head and then one from 100m which one will cause a bigger dent in your skull?
Will the difference be due to the ẟQ component of total internal energy or will it be due to the ẟW component?
Or do you think there is some kind of unseen component associated with the rocks that cause the difference in the size of the dents? Some unseen thing that exists outside of the rock? Maybe a little dragon that rides alongside the rock?
“The potential energy of the rock caused by raising it is part of the total energy of the system, but not its internal energy.”
No, the potential energy of the rock, in an isolated system, can be changed by rearranging the energy of the system between components in the system.
I asked you how the engine/radiator energy distribution works in the system known as an automobile.
You didn’t answer. You just repeat the same garbage assumption again!
As usual, you cherry picked something you simply don’t understand. More shite against the wall hoping some of it would stick.
“The microscopic forms of energy are those related to the molecular structure of a system and the degree of the molecular activity, and they are independent of outside reference frames. The sum of all the microscopic forms of energy is called the internal energy of a system and is denoted by U.”
There is nothing in this statement that says the molecular structure of the internal components of the system can’t change – e.g. it doesn’t say the rock can’t change its potential energy inside the system.
The statement “independent of OUTSIDE reference frames” does *NOT* say that the molecular structure can’t change based on the INTERNAL reference frame. I.e. the distribution of the internal energy of the system *can* be changed.
Here’s a definition for you:
“Potential energy from a force field is defined by the work required to move an object through a displacement”
Gravity can be a force field inside the system. Moving an object through a displacement inside the system therefore requires WORK to be expended. (F * d)
Thus ΔU = ẟQ + ẟW tells you that internal energy changes when you have a ẟW.
STOP CHERRY PICKING! Stop trying to lecture us on physical science when you know so little about it.
And F x d is a vector cross-product which means the work is a function of the path involved.
Thanks. I should have used the x instead of the *. The * only applies if the vector angle for both is the same. It’s not apparent this makes any sense to bellman.
And he doesn’t understand that potential energy can’t be defined if the “system” is only the mass by itself, it needs a position in the gravity field.
He is essentially claiming water behind a dam has no “potential energy”, which is absurd.
It’s the position that detrmines the distance in the F x d.
“No, the potential energy of the rock, in an isolated system, can be changed by rearranging the energy of the system between components in the system.”
The rock is the system. Internal energy is the molecular energy in that system. If you want to treat the entire earth as a single system, then it won’t matter what you do to the rick, the internal energy won’t change.
If you disagree, then provide some evidence, rather than just asserting you are right about everything and indulging in your usual insults.
“The rock is the system. Internal energy is the molecular energy in that system. If you want to treat the entire earth as a single system, then it won’t matter what you do to the rick, the internal energy won’t change.” (bolding mine, tpg)
Make up your mind. Is the rock the system or is the earth the system?
The internal energy of the SYSTEM won’t change from changes to the rock *IF* the change is just rearrangement of the internal energy that’s already inside the system.
If the rock is the system then the KE of the SYSTEM is related to it’s velocity which, in turn, is related to the force, mass and acceleration used to obtain that velocity, i.e. ẟW.
If the rock is a component in the system then it’s KE is *still* based on its velocity inside the system and the velocity of the system itself. *But*, ẟW can still apply to the rock itself, while not applying to the system, at least as long as the F component was generated from inside the system and not from an external source.
I’ll ask again. If you fly through the windshield of a car after a collision and hit a tree will you hit with more KE if the car is moving at 10mph than at 100mph. Or less? Or the same?
Does the velocity of the car (the system you are a component in) apply to your internal energy? Will the ΔU that you impart to the tree be greater at 10mph than at 100mph? Less? More?
“Make up your mind. Is the rock the system or is the earth the system?”
I did. The rock is the system. That’s what you mean if you are talking about the internal energy of the rock.
If you want to talk about the earth as the system you can, but then it’s a different system and the position of your rock is irrelevant.
“If the rock is the system then the KE of the SYSTEM is related to it’s velocity which, ”
But the point you keep ignoring is that the KE coming from the rocks motion is not part of it’s internal energy. Nor is it’s gravitational potential energy. The internal energy of the rock is the energy from the movement of atoms with on the rock and the bonds between the atoms. If you think moving a rock changes it’s internal energy you need to explain where that energy goes. How does it change the internal makeup of the rock? What impact would this change of internal energy have on the thermodynamic properties of the rock?
“I’ll ask again. ”
Try asking relevant questions if you want an answer, or better still try to explain your point with evidence rather than these endless riddles.
“will you hit with more KE if the car is moving at 10mph than at 100mph. Or less? Or the same?”
More, obviously.
Ek = mv²/2
Where v is velocity.
“Does the velocity of the car (the system you are a component in) apply to your internal energy?”
No. As I keep telling you. It doesn’t apply to your own internal energy, not to the internal energy of the car. You could see this by noting you don’t get hotter or change into a gas just by sitting in a fast car.
“Will the ΔU that you impart to the tree be greater at 10mph than at 100mph? Less? More?”
More. The fact you think that’s a telling question really indicates how little you have understood about thermodynamics. When you hit the tree you are doing work on it. The faster you travel the more work. The same with the tree’s impact on your body. Mostly I imagine through compression. Your internal energy will increase and you will get hotter.
Same if you slide along the ground. The work the road does in slowing you down is translated into work on your body, warming you up through friction.
None of this means your velocity is changing your internal energy. It’s when your surroundings impact you that your internal energy changes.
And what determines the internal energy of the rock?
The position of the rock inside the system is irrelevant? So the position of the rock inside the gravitational field that exists inside the system doesn’t have an impact on the PE of that rock in relation to other components in the system?
So the PE of a rock inside the earths gravitational field dropped on your head from 10m is irrelevant to one dropped from 100m? You said below in your answer that it *is* relevant. Which is it?
You are *still* confusing “E” with ΔU. When are you going to understand they are different?
You say below:
“More, obviously.”
How did it get to be more if the KE of the rock didn’t change from being accelerated by the force of gravity through a distance, i.e. ẟW = F x d? And ΔU = ẟQ + ẟW?
ẟW > at 10m than ẟW at 100m?
Where do you get the capability of doing more work at 100mph than at 10mph if it isn’t from the internal energy you have at 100mph compared to at 10mph?
And what happens to the tree?
Does your body do more work on the tree at 100mph than at 10mph? Where does the capability of doing that more work come from if it isn’t from the internal energy which was added by the ẟW getting you up to speed?
You should go talk to a law enforcement officer about what happens when a body impacts a tree at 100mph instead of at 10mph.
“The position of the rock inside the system is irrelevant?”
The rock is the system. It’s position within the system is always the same.
“You are *still* confusing “E” with ΔU. When are you going to understand they are different?”
I know they are different. That’s the whole point. Aside from the fact that one is the absolute energy and the other is the change in energy.
E = U + KE + KP.
E is not U. E includes the gravitational potential energy of the rock, U does not. The same if you use deltas.
ΔE = ΔU + ΔKE + ΔKP
The total energy can be changed by a change in KP without a change in internal energy.
“How did it get to be more if the KE of the rock didn’t change from being accelerated by the force of gravity through a distance,”
Have I mentioned that internal energy does not include the kinetic energy of an object falling? I thought I had mentioned it before, but if you didn’t notice – that is the point. A falling object increases its kinetic energy, not its internal energy.
“You should go talk to a law enforcement officer about what happens when a body impacts a tree at 100mph instead of at 10mph.”
I can understand why you keep using a 4-year old as your baseline for understanding.
Let’s be clear. Your internal energy is the same if you are flying through the air at 10mph or 100mph. When you hit the tree your internal energy will go up by more if you hit at 100 than at 10.
Hmmmm….
No answer yet. Hmmmm…..
You just can’t stop cherry picking can you?
“the system as a whole” means what to you?
Once again, you just absolutely refuse to read for meaning and context.
It is truly getting tiresome. Do you enjoy digging yourself deeper and deeper into a hole on everything you speak about?
I’m not wrong about anything we’ve discussed. You just keep making idiotic assertions about things you know nothing about and then can’t stand being corrected.
When I say that all you do is cherry pick it *IS* all that you do. You NEVER study any subject for meaning or context.
If you don’t like having that exposed then DON’T DO IT!
And you can’t even get this one right. Heat flows from the higher temperature to the lower temperature. But that is *NOT* the only definition of “warming”.
Entropy is a three component value. Temperature is only one of the components. It defines the slope of the entropy field in one direction only, temperature, Temperature only controls the direction of energy flow, it is not the complete definition of warming/cooling of the object being analyzed.
Volume/Pressure is one of the other components. You should have a clue by now as to what the third component is, IF you’ve bothered to read anything I’ve posted for meaning and context.
Warming and cooling is about INTERNAL ENERGY, ΔU, not just about ẟQ.
““the system as a whole” means what to you?”
For someone who pretends to be an expert you do ask a lot of dumb questions.
We are talking about the the internal energy of the rock. The rock is the system as a whole.
The rock is *NOT* the system as a whole. The internal energy in the rock can change without the internal energy in the system known as “earth” changing.
You can’t even get your frame of reference correct. The earth is a closed system (for all intents and purposes). Energy in and out but no mass exchange. The rock in your hand is an internal component of the closed system. Energy distribution inside the closed system can change and kinetic energy of the component inside the closed system does impact the internal energy of that component – with reference to the closed system.
“The rock is *NOT* the system as a whole. The internal energy in the rock can change without the internal energy in the system known as “earth” changing. ”
Then how is it’s energy internal? You really need to stop making up your own definitions and provide references.
Why not try asking your favourite ai chat bot
Here’s what I got from Googke when I asked “can you increase athr internal energy in a rock by raising it?”
Each component in a system has its own internal energy.
Take an isolated system, no energy or mass in or out, with multiple components. You can shift the total energy in the system around among the various components without changing the total system energy.
How do you think the internal energy shifts in an automotive system consisting of an engine burning fuel and its attached radiator?
Do you think the internal energy in each component is constant and unchanging?
I’m making up nothing. I’m trying to explain physical reality to you. And the explanation is just bouncing off your skull.
Well, Google is just wrong. This violates the thermodynamic formula of ΔU = ẟQ + ẟW
“W” is work. Work is applied to the rock when you raise it. Force * distance = work
I think what Google is trying to say is that ẟQ is not changed. But ẟQ alone is *NOT* internal energy. The temperature of the rock many not change, i.e. ẟQ, but ẟW certainly has!
Can *YOU* explain, in your own words, what ΔU = ẟQ + ẟW means in physical reality?
See that bolded term. Ask your AI what the SI units are for “gravitational potential energy”. I’ll bet it has something to do with mass (kg), acceleration of gravity (m/s²), and height (m). Funny how those come out to be Joules! Something like 1 joule = 1 kilogram·metre²/second² (kg·m²/s²)
Freshman physics!
Bellman doesn’t believe ΔU = ẟQ + ẟW.
According to bellman in his statistical world it’s
ΔU = ẟQ
internal energy only depends on temperature.
“Bellman doesn’t believe ΔU = ẟQ + ẟW.”
Stop lying.
tpg: “Bellman doesn’t believe ΔU = ẟQ + ẟW.”
Stop lying? Why do you say ΔU isn’t internal energy? And if it *is* internal energy then why doesn’t ẟW add to internal energy if ΔU = ẟQ + ẟW?
As usual you’ve found yourself in a cognitive dissonance trap.
bellman: ““The one that says thermodynamic science has refined cooling to mean Qout.””
bellman: “Moving a rock does not change it’s internal energy.”
bellman: “Your claim was that cooling was about a change in energy, not temperature. If you are now admitting it means a change in temperature rather than a change in energy, we are in agreement.”
You even believed Google when it told you that doing work on an object doesn’t change the internal energy! In other words ΔU = ẟQ and not ΔU = ẟQ + ẟW
I told you way upthread to stop digging, that the hole you were making was so deep you’d never get out. The sides of the hole are now collapsing in on you.
“Why do you say ΔU isn’t internal energy?”
It isn’t internal energy – it’s the change in internal energy.
“And if it *is* internal energy then why doesn’t ẟW add to internal energy if ΔU = ẟQ + ẟW?”
W does add, (or subtract) from internal energy – that’s what the equation is saying.
“bellman: ““The one that says thermodynamic science has refined cooling to mean Qout.”””
(Refined should be redefined.)
Because you are making a distinction between heat out, vs heat in. Q is net heat transfer, positive for heat flowing in, negative for heat out. Calling Qout alone cooling implies that it is cooling even if Q is positive.
“bellman: “Moving a rock does not change it’s internal energy.””
Yes. Correct. W is not added by changing the position of the rock.
“bellman: “Your claim was that cooling was about a change in energy, not temperature. If you are now admitting it means a change in temperature rather than a change in energy, we are in agreement.””
I said that in response to you saying ““Cooling is a PROCESS, not a temperature. ”. I was agreeing that cooling is not a temperature, but a change in temperature.
However, I do now accept that the act of cooling is sometimes defined by a reduction in internal energy, which can mean you can “cool” something without changing it’s temperature, by removing latent energy. E.g. dehumidifying a room.
“You even believed Google”
What makes you think I “believe” Google, let alone their AI chat bot. I used the AI just becasue you keep trying to insist it’s some sort of authority. At least in this case I didn’t spend any time training to get the answer I wanted.
“when it told you that doing work on an object doesn’t change the internal energy!”
But, yes in that case it seems to have got it right.
It is the change in INTERNAL ENERGY that defines if an object is cooling or warming.
You keep wanting to define cooling and warming of an object on THERMAL energy alone. ΔU = ẟQ.
But that is *NOT* the definition of cooling and warming! Cooling and warming depends on *all* contributions to internal energy, not just thermal contributions.
If ẟW causes a change in internal energy, then the temperature of that object can also change in response (but it doesn’t have to, see “isothermal).
ΔU = ẟQ + ẟW
is a functional relationship laying out *transfer* of energy. Temperature is a state variable. They are *NOT* the same thing!
NO! Not correct. I keep asking you to define what W is and you refuse. Changing the position of the rock requires applying force over a distance. Work = W = F x d, force over a distance.
How can you say that force applied over a distance is not work?
Have you ever heard the term “compression heating”? I doubt it. It’s obvious you have *no* idea how a diesel engine operates.
If ẟW doesn’t change ΔU then there *won’t* be a change in temperature. So what I said is correct. And if W = F x d then it defines ẟW.
So cooling is *NOT* just a change in temperature. ẟW *can* change ΔU without causing a change in temperature. It’s how melting and boiling of water works! An increase in internal energy with no change in temperature – ISOTHERMAL
Good, you’ve learned something after all.
Now the issue is “can you remember it for more than 24 hours?”.
*I* don’t use any AI as an authority unless I can check its output for reasonableness first. Preferably by confirming the math and physics claims in its outputs actually works.
“But, yes in that case it seems to have got it right.”
You couldn’t remember that you can change internal energy with no temperature change for even a few sentences, let alone 24 hours!
It did *NOT* get it right. U ≠ ΔU
What Google told you about was total energy U, not energy transfer ΔU.
This is EXACTLY what I meant when I said I check the output of an AI for reasonableness, especially confirming the math and physics.
*YOU* simply don’t know enough physical science to even discern what Google was telling you – which has nothing to do with energy transfer, i.e. cooling and warming!
Have you hit the bottom of the hole you are digging yet?
“It is the change in INTERNAL ENERGY that defines if an object is cooling or warming. ”
And what happens to the internal energy if Qin is greater than Qout?
“You keep wanting to define cooling and warming of an object on THERMAL energy alone. ΔU = ẟQ.”
Not worth reading in after that. If you can’t argue without lying about what I’m saying it’s obvious you have no serious evidence.
I’m not sure you even understand what you are lying about at this point. You seem to think that Q is kinetic energy and W is potential, but that’s not the case. Even Q can be latent heat, W can be sensible. The whole point of the equation is that ignoring latent energy, both heat and work can increase the temperature.
It isn’t a matter of solely Qin vs Qout. This is just more of your meme that internal energy is solely ẟQ. What happens if ẟQ is positive and ẟW is of equal magnitude but is negative?
your lack of reading comprehension skills is showing again!
How many time have I pointed out to you that ẟQ is thermodynamic energy and ẟW is not thermodynamic energy?
“If you can’t argue without lying about what I’m saying it’s obvious you have no serious evidence.”
You can’t even differentiate between thermodynamic energy and not-thermodynamic energy. What do you think I’m lying about when it comes to classifying what you are asserting?
NO! NO! You can’t even keep straight that temperature is not just thermodynamic heat!
ẟQ can change the temperature but not by adding thermodynamic heat (energy). Sensible *heat* is thermodynamic energy.
You are *still* confusing ẟQ and ẟW. To you it’s all ẟQ.
ẟQ is the transfer of thermodynamic *heat* energy. ẟW is the transfer of everything else!
You deny that you consider all measurement uncertainty is random, Gaussian, and cancels and then in the next sentence make an assertion that assumes just that.
You are doing the same thing here. You deny that you consider only ẟQ to be internal energy and then turn around and make an assertion that assumea exactly that!
“The whole point of the equation is that ignoring latent energy, both heat and work can increase the temperature.”
YES! But that means that work on an object changes its internal energy! How long will it take for you to turn around and deny that work on an object changes its internal energy?
How long will it take for you to deny that the KE of a system imparts KE to the components of the system? And that changing the KE of the system changes the internal energy of the components?
And here I thought bgx had some whacky ideas about energy … boy was I wrong.
“It isn’t a matter of solely Qin vs Qout. This is just more of your meme that internal energy is solely ẟQ. What happens if ẟQ is positive and ẟW is of equal magnitude but is negative?”
Stop dodging the question. You claim that !out means cooling, but then say it’s the change in internal energy that defines the word “cooling”. Without any work, if Qin is greater than Qout then internal energy increases, but by your first definition it’s still cooling. If there is work, just add that to the Q’s and it’s the same question.
Though as this discussion was about a planet emitting energy, I doubt if there is any work, unless we are hit by an asteroid.
“How many time have I pointed out to you that ẟQ is thermodynamic energy and ẟW is not thermodynamic energy?”
No idea. You write so much nonsense it’s easy to miss the few occasions you say something that’s correct.
“NO! NO! You can’t even keep straight that temperature is not just thermodynamic heat! ”
I didn’t say it was. Temperature is not thermodynamic heat at all.
“You deny that you consider all measurement uncertainty is random, Gaussian, and cancels and then in the next sentence make an assertion that assumes just that.”
OK, you are clearly using a random insult generator to write these comments as that nonsense has nothing to do with this discussion at all.
“You are doing the same thing here. You deny that you consider only ẟQ to be internal energy and then turn around and make an assertion that assumea exactly that!”
I’m not sure even you know what you are arguing at this point. It doesn’t seem to have anything to do with what I wrote.
Maybe this will help you understand
https://en.wikipedia.org/wiki/Latent_heat
“YES! But that means that work on an object changes its internal energy! How long will it take for you to turn around and deny that work on an object changes its internal energy?”
Not content about lying about what I’ve said, you now start lying about what you think I’m going to say in the future.
You still can’t accept that I am not in any way denying the importance of work done to or by a system. What I’m denying, with evidence, is that changing an object’s potential energy is doing work to the system.
Simply unfreakingbelievable. What does ẟQ and ẟW represent? What does ΔU represent? (hint: internal energy)
Heating and cooling are PROCESSES. There is no theory that the cooling process stops when the heating process begins. They can COEXIST. Until you can understand this concept (which a four year old can understand) you’ll *never* get thermodynamics right.
Again, does applying a match to the bottom of a metal rod stop the top of the rod from cooling?
if ẟQ = Qin – Qout does Q_out -> 0 when Qin > 0?
If Qout does *NOT* go to zero when Qin > 0 and Qout represents cooling, then what makes you think the cooling process stops?
There is all kinds of work going on inside the system known as earth. What makes you think there is no work? Anything that moves inside the gravitational field of the earth incurs a F x d work element. Rising air incurs a positive input of work to its internal energy. Falling air incurs a negative input of work to its internal energy.
The system known as earth only loses heat from the sun’s insolation via radiation to space. You and climate science claim that CO2 causes retained heat in the system by restricting radiation to space – meaning that over the millennia the earth should have continually reached higher and higher temperatures because of the retained heat till it became a molten rock once more.
But somehow that hasn’t happened. In fact, the earth has gone through glacial periods where it lost way more heat to space than it gained from the sun. An impossibility of CO2 generates retained heat in the system since heat-out would always be less than heat-in.
In other words you are admitting that you can’t read.
That is ABSOLUTELY what you initially asserted! That only ẟQ could affect temperature!
It absolutely does! bellman: “ Even Q can be latent heat, W can be sensible.”
ẟW is *NOT* sensible heat. Causing a temperature change does *NOT* mean that ẟW represents a transfer of sensible heat! Only ẟQ is a transfer of thermodynamic heat.
“The terms sensible heat and latent heat refer to energy transferred between a body and its surroundings, defined by the occurrence or non-occurrence of temperature change;” (bolding mine, tpg)
Once again, you show your cherry picking skills without *any* understanding of context or meaning.
The term “heat” refers to thermodynamic energy! ẟW is *NOT* thermodynamic energy!
You are right back to claiming that only ẟQ can change temperature! It’s exactly like I said. You have that meme so ingrained in your brain that you can’t get away from it. Just like your meme that all measurement uncertainty is random, Gaussian, and cancels.
What you are denying is the physics basic concept that work is F x d. And that ẟW doesn’t really exist because work can’t possible change ΔU. PE *is* generated from work, i.e.F x d, and work *is* part of the ΔU internal energy formula.
You can’t even admit that a rock dropped from 10m hits with less impact than one dropped from 100m because of the greater PE of the rock dropped from 100m. To you the internal energy of that rock at 10m altitude is exactly the same as the internal energy of the rock at 100m altitude.
Where the energy to cause that increased impact from the 100m rock is a mystery in your statistical world. It’s *magic*, right?
“What does ẟQ and ẟW represent? What does ΔU represent?”
You know there are plenty of books that will explain this for you.
ẟQ is a tiny net change in heat flow from or to the system.
ẟW is a tiny net change in work done to or by the system.
ΔU is the corresponding change in internal energy of the system.
Do you understand now?
“Heating and cooling are PROCESSES. There is no theory that the cooling process stops when the heating process begins.”
Provide a reference to your definition of cooling or else this discussion becomes pointless.
A brief reminder that this all started when you kept asserting that slower cooling did not mean warming.
“Again, does applying a match to the bottom of a metal rod stop the top of the rod from cooling?”
Moving the goal posts yet again. First it’s cooling means any emission of energy, then it’s cooling means a reduction in internal energy, now it’s cooling may happen in part of a body even as the rest of the body warms.
“if ẟQ = Qin – Qout does Q_out -> 0 when Qin > 0?”
No. Hope that helps.
“If Qout does *NOT* go to zero when Qin > 0 and Qout represents cooling, then what makes you think the cooling process stops?”
Produce a reference to your definition of “cooling process”. Then explain how your definition is relevant to the question of whether an object is warming or cooling.
“The system known as earth only loses heat from the sun’s insolation via radiation to space. You and climate science claim that CO2 causes retained heat in the system by restricting radiation to space – meaning that over the millennia the earth should have continually reached higher and higher temperatures because of the retained heat till it became a molten rock once more.”
A reminder that this whole discussion started with Tim pointing out that bodies radiate at T⁴. Yet somehow that logic stops whenever he tries to refute the greenhouse gas theory.
“In other words you are admitting that you can’t read.”
Reading comprehension fail. Can’t bothered to read every sentence of one of your hourly epic rants does not mean “can’t read”.
“That is ABSOLUTELY what you initially asserted! That only ẟQ could affect temperature!”
Why do you think it helps your case to just keep making stuff up? You know I never said any such thing. I’ve told you I don’t believe what claim I do. There’s no-one reading this apart from us two. Who are you trying to convince?
“It absolutely does! bellman: “ Even Q can be latent heat, W can be sensible.”
ẟW is *NOT* sensible heat. Causing a temperature change does *NOT* mean that ẟW represents a transfer of sensible heat! Only ẟQ is a transfer of thermodynamic heat.”
Read what I said. I did not say W was sensible heat, I said it was sensible. I meant that the effect of work on a system can result in a change in temperature, i.e. be sensible.
“You are right back to claiming that only ẟQ can change temperature!”
Literally the opposite of what I’m claiming. “W can be sensible” i.e. it can change the temperature.
“Just like your meme that all measurement uncertainty is random, Gaussian, and cancels.”
You worry about memes, then repeat nonsense like this at every occasion regardless of relevance. It’s like some strange metal tick.
“What you are denying is the physics basic concept that work is F x d.”
Really astonishing that you feel the need to lie immediately after you’ve just quoted what I actually said. I’ll repeat it very slowly so you might understand – work involving raising a system is not work done to the system. That is not denying what work is, just that in this case it is irrelevant to a change in internal energy. Do you get it yet, or do I have to write it in bold capital letters?
“And that ẟW doesn’t really exist because work can’t possible change ΔU.”
There are times when it’s so difficult to judge whether you are just trolling or are genuinely senile.
“You can’t even admit that a rock dropped from 10m hits with less impact than one dropped from 100m because of the greater PE of the rock dropped from 100m.”
I literally told you that it hits with more impact. What I said was that this is not down to the internal energy in the rock.
“To you the internal energy of that rock at 10m altitude is exactly the same as the internal energy of the rock at 100m altitude.”
Yes. Finally a glimmer of understanding.
“Where the energy to cause that increased impact from the 100m rock is a mystery in your statistical world. It’s *magic*, right?”
There’s that mental tick again. This is nothing to do with statistics, it’s just basic physics. The kinetic energy of the falling rock comes from acceleration due to gravity. This is transformed from the potential energy caused by raising the rock – not from the internal energy of the rock.
Yes potential energy is measured in joules, just as all types of energy is. Yes raising an object increased it’s potential energy. The question we are debating is if that potential energy is counted part of the rock’s internal energy, that is is raising the rock counted as work do to the system..
I say it isn’t based on a few references explicitly saying it isn’t and also because it wouldn’t make sense with regard to why you want to talk about internal energy.
Potential energy is Force multiplied by distance. I asked you already what (F * d) is.
I haven’t seen you answer yet.
Tell us how (F · d) relates to
ΔU= ẟQ + ẟW
You still can’t admit that ΔU= ẟQ is an incorrect functional relationship nor can you admit that ΔU is INTERNAL ENERGY.
If you don’t consider the entire functional relationship, ΔU= ẟQ + ẟW, then you have no way to define an isothermal process. But then you don’t really care, do you? ẟW doesn’t exist in your statistical world.
“Tell us how (F · d) relates to ”
It doesn’t unless it’s work done to the system.
“You still can’t admit that ΔU= ẟQ is an incorrect functional”
It’s an incorrect functional relationship. The correct relationship is
ΔU= Q – W, or variations of such.
“nor can you admit that ΔU is INTERNAL ENERGY.”
It isn’t. It’s a change in internal energy, i.e. U.
“If you don’t consider the entire functional relationship, ΔU= ẟQ + ẟW”
I do.
Do you understand what W is? It’s work done to or by the system. Lifting up a stone is not doing work to the system. If it were you would be making the rock hotter or increasing the internal latent energy. Unless you can show that lifting the rock changes it’s molecular structure, you are not doing work on it.
“It doesn’t unless it’s work done to the system.”
Really? Nice try at a dodge!
I said: “Tell us how (F · d) relates to
ΔU= ẟQ + ẟW”
As usual, you cherry pick out of context and meaning!
“I do.
Do you understand what W is? It’s work done to or by the system. Lifting up a stone is not doing work to the system.” (bolding mine, tpg)
You are dissembling! ẟW is work done to a COMPONENT of a system, not to the system itself.
I hate doing this but one more time. How does a diesel engine work?
The diesel engine is a SYSTEM. That system contains components like the liquid fuel, the piston, the connecting rods, the crankshaft, etc.
Now as the component known as the piston moves (“d”) it compresses (“F) the component known as the fuel (the rock). That compression causes the fuel to heat till it burns. As it burns the fuel expands (“F) thus pushing the piston down (“d).
The kinetic energy (a vector) of the piston has changed sign from positive (up) to negative (down) due to the force (F) applied over a distance (“d”).
The internal energy of that piston has changed (which should be obvious). It *is* kinetic energy because it is related to movement, KE = (1/2) mv^2 where “v” is a vector. But it is ALSO a change in the internal energy of that piston. ΔU = ẟQ + ẟW
*ALL* of the components in that system known as the engine undergo changes in internal energy as energy is transferred around from one component to another. But E, the total energy *state* of the system, i.e. the engine, hasn’t changed.
(this is a very high level overview, there are all kinds of other things happening like friction, heat loss through the block, etc but the basics are pretty obvious)
You keep throwing shite against the wall hoping something will stick. It won’t. You can dissemble, change the subject, refuse to do the math, ignore the definition of a state variable vs a process variable, etc .. all you want; it won’t help.
Warming and cooling is defined by the change in internal energy, not solely by the change in temperature which is what you keep trying to assert. And work *is* force applied over a distance and is a component that can change internal energy.
You can flip and flop but it won’t change the facts, the math, or the physics.
“Unless you can show that lifting the rock changes it’s molecular structure, you are not doing work on it.”
Does compressing the fuel in a diesel engine change its molecular structure? Why is compressing a liquid any different than compressing a solid? When you lay down on the mattress on your bed does it deform from the downforce applied by your body? When you hit a baseball with a bat does the baseball deform from the force applied to it by the bat? What if you hit a rock instead of a baseball with the bat?
All you are doing here is whining. Because you can’t *see* any change then the change must not have happened. Whacking a baseball with a bat doesn’t change the internal energy of the baseball because you can’t *see” anything happen to the baseball!
“Really?”
Yes. Really.
“You are dissembling! ẟW is work done to a COMPONENT of a system, not to the system itself.”
It seems your entire problem is not understanding what system means in thermodynamics.
…
…
Thermodynamics – an Engineering Approach
Yunus A. Cengel, Michael A. Boles, Mehmet Kanoglu
The point is that work and heat are only considered as the transfer of energy through a boundary from the system to the surroundings or vice versa.
“The diesel engine is a SYSTEM.”
You can treat it as one – yes.
“The internal energy of that piston has changed…“
But now you’ve switched to treating the piston as a system.
“*ALL* of the components in that system known as the engine undergo changes in internal energy as energy is transferred around from one component to another.”
But as far as the internal energy of the engine treated as a system, the only heat and work transfer is through its boundary.
“Warming and cooling is defined by the change in internal energy, not solely by the change in temperature which is what you keep trying to assert.”
No. What I tried to assert is that cooling does not mean any radiation of energy. It’s a net change in energy. Your logic was that an object can be cooling even as its internal energy increases.
“And work *is* force applied over a distance and is a component that can change internal energy.”
Only if it crosses the boundary between the system and it’s surroundings. If you think lifting an object amounts to work done to the system, you need to explain where the internal energy increase goes. Either it’s kinetic energy or latent energy. If it’s the first than the object will be hotter, and if it’s the latter there has to be some change in the atomic structure of the rock – e.g. some melting or evaporation.
“Does compressing the fuel in a diesel engine change its molecular structure?”
Yes. It increases the pressure and temperature.
“Why is compressing a liquid any different than compressing a solid?”
Because solids are more solid.
The answer to all the rest of your questions is yes. Hitting anything is an example of work om a system – it will usually result in an increase in temperature.
“Whacking a baseball with a bat doesn’t change the internal energy of the baseball because you can’t *see” anything happen to the baseball!”
That’s insane. Why would you think hitting a baseball will not change it’s internal energy?
“No. What I tried to assert is that cooling does not mean any radiation of energy. It’s a net change in energy. Your logic was that an object can be cooling even as its internal energy increases.”
Cooling is energy loss. Energy loss is a separate transfer process than energy gain. You can heat one side of a metal rod with a match while the other side is free to conduct and radiate heat energy to the surroundings. Both heating and cooling processes happening AT THE SAME TIME!
The metal rod will only increase temperature if the energy input from the match is greater than the energy loss due to conduction and radiation loss.
This is such a simple concept that a four year old can learn it. Why can’t you?
“Only if it crosses the boundary between the system and it’s surroundings.”
NO! NO! NO! Work done on one component of a system by a second component of the system does *NOT* cross the boundary of the system. BUT THERE IS STILL WORK BEING DONE! It just happens INSIDE the system! And the internal energy of each of the components changes! One loses internal energy and the other gains internal energy!
YOU STILL CAN’T READ FOR MEANING OR CONTEXT!
Lifting an object inside a system done by a different object (or field) inside the system does *NOT* change the system internal energy. But work on the lifted object is still being done and it changes the internal energy of that component! One component loses internal energy and the other gains it. It is a RECONFIGUATION of the system internal energy. The system internal energy doesn’t change.
You *still* haven’t internalized the concept of a “system” and its boundaries – even after having quoted a textbook on the subject!
It’s a result of you continually cherry picking shite to throw against the wall!
Why can you *never* explain how the piston in an engine is forced downward? A four year old can figure out that *something* is pushing on it thus exerting a force over a distance. It’s no different than pushing on a tricycle pedal to make the tricycle move. If the system is defined as being the rider and the conveyance, then it becomes nothing more than a rearrangement of the system internal energy! The rider loses internal energy and the tricycle gains internal energy. Just like the piston in a engine.
It’s only if someone like an adult PUSHES on the back of the child to help the system move that work is done that crosses the system boundary of the rider and the conveyance! But that does *NOT* need to happen in order to reconfigure the internal energy already existing in the system.
And some solids are more solid than other solids, right?
This is the kind of idiotic assertion I’ve come to expect from you!
ROFL! And where is that energy transfer accounted for in the formula ΔU = ẟQ + ẟW?
And what does word “usually” mean? Does that mean that it can also happen isothermally? I.e. NO temperature change?
Man, your inability to read is just amazing! Let alone your ability to quote out of context and meaning.
I said: “All you are doing here is whining. Because you can’t *see* any change then the change must not have happened. Whacking a baseball with a bat doesn’t change the internal energy of the baseball because you can’t *see” anything happen to the baseball!”
The operative word here is in the first sentence, “you”. meaning bellman!
I was repeating back to you what you keep trying to assert! If you can’t *see* the molecular change then it doesn’t exist! You said there is no molecular change “Because solids are more solid.”
If the molecular structure is not changed when hitting a solid like a baseball or a rock “because solids are more solid”, then what changes the internal energy of the object being hit?
“Cooling is energy loss. Energy loss is a separate transfer process than energy gain.”
You really can’t have this both ways. If you assert that cooling means a reduction in a systems internal energy, then obviously a system that is receiving more energy than it is losing, is not cooling.
“NO! NO! NO! Work done on one component of a system by a second component of the system does *NOT* cross the boundary of the system. BUT THERE IS STILL WORK BEING DONE!”
You still haven’t tried to understand what “system” means in thermodynamics.
“Lifting an object inside a system done by a different object (or field) inside the system does *NOT* change the system internal energy. But work on the lifted object is still being done and it changes the internal energy of that component!”
Again, you need to understand what a system is. Internal energy is the internal energy of a system. If you are talking about the internal energy of a rock that is the system.
“And some solids are more solid than other solids, right?
This is the kind of idiotic assertion I’ve come to expect from you!”
Reading comprehension fail. You asked “Why is compressing a liquid any different than compressing a solid?”, and I sarcastically replied because it’s more solid. That is a solid is more solid than a liquid.
“ROFL! And where is that energy transfer accounted for in the formula ΔU = ẟQ + ẟW?”
ẟW.
“And what does word “usually” mean? Does that mean that it can also happen isothermally? I.e. NO temperature change?”
It comes from a lifetime of hearing your nitpicking style of argument. It comes from not wanting to go through every possibility in case you come back with a “well acktually”.
And becasue work done to a system can change state, so maybe it’s possible to hit something and not raise it’s temperature by too much. Hitting a lump of ice may resulting in melting the ice rather than raising it’s temperature.
“Man, your inability to read is just amazing! Let alone your ability to quote out of context and meaning.”
And your ability to detect sarcasm is as strong as ever.
“You said there is no molecular change “Because solids are more solid.””
Oh look, another lie.
“If the molecular structure is not changed when hitting a solid like a baseball or a rock “because solids are more solid”, then what changes the internal energy of the object being hit?”
I’m sure there are resources that would help you understand this better than I can.
But for a start the molecular structure will change. A ball may be mostly solid, but there is a lot of air in it, and they are designed to compress when hit. If you tried to hit a rock with a bat it would hurt becasue all the kinetic energy has to go straight into the bat. But with a baseball as soon as it hits the bat it starts to compress which means some of the kinetic energy becomes work done to the ball, increasing it’s internal energy. Much of this is then released as the ball rebounds to it’s original state, resulting in work done by the ball, which presumably gets added to the kinetic energy of the ball traveling in the opposite direction.
Here’s a video showing how much a ball can compress when hit.
https://youtu.be/uxlIdMoAwbY?si=niLVfaQbqAj5Wwef&t=70
So what is your point?
I’ve already told you this multiple times.
And you *still* don’t understand even the basics!
Take this that you posted: “Heat and work are energy transfer mechanisms between a system and its surroundings, and there are many similarities between them:
Both are recognized at the boundaries of a system as they cross the boundaries. That is, both heat and work are boundary phenomena.”
Do you have ANY idea of what this means?
And what energy or work is passed through the boundary of the system known as the engine when the piston has work transferred to it from the burning fuel?
Take this part of your excerpt: “A system is defined as a quantity of matter or a region in space chosen for study.”
The engine is a quantity of matter or a region in space chosen for study. That region of space includes all kinds of components, the engine block, the pistons, the crankshaft, the fuel, and on and on and on.
tpg: ““The internal energy of that piston has changed…“
NO! NO! NO! The piston is a COMPONENT in the system known as the engine. System energy can be reconfigured inside a system without the system boundary being involved! That’s true of an open system, a closed system, or an isolated system.
That means that components in the system can have their internal energy changed by reconfiguration alone. The internal energy of the piston can be changed inside the system known as the engine with no energy crossing the border of the system known as the engine!
Again, SO WHAT? The piston is *INSIDE* the system boundary! No heat or work has to cross the boundary of the engine in order to increase the internal energy of the piston. All that is needed is a transfer of work from the burning fuel (which is inside the system) to the piston (which is inside the system) – and it all happens inside the system boundary!
OMG! I cannot believe how dense you are. The only way to increase the SYSTEM internal energy is for work or heat to cross the boundary of the system which is defined as the engine. But reconfiguring the system internal energy among the components in the system does *NOT* require a change in the SYSTEM internal energy!
Just how in Pete’s name do you think the piston is forced downward if some work is not done on it? And where does the energy come from that is used to exert that force? The fuel loses internal energy and the piston gains internal energy. BUT THE SYSTEM INTERNAL ENERGY REMAINS CONSTANT! The system energy is just reconfigured by one component doing work on a different component!
You have failed your course on thermodynamics. You’ll get to repeat it next semester. Hopefully by then you’ll have learned how to read for context and meaning (but I’m not going to hold my breath waiting for it to happen).
“The only way to increase the SYSTEM internal energy is for work or heat to cross the boundary of the system which is defined as the engine. But reconfiguring the system internal energy among the components in the system does *NOT* require a change in the SYSTEM internal energy!”
Has anybody said any different. As always you seem to be violently arguing about something we both agree on. None of this has anything to do with raising a rock increases its internal energy.
“Has anybody said any different. As always you seem to be violently arguing about something we both agree on.”
*YOU* keep saying that the internal energy can’t change from work being done it – e.g. rasising a stone in a gravitational field isn’t work and doesn’t contribute to the internal energy of the stone. Even if the work done is by a separate component in the same system!
“*YOU* keep saying that the internal energy can’t change from work being done it ”
You are either incapable of understanding my argument or deliberately lying in. I can’t help you any further.
“I don’t. You are the one claiming that it increases it’s internal energy – hence warms it.”
You still don’t understand the term “isothermal”, do you?
NO! NO! NO!
Raising the rock is counted in the internal energy of the ROCK. If the rock is the system then the internal energy of the system is raised. If the rock is a component in a system then raising its internal energy is redistribution of the energy of the system.
“I say it isn’t based on a few references explicitly saying it isn’t and also because it wouldn’t make sense with regard to why you want to talk about internal energy.”
You simply don’t understand what those few references are telling you. You *never* read for meaning and context.
All you have to do is answer the simple question of whether a rock dropped on your head from 10m hits you with more energy than the same rock dropped from 100m.
You have said the 100m high stone would hit you harder but have NEVER identified exactly where that extra energy that causes a harder hit comes from – you just keep claiming that it can’t be from the internal energy of the rock!
That extra energy must just be tagging along, attached to the rock like an invisible dragon. And that extra energy must have a mass all of its own somehow.
You can never provide the math for anything. You can never provide the actual physics for anything.
It all boils down to your inability to differentiate between a state variable and a process variable. “E” is a state variable. ΔU is a process variable.
“NO! NO! NO!
Raising the rock is counted in the internal energy of the ROCK”
You say No, then confirm what I said. If raising a rock adds to the internal energy of the rock it must be through thermal energy or work. And as it obviously isn’t thermal energy than you must think it’s doing work to the rock.
“You simply don’t understand what those few references are telling you.”
Ah, the old “you have to read them in the Gorman way to understand the true meaning” excuse. Sorry, I can only go by the words used, and the internal logic. You have to consider the possibility that you have simply misunderstood something (Sarcasm – I know you can’t do that.)
“All you have to do is answer the simple question of whether a rock dropped on your head from 10m hits you with more energy than the same rock dropped from 100m.”
Why? Do you think the problem with a rock falling on your head is to do with how much internal energy it has?
“You have said the 100m high stone would hit you harder but have NEVER identified exactly where that extra energy that causes a harder hit comes from”
I think you are hallucinating again. I’ve never said anything about a rock falling on your head. Maybe you are getting confused with your question about flying through a window screen.
Regardless, the extra energy comes from acceleration due to gravity, nothing to do with how warm the rock is.
“That extra energy must just be tagging along, attached to the rock like an invisible dragon.”
If that’s how you want to think about it that’s OK – but it’s really just part of the total energy of the rock. Remember – total energy of the system is internal energy plus kinetic and potential energy.
“It all boils down to your inability to differentiate between a state variable and a process variable. “E” is a state variable. ΔU is a process variable.”
And ΔE is a process and U is a state variable. What is your point.
Here’s what Thermodynamics an Engineering Approach says.
If you think internal energy includes all kinetic and potential energy, why do you think all the sources make this distinction?
“ If raising a rock adds to the internal energy of the rock it must be through thermal energy or work”
Judas H. Priest! Work is F x d! The typical example for PE is moving an object AGAINST the gravitational force through a distance! F = gravitational force. d = distance moved.
IT IS WORK! From Britannica: “To express this concept mathematically, the work W is equal to the force f times the distance d, or W = fd.”
If you can’t even get this most basic physics definition straight then you have *NO* chance of understanding ΔU = ẟQ + ẟW.
Simply unfreakingbelievable. You can’t even get it into your head that the 100m rock hits with more force because it absorbed more ẟW on its way to your head! ẟW = F x d! “d” for the 100m rock is greater than it is for the 10m rock!
Both the 100m and the 10m rock are converting PE to KE as they fall. That KE doesn’t just appear by magic although apparently you think that it does!
“Judas H. Priest!”
If it helps, just keep repeating to yourself “internal energy is not total energy” until it sinks in.
What does “internal energy is not total energy” have to do with the work done in raising a stone to 100m vs 10m?
It’s a non sequitur. You simply don’t know what you are talking about.
It means that the kinetic energy that hurts you when the rock falls on your head is not part of the internal energy of the rock.
“Regardless, the extra energy comes from acceleration due to gravity, nothing to do with how warm the rock is.”
you are *still* caught in the meme that ΔU = ẟQ.
What makes you think that a rock at 100m altitude changed its temperature by being lifted?
And here we are again with you mixing up a state variable with a process variable.
E IS NOT ΔU!
When are you *EVER* going to get that straight?
Again, you are confusing a SYSTEM with the internals of the system. Does the phrase “the change in the total energy of a system during a process is the sum of the changes in its internal, kinetic, and potential energies and can be expressed as” mean nothing to you?
You *still* can’t read for meaning and context!
What changes the internal energy of a SYSTEM?
“What makes you think that a rock at 100m altitude changed its temperature by being lifted?”
I don’t. You are the one claiming that it increases it’s internal energy – hence warms it. You are the one who wants to use the definition of warming and cooling being a change in internal energy, rather than just temperature.
“E IS NOT ΔU!”
You don’t say!
I certainly haven’t said that, so why mention it? Just try to focus on the fact that total energy is internal energy plus kinetic energy plus potential energy.
E = U + KE + KP
and
ΔE = ΔU + ΔKE + ΔKP
https://pressbooks.online.ucf.edu/thermorit/chapter/internal-and-total-energy/
“Does the phrase “the change in the total energy of a system during a process is the sum of the changes in its internal, kinetic, and potential energies and can be expressed as” mean nothing to you?”
Yes. It means exactly what it says. And demonstrates that internal energy and potential energy are two distinct parts of total energy.
“What changes the internal energy of a SYSTEM?”
Heat and work crossing the boundary of that system.
“I don’t. You are the one claiming that it increases it’s internal energy – hence warms it.”
And now you are back to ΔU =ẟQ instead of ΔU =ẟQ + ẟW
My guess is that you are never going to figure it out.
It’s just not worth arguing unless you at least acknowledge what I’m saying.
You simply refuse to accept that I’m talking about internal energy, not total energy.
“I don’t. You are the one claiming that it increases it’s internal energy – hence warms it.”
Still don’t understand the term “isothermal”, do you?
Do you understand what non-sequitur means?
Do you claim that lifting a rock above your head increases its internal energy?
Do you agree that warming can be defined as an increase in thermal energy?
Do you accept that your claim amounts to saying that raising a rock above your head warms it?
Do you accept that that when asked “What makes you think that a rock at 100m altitude changed its temperature by being lifted?”, I replied “I don’t”. Hence, I was saying you believed it was an isothermal process?
“The rock is *NOT* the system as a whole.”
It is if you are talking about the internal energy of the rock.
https://physicsfundamentals.org/blog/thermal-energy
This should be easy to understand, even for an expert in thermodynamics.
If you think the raising a rock above your head can increase its latent heat, would you also think that putting it in a fast car increased its sensible heat? Have you ever seen a rock warm up just because its moving faster?
“Internal energy (U)”
Internal energy “U” is not ΔU.
When you put that rock, with its internal energy, in the fast car did the total energy in the system defined by the car change?
If you drop that rock on the seat does the PE in the rock deform the seat, i.e. a transfer of energy?
You can’t seem to differentiate between the total energy OF A SYSTEM and the energy of the components inside that system.
Think of it this way, you are a passenger in the car with no seat belt. The car hits an immoveable object at 10mph and you fly through the windshield and hit the immovable object.
Will you hit that immoveable object with more, the same, or less kinetic energy if the car is moving at 100 mph and you go through the windshield?
What if it was the rock that you put in the car that flies through the windshield instead of you?
“Internal energy “U” is not ΔU.”
That’s why it said U, not ΔU.
“When you put that rock, with its internal energy, in the fast car did the total energy in the system defined by the car change?”
I was talking about the internal energy of the rock, not the car.
Did the internal energy of the rock change since its velocity changed from zero to the velocity of the car?
If the internal energy of the rock changed then did the internal energy of the system known as the “car” change also?
You’ve moved into the realm of mass transfer now. You don’t know any more about it than any other physical science.
Hint: the system changed from a closed system where only energy can be interchanged with the surroundings to an open system where both mass and energy can be interchanged with the system.
Does the transfer of mass into an open system change the internal energy of that open system?
hint: E = mc^2
How many more of these mindless questions are you going to ask? None of them will change the references I’ve given you explaining that the kinetic and potential energy of a system are not counted as its internal energy. If you have a version of thermodynamics that does include them you need to give your own reference.
Even if we accept your version – so what? This argument is so pointless becasue it has nothing to do with any real world analysis. So you think raising a rock or moving it increases its internal energy, and so can be said to warm it, what possible real world effect does that have? It’s not raising it’s temperature, and it’s not changing it’s state, so in what real world sense is it warming?
Anyway – for hopefully the last time.
“Did the internal energy of the rock change since its velocity changed from zero to the velocity of the car?”
No. What do you think I’ve been trying to explain to you for the last couple of days.
“If the internal energy of the rock changed then did the internal energy of the system known as the “car” change also?”
That’s more complicated. There are a number of ways the internal energy of the car might change – air friction, and air moving through the car for a start.
“You’ve moved into the realm of mass transfer now.”
Yes, as I said air moving through the car.
“You don’t know any more about it than any other physical science.”
The expected argument to the man. Just stick to the evidence.
“Hint: the system changed from a closed system where only energy can be interchanged with the surroundings to an open system where both mass and energy can be interchanged with the system.”
Yes, as I keep saying.
“Does the transfer of mass into an open system change the internal energy of that open system?”
Yes, obviously.
“hint: E = mc^2”
In what way is that a hint? Does this a nuclear powered car?
As far as I can tell nuclear energy is usually ignored in internal energy, as it’s not usually relevant.
Hmmmm…..
No answer yet. Hmmmm…..
And yet you can’t list them out – in context with their meaning – can you?
Why do you continue to use the words “cooling” and “warming”? That just highlights your total lack of knowledge of thermodynamics. Several of us have tried to explain the basics to you and you just refuse to learn! Yet you just continue to use temperature as your measure of whether something is gaining energy or losing energy.
All you have to do is take even a couple of minutes to examine the equation ΔU = Q + W. For example, what dimension applies to each of these? Is it degrees of temperature?
Does the temperature of a sample of water vapor tell you if it is gaining energy or losing energy? If it’s temperature didn’t change does that mean that no thermodynamic process occurred either?
This is why you’ll never understand thermodynamics. It’s *NOT* all about temperature! You’ve been given multiple examples. And just ignored all of them.
You can’t even use the words correctly. There is no such thing as “sensible cooling” or “latent cooling”. There is sensible HEAT with a dimension of Joules and latent HEAT with a dimension of Joules. Joules is ENERGY, not temperature. Sensible heat and latent heat are not measured in degrees!
So how can you be correct in your definitions when you can’t even get the dimensions of what you are lecturing us all about correct?
“And yet you can’t list them out – in context with their meaning – can you?”
I listed them out in the comment you are replying to. If you need more context you only have to ask.
“Why do you continue to use the words “cooling” and “warming”?”
I’m using the words you used. You were the one who kept insisting that everything above 0K is cooling all the time. I think the ambiguity in the words may be causing some of these misunderstandings. Maybe I should just say get colder, and get hotter in future.
“Yet you just continue to use temperature as your measure of whether something is gaining energy or losing energy. ”
Weary sigh. No. As I keep having to explain to you every time you spit that nonsense, I use temperature as a measure of whether something is getting hotter or colder.
“This is why you’ll never understand thermodynamics. It’s *NOT* all about temperature!”
And now you are just deflecting. The comment you are responding to is about you claim that cutting a stone in half makes it cooler.
“There is no such thing as “sensible cooling” or “latent cooling”.”
I apologized for agreeing with you on something. You’ve been banging on about cooling and warming being about internal energy rather than temperature, and then I did find some discussions saying just that and using the terms sensible and latent cooling. So I though you might have a point there. But I was going to suggest that the term mainly seems to be used by the HVAC industry, as a fancy way of describing dehumidifiers.
If you agree that it’s not a term used in thermodynamics, we can get back to trying to get you to actually provide evidence that the term cooling is used to describe internal energy rather than reducing temperature.
Still, here are a few references to latent cooling, whether it exists or not.
https://blog.priceindustries.com/what-are-sensible-and-latent-heat
https://electronics.alibaba.com/buyingguides/latent-cooling-guide-for-data-centers-electronics
https://www.sciencedirect.com/science/article/abs/pii/S0196890422001765
“I listed them out in the comment you are replying to. If you need more context you only have to ask.”
You mean something like providing this definition? ROFL!!!
“Something that is cool has a temperature which is low but not very low.”
Here is what thermal-engineering.org says:
——————————–
An isothermal process is a thermodynamic process, in which the temperature of the system remains constant
———————————
And it says a thermodynamic process is
——————————
A thermodynamic process is defined as a change from one equilibrium macrostate to another macrostate. The initial and final states are the defining elements of the process.
—————————-
Your definition makes the same mistake you keep making – a reliance on TEMPERATURE alone as defining thermodynamic states.
You simply refuse to learn.
As in losing heat! Not as in “cooling” being defined as temperature! Where does temperature appear on the words “cooling all the time”?
Why do you simply refuse to accept the definition of “isothermal”? Losing heat does *NOT* mean the temperature always changes. Gaining heat does *NOT* mean the temperature always changes. Yet HEAT (energy) does change!
Yes, gaining heat *can* involve the temperature changing. Yes, losing heat *can* involve the temperature changing. But trying to say that gaining heat *always* involves the temperature going up or that losing heat always involves the temperature going down is simply not correct in physical reality.
But then you don’t live in physical reality, you live in statistical world.
“You mean something like providing this definition? ROFL!!!”
No. Try reading for comprehension. You claimed I hadn’t listed your various claims about what the word cooling means. That was a lie, as I had listed them and you even responded to them.
The thing you are manically laughing at was in response to your question saying you didn’t where I came up with tevidra that the word cool denotes temperature. I just pointed to a common dictionary definition.
Understand?
“Here is what thermal-engineering.org says:”
And neither of your quotes mention the word cool or cooling.
“Your definition makes the same mistake you keep making – a reliance on TEMPERATURE alone as defining thermodynamic states.”
Do you really never use the word cool to describe temperature or a change in temperature? Do you get into long arguments every time so eone says the weather’s a bit on the cool side today? And you accuse me of nitpicking when I mention the difference between the correct meaning of exponential Vs the way it’s often misused.
“Where does temperature appear on the words “cooling all the time”? ”
It doesn’t. That was my point. You claimed that thermodynamic scientists defined cooling as emitting energy and therefore everything was cooling all the time even if it’s getting hotter.
“Why do you simply refuse to accept the definition of “isothermal”?’
Nobody has mentioned isothermal up to this pint. We were talking about your use of the word cooling.
“But trying to say that gaining heat *always* involves the temperature going up or that losing heat always involves the temperature going down is simply not correct in physical reality.”
You keep arguing about things I’m not saying. All I’ve said is that if something’s temperature rises, it’s called warming not cooling. That’s certainly the case on the everyday sense, and as far as I can tell usually the case in science.
You so far have yet to produce any reference to the word cooling being applied to an object that is getting hotter.
“But then you don’t live in physical reality, you live in statistical world.”
Do you realise how insane this sounds. You are the one trying to argue that people’s every day sense of cooling is wrong. You are the one trying to argue that due to your blackboard scientific definition an object that is getting hotter is actually cooling.
Common dictionary definitions refer to “common usage”. Common usage is very often *not* a good description of the physical reality. In common usage he sky is often defined as being “blue”. It isn’t.
I KNOW! That’s the whole point!
No. My wife like the house temp to be around 68F. I like it to be more like 74F. Which one is cool? Which one is hot?
I can say “I *feel* cool” but that has nothing to do with “cool” defining the temperature let alone the energy existing in the atmosphere of the house or even the outside environment!
“Heat and Mass Transfer” has NUMEROUS examples concerning the environment. You’ve never bothered to read any of them have you? Let alone work out the examples.
“That was my point. You claimed that thermodynamic scientists defined cooling as emitting energy and therefore everything was cooling all the time even if it’s getting hotter.”
Heat transfer involves conduction, convection, and radiation. The proper terminology would be “transferring energy”. You just never learn, do you?
Again ΔU = Qin – Qout + Win – Wout
Qout and Wout don’t stop when Qin and Win are greater than zero. Since Qout is COOLING, cooling never stops! If it did the equation would be
ΔU = Qin + Win.
No Qout or Wout.
DO THE MATH!
What in Pete’s name did you think my example of compressing something, i.e. Win, with no temperature change was all about? That’s called an ISOTHERMAL process!
Just because *YOU* don’t understand the subject that doesn’t mean others don’t.
It means Qin > Qout. BOTH WARMING AND COOLING!
Qout doesn’t go away just because Qin > Qout!
Which is meaningless. In the everyday sense many people think the grass being wet in the morning is because it rained. Dew = Rain.
ΔU = Qin – Qout + Win + Wout
In “Heat and Mass Transfer”, Ed 6, it is stated
Qin – Qout + Egen = ΔE (1-13)
where Egen are things like mechanical and electrical energy being converted into thermal energy.
What does the term Qout mean to you? Is that a “warming” term indicating an increase in energy and thus an increase in temperature?
I said: ““Yet you just continue to use temperature as your measure of whether something is gaining energy or losing energy. ””
How does your “measure” allow for isothermal thermodynamic processes?
I’ll repeat, your dependence on Temperature, to the exclusion of everything else, doesn’t allow for the existence of the equation ΔU = Q + W. It only allows for ΔU = Q.
There is a reason why you never show the math behind any of your assertions. Either you don’t know the functional relationships to start with or you know the functional relationships don’t jive with your assertions.
You *STILL* don’t understand what an intensive property is. It’s no wonder you think an average of the intensive property values of different things is physically meaningful!
Cutting a rock in half doesn’t change the value of the intensive property of the rock known as *temperature*. Both pieces still have the same value of the intensive property known as “temperature”.
What happens is that the amount of heat (energy) in your hand goes down! With no change in temperature involved! An isothermal process.
I asked you once before what the title “Heat and Mass Transfer: Fundamentals and Applications” implies to you.
You never answered. Yet that title would suggest to most people willing to learn that mass has something to do with thermodynamics. It apparently suggests NOTHING to you – or you just wish to remain willfully ignorant as to what it implies.
“How does your “measure” allow for isothermal thermodynamic processes?”
You are just incapable of following an argument. Again, I am not using temperature as a measure of anything but temperature. Not a change in energy, not as an isothermal process. Just as a measure of temperature.
Something that tells you if one object is hotter than another, or if it is getting hotter or colder over time.
“I’ll repeat, your dependence on Temperature, to the exclusion of everything else…”
This is just drsperature strawmanning. Of course temperature doesn’t exclude other factors. You can say that an object increased it’s internal energy but not it’s temperature. Where I disagree with you is if it makes sense to say it got hotter as a result.
“There is a reason why you never show the math behind any of your assertions. ”
Here’s my “math”
Tn > Tn-1 implies warming
Tn < Tn-1 implies cooling
"Cutting a rock in half doesn’t change the value of the intensive property of the rock known as *temperature*. Both pieces still have the same value of the intensive property known as “temperature”. "
Yes, that's my point.
"I asked you once before what the title “Heat and Mass Transfer: Fundamentals and Applications” implies to you. "
It implies it's any elementary text book dealing with the fundamentals and application of heat transfer and mass transfer. I'm not sure why you have a problem understanding that.
"Yet that title would suggest to most people willing to learn that mass has something to do with thermodynamics. "
Then they would be misunderstanding it. The books not about thermodynamics specifically, it's about the transfer of heat and mass. It's about how quickly temperatures change rather than just what their equilibrium will be.
Mass transfer is important because it change the rate of warming or cooling. E.g. blowing on coffee to cool it quicker. What it does not mean is you can make something colder by cutting it in half.
“You are just incapable of following an argument. Again, I am not using temperature as a measure of anything but temperature. Not a change in energy, not as an isothermal process. Just as a measure of temperature.”
So you aren’t interested in thermodynamics at all. That actually fits with your statistical world – you don’t care about reality at all. It fits with thinking that an average of intensity properties has some kind of meaning.
If that is how you want to define it, fine. But it leaves a whole field of heat energy and heat transport out of the equation. Again, temperature only tells you the direction of heat flow, it tells you only a part of the heat transfer equation since heat transport includes latent heat and other internal enegy.
It’s the same mistake that climate science makes in considering only temperature as the defining metric for “climate”. Heat TRANSPORT is a major defining process for the engine that is the earth’s biosphere.
And you STILL haven’t answered if Qout is a cooling process or not. Why?
Huh? How do you know what the equilibrium point will be from a state variable, temperature? You have to INTEGRATE the rates over the appropriate time intervals in order to determine when the joules-in match the joules-out. And that rate will be a function of time and the decreasing (Th-Tc) difference as equilibrium is approached.
If the thermal resistance of one medium is different than the other then the rate from a->b will be different than the rate from b->a.
This just highlights one more lack of understanding that goes into radiative balances. The earth not only radiates heat out 24/7 but the total radiation is from the entire area of the earth. The sun’s insolation is not only limited by its angle of incidence to the surface as the earth rotates, it is also limited in time to 12/7 as well as only illuminating 1/2 of the earth’s surface area at any point in time. Yet somehow climate science thinks the flux rate out and the flux rate in should “balance”.
“Mass transfer is important because it change the rate of warming or cooling. E.g. blowing on coffee to cool it quicker. What it does not mean is you can make something colder by cutting it in half.”
Do you actually understand the contradiction you just asserted?
If mass transfer changes the rate of cooling then how can you not change its temperature by cutting it in half since the rate of cooling is mass dependent?
In essence the entire claim of global warming is mass dependent – adding mass from CO2 increases the TEMPERATURE of the earth by changing its rate of cooling.
You just denied the theory of global warming being controlled by the mass of CO2 in the atmosphere and don’t even realize it.
“Do you actually understand the contradiction you just asserted?”
No contradiction, unless you are incapable of reading.
“If mass transfer changes the rate of cooling then how can you not change its temperature by cutting it in half since the rate of cooling is mass dependent?”
I didn’t say the rate of cooling wouldn’t change, but that it wouldn’t cool just because you cut it in half. If the rock is at 20°C in a 20°C environment it will not be cooling whole, and it will not be cooling when cut in half.
If the rock was at 40°C, it would be cooling whole and it will be cooling when halved, but at a different rate. I would expect the half a rock to cool faster due to the increased surface area relative to mass.
“In essence the entire claim of global warming is mass dependent – adding mass from CO2 increases the TEMPERATURE of the earth by changing its rate of cooling.”
Seriously? You think burning fuel increases the mass of the earth?
In other words, you were CHERRY PICKING again. Without understanding the context and meaning of the cherry you found!
“trying to get you to actually provide evidence that the term cooling is used to describe internal energy rather than reducing temperature.”
U = Q + W
dU = ẟQ + ẟW
I can’t provide you any better evidence than this. The fact that you can’t figure out what these simple equations mean is *not* a failure by me in providing evidence.
The simple fact is that heating and cooling is a thermodynamic process, not a thermodynamic outcome and not a thermodynamic state.
The term “cooling” means nothing more than the direction of an energy flow. The term “heating” means nothing more than the direction of an energy flow.
Saying that ObjectA is “cooler” than ObjectB because ObjectA has a lower temperature is thermodynamically meaningless because it only addresses part of the heat (energy) in the objects.
Somehow you can’t seem to get that into your head. I don’t know how to make it any simpler than what I’ve just written above.
You live in a statistical world where dU = ẟQ. Most of us live in a world where dU = ẟQ + ẟW.
“Still, here are a few references to latent cooling, whether it exists or not.”
Again, you *have* to read for context and meaning. Something you simply cannot do.
“latent cooling” describes a direction of energy flow and a type of heat, i.e. not temperature related heat. Same for “latent heating”.
The same applies to “sensible cooling”. It describes a direction of flow (cooling) and a type of heat, i.e. temperature related heat.
In your statistical world where only temperature defines colder/hotter, neither latent heating or latent cooling can happen.
You need to abandon your statistical world with its dependence on temperature to define cooling/heating and hot/cold.
But I’m not going to hold my breath waiting for you to do so.
This lies at the basis of the insistence that climate science *SHOULD* be using enthalpy instead of temperature. Even with enthalpy, an extensive value, it is not homogeneous on a global basis and all measurements should be weighted for variance.
Climate science uses temperature without any weighting because it is SIMPLE to measure and use, not because it is physically meaningful. You are in the same boat, trying to force thermodynamics into being only temperature dependent because it is *SIMPLER* and don’t really care if it is physically meaningful.
Climate science has always depended on the GAT being accepted as physically meaningful. That is being increasingly questioned since what climate science has predicted based on the GAT simply hasn’t matched physical reality. Your insistent on dU = ẟQ is no different.
“Again, you *have* to read for context and meaning. Something you simply cannot do.”
If you want to keep having these discussions please try to do it without these incessant insults.
You said latent cooling was’t a thing called latent cooling, and I produced a few examples of the term being used. That’s all.
“In your statistical world…”
Stop with these pointless obsessions. This has nothing to do with statistics It’s purely to do with what people call things.
“neither latent heating or latent cooling can happen.”
It can happen if people call it that. Whether it’s helpful to describe dehumidification as latent cooling is another thing. But just denying some people call it that is wrong.
I’ll stop when YOU STOP CHERRY PICKING. It’s pretty simple. But I’m not going to hold my breath that you will ever stop cherry picking.
And you indicated not one iota of what they were talking about. Latent heat isn’t transported based on temperature difference! You didn’t read for enough meaning and context to realize that!
With absolutely no understanding of what the text was talking about. You searched for the term “latent cooling” and found it. But you never bothered reading and understanding what was being discussed. Cherry picking at its finest. Just like you have done with metrology and the idiotic assertion that you can increase resolution by averaging.
I haven’t had a chance to read this yet:
https://papers.jcohler.com/gmst/
“The Father of Lies Hijacking Climate Science: Global Mean Surface Temperature Does Not Exist” — Jonathan Cohler
“Abstract: Trillions of dollars are being spent ostensibly to avert a threatened global climate disaster. According to the UN Intergovernmental Panel on Climate Change (IPCC), the global mean surface temperature (GMST) must not increase more than a stated amount above the pre-industrial baseline (1850–1900) to prevent irreversible catastrophe. However, the GMST does not have a precise regulatory definition, and is in fact physically meaningless based on fundamental principles of thermodynamics. Nevertheless, all IPCC climate models are tuned to reproduce historical GMST trends. This represents what Orwell presciently described: the systematic replacement of objective truth with politically convenient fiction.”
This is a great paper. It gathers many of the things I have been skeptical of concerning proper energy analysis in the system we call earth.
Temperature simply cannot deal properly with energy that is not sensible. To the untrained, temperature is “heat”, how hot something is. To those who have learned thermodynamics, temperature cannot describe internal energy properly nor be used to trace the path that is followed to create a given temperature.
The one thing the paper missed is the actual path of energy in the system. Incoming energy (insolation) first passes through the ocean/land thermodynamic system prior to having an effect on air temperature. A proper energy analysis of ocean/land is a prerequisite for any analysis of the energy in the atmosphere.
Here is another quote from the Cohler paper:
————————
True warming, as understood in basic thermodynamics, represents a net transfer of energy into a system, measured in joules or watt-seconds—not degrees Celsius. Warming is fundamentally about internal energy increase (ΔU) in the system. Temperature, conversely, is an intensive state property defined only in equilibrium systems through the relationship 1/T = (∂S/∂U) at constant V and N, where S represents entropy, U internal energy, V volume, and N the number of particles. This thermodynamic definition makes clear that temperature exists only in equilibrium systems and is neither additive nor averageable across non equilibrium systems.
———————— (bolding mine, tpg)
Bellman wants to define “warming” as being only associated with ẟQ (i.e. temperature), not with ΔU which is internal energy.
He is still living in his own little world where having your left hand in boiling water and your right hand in an ice bucket means your average temperature is 50C. No frostbit and no blisters.
“For at least the third time, where is your linearly increasing energy source in the sun-earth thermodynamic system?”
Hah! Finally the real stripes on the zebra are showing. bellman isn’t interested in reality, only the IPCC version.
And you still can’t read, carbon dioxide is not a source of energy!
A time series trend. Does this graph have a linear trend anywhere?
“You refuse to admit that you have not studied thermodynamics.”
By the way, I’m sure I’ve told you I’ve never studied thermodynamics before. If I haven’t let me tell you again – I have never studied thermodynamics, at least not university.
“How many more of these distractions are you going to go through before accepting that by any definition, if the state value is increasing over time then it’s warming not cooling?”
You *still* don’t get it.
You have an object that is cooling, no external thermodynamic heat source providing input to the system. You compress that object, i.e. you do work on the object. The temperature of that object will go up while it is still cooling. In fact, the rate of cooling will go up as well as the temperature goes up!
The state value of “temperature” will *NOT* tell you what is going on at all. The state value will go up while the only thermodynamic process associated with the object will be heat loss – i.e. cooling!
I’ve asked you this before. You’ve never answered. What makes you think you can come on here and lecture those of us who have actually studied physical science on how things work? Especially when it is obvious that you have no actual knowledge of physical science at all.
If “warming” implies a gain in heat energy then your definition is wrong. In fact an object can cool while its temperature is going up.
Is a net loss of heat considered to be “cooling” in your statistical world? If a net heat loss by an object is not cooling then what is it?
“The temperature of that object will go up while it is still cooling.”
Just provide a reference to your definition of cooling.
“If “warming” implies a gain in heat energy then your definition is wrong.”
It implies an increasing temperature. Again, show me a reference to your definition if you want me to stop asking you.
“What makes you think you can come on here and lecture those of us who have actually studied physical science on how things work?”
For the same reason you think you can lecture people who have studied climate science, statistics, mathematics, etc.
And becasue it’s obvious that whatever you studied, you didn’t understand it.
Say what? This may not be the most absurd thing you’ve said, but it ranks high. Obviously object that emit energy are not necessarily cooling. In fact, sometimes they are warming.
“Obviously object that emit energy are not necessarily cooling. In fact, sometimes they are warming.”
You are as bad as bellman. Net heat/loss = heat gain – heat loss.
Heat gain is warming. Heat loss *is* cooling. Both are defined in terms of JOULES, not Kelvin, not Celsius, not Fahrenheit.
T is not part of a rate equation. It is a state variable and doesn’t even define total heat gain. It cannot define heat gain such as latent heat.
T^4 *is* part of a rate equation, it defines heat LOSS – i.e. cooling.
An object *can* warm and cool at the same time. How in Pete’s name do you think the radiator in a car works?
You, like bellman have never studied or passed any thermodynamic university course.
Bodies that are both absorbing and emitting energy are simultaneously warming and cooling!
if you don’t understand how this is accomplished then you don’t understand the basic equation: ΔU=Q−W.
I have urged you before to obtain Planck’s Theory of Heat Radiation. He treats absorption and emission as two different processes. If nothing else read the last few chapters where he creates the concept of oscillators and quanta. An oscillator can absorb a quanta of energy and begin to oscillate. Later that oscillator can emit a quanta of energy. Two entirely separate processes.
You should notice that the SI units for each of the variables in the equation is ‘Joules’ and not temperature.
You are wrong.
If an object warms less than the entire energy that is added, has it cooled?
You have temperature as a compulsion. Temperature is not at issue here, joules are. Net Joules = Added Joules – Removed Joules. It is as simple as that.
“The underlying meaning is the point. An exponential function is very different to a polynomial.”
So what?
My statement of “And the earth radiates heat away every second of every day. As T gies up linearly from added heat, energy out goes up by T^4” still stands.
You have *NOT* refuted my statement in any way with your changing the subject to “what is an exponential and why is it different than a higher order polynomial?
You simply refuse to understand that in reality T^4 is a BOUNDARY CONDITION on T. At some point ΔT4 will radiate heat away faster than ΔT can increase. I.e. a boundary condition. It’s why Tmax doesn’t just keep going up. It’s why any change in the GAT is almost totally from a change in Tmin instead of Tmax.
It’s PHYSICS.
The percentage change doesn’t matter. If the heat loss from ΔT^4 is greater than ΔT you’ve reached Tmax – period.
Even worse T is a STATE variable. It is not a process variable, T cannot define heat gain or loss. T^4 is a RATE, it *can* define heat loss or gain.
If you can’t refute my statement of “And the earth radiates heat away every second of every day. As T gies up linearly from added heat, energy out goes up by T^4″ then all you are doing is flapping your gums over an irrelevancy.
“So what?”
The so what is I offered a helpful comment that Jim was misusing a term, and rather than do the wise thing and just say you used the term figuratively and agree to be more precise in the future, we get a doubling down of the mistake, insisting that polynomials are exponential functions, and I’m an idiot for not understanding that.
It’s what you two do all the time. You are incapable of ever admitting you made a mistake, no matter how trivial. It just ends up being a massive distraction from whatever point you were trying to make, whilst exposing your own ignorance.
“My statement of “And the earth radiates heat away every second of every day. As T gies up linearly from added heat, energy out goes up by T^4” still stands. ”
Nobody has said it doesn’t stand. All I’ve tried to do is get you to do is to explain why you think it matters. It’s difficult to argue for or against your claim if you cannot articulate what that claim is.
“You simply refuse to understand that in reality T^4 is a BOUNDARY CONDITION on T.”
OK. If that’s you claim you need to explain what that boundary is.
I think you are mistaken as the real boundary is how much energy you can put into a system. That would be true if the equation was T or T^10, all raising to a power does is determine how quickly the temperature rises in response to a linear increase in energy. As long as energy in keeps increasing then temperature will keep rising, just at a slower rate.
But as I pointed out in the simplest Greenhouse model, assuming a completely opaque atmosphere, you only double the amount of incoming energy, and thanks to the T^4 equation that amounts to about an 18% increase in temperature. But that still means you go from 255K to 300K.
“It’s why any change in the GAT is almost totally from a change in Tmin instead of Tmax.”
Except that’s not what we are seeing. You expect Tmin to go up faster than Tmax, but both should increase. And at present many places seem to show maximums going up as fast as minimums, if not faster.
“If you can’t refute my statement of “And the earth radiates heat away every second of every day. As T gies up linearly from added heat, energy out goes up by T^4″ then all you are doing is flapping your gums over an irrelevancy.”
Your usual style of straman argument – I don’t have to refute any of that becasue I don’t disagree with it.
You don’t know this.
Of course he doesn’t know this. Even the CRN system has a measurement uncertainty too large to confirm if it has gone up *or* cooled.
Useful would have been just pointing out that both polynomial and exponential curves far outstrip a linear line. Instead you want to divert the discussion into a nitpick festival that has no relationship to the original comment.
You are a TROLL, period, exclamation point.
Nitpicking over something that has no relationship to the original comment: “And the earth radiates heat away every second of every day. As T gies up linearly from added heat, energy out goes up by T^4”
The issue isn’t ours or even the misuse of a term. The issue is YOURS and your need to find something, ANYTHING, to use as a cudgel – “you made a mistake”. It doesn’t have to have anything to do with the issue at hand! It just fulfills some insane need of yours to find something to nit pick.
It’s been explained to you in excruciating detail. No one can help your lack of reading comprehension skills other than yourself.
You are sorely lacking in knowledge when it comes to physical science. It leads you to make unbelievable assertions lik insisting that a linear line, i.e. T, is “almost” the same thing as T^4!
This is a perfect example. You can’t take a simple truth like the difference between y = T and y = T^4 and understand what the claim is that they are very different in the real world we live in.
You simply cannot read. I said: “ At some point ΔT4 will radiate heat away faster than ΔT can increase. I.e. a boundary condition.”
How much more of an explanation do you need? Why do you think you can’t melt a steel rod with a match, no matter how long you hold the match under it? It’s because it will radiate the heat away faster than the match can add it!
Your lack of knowledge of physical science is still showing. The boundary is *NOT* how much energy you can put into a system. The boundary is where the heat loss is equal to the heat input! Over infinite time a match can put an infinite amount of heat into a steel rod. But the temperature of that rod will STOP at a boundary condition when it loses heat faster than the match can input heat!
Temperature rise is linear, (Th – Tc), as long as the heat input is constant, i.e. your “linear increase in energy”. Temperature decrease is a power-law or exponential function, T^4 – NOT LINEAR.
NO! It won’t. The temperature will only increase until heat loss equals heat gain.
Net energy gain = energy-in – energy-out. When energy-in = energy-out, the Net energy gain = 0!
And yet you argue that is not a significant increase. You can’t even keep your own story straight!
Tmax has changed hardly at all or you would have seen the result in global food harvests due to heat accumulation and corresponding stunting of growth. Copilot can’t even find a reference dataset on Tmax that includes measurement uncertainty for the result that shows a rise. Whether Tmax has gone up or not is part of the Great Unknown. Even the CRN measurement uncertainty budget is not one I would accept from a subordinate analzying a system. It looks only at specific pieces of the overall station and several entries are parameterized to a constant.
That just verifies that you are troll – deflecting the discussion into irrelevancies. Talk about making up strawman arguments.
You really are clueless. You think I wanted to disrupt your meaningless comment about T⁴ by discussing exponential functions. Yet the only people forcing us down this pointless rabit home is you. If you didn’t want it to become a distraction you could have just admitted at the start you had misused a common term. But instead you just drag it out by claiming I don’t understand what exponential growth means.
None of this changes my central point that you have done nothing to explain under what circumstances T⁴ matters. You keep saying it creates a boundary to warming, and I disagree. The limit to warming is how much energy increases, not the fact that energy out is growing at a faster rate than energy in. If energy is increasing at a linear rate indefinitely temperatures will continue to rise indefinitely. T⁴ just means the rate of temperature rise will decrease. The fact that temperature rise is bounded is due to the fact that energy in won’t increase indefinitely.
“Over infinite time a match can put an infinite amount of heat into a steel rod. But the temperature of that rod will STOP at a boundary condition when it loses heat faster than the match can input heat!”
And you are missing the point that we are talking about energy in increasing. All you are describing is an equilibrium point. Of you increase the rate of energy coming in that equilibrium pint will increase.
What energy source is *INCREASING” its input to the earth’s thermodynamic system?
It sure as heck isn’t the sun! The sun’s input is pretty much a CONSTANT, as in the same value. Just like the match being used to heat a steel rod!
What in Pete’s name do you think happes at equilibrium? Equilibrium *IS* a boundary condition! If Eequlibrium isn’t a boundary condition then how can it be “equilibrium”?
I’ll ask again. What heat source has an increasing rate of energy input to the thermodynamic system known as earth?
CO2 is *NOT* an energy source, it is *NOT* on fire!
CO2 is a reflector of heat that has already been lost. It is *NOT* a source of energy on its own.
You are now back to trying to assert that CO2 causes “RETAINED” heat in the earth’s thermodynamic system. If that were true the Earth would have become a flaming ball of molten rock over the millennia.
Since CO2 has existed in the earth’s atmosphere practically since it formed tell us why the earth hasn’t become a flaming molten rock from the retained heat CO2 creates.
If CO2 does *not* cause retained heat then exactly what is the basis for claiming CO2 is the control knob for the earth’s temperature?
Is climate science just looking at too short of a time period to actually know what is happening?
What a gross misunderstanding of a simple energy balance, Gorman. Think about it. Once greenhouse gases restrict energy flow out from the earths system to space, the earth warms. And as the earth warms, what do think happens to the rate of thermal energy flow radiating from earth to space? And then…? We await your profound answer.
“What a gross misunderstanding of a simple energy balance, Gorman. Think about it. Once greenhouse gases restrict energy flow out from the earths system to space, the earth warms. And as the earth warms, what do think happens to the rate of thermal energy flow radiating from earth to space? And then…? We await your profound answer.”
Restricting heat loss means SLOWER COOLING! It does *NOT* mean warming! Driving an object back up the temperature gradient requires inputting MORE energy into the system. Where in Pete’s name do you think that “more energy” is coming from in the sun-earth thermodynamic system? CO2 is *NOT* on fire, It is *NOT* generating “more energy”. It is *reflecting* heat being lost from the earth’s surface. That means the earth has already *LOST* the heat that is being reflected back. It has cooled by X amount. If CO2 reflects 0.9 * X back then the earth has *still* cooled by X – 0.9X = 0.1X. That is *still* cooling! It is *NOT* pushing the earth back up the temperature gradient to 1.1X or 1.9X or any other greater number than at the origin!
I’ve attached a graph showing what happens. The plots are temperature vs time. The top curve is slower cooling due to CO2. The bottom curve is without CO2 to restrict the cooling rate. The amount of heat emitted is the integral of the curve, i.e. the area under the curve. The area under the top curve is OBVIOUSLY greater than under the lower curve. BUT BOTH SHOW COOLING.
Planck explains this as compensation for reflected heat by the emission of new rays. The slower cooling actually generates more heat loss over time thus compensating for the reflected heat.
But “slower cooling” is *NOT* “warming”. It is just slower cooling!
Hey mr. troll-shill, you ran away from the main point, in bold:
And I ask you why do the energy inputs to a system have to increase in order for the systems temperature to increase? Explain your answer employing one or more of the Laws of Thermodynamics.
Still no answer…no surprise.
And I ask you why do the energy inputs to a system have to increase in order for the systems temperature to increase? Explain your answer employing one or more of the Laws of Thermodynamics.
“And I ask you why do the energy inputs to a system have to increase in order for the systems temperature to increase? Explain your answer employing one or more of the Laws of Thermodynamics.”
What’s your point? You *can* increase the energy in a system without the temperature changing.
You *can* increase the energy in a system and create a temperature change.
The operative word here is “increase”.
I’ll ask again: “I’ll ask again. What heat source has an increasing rate of energy input to the thermodynamic system known as earth?”
I know you won’t answer because it would show the garbage you are trying to assert.
dU = ẟQ + ẟW_on. where W_on is work done ON the system.
The energy production in the sun-earth system is done by the sun. Any ẟQ has to come from the sun, it’s ẟQ_sun. There is no energy source in the earth subsystem that can add any ẟQ.
In a system in equilibrium, ΔQ = 0, i.e. Qout = Qin and ΔQ = Qin – Qout
What you ae postulating is that
Qout = Qin – Qretained so that
ΔQ = Qin – (Qin – Qretained) = Qin – Qin + Qretained
or ΔQ = Qretained
If CO2 causes Qretained > 0, then ΔQ will go up over time and will, sooner or later, result in earth becoming a molten rock.
It is *YOUR* responsibility to show how and why this doesn’t happen. All according to the laws of thermodynamics.
I think you will find pretty quickly that Qretained cannot be > 0 over time. It’s just a matter that the cooling of the earth just takes a little longer to happen, the next glacial period just gets pushed out a little further into the future.
It’s pretty obvious that you have no actual refutation to offer for why my graph is wrong. It’s also pretty obvious that you have no actual refutation for Planck’s assertion that reflected heat is compensated for.
That’s ok, neither does climate science.
Gorman,
You said,” If CO2 causes Qretained > 0, then ΔQ will go up over time and will, sooner or later, result in earth becoming a molten rock.”.
Or in other words, earth will warm without end. By Jove, I think you’ve finally figured it out!!
LOL! More doctrine from the CAGW Bilble.
I thought your equation showed that if a system is receiving incoming energy, it must warm as long as that net energy inflow continues? Isn’t that what you said?
ΔU = Q – W
You are the expert, you decide what this thermodynamic equation means and let us know. Hint, this describes multiple processes operating simultaneously.
So then, Gorman , if the net energy flow continues indefinitely, what is the inevitable consequence for earths system?
Here is a continuous energy flow over several days. Tell us your conclusion.

“So then, Gorman , if the net energy flow continues indefinitely, what is the inevitable consequence for earths system?”
If you hold a match under a steel rod indefinitely will the steel rod eventually melt?
Nothing in the equation says Q has to be positive and W has to be negative. By the same token, ΔU doesn’t have to be positive.
The fact that the earth is not already a molten rock would tell most people that 1. ΔU has not always been positive, and 2. that the earth, over time, loses heat, sometimes at a rate greater than at other times.
“Duh, well I Gorman the Janitor declare that all Syinze is WRONG. See my really simple minded analysis and you must agree!”
After numerous millennia of past history why hasn’t the earth already become a molten rock. Esp since CO2 was far higher at points in the past?
It sounds like you’re a slight bit smarter than the average Janitor, Gorman, although not by much. Study hard, and see if you could admitted to a High School earth science class where you would hear the answer to your question (although you might not understand it).
“So I, Janitor Gorman, hereby declare that public school science -(and presumably university level science) — are all wrong, and only I know the Truth. So pay attention everyone; I are a reel geenyus!”
Acolyte Beeton, you won’t win many new believers by denigrating everyone that are not believers in your CAGW Bible. You need to quote scripture fom your Bible that refutes what the unbelievers throw at you. So far you are failing miserably.
Spammer.
You asked the question, so enlighten everyone here with your answer.
Does the CAGW Bible fail to give you an answer? Maybe its not complete!
There is your first mistake. The system consists of:
sun –> land/ocean –> atmosphere.
Ignoring the small amount of atmospheric absorption of insolation, the sun is what heats the land/ocean through the absorption of energy. That is the first step in the thermodynamic system of the earth.
The land/ocean then radiate energy, ignoring conduction/convection, into the atmospheric system. Since the land/ocean becomes hotter than the atmosphere heat spontaneously flows from the land/ocean to the atmosphere. Can the atmosphere ever become hotter than the land/ocean while the sun is shining? Nope. That means the energy flow is always from the land/ocean to the atmosphere.
Now look at this graph especially in the late afternoon/early evening. All of a sudden the surface temperature falls below the air temperature. How can that be? The atmosphere should warm the surface and at least keep it at equilibrium! Hmmm? What is happening?
Maybe, just maybe, the atmosphere doesn’t have the mass to provide sufficient energy to the land so it can maintain equilibrium. Maybe, just maybe, gases only radiate small amounts of energy at their predominate frequencies. If that is the case, does “back radiation” have sufficient energy to change much at the land/ocean surface?
Happer and Wijngaarden’s study showed about 3 W/m² total. One would suspect much less as the temperature drops with the onset of sunset.
Look at this graph. Exactly what is warming what? You have no clue about the earth’s system. You cannot relate insolation directly to air temperature. The system does not work that way.
And, in case you think there isn’t a lot of energy stored in the soil, here is another.
You are beating a dead horse. You are stinking up the place.
What you do *NOT* understand is that:
The satellite measurement data like UAH are based on the S-B equation which gives an EFFECTIVE temperature, not a physical thermodynamic temperature.
So not only is the surface global average temperature based on thermometer measurements a physical meaningless value, it is not directly relatable to the EFFECTIVE S-B temperature.
When climate science claims that the EFFECTIVE UAH average temperature is a close match for the physically measured global average temperature it *should* be a clue to the fact that the UAH temperatures are *NOT* directly derived from the S-B equation but are an ADJUSTED output from somewhere in the conversion process from radiance to temperature!
Brightness temperature (i.e. from radiance) is not a physical temperature. It is the temperature a black body *would* have if it emitted radiance at that frequency. In other words the data from UAH is an artificially created synthetic temperature. It is derived using a DESIGNED weighting function that is *NOT* natural. In other words it is engineered to *look* like the earths surface temperature. The calculation algorithm is TUNED, just like CGM’s are tuned, in order to get the desired output.
Yet here you are, CONTINUALLY, trying to tell us that UAH is accurate, matches the surface temperature, and its trend line is accurate and significant.
Your graphs and calculations using UAH are nothing more than an edifice built upon a foundation of sand. When the calculation algorithm is TUNED to give a desired output and that desired output is physically meaningless, why should anyone put any faith in the outputs?
“You are stinking up the place. ”
Not really worth further discussion.
“The underlying meaning is the point. An exponential function is very different to a polynomial.”
It nothing but a Stokesian nitpick.
“It nothing but a Stokesian nitpick.”
It’s so telling that these people who claim to be experts, who keep insisting that I need to take basic calculus, etc, yet apparently never learnt the difference between a polynomial and an exponential function.
It is most definitely not a nitpick. It’s one of the most fundamental distinctions in growth rates. It’s difference between your algorithm completing in a couple of minutes and it never completing during the lifetime of the universe.
OK, NICK, how about increasing nonlinear?
Is this acceptable for the average-on-the-brain crowd of trendology?
“It is most definitely not a nitpick. It’s one of the most fundamental distinctions in growth rates.”
It *is* a nitpick. The growth of both far exceed the linear growth of temperature.
Both will result in a boundary condition being applied to tempeature rise.
“Both will result in a boundary condition being applied to tempeature rise. ”
Any monotonically increasing function will result in a boundary if the input is constant. It’s got nothing to do with whether it far exceeds linear.
The point is that
y=x rises at a constant rate.
y=aˣ rises at an ever increasing rate
y=xᵃ rises at an ever increasing rate
Whether mathematicians call them different things is meaningless when discussing the results. It is a Stokes like nitpick and has nothing to do with the subject at hand. A strawman if you will.
“Whether mathematicians call them different things…”
They don;t just call them different things, they are different things.
“It is a Stokes like nitpick and has nothing to do with the subject at hand. A strawman if you will.”
You don’t understand what strawman means, either. Though you seem to have ad hominem arguments down to a tee.
But, yes, it has nothing to do with the subject, that’s why it’s so odd for you to keep defending your own ignorance on this.
Let’s see . . . X-axis is undefined . . . GREAT PLOT!
It isn’t a functional relationship as Bellman’s graph would lead you to believe.
The x-axis is nothing more than an interval that is common to both. Basically 16 vertical cells in two excel columns and I let excel put the interval in for the x-axis. The two graphs are not related other than to show that one is linear and one is exponential.
It took about 2 minutes to complete and export a picture. This isn’t hard to understand.
Also, if you really don’t know what the difference is, please don’t try to design an algorithm.
“As T gies (goes) up linearly from added heat, energy out goes up by T^4.”
Except for the non-linearity introduced by variations in global areal cloud coverage, except for the the non-linearity introduced by variations in water content (TPW) in the atmosphere, except for the non-linearity introduced by changes in Earth’s surface albedo due to changes in vegetative areal coverage and snow/ice areal coverage.
Also, since T is in absolute degrees, the IPCC-dreaded 1.5 deg-C rise against Earth’s current ~15 deg-C average global temperature amounts to the following calculated change in Earth’s energy output, using the Stefan-Boltzmann equation and assuming everything else stays constant:
((273+15+1.5)/(273+15))^4 = 1.02, or a whopping 2% increase in outgoing Earth radiation power flux.
Man the lifeboats!
My statement stands. You are listing out the contributors to the variance of each component. Climate science just ignores variances, they never seem to publish them – probably because variance is a metric for the accuracy (think measurement uncertainty) of the “average”. I would also note that the albedo of the Earth AND its emissivity are not constants either because of components such as land/water. That makes the non-linearity even greater.
Yes . . . and as a reminder, I was commenting on your statement about linearity:
“As T gies up linearly from added heat, energy out goes up by T^4.”
and NOT anything in particular from “climate science”, whatever the hell that is supposed to mean.
about one third of the globe is basking in sunshine and two thirds of the globe is shedding energy into outer space at exactly the same time and almost always exactly the same amount.
There is NO STABLE state, there is NO NORMAL state – all is in flux, day and night, season by season, year by year
Of course but, say, so is a pan of water being brought to the boil. at a macro level it proceeds to 100C (at SL) even though convection roils away and steam bubbles escape the surface.
Nothing is in a true constancy.
It’s just that to arrive at a direction of travel then science has to look at the bigger picture.
Wrong. The whole of Earth is continuously emitting radiation (mostly LWIR) into outer space, day or night, as allowed by its average emissivity at TOA and its “atmospheric window” over that frequency range.
Also, please translate the word “basking” into something scientifically meaningful.
Finally, I never mentioned anything about Earth being in a stable state, either day-to-day or millennium-to-millennium.
Here’s how Dr Spencer answered, this very day (or was it last nite IDK), in response to somebody-asked-me-something-about-[the new energy in your peanut butter globule snacks]:
“If I was young enough, I would invest in a coconut palm farm on the north coast of Alaska”
— Dr Roy Spencer, last (un)seen driving NNW out of Nashville TN
Translation, for ye’all fatty-acid-illiterati who may be reading this:
“Wrong tropical nuts, dude! Coconut oil (coming from a true nut) is 100X healthier than Peanut [sic] Oil, the peanut (plant) being a tropical legume transplanted from equatorial Africa to the red Georgia clay by African laborers & such. Having worked a lifetime in Huntsville, Alabama, aka Rocket (Satellite) City – USA, I know my boiled Georgia peanuts better than anyone.”
Yeah, I saw that comment.
Looks like even Roy is facing up to reality, at long last.
Dear to-a-FinalNailhead-every-tool-is-a-Hammer,
get a grip, and give the Good Doctor credit for his fine sense of humor.
Visit soon the North Slope / Arctic Shoreline of Alaska, enjoy a few coconuts and drilling platforms, then report back to us on your findings.
You can do this!
— RLW-is-not-Anon
How do you account for the long term warming trend, ocean and atmosphere, in every global data set if there’s no extra heat in the system?
Where’s the extra peanut butter coming from, to follow your analogy?
Back at ya:
How do you account for the long term cooling trends, ocean and atmosphere, in every global (proxy) data set that includes at least the last glacial interval if there’s no extra cooling in the system?
Careful not to slip on the “peanut butter”.
Look up “Milankovitch cycles”.
You’ll find your “long term cooling trends” there.
Shucks! . . . and all along I have been informed that Milankovitch cycles and their resonances might explain BOTH the cooling of Earth that is responsible for Ice Ages and glacial intervals and the warming of Earth that is responsible for Hothouse Earth ages and interglacial intervals.
You know (or maybe not) . . . to the degree that Milankovitch cycles cause both increases and decreases to the rates at which solar energy is absorbed by Earth (as indicated by the graph that you yourself posted above).
Oh well . . . I guess it’s back to the drawing board for me and thousands of other scientists. /sarc
Yes, this scientist (Meteorologist) certainly does know that, but thanks anyway.
Only eccentricity changes the amount of energy the earth receives. The others distribute energy differently over the surface of the earth with no obvious reason to believe there should be long term global trends.
Before you say otherwise, try to realise you’re going to answer after post hoc arguments have been made to justify historical changes with respect to the cycles.
“The others distribute energy differently over the surface of the earth with no obvious reason to believe there should be long term global trends.
No, there is ….
Obliquity (along with precession) is the most important orbital eccentricity as regards Earth’s IA transitions.
Reason:
The majority of the Earth’s landmass is in the NH and we know that is where icesheets form during IAs.
So when the O is at a max of 24.5deg during the NH summer there is an extra ~ 50 W/m2 at summer solstice beating down on that ice (the greatest landmass by latitude lies at 65deg N). This melts the sheets over a period of millenia and the last one produced the HCO as the obliquity max waned with the ice gone ….
https://www.researchgate.net/publication/226404886_Future_Climatic_Changes_Are_We_Entering_an_Exceptionally_Long_Interglacial
https://www.cardiff.ac.uk/news/view/2627497-scientists-shine-new-light-on-role-of-earths-orbit-in-the-fate-of-ancient-ice-sheets
Well I did mention
because your response was entirely predictable
And what you have posted is effectively opinion, not fact. Another factor to consider is that not all cycles have produced the expected effect. And more post hoc reasons follow.
The fact is that we dont really know and Milankovitch cycles are just the best argument we have with what we currently know.
It is a theory. Because of the variance, it cannot yet be substantiated for use in a functional relationship. It remains a theory.
Yes, technically everything that isn’t a law is a theory but this is more akin to philosophy than science. The GCMs are not even close to being useful.
I agree. My point was it is difficult to use this as definite fact in all cases.
There is no “extra” heat being introduced into the system. That would be global warming. What is occurring is conduction of heat from one area to a larger area. The conduction started when the Trade Winds allowed warmer water to slosh eastward. The sun did not suddenly increase insolation. CO2 did not suddenly increase downwelling radiation.
ENSO is a natural occurrence that periodically allows the earth to expel stored energy accumulated in the past. The preoccupation with temperature rather than joules of energy leads people to incorrect assumptions. Unless you think ENSO only started in the early 20th century could you assign the natural process to anthropogenic global warming.
I see you have been answered concerning the “extra heat”. First, temperature is not a good metric for “heat”. Second, you are using temperature as a state of matter where “state” is the operative word. It tells you nothing about the entire thermodynamic path that was followed in reaching that temperature. So you don’t know if there is any “extra heat” in the system.
Are you actually a physical scientist or just another climate science statistician?
Phenomenon.
Geoff S
1) 10s of thousands of peer reviewed research papers, published by thousands of scientists working for decades in every country of the industrialized world, and every Scientific Institution in the world and every major University without exception conclude:
‘Earth is warming, Man is the cause (primarily due to CO2 emitted thru the burning of fossil fuels) and the net effects are strongly negative’ or similar. That’s as strong a scientific consensus as you will find in any field of Science.
2)The IPCC has summarized the latest peer reviewed research in its 6th Assessment and it includes the mean estimate of researchers that Man is responsible for all of the warming. In fact, for a thousand years prior to the industrial era, Earth had been in a slow natural cooling cycle. That came to an end about 1900, as CO2 emissions from the burning of fossil fuels accelerated. So mans affect on climate was to both offset natural cooling, but also create net warming.
the climate has varied in the past, both regionally And globally. But today’s rate of warming is the fastest global rise ever seen— hundred times faster, or more, than any natural global changes prior or during mans existence. Today’s global temperature is now higher than anything ever seen by Homo Sapiens, and rising far faster than any natural change ever seen by Man, or seen in Earths geologic record.
I urge you, and anyone else reading this, to read reliable sources, such as the US National Climate Assessment, the National Academy of Sciences Reports, or the IPCC 6th Assessment. Or for easier reading, NASA’s Earth Sciences website:
https://climate.nasa.gov
https://nca2018.globalchange.gov/
http://sites.nationalacademies.org/sites/climate/index.htm
https://www.ipcc.ch/assessment-report/ar5/
Without exception? Seriously?
Oh yeah, Phil Jones changed the definition of peer review to keep them out. Oh wait, he failed, so they are in. So are many, many others.
We’ve been in a warming cycle for the last 400 years, ever since the end of the Little Ice Age. That was several hundred years before 1900. Not to mention that 1950 is the year commonly referenced as the time when CO2 emissions became statistically significant, so they could not have ended your imaginary cooling cycle in 1900.
You’ve got a bunch of other stuff hopelessly wrong, but I only have so much time right now.
OK, I found a few extra seconds.
Could you please point to the deleterious effects of climate change in this graph? Given how dire the situation is, you’d think it would stand out like a sore thumb but I cannot see it. Your help and expertise would be appreciated.
That one chart is supposed to invalidate anything I said?
Since you apparently skipped what I said and went straight to the picture (that says a lot about you) I will repeat what I said:
Oh yeah, Phil Jones changed the definition of peer review to keep them out. Oh wait, he failed, so they are in. So are many, many others.
We’ve been in a warming cycle for the last 400 years, ever since the end of the Little Ice Age. That was several hundred years before 1900. Not to mention that 1950 is the year commonly referenced as the time when CO2 emissions became statistically significant, so they could not have ended your imaginary cooling cycle in 1900.
We do not need anything to invalidate anything you say.
You do that all by yourself.
More catnip, kitty?
We all are laughing at you.
1) Without exception. It would be easy to disprove. Just find an exception. They don’t exist. (And random non peer reviewed blogs don’t count).
2)no, we’ve been in a cooling portion of a Milankovitch cycle for the last 1400 years, not warming. It’s the 40 gigatonnes of annual human caused co2 emissions that are overwhelming the natural cooling of the current M cycle, yielding the fastest warming ever seen by humans.
do you now understand?
Just one exception and you will admit you were wrong?
Klotzbach et al 2022 Geophysical Research Letters
Weinkle et al 2018 Nature Sustainability
Pielke et al 2008 Natural Hazards Review
Sheffield Wood Roderick 2012 Nature
Andela et al 2017 Science
Bloschl et al 2019 Nature
Formetta Feyen 2019 Global Environmental Change
Gasparrini et al 2015 The Lancet
Otto et al; 2013 Nature Geoscience
Lewis and Curry 2018 Journal of Climate
Zhu et al 2016 Nature Climate Change
Makowski et al 2020 European Journal of Agronomy
That’s just a few. I haven’t even dug into my list of papers arguing specific attribution claims are statistically overstated. H*ll, I could just drag a whole bunch of quotes out of the Summary for Policy Makers and challenge you to find where in the IPCC report itself those claims are made.
You’ve made a fool of yourself. You can keep doing that or you could apologize. I expect you will choose to either slink away with your tail between your legs or continue to make a fool of yourself.
That’s bogus . None of the peer reviewed sources in your list contradict what I said. I challenge you to cite any part that does.
Ah, so fool it is.
You haven’t cited one finding among these papers that contradicts what I said, have you?
You made a very broad statement. I’m sorry if you don’t understand your own statement or how these contradict it and I have no interest in trying to explain it to you. You’re response will be to deny, deny, deny and then call me a denier.
Arguing with fools is fruitless. You are a consumer of narratives and you think repeating them makes you credible. It doesn’t. It makes you a fool.
Is 1950 a typo. Should it be 1850?
Nope, 1950. That’s been the year cited by the IPCC for as long as I can remember. I’m not current, maybe they changed it, but I doubt it. Simple stats wouldn’t have supported a number earlier than that.
OK I checked. Technically industrial revolution started in 1850. By 1950 CO2 had risen from 280ppm to 310ppm. In 1950 CO2 emissions dramatically accelerated. But from 1940 to the 1970’s, global temps fell, sparking the ice age earth scare. So from 1850 to 1950 emissions were not significant enough to show up in the temperature record. 30ppm over 100 years is less than 1/3 of 1 ppm per year. The Muana Loa record didn’t start until 1958 so we don’t have accurate CO2 numbers before that, but 1959 was a .94ppm year over year increase, 3 times as much. Currently we’re hitting 2 to 3 ppm per year.
So 1950 still stands as the year when CO2 emissions accelerated to the point of being statistically significant. Some would argue that it should be later, more like late 1970’s, when the global warming trend returned. I’m fine with 1950.
Copy that.
There is data measurements recorded by chemists in the early 19th century that show CO2 levels comparable to today. Those are always dismissed out of hand, with nothing more than words.
Copy that. I was thinking of the beginning of the industrial age often used to base temperature change against.
(not bothering to consider that Earth naturally exited (i.e., warmed up from) the last glacial interval about 12,000 years ago)
(not bothering to consider the rate of warming upon entering the current Holocene, nor the numerous Dansgaard-Oeschger climate events during the last glacial interval)
Total ,unadulterated BS being presented for consumption in a word salad.
” . . . a scientific consensus . . . “
There have been many of these through history.
And equally as many since filed in those categories in libraries labeled-
BULLSHIT
What is the optimum concentration of CO2 in Earth’s atmosphere?
The one where the biosphere is stable.
The one where Ein = Eout.
[But then you have to accept, as science does, that CO2 is a GHG, and doesn’t precipitate out of the atmosphere as does WV.]
Which was, let me think, oh yes – the pre-industrial number.
(and, of course there is still NV in the climate).
Let’s examine this ‘carbon footprint’ claim. CO2 is currently around 430 parts per million, increased, they tell us, from 280 ppm in 1850 (estimated). That’s a difference of 150 ppm, or in terms more readily understood by the layman, the composition of the atmosphere has changed by 0.015% (15 thousandths of 1%) in the last 175 years. LESS THAN 1 THOUSANDTH OF 1% PER DECADE! That’s it. That’s the TOTAL ‘carbon footprint’ for the entire planet, and human activity is only responsible for a small part of that increase. This measurement is averaged annually from much higher and lower daily figures. All the development that has occurred in this timeframe, everything we have built, all industry and every drop of fuel burned is included in that calculation. Furthermore, every life form on this planet; on the land, in the sea and in the air is composed of carbon compounds that were once in the air as CO2, and every living thing that has come and gone in those 175 years is incorporated in a figure that doesn’t fall outside of a reasonable margin of error. By these processes alone nature circulates more than our annual emissions every few days:
From: Scrutinizing the Carbon Cycle and CO2 Residence Time in the Atmosphere
by
Hermann Harde, (2017)
Why CO₂ Doesn’t Stay for Millennia: The Math Everyone Ignores
Climate policy assumes excess CO₂ stays in the atmosphere for thousands of years. But when you look at the actual carbon cycle math, the picture changes completely. Here’s the step-by-step calculation.
Step 1: How Much CO₂ Is in the Atmosphere?
Current atmospheric CO₂ is about 870 gigatons (Gt).
Step 2: Annual Flux
Nature moves enormous amounts of CO₂ every year:
• Natural emissions: 770 Gt/year (from oceans, vegetation, soil respiration)
• Natural absorption: 770 Gt/year (into oceans and plants)
• Human emissions: 36 Gt/year
So humans add less than 5% of the total annual flux.
______________________________________________________
And this calculation doesn’t take into account the amount of greening the planet has seen in the last few decades. Our annual emissions equate to no more than an extra CO2 molecule per plant leaf on the planet. The claim that it is only our “emissions” that remain in the air and accumulate year on year, nature cannot cope with our contribution or that the carbon cycle was somehow magically in perfect equilibrium every year before we started to burn coal, gas and oil is a complete fairy tale designed to fool the gullible.
It makes a big difference to the plants on the planet (C3 the majority:
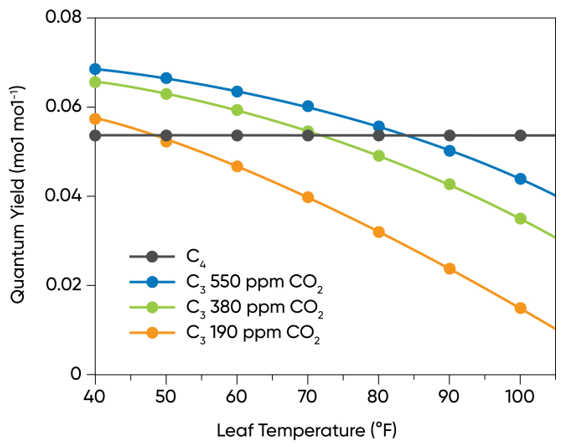
Rubbish — in other words, you have not the faintest clue about an answer.
Have you?
That is the sensible answer.
But I wouldn’t expect to grok with you or indeed most on here.
Thank you for admitting that you want to return to the bad old days of subsistence farming and burning wood for heat (and too many others to list).
You, of course, will be one of the elite who doesn’t have to stoop to such an existence.
Saying that the obvious answer to “What is the optimum concentration of CO2 in Earth’s atmosphere?”
Does not mean I advocate time-travel!
The two can and are mutually exclusive.
The obvious optimum is that for which the biosphere is stable.
(It’s not now).
We obviously cannot go back there and your inference that I meant that is bizarre.
I’d have thought that even you would have twigged what I meant – but then again this place never fails to bewilder.
“Does not mean I advocate time-travel!”
Are you on some strange medication?
“The obvious optimum is that for which the biosphere is stable.”
“Which was, let me think, oh yes – the pre-industrial number.”
Please to tell the listening audience [tinla] when the biosphere has ever been “stable”.
“We obviously cannot go back there and your inference that I meant that is bizarre.”
So why do you bother with Nut Zero and all the other hair-brained schemes to reduce CO2?
And where is “this place”?
In other words, you can’t answer the question.
SMH
Dude! Easy now, stop hollering, lay down your NCA-shovel; and
Let us lift you out that NASty hole you’ve dug yourself into;
Your mind is a terrible thing to waste, and we need you up here!
Embrace the warmth, soak awhile in this here 40 C mineral bath.
C’mon now, your kids & grandkids will thank you for doing this.
We’ll get y’all back safely into the Holocene Optimum in no time.
When all else fails, as inferred from your thE-M-E phrasing —
Then just remember this much:
*This is not the End of this World, It’s just the End of You-Fix-You* [your civilization]
You can do this, Dr. Beeton, just keep your doctoral beet on Dr. Strangelove …
Learn from How [he] learned to stop worrying & love the bomb [that Thermageddon]
Know that your true Friends don’t let Friends join the *Great Extinction*
Read The Book*, Be(come) A Believer, & speak no more of {NCA-NAS-NASA-IPCahCah-ARgh5}
— RLW, Prof. A. Friend
P.S. If you ask [us], Why endorse Goldman-as-Spengler? Because the original Oswald Spengler‘s Untergang des Abendlandes (Decline of the West / Christendom) is just too darn long (1020 pp. in two volumes, 1918 & 1922) & hard-slogging, even for a dedicated Eco-Fascist Klima-Kulti-Krieger like Potsdam(m)er Rahmstorf.
*Source It’s Not the End of the World, It’s Just the End of You: The Great Extinction of the Nations (2011) by Spengler-(Asia-Times/Hong Kong & NYC-David P. Goldman ISBN-1614122024
Spengler is not a peer reviewed climate scientist. Doesn’t count.
Neither was ol’ Benjamin Franklin, the new-Newton of the 18th Century, a ‘peer reviewed’ natural-philosopher. He had to get his shipboard letters communicated via colleagues in London (where he had operated a swim academy in his youth). The French master-electricians (as the Franks fancied themselves then, but with a cool accent & lots of mark-up) scoffed at the idea that Philadelphia [PA] could host any such ‘Frank-Lynne, B.’; they accused one another (!) of inventing the character (Lynne de les Francs) & composing his English-language narrative accounts for the despised Bretons to publish.
But then, soon enough, the Cathedral Notre Dame & every other important monument-Parisienne was sporting one of those new lightning-rod antennae: Turns out that ‘electricity in the Atmos-[steam-vapor]-Sphere’ was essential, ‘the Law’, not just a cool concept emanating from the GCMs.
But it all worked out well for the obscure Yankee, first among his countrymen in the meteorology & hydrology fields. Virginia’s Th. Jefferson was more the Climatologist, tracking the patterns of seasonal great storms from historical (Columbian) & news accounts in the Caribbean & all up the Atlantic Seaboard). Franklin became a cause-celebré in Paris, where he rounded up French-Imperial support for the American Rebellion (think Marquis de Lafayette et coll.) The British declared him ‘the most dangerous man in America‘, which must have put a smile on Gen. George Washington’s noble visage.
Peer Review was then for over-credentialed mediocrités who required such a social network of Lords & Peers! And has been, ever since.
Respectfully yours, R. L. WHETsTONe, neither-ANON-nor-a-BOT (AI-corrupted)
P.S. Read Goldman-as-Spengler, and don’t Jump (!), help is on the way …
P.P.S. Please do provide the link to your own scholar.google.com profile, so we can admire your gold-starred (by peers!) publications credentialing your relevant works.*
And, in his Gatekeeper rôle:
jrame Feb 16, 2013 — Editor and Editorial Staffs. Beeton, W. and Pham, H. (2003).
Ah yes. 33,900 “peer reviewed papers” based on the now discredited RCP 8.5 scenario from 2018 to 2024. Brilliant job that!
Climate scientists are hiding the sun’s influence on the climate by not making an anomaly for solar radiation at Earth distance.
If climate scientists make an anomaly for TSI at Earth distance and compare it with the Earth’s global temperature anomaly, everyone will understand it is the variation in solar radiation at Earth distance that is the cause of rising temperatures on Earth.
If climate scientists show the sun is the cause of the temperature increase on Earth, climate scientists will no longer receive any research funding for research on CO2.
If you don’t believe me, show a climate study with a graph of Earth’s global temperature anomaly compared to TSI at Earth distance anomaly.
If you don’t find an anomaly on TSI at Earth distance, it is because climate scientists are hiding the sun’s influence on Earth’s global temperature.
Climate science is also hiding the suns influence on the surface. They pretend that W/m² must equal W/m² heating the atmosphere. Here are 4 graphs that I have never seen discussed. Where is the curiosity. BTW, the data is from the USCRN station at Manhattan, Ks.
Funny. The second IPCC summary report concluded that there was no detectible human signal in the data. Enter a politician and the summary was changed stated a clear and unambiguous human signal. The science reports were force to change from that point on.
No, it did not. Try finding any such statement anywhere in the Assessment.
“El Niño kicking in, but still cooler than 2024.”
Let’s go back exactly seven years, to September 2019:
https://wattsupwiththat.com/2019/09/04/uah-global-temperature-update-for-august-2019-0-38-deg-c/
What were people saying then?
“August 2019 UAH temperature anomaly is below the August UAH El Niño years of 1998 and 2016.”
“The UAH satellite data clearly shows that there has been a cooling trend in GLAT from 2016 to present day (both by individual data points and by the 13-month running average).”
“ If a cooling or flat trend should likewise follow the 2016 warm spike, then CACA will be well and truly flushed down the drain.”
We have the same thing happening now with 2024, and people here will almost certainly be saying the same stuff during the 2028–29 La Niña following the 2026–27 El Niño.
🙂
Ugh, no more La Niña for at least a decade, please.
-Regards, the Western USA
+1
Look at the confidence the commenters on WUWT had in the UAH data set back then. Not a word about its validity, precision or methods.
Just so long as UAH suggested a hint of cooling (which, as we now know, didn’t transpire) not a single question was raised about its legitimacy.
Compare and contrast that attitude with the comments above. Will UAH be the next data set to be thrown under the bus by WUWT, like BEST was before it, because it gives the ‘wrong’ answers?
Exactly!
“ Will UAH be the next data set to be thrown under the bus by WUWT, like BEST was before it, because it gives the ‘wrong’ answers?”
Maybe, but I doubt it, because Anthony Watts has had a relationship with Roy Spencer that goes back a long time. And remember, skeptics tend to have a major loyalty component to them.
So they really have no choice but to watch the utterly relentless warming taking place. It must be pretty hard to watch.
Oh, I thought the world had already been obliterated by a super massive ultra el nino. Maybe I’ll finish my drink, take a walk in perfect weather, and enjoy the rest of the month with the same. It helps letting go of failed legacy news also.
Yes, he actually did post this, or was his account hacked?
“If I was young enough, I would invest in a coconut palm farm on the north coast of Alaska”
— Dr Roy Spencer, last (un)seen driving NNW out of Nashville TN
The new Monckton Pause remains at 43 months now starting in 2023/02. The average of this pause is 0.55 C. The previous Monckton Pause started in 2014/06. It lasted 107 months and had an average of 0.21 C. That makes this pause 0.34 C higher than the previous one.
+0.1578 ± 0.041 C.decade-1 k=2 is the trend from 1979/01 to 2026/08 covering 572 values.
+0.0535 ± 0.055 C.decade-2 k=2 is the acceleration of the trend. [1]
[1] Regarding acceleration. In the process of converting my model to use RONI I realized I screwed up the acceleration causing it to be underestimated by 50%. I also upgrade the analysis of the acceleration to use the more robust HAC model for the uncertainty computation.
“Error Error Zero”
“uncertainty computation”
Snort, glad I was not trying to sip any coffee while reading this.
That’s an amazing model, bdgwx.
Lol…in the process of fixing my R code I somehow typo’d the round function parameter and now I really do have 1 too many digits. For once the significant figure police really do have a legitimate gripe about the figures I posted above.
You are under arrest for violating the significant figure law.
The Earth was subjected to the gravitational pull at the time of aphelion July 6, 2026. This caused the Earth’s orbit to take a closer path after aphelion, causing higher solar radiation this fall and higher global temperatures.
If the Earth’s orbit moves closer to the Sun this fall, the Earth will increase its speed and cause perihelion on January 2, 2027 to be further from the Sun than normal due to the higher speed. The greater distance at perihelion on January 2, 2027 will cause less solar radiation and colder January, February, March, and April 2027.
Do you do Tarot readings too?
I see the changes in the Earth’s orbit on the TSI at Earth distance anomaly.
Have you looked at the TSI at Earth distance anomaly curve?
The month of September is likely to be record warm due to the solar radiation being so high now.
Correct. Plus the eccentric parabolic orbit alters with the position of other planets plus the sun orbits the barycenter. Using a mean orbit hides all this.
The sun is also not a constant temperature. There are lots of variables in the solar physics of which we do not have a clear understanding. So let’s just assume an average temperature.
One must also take into account that Terra and Luna are a binary planetary system.
The center of gravity orbits the sun.
The two planets orbit the center of gravity.
This affects incoming solar energy, too.
Too many averages of averages of averages computed to a gadzillion decimal places for any of it to be credible. Even the accurate parts are made incredible by the processes.
Oh no, the maca[ca]-RONI conversion.
Your beloved ‘Model’ will never make sense again.
The Fake Lord? The Fraud Monckton? Give us all a break. He’s a liar and only has degrees in the Classics and journalism. Nothing in science. And nothing published in scientific journals.
When I lived in Yorkshire as a grad student he was doing his first job as a reporter for the local newspaper, The Yorkshire Post.
Incidentally, is it just me or is this site having problems with it’s RSS feeds over the last day or so. Possibly related to it constantly checking the browser every time it’s loaded.
Well if you stopped linking to here from your facebook profile it mightn’t take so long.
I am getting the same checking message every time I open the site. I use DuckDuckGo as my browser and don’t use any social media of any kind.
Been recent, last few days.
Then again, the Cyber World War has flared up in recent times.
Seems to be OK now.
It’s been a very mild summer in New England. Zero Atlantic hurricanes for the season to date. I just jinxed that, so hold on to your hats!
Remember the Twins of ’54 (Carol + Edna) …
… 72* years of Good Luck, due for an October Surprise.
If the value is a running mean of a 13 month period the present value must be the average centered on last February so comparing average results for August should be a comparison for February. The change however is an indication of the effect of dropping August 2025 and adding August 2026 to the mean so in this sense it can be taken as an August 2026 effect.
If I am incorrect please tell me what I am missing.
The monthly value quoted, +0.68C, is not the 13-month period. It is the August 2026 temperature anomaly; the difference between August 2026 and the average of all August temperature anomalies in the 30-years between 1991 and 2020.
The running centred 13-month average is the previous 13-months’ anomalies (all months from August 2025 to Aug 2026, centred on Feb 2026). That value is not stated on Dr Spencer’s update chart, but for what it’s worth, it is currently +0.45C.
Replacing last August with this August; exactly correct.
No matter what they may say about you.
Hurricanes

Hurricane LOWELL is moving westward and is expected to miss Hawaii.
Thanks for this GIF[t] animation.
The Tropical East-Pacific is a fluid-dynamical Wonder-Land.
“I can almost see Mauna Loa from my Cabo Cabana!” the Swedish dwarf-gnome [never] said.
P.S. Updated projections:
Lowell’s track is projected to hook around Kona, a hard rightward (northward) turn.
Ka[t]rina & Maria entrained. Norberto winding up behind those old girls, in the wings.
Polo (Marco) by the Equinox-Autumnal, why-so-ever not? Cathay-bound.
————
Closely related: wettest rainy-season ‘Monsoon’ (since ’22) in the Desert-Mountain Southwest. Rio Colorado flowing wild thru its Grand Canyon & the Havasupai homelands, en route to replenish the big Mead Reservoir / Hoover Dam.
Hurricane Karina is approaching Hawaii along the 20th parallel.

Gorgeous!
How this portrays an unfolding scenario of awesome & terrible beauty.
Give Lowell [now 150 mph] just another ~ 12 hours, to start its hard-right turn twd Oahu.
(My married son & his bride reside on its North Shore.)
Karina should glance that shore from an orthogonal direction, a few days after.
Maria (the mother of El Niño, naturally) looks like a gentle giant, at 100 MPH, her outflow should water the thirsty Southwestern Deserts for the entire week.
Give Norberto another full week gestation.
Polo-(Marco)-by-Equinox, it’s not impossible for it to traverse the entire Pacific along 20N, as we saw from the past couple years.
Lowell is not heading toward Hawaii and is moving westward. The high-pressure system will now be in the middle of the Pacific, while the lows are moving down the west coast.

nhc.noaa.gov
‘Key Messages’ at 11:00 PM Hawai’i Standard Time,
NHC projects that ‘Lowell’ should complete its
sweeping right turn by 08:00 (Sunday morning),
heading NNE (not NNW) in the direct of Oahu.
By +60 hours from now, its projected center at
21.1N 162.9W, < 500 km due west of Honolulu, 130 MPH
No
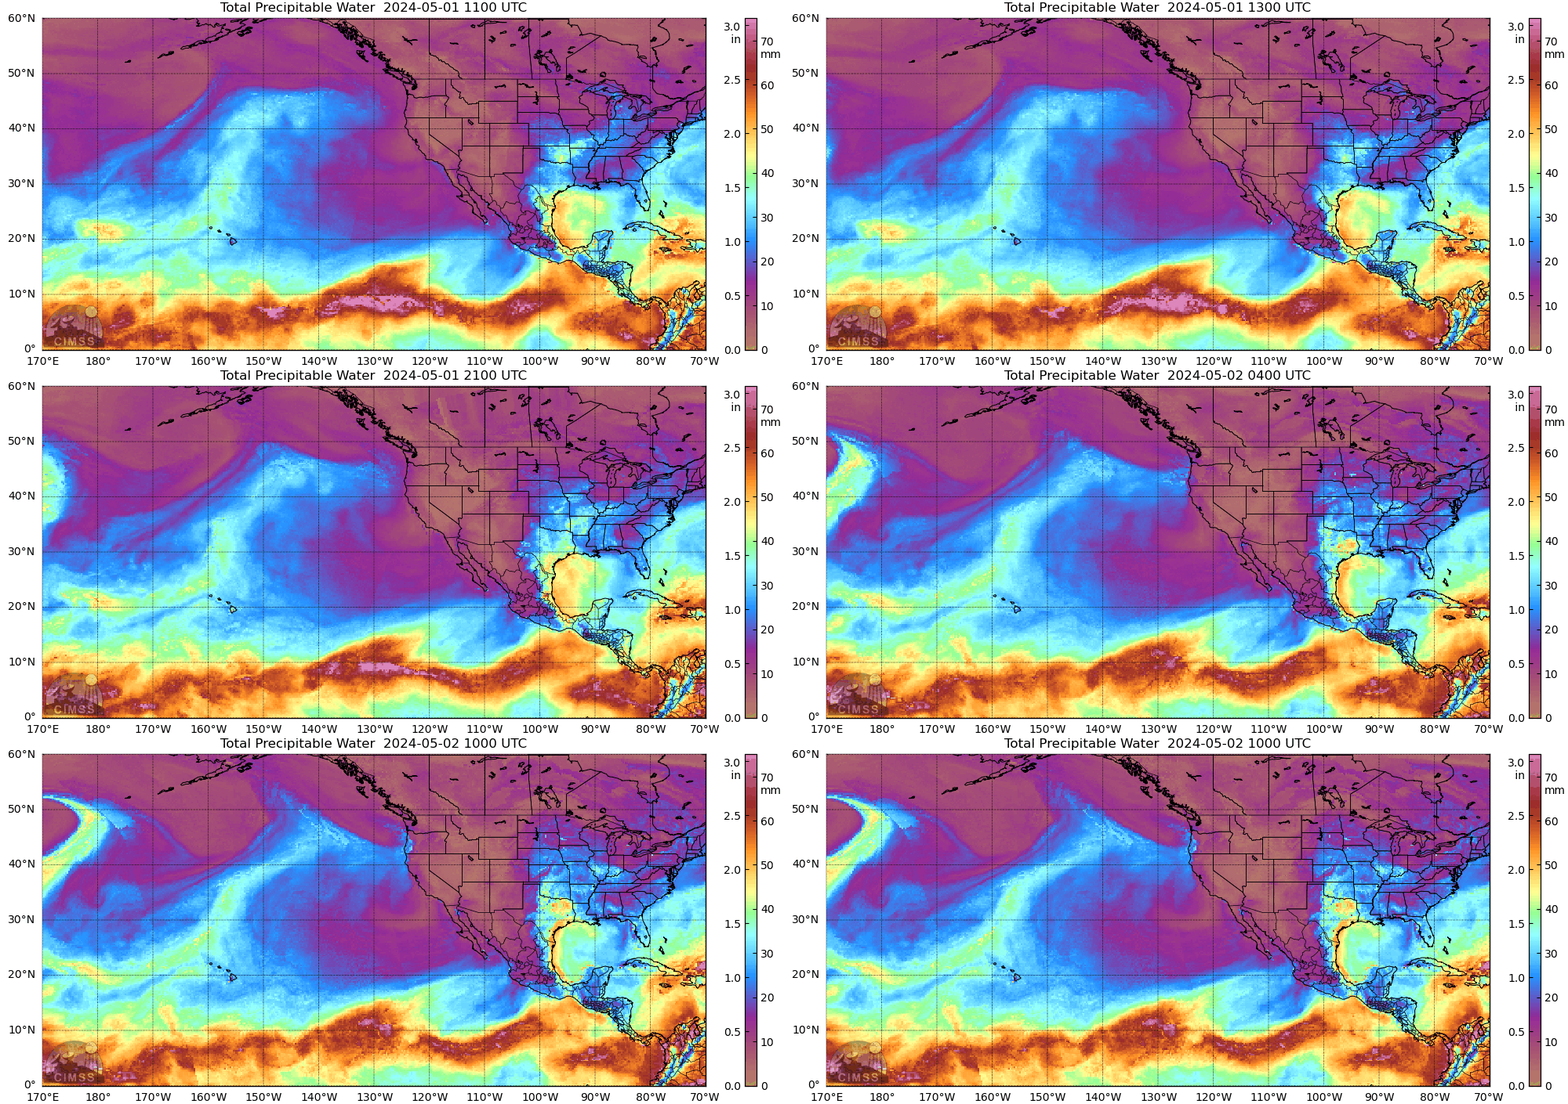
Oh YES … Kauai under Tropical Storm Warning by Late Monday (+24 hrs from now)
Karina is turning northwest and moving away from Hawaii.
Good for planet earth (where the only actual climate dangers are global cooling and CO2 starvation), bad for the political struggle against the exactly-backwards “too much CO2 is causing dangerous global warming” alarmists.
Hurricane Marie has a very wide area of impact.

Hurricane Marie may be intercepted by a jet stream loop from the north.
This paper presents an overview of gridded surface solar radiation data sets currently provided by Deutscher Wetterdienst which are suitable for a wide range of specific applications.
Table 1, Table 2 show the details and the main properties of all data sets in a summarised form. Some quantitative comparisons are shown in Figs. 3, 4 and Table 3 for the five climate data records and for their common time period and region. Overall, the data records agree reasonably well concerning climatology, time series of monthly anomalies and their linear trends during 1995–2020. The mean SSR is ∼124W/m2 with lowest values in HYRAS and highest values in SARAH (Table 3). The slightly lower values in HYRAS are primarily driven by the reliance on SSR (pyranometer and SCAPP) and sunshine duration measurements. For the common period there is a significantly positive trend of about +4 W/m2/decade in all climate data records considered.
https://www.sciencedirect.com/science/article/pii/S2950630125000250#fig0004
Quic-Arithmetic:
(+4 W-m^(-2) per decade) X (2.5 decades) => +10 W-m^(-2)
… as a ratio (120 + 10) / (120) => 13/12
… fourth-root of which is (13/12)^(1/4) =1.02
Multiply by (1.02)(285 K) =290.7 K
So the temperature of the absorbing surfaces should increase by ~ +5.7 C, all other things being equal, which they never are.
————
Brightening skies (here comes the sun!) should herald the end of an era, per this poetic lamentation —
“O Wehe, Deutschland! … Ein finsterer Himmel zieht herauf…”
— from Klaus Mann’s 1934 Mephisto: Roman einer Karriere [Mephistopheles: Novel of a Careerist]
Free translation (by RLW, not AI):
“O Woe be unto Germany, A Darkening-Sky (Cloud) blows thereupon…”
No clouds and aerosols (condensation nuclei). Or could this be happening on a global scale, with surface-level radiation also increasing in other parts of the world? Why is there a lack of reliable global data on direct solar radiation at the surface?
Could be, I agree: “this be happening on a global scale” or pan-European at least
Germans keep the best records (4 data-sets, including DWD, in this one), as one learned at the Wannsee-Villa.
It could add up to something, if they throw in the Scandinavians, the Swiss & Austrians & Czechians, a few Poles & Italians, plus the French & Low Countries (BeNeLux), and the few Estonians, St.-Petersburg, the Suomi & their Lapi-landers.
Offering below the complete passage from Michael Mann’s Mephisto-Mee: Mein-Klima-Kareer-Kampf (1936, Comic-book Edition 2026) Ch. 8 (Der Klimawende / My Climate Transition) ends as a haunting prophetic sentiment:
Rendered as
Cause no-one says Deutsch like the Pennsylvania Dutch–Mann.
Check the News today (Oh Boy!), to find that …
… he (Doktor Mann, Mikael) is more Faustian now — as a Nov.-2026 Elections / Court-Destroying Advocate — than ever he was before, in his youthful days as a Blade-Runner (Hockey-Stick Fabulist).
We hope to return to this THEMA, early (< 45 days) within the coming (8) weeks, to explore further the Goethe’s character Faustus-Mannius-Maximus, vs. Mann (Vater Thomas) vs. Mann (Sohn Klaus) vs. our Mann (San Michele / Holy Micha-El, the Arch-Angel from Hell).
Jasone Arday-(may his troubled soul find Requiem-in-Pace)-as-Fabulist had nothing on Mephisto-Me-Mann of Klima-Katastroph-Karriere infamy.
Yet the Jas-One [R.I.P.] has passed on, while the Mephisto-tempted Faust-Mann strives (strebt) ebenso Our Lives (unser Leb[t]en) to control-er-destroy, in true Faustly fashion.
Alinsky-as-Satan-disciple had nothing on this Behold-the-Mann (Ecco Homo, auf Lateinisch).
Oh Mark Steyn, O Our Brother, where art Thou, in this moment of Despair. If you can hear our Cry, our Song, then please respond this night. It’s a War of Spirits (ein Geisterkrieg) out there, and we’re in great danger of losing it.
youtu.be/bd7gKnYSZxI?si=a03Fg0fWtPTB7NNM
“Our Mika was a Rolling Stone, 1972”
It was this 3rd-of-September
This Day we’ll always Remember
[ Yes! We will! ]
‘Cause that was The Day our Mikah Died!
We never got a chance to meet Him …
… never heard nothing, but-bad-things about Him
Oh Mama we’re depending on You
To tell Us the Truth!
[ She just hung her head & cried …]
‘Your Mikah was a Rolling Stone [my Son]
Wherever he laid his Hat was his Home
And when he Died … all he left us was Alone’
[with his Legacy of Lies]
Oh Mama, Is it True, What They Say …
… That Mikah never worked a Day …
… in His Life?
He never was much on thinkin’
Talkin’ bout Save the World …
But all the time a-Leachin’
Drownin’ in Debt, & Stealing
in the Name of the Lord-Science
[…]
Posted for future reference.
I’ve not had time to fully “digest” the attached graph, and this article is about to disappear from the WUWT home page.
As always your ability to create cool and useful charts and graphs is top-tier.
Hurricane Lowell remains far from Hawaii, but it could bring heavy rainfall to the islands.
