By P Gosselin on 11. January 2026
Frigid tempertures have gripped Central Europe and the population ist struggling to stay warm. Media say it’s all part of warming!

Frigid weather grips Germany. Symbol photo by P. Gosselin
Nine days ago I warned that such junk science would soon be reported. We can’t have people questioning the climate dogma, now can we?
Germany’s online Frankfurter Rundschau (FR) just published an article titled: “Why the cold winter is no evidence against warming.”
The article explains why severe winters in Germany do not contradict global warming. The core argument lies in the distinction between weather (short-term events) and climate (long-term trends). That of course gets ignored by the media when there’s a hot summer day.
Experts, the FR reports, emphasize that a single cold winter is merely a statistical fluctuation, while the global trend points upward. “Weather is what you see outside; climate is the statistics over a long period of time,” the FR reports. “A cold winter does nothing to change the long-term warming trend.”
A warm Arctic produces cold Europe temperatures
Moreover, the Frankfurter Rundschau reports that there are meteorological explanations for extreme cold phases despite global warming: a weakening polar vortex, fueled by Arctic warming, that can cause icy polar air to surge further south. “The Arctic is warming about four times as fast as the rest of the world,” writes the FR “This disrupts the jet stream and allows cold air masses from the north to penetrate our regions more easily.”
The Arctic IS NOT warming 4 times faster then the rest of the world…that’s total BS.
Everyone knows the Arctic is only warming Twice as fast as everywhere else…in fact every place is warming twice as fast as everywhere else.
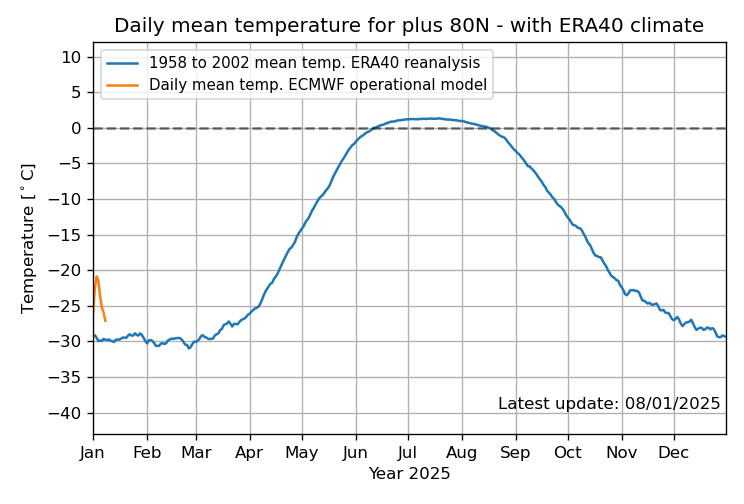
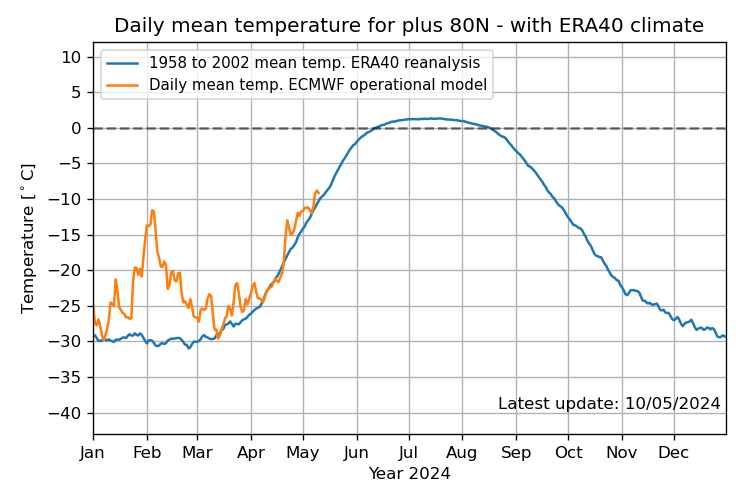
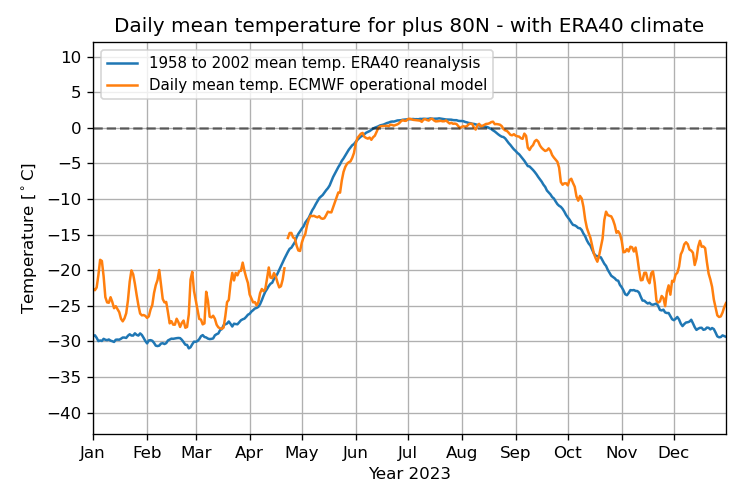
In fact the Arctic shows ZERO warming over the Arctic Summer as evidenced by the DMI graph for 2025. All the warming only shows…sporadically…during Arctic Winter when here is no sun above the Arctic Circle
2024
2023
2022
ZERO warming during the Summer Melt Season
And in 2026 that orange line will be closer to the 2022 orange line.
The Arctic will not warm above 0C during the summer until much more sea-ice is gone.
For why?
The temperature of melting Ice is ….. 0C !!
Why would you expect air that is advecting over a surface at a temp of 0C to be anything other than 0C?
When a tipping point is reached whereby there is enough open water to allow warmer air to ingress into the central Arctic then it’s average summer temp will rise above freezing.
You don’t understand what ice does. It insulates. As more ice free sea is exposed, more heat will escape from the Arctic ocean. This is basic physics.
Your ‘tipping point’ is however completely unscientific. If this mythical tipping point existed, it would have been passed during the roman and medieval warm periods. It wasn’t, therefore it doesn’t exist except in the minds of alarmists and their faithful followers.
Mr ZigZag I most certainly “understand what ice does”.
A “tipping point” is absolutely scientific … remove enough sea- ice and reveal the arctic ocean below and it will both release some of it’s “heat” and absorb solar. When enough ocean is open, then that is fed back to more ice melt.
Just basic thermodynamics.
Whilst the central Arctic is mostly ice then the above graphs will continue to show summer temps at OC – just basic thermodynamics again. All solar energy that isn’t reflected goes into the LH of melting/evaporation and hence uses the advected air’s “heat” to do that very thing.
so of course Banton’s blatent BS anti scientific clap-trap would explain why the vIkings lived in Greenland and now it appears they find a massive Roman villa in Margam South Wales….
must have been a FREEZING South Wales in 1st-2nd century AD, eh?
According to Banton, ….cos the earth has always had his nonsense “tipping points” and ice free alps….”sarc.
“so of course Banton’s blatent BS anti scientific clap-trap would explain why the vIkings lived in Greenland and now it appears they find a massive Roman villa in Margam South Wales….”
And what’s that got to do with central Arctic summer temps not being able to rise above 0C with present sea-ice extent?
Pray tell?
Have you taken into a cont the low elevation of the sun in the Arctic summer meaning that most of the Solar energy is reflected rather than being absorbed?
Care to comment on the Holocene Thermal Optimum, when the Arctic was ice-free in Summer?
True but not why central arctic temps are constrained to near 0C in summer currently.
We all know (?) that the sea heats the atmosphere (on a global scale) – It does.
And it follows on that snow/ice also cools the atmosphere.
SSTs are taken as the 2m temp for the global climate series and snow/ice being at 0C is also the ~2m temp of air passing over it.
TheHCO?
Again what has that to do with the central Arctic not being able to get past 0C in summer currently?
Anyway in the HCO with summer-sea ice absent then of course temps would rise above 0C – commensurate to the SSTs in the Arctic Ocean at the time.
“We all know (?) that the sea heats the atmosphere (on a global scale) – It does.”
Globally yes, but not locally. Nearly all heat in the Arctic ocean comes from currents carrying tropical water, heated almost entirely from sunlight, north. Should ice cover decline in the Arctic, IR from water will increase but there is very little water vapor or clouds there to intercept it so most goes to space, unlike lower latitudes. So long as global cloud cover continues to decrease as it has for the past several decades (see climate4you.com) tropic water will warm more, Arctic water will warm more, ice will decline and IR lost to space will increase. This is just another example of the principal that on this planet, because of our oceans, nature abhors extremes as it always has and always will.
“Nearly all heat in the Arctic ocean comes from currents carrying tropical water, “
Yes indeed, point is those warm currents don’t arrive at the ice edge at “tropical temps”.
It is air that we are talking of, as that is what is measured at 2m, and after crossing over open water then travels over 100’s of miles of ice at 0C (max) to get as far as the NP.
AI Overview
Average summer surface temperatures over Arctic sea ice hover around the freezing point (0°C or 32°F) primarily due to the physical process of latent heat of fusion, which acts as a powerful temperature buffer.
The temperature of the ocean water directly beneath the Arctic sea ice in summer is consistently near the freezing point of seawater, around -1.8°C (28°F). This is because the process of melting ice absorbs heat energy, which keeps the surrounding water temperature stable at or just above its freezing point.
While large areas of the Arctic Ocean that become ice-free in summer can warm significantly (sometimes to as much as 12°C in marginal seas like the Barents Sea), the water directly in contact with existing sea ice remains very close to the freezing point due to the thermodynamics of the ice-water phase change.
Also because the atmosphere over the Poles is less high it makes it easier for energy to escape to space.
Actually the graphs show summer temperatures between 1.5°C and 2°C
The line just below the top temperature curve is 0°C (freezing)
It is, but the area considered is within the 80 deg N parallel which includes some land and open water …..
Yes small portions of the northern end of Greenland and Ellesmere Islands sit above 80°N where the DMI measures temperatures however the temperature on the Arctic Ocean Ice Pack also reaches temperatures above.freezing during the Arctic Summer or “Melt Ponding” wouldn’t occur on the Sea Ice…but it does?.

Given that sea ice is very salty 0 degrees Celsius is not going to result in melting or freezing.
It takes quite a long time for ice to melt due to thawing, especially if the ice is thick. We all know how long it actually takes for ice to disappear when it thaws. Sometimes weeks.
Hmmm….open ocean releases a lot more IR heat to the sky above than does ice and snow, mostly because water is obviously much warmer than snow and ice that can easily drop to -20C during the cold nightime, notably quite long above the Arctic circle.
In the 8-14 micron atmospheric window, about 80% of that IR makes it to outer space, unless blocked by clouds….So in not a very long time…you end up with less heat in the “system”…which is going to result in cooler temperatures, snowfall, and ice buildup somewhere else…. within the time frame of a weather front passage or two…Personally I don’t see a tipping point with anything modern humans can do to the climate. The tipping point that can occur… already occurred about 15000 years ago, the cause of which we understand only vaguely.
The ‘Albedo Amplification’ hypothesis is poorly supported. As I have demonstrated [ https://wattsupwiththat.com/2016/09/12/why-albedo-is-the-wrong-measure-of-reflectivity-for-modeling-climate/ ], specular reflection off water exceeds the visible-light reflectivity of snow and ice. The light reflected from snow is much less sensitive to the angle of incidence. The water only appears dark because one has to be in a unique position to observe the specular reflectance. Additionally, nominally, there is no sunlight above the Arctic Circle for about half the year. That means that the process you are talking about does not function for about half the year. The other half of the year the sun is low on the horizon, resulting in high reflectance for glancing angles.
Correct.
You do realise that much of the last 10,000 years the Arctic was a lot warmer than now, don’t you ??
Then it cooled into the LIA which had too much sea ice for many aquatic sea creatures to stay there.
Still very cold up there , isn’t it.
btw…. “Tipping point” is bogus AGW propaganda language.
Again nowt to do with why Summer 2m temps in the central Arctic are constrained currently to 0C by the present extent of the sea-ice.
They weren’t always constrained..
It used to be a lot warmer up there, with far more sea life.
The LIA drove that all out. Only now is some starting to return.
If there was a “tipping point” it was when the sea ice was totally frozen over during the LIA.
Thank goodness for a little bit of natural warming since then, hey !!
Tree stumps found far to the north of the current tree line.
Wots that got to do with current summer emps in the arctic?
It’s back to the HCO again, which we know was warm due the extra ( max of) ~100 W/m2 of TSI impinging 65 deg N.
Putting 2 an2 together, I would suggest that said tree stumps grew during that period of exceptional summer insolation in the high NH latitudes.
Was there any tipping point when those trees lived far to the north of the current tree line?
I don’t think that tree stumps ‘grow’… at least, they don’t on my acreage.
When will there be much more sea ice gone? I have been hearing this nonsense for ever. Ice extent has been stable for almost 20 years now in the Arctic. If anything it’s growing. There have been periods since the LIA where it’s be even lower than today and many periods during the Holocene where it’s been ice free totally. Your simplistic view of the Arctic it quite simply not based in the reality of a complex system that has external heat in puts.
“Your simplistic view of the Arctic it quite simply not based in the reality of a complex system that has external heat in puts”.
My “simplistic view” is just a basic meteorologial process.
Yes, indeed folks you cannot expect to stand on a central Arctic ice-floe and have the wind in your face to be any other than the temp of the ice you’re standing on.
Please tell how it could be otherwise?
“Yes, indeed folks you cannot expect to stand on a central Arctic ice-floe and have the wind in your face to be any other than the temp of the ice you’re standing on.
Please tell how it could be otherwise?”
Hmm, well, the sun does heat the air, and the heat from the sun reflected off the ice could, I imagine, heat the air above the ice. Hence the numerous pics of bikini-clad ski bunnies.
“Hmm, well, the sun does heat the air, and the heat from the sun reflected off the ice could, I imagine, heat the air above the ice. Hence the numerous pics of bikini-clad ski bunnies.”
No it couldn’t, as reflected solar is SW, to which the atmosphere is transparent.
You are embarassing……
“There have been periods since the LIA where it’s be even lower than today and many periods during the Holocene where it’s been ice free totally.”
During most of the Earth’s history since its formation, there has been no ice at the poles, not just for parts of the Holocene.
The summer temperature in the arctic has been (measured) rising above Zero for decades. The 1958-2002 mean curve shows the average temperature in summer of around 2°C, sufficient to form freshwater melt pools on top of the ice…which appear yearly.
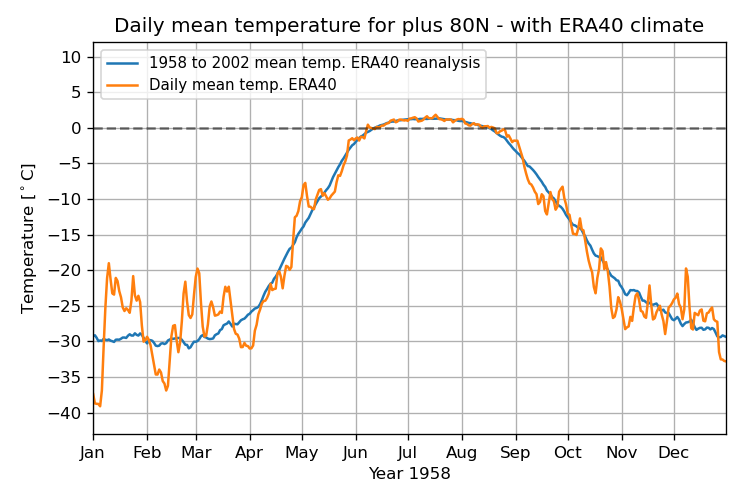
Even back in 1958, when the DMI started gathering data, the summer temperature was still around 2°C and the winter experienced relatively warmer temperature spikes
Answered above (80N icludes some open water and land).
To which I responded…
Yes small portions of the northern end of Greenland and Ellesmere Islands sit above 80°N where the DMI measures temperatures however the temperature on the Arctic Ocean Ice Pack also reaches temperatures above.freezing during the Arctic Summer or “Melt Ponding” wouldn’t occur on the Sea Ice…but it does.
With the accompanying WIKI article image
It’s pretty clear, and has been for several years that all Arctic seasons, apart from summer, are well above the mean (at least for as long as the record exists). For anyone who believes that this fact doesn’t sporadically impact on the Polar Vortex, or jet stream, well then they’re demonstrating ostrich like behaviour! Whether this is caused by the burning of fossil fuels or not, I don’t pretend to be qualified to comment.
The artic warming amounts to about an additional four one-hundreths of a degree, compared to the general warming of the Earth. How will this impact the Polar Vortex or Jet Stream?
How would that work? What is the mechanism?
That’s a very interesting point. However, the way you’ve expressed it is misleading! The Arctic of course represents a pretty small percentage of the Earth’s surface anyway so if course Arctic warming will, by definition be very small fraction of the whole.
So, let’s turn it on it’s head! Because the Arctic represents a small area, warm air masses from more temperate climes will make the region all the more vulnerable to warming. It’s well known for example that the Barents Sea has been consistently and significantly lower than average on sea ice cover every winter, for the past several years. There’s reasonable evidence that this phenomenon aids the development of blocking high pressure systems to form in the region. This in turn can cause episodes of unusual cold over continental Europe, while at the same time bring unseasonal warmth to the N Atlantic as far north as Iceland and well into Greenland. Following from this, those regions can then follow suit and be more likely to develop blocking Highs. The process interrupts both the jet stream and the polar vortex.
Again, I stress, that I’m not qualified to comment on whether this is simply a natural variation in climate or something caused by the burning of carbon based fuels with the resulting build up of CO2 and other so- called greenhouse gases.
Suggestion to you about your Fact, is it just possible you have the cause and effect reversed? Neither you nor anyone like you with simplistic views of a very complex system have any idea what a Fact is or isn’t. Just the last 10,000 year of the arctic environment invalidate almost every nonsensical comment you and others here make, not to mention the last 250,000 years or more. You look at 30 years of satellite records and you suddenly know all.
“Just the last 10,000 year of the arctic environment invalidate almost every nonsensical comment you and others here make..”
Like I said above, much of the last 10000 years were very different vis the Earth’s orbital eccentricity, during the HCO FI, the TSI at 65 deg N was ~ 100 W/m2 greater than now. WHich is why it’s became a climate optimum.
It is you that are making irrelevant comments not pertaining to the current conditions.
My point in reference to the graphs at the top relate to the cooling effect on an airmass travelling over the Arctic sea-ice as heat is extracted from the boundary LYR via the LH of melting and sublimation/evaporation (until the air becomes saturated and likely forms fog).
This is a straightforward and well understood process. I have no idea why anyone would take exception to such a reasonable explanation! And yet, the downvotes predominate – more ostriches, I suspect!
Even more downvotes – I’ll take that as evidence that the ostriches still have their heads in the sand 🙃! To be honest, anyone who downvotes well understood explanations of basic meteorology, I would fully expect to also downvote anything that doesn’t chime exactly with their own scientifically unsupported views. Therefore, I welcome those downvotes. By simply pointing out observed recent climatic trends, the downvotes proliferate. I think I might even be disappointed not to receive downvotes😅
By simply pointing out observed recent climatic trends, the downvotes proliferate.
Weather trends are not “climate trends.”
I’m talking about trends over the last few decades, therefore climate trends!
I’m not surprised at all. Certain denizens will call black white in order to come back at anyone expressing facts which are inconvenient.
Absolutely not true! I’m comparing synoptics from, for example winter 1963, with synoptics of more recent winters. It’s also the case that I am no way challenging anything that happened prior to the record of recent warming. The only thing that I have commented on, is observations of Winter Arctic warming in the last few decades. Please don’t infer anything else. I have been at great pains to not give any opinion at all about whether this is human induced or whether it happened in times past. The observations I’ve made are factual and the disturbances these changes can have on periodic blocking high pressure systems are well documented.
Yes the Dark Dead of Arctic Winter has been warmer. But only Mind numbing cold instead of bone chilling cold. Still well below freezing to allow for ample winter sea ice growth though
Would it be better for life on Earth if we had been cooling for the last 150 years? Warmer is better.
What madness is this? I’ve simply been pointing out what has been observed. At no point have I even hinted at giving an opinion, bad or good 🤔
Stop reading inferences into the pretty straightforward comments I’ve made. In many ways I can see advantages to a warmer world. Equally, I would be cautious about the impact of a changing climate. More CO2 could also be a good thing – greater crop yields etc. I don’t really have an opinion on any of this. Simple observations is all I do, as well challenge some of the ostriches 😅
I didn’t say you had expressed an opinion. I merely asked a question. You do seem concerned about warming, though.
If “all Arctic seasons” are “well above the mean,” then the mean would increase, reducing the difference. So you need to define your terms, instead of using vague comparisons like “well above the mean.”
And given that until very recently the various datasets for Arctic weather were fragmented and only now do we have a more-or-less complete picture of merely 33 years of weather observations, I’d say the weather record is pretty short to make any definitive statements.
https://ic3.uit.no/news/arctic-weather-dataset
I actually made that point myself in a previous article – the record is very short in the whole scheme of things, agreed! 👍
My initial comments on this thread, however were to do with how periodic blocking High pressure cells and associated impact on the jet stream can be triggered by a warming Arctic. This isn’t controversial and IS well documented. The recent cold weather over continental Europe and UK was ARGUABLY, caused by one such system. The Arctic has been warming, this is fact, again not controversial. I have no opinion on why this is happening.
Hi. Mr Ostrich here. The Polar Vortex in conjunction w the jet stream is not impacted by what happens at the poles at all..If it does please inform us of the mechanism.
I explained the process in my earlier post. High pressure systems on the Arctic margins cause blocking features in the atmosphere and divert the jet stream. It’s a very well known mechanism. Sometimes Arctic warmth can completely split the polar vortex, which can cause a dipole. Again, this often causes continental Europe to experience much colder the normal weather. A warming Arctic is obviously going to have an impact on patterns such as these, as our high and low pressure systems are driven by relative cold and warm air masses. This is pretty basic stuff!
There has been an increase in cloud cover over the Arctic Ocean since around 2000, which has slightly lowered the mid summer mean temperatures, but has increased temperatures in other seasons.
If everything is evidence of AGW, then nothing is. If climate changes and arctic warming weren’t happening, then what would it look like? Would weather be the same for a thousand years straight? A hockey stick with no blade?
That is why the name Anthropogenic Global Warming was changed to Anthropogenic Global Climate Change. Any change is thus Anthropogenic and we need only to seek an explanation appropriate to the new title. Neat trick huh?
But a ‘trick’ nonetheless.
There is no Null Hypothesis in Climate Scientology. Therefore there is no science in Climate Scientology.
Absolutely. The more man-made heat, the warmer it gets. Not much, but measurable. Noticeable in increased minimum temperatures.
Of course, nothing to with any mythical GHE, as it is well known by anyone who is not gullible and ignorant that adding CO2 to air does not make thermometers hotter.
So? The Green -Blob tried to sell the Texas
February 2021 storm as being consistent with global warming.
Yeah, I was snowed in for a sodding week by effing global warming!
And wind and solar had nothing to do with the grid nearly crashing! Just listen to the Green Blob gaslighting!
Yep, that is the propaganda line they are now trying to push.
I’ve seen it several times recently.
Cooling is caused by Warming.
I wonder what they will come up with next 😉
War is peace.
That’s the new ‘Trump Doctrine’
Except in Ukraine, of course.
More stupid people protesting proves their greater intelligence.
These are mostly unemployed people, who were sucking from government tits, are now sucking from NGO tits to go out and demonstrate.
They are hoping prior federal payments to government programs get restored, so they do not need to demonstrate anymore in the cold and get pepper-sprayed by ICE; somewhat of a tough gig.
My 24-year-old niece is one of these nutcases. Recently graduated in “Psychology” from an $80,000 per year University, could not get a job at an NGO, tried bar tending, at which she failed, lives at home with her parents, is out demonstrating about “anything-against-Trump”
See the sign she’s holding? It’s professional. It cost money. The “unemployed” protester is PAID. If your niece is not being paid to protest, she’s really dumb, because all the other protesters are in it for the money.
Yes, the signs take time to design and money to print. Yet, they show up predictably shortly after the ‘trigger’ (pun intended) event.
Looks like there is a “.org” in small letters at the bottom and maybe a small logo at the bottom right.
Totally paid for..
something “resist.org” (looks like)
Thanks for confirming my suspicions about anti-Trump protesters. Few if any if these young people have full-time jobs since they can turn up midday during the working week.
Funny how people who have never been to Venezuela know more about what the people there want and need, than do the people who actually live there.
Then again, socialists always believe they know more about you then you do.
In a poker “tournament” where random cards are dealt to the players and new games are started once a previous game is completed, statistical analysis can be interpreted to show that losing is caused by winning…and vice versa.
Very similar to the “cooling is warming” meme.
Zero-sum game.
And there it is: An hypothesis that cannot be falsified–Karl Popper, we need you again.
Holdren warming.
It’s one Ehrlich of an excuse…
Here a few comments to debunk this nonsense
2025 was the second-warmest year on record, globally and four of the five warmest years on record have all occurred since 2020. So the ‘grand solar minimum’ doesn’t seem to be having much of cooling effect.
Those charts show extent data, not area, and they available as monthly csvs here.
Between 2012 and 2025, annual Arctic sea ice extent reduced at a rate of -0.22 million km2 per decade, a total reduction of ~0.3 million km2 of sea ice.
The month of minimum extent, September, reduced also, but at a slower rate (-0.10 million km2 per decade). You have selected a single day from 2012 and compared it to a single day in 2025 and simply ignored everything else.
You will also see from the NOAA sea ice extent link that December 2025 saw the smallest December sea ice extent in the satellite record.
You must be wearing the temperature during Northern hemisphere summers when the Sun is closest to the Earth in solar inertial motion (SIM) induced by the gravitation of large planets https://en.wikipedia.org/wiki/Barycenter_(astronomy).
But this is now being overridden by the reduction of solar radiation caused by reduction of solar activity even during maximum of cycle 25, this GSM (2020-2053) has started (see the blogs taken from the media and linked on https://solargsm.com.)
Grand solar minimum is here as there were heavy snow and frost reported even in the summer in the Northern hemisphere (Canada: Alberta, Calgary; US: Montana, Idaho and Oregon states in June 2025) and Southern hemisphere (South Africa, 22-23 September 2024; Australia, Canberra, 1-2 December 2025).
The reduction of terrestrial temperature will prove that despite the Sun is getting closer to Earth owing to SIM and heating more the Earth and other planets, if its activity is reduced, the temperature on Earth is getting also reduced. Nothing to do with CO2 or any GH gasses, juts orbital motions of the sun and earth https://solargsm.com/the-modern-grand-solar-minimum-2020-2053-versus-global-warming/. For the next 30 years the temperature will be dropping giving people a chance to prepare for the next round of global worming after 2053 caused by the solar inertial motion.
We have heard all this before. Remember David Archibald, anyone?
Based on upcoming solar cycles he made this prediction here at WUWT back in 2011:
“For the next thirty years odd, temperatures will be at mid-19th Century levels.”
(David Archibald, July 12th, 2011).
Since July 2011, according to UAH, global temperatures have increased at a rate of +0.4C per decade – a total warming of +0.6C and about +1.4C warmer than mid-19th century levels.
The sun does not explain the warming seen over the past five decades. Your temperature forecast today is about as reliable as Archibald’s was 15-years ago.
Since 2011 there has been two strong EL Ninos
They are the only warming in the UAH data.
They are the reason for the calculated “trend”.
No evidence of AGW in the whole 46 years..
No-one can forecast El Nino events more than even 4-5 months in advance.
I wonder how much further the temperature decay from the 2023/4/5 El Nino event there will be.
Since 2011 the trend in the ENSO Index is 0.0C per decade. The trend in UAH since 2011 is +0.4C per decade warming.
ENSO does not explain the warming trend.
The drop in albedo due to decrease in clouds, causing increased solar absorption, total explains the warming.
It’s the sun! No, it’s ENSO! No, wait, it’s the clouds!
“It’s the sun! No, it’s ENSO! No, wait, it’s the clouds!”
And what exactly do you think provides the energy into the tropical oceans that power El Nino events…
….. Unicorn farts ??
And you still don’t understand that ENSO and El Nino events are related but different things.
You have a lot of learning to do.. but you need to unlearn all the erroneous nonsense you currently believe, first.
image
The Sun explains the warming every 2200 years (Hallstatt’s cycle) occurring over the past 120 000 years or much longer as it has been shown by Zharkova, 2021 https://www.intechopen.com/chapters/75534. It is caused by solar inertial motion. The maximum warming by further 2.5-3.0 C will be achieved in 2600-2700 after which the sun will be returning to the barycentre for another 1100 years.
However, in the next 30 years the main problem on Earth will be little ice age caused by the modern grand solar minimum (2020-2053). We will see more snow and frosts at any latitudes including tropics..
Here is a document showing how this global warming will be overridden by little ice age in the next 30 years https://solargsm.com/the-modern-grand-solar-minimum-2020-2053-versus-global-warming/.
Below is Figure of terrestrial temperature variations versus extra solar radiation (blue dots) sent to Earth owing to solar inertial motion based on the official Sun-Earth distance ephemeris taken from NASA Horizon site.
corrected figure to the previous post
It was the “second-warmest” because the warming trend was broken, at least temporarily.
It may be a relatively small increase in coverage, but it is clearly a multiple-years increase.
It was the second-warmest because 2025 was affected by the La Nina phase of the ENSO cycle, making it the warmest La Nina year on record by a country mile. The long-term warming trend continued unabated.
You’re comparing a single year against the data for all years. Since 2012, annual sea ice extent has reduced at a rate of -0.22 million km2 per decade. Just because 2012 saw the lowest minimum extent doesn’t mean the melting stopped.
Even in September, monthly sea ice extent has reduced since 2012.
Arctic sea ice is within the top 5% or so of the last 10,000 years.
Only a bit down from the extreme highs of the LIA and late 1970s.
There is still one heck of a lot of sea ice up there.
But the lowest extent for December since satellite records began.
Is there not even the slightest possibility that this fact might be affecting current weather events in the northern hemisphere?
In the top 5% or so of the last 10,000 years.
The energy from the El Nino easily explains the drop this last year.
You have already admitted the El Nino effect was totally natural, and is now nearly decayed.
But it has been zero trend since 2007.
And volume has been zero trend since 2011
You’ve run your PIOMAS chart from September 2011 to September 2024 (even though you labelled it 2011-2024), annual minimum volume to annual minimum volume.
You can now add September 2025 to that chart (available for download here as a monthly CSV).
According to the data I downloaded from that site, the rate of decline in Arctic sea ice volume between Sept 2011 and Sept 2025 is ~500 km3 per decade and the trendline is now visibly downward.
Don’t forget to update your chart!
Interesting that one EL Nino year can make such a difference, isn’t it.
Its already starting to recover.
Right, so you’ll update your chart?
We won’t be seeing the out-dated one you posted above again?
Thanks for confirming the absence of a long-hterm downward trend!
Yep, one year does not make a trend.
Especially when that year is related to a strong El Nino event.
Indeed. But a piece is a part of the whole, and all that.
As it happens, the addition of 2025 to the PIOMAS data does add a distinct downward slope to the PIOMAS data if you start it at 2011.
So no doubt you will update your chart and we can all move on.
You’re welcome, but you seem to be confused.
The data I posted shows a downward trend.
That’s only from 2011, which was the start point chosen by the other poster. If you go further back, the long-tern rate is faster still.
Are you sure about this? September Sea Ice extent has been consistently above the 2012 minimum extent. And in 2025, the September turnaround was earlier than normal and well above the 2012 minimum. Or maybe we’re at cross purposes here?
‘Minimum extent’, is a value based on a single day, not the entire month.
Here is a link to the monthly sea ice extent data.
You will see that, on a monthly basis, September sea ice extent has been on a downward trend, even since the record minimum extent recorded in 2012.
It is a low trend compared to the other months (-0.01 million km2 per decade) but it is downward nonetheless.
I plotted all the years from 2012 through to 2025, on the NSIDC tools feature. I was hoping to be able to include the image but can’t for some reason. Suffice to say, all years show extent for the whole of September to be greater than that of 2012. So, I’m not sure how the data you refer to is being presented?
Ah well, seem to have managed to get the image through after all – I do surprise myself sometimes with how I manage to do these things, despite old- timer ineptitude 😅
Just for fun post -> in the short term day-to-day-situation –> according to ERA5 it seems like we are just touching/around 1947 temperature-anomaly for Jan 6 in 1947. (And we are also around 2005 for Arctic for this date -).
Grey highlighted line=1947
Red line=2026
https://climatereanalyzer.org/clim/t2_daily/?dm_id=arctic
So everything is caused by global warming.
So what?
The point that is not addressed is, has CO2 got anything to do with it?
And the further point is, that irrespective of what is happening, or what is, or is not, causing it, is it worth destroying civilisation in a vain attempt to stop it?
Net zero will destroy the West far faster than climate change could.
We desperately need more CO2 ppm to Increase flora and fauna, and reduce desert areas, and increase crop yields per acre to better feed 8 billion people.
Net Zero by 2050 in all cases is a wasteful, super-expensive suicide pact enriching/empowering governments and the wealthy, while impoverishing all others.
For UAH, NoPol and Globe slopes for the last 20 years, I get.
NoPol 0.3063 Deg. C / Decade
Globe 0.2605 Deg. C / Decade
Not quite a factor of 4.
When did you start and finish your calculations?
In the last 20-years (240 months, Jan 2006 – Dec 2025) I get +0.32C per decade warming in UAH global versus +0.37C per decade warming in UAH NoPol.
I agree that there is nowhere near a factor of 4 difference, but your figures look way off.
Last 20 years have been subject to two solid NON-AGW El Nino events
Zero human causation.
UAH NoPol shows these events very clearly
image didn’t attach
The thin gray lines are the linear regression lines, and that is where the slopes are derived from. Perhaps I should put that in the description, however this is a C# Desktop app of mine, so there could be problems, and definitely room for improvement and I appreciate the feedback.
And on the time range of the slope calculation, it just runs linear regression on the last 240 months.
It’s just weather.
During the worst days of the Dust Bowl in the 1930’s, with all the record heat that was involved, there was also record cold in the United States in 1936.
This did not happen because the climate was changing, it happened because of how the Jet Stream was configured. In the case in 1936, a high-pressure system caused record hot weather for the central and western United States, while at the same time, the Jet Stream brought cold weather into the eastern United States. Kind of the way the Jet Stream is working now. The central U.S. is experiencing rather warm weather, while the northeast U.S. is experiencing cold weather being brought in by the Jet Steaam.
Nullschool:
https://earth.nullschool.net/#2026/01/12/1100Z/wind/isobaric/500hPa/orthographic=-101.90,39.08,381
What was the temperature in the arctic back in the 1930’s. About the same as today.
Reference, please.
News flash: We finally have the definitive proof of climate change folks-
Climate change results in rare hybrid bird between green jay and blue jay: Study | Watch
In addition to other logical fallacies, the Climate Liars are masters of the art of the Strawman. But just to be safe, they have to add on some more of their bogus science to try to Climatesplain something. Stay classy, Climate Liars.
“Applied to a Party member, it means a loyal willingness to say that black is white when Party discipline demands this. But it means also the ability to believe that black is white, and more, to know that black is white, and to forget that one has ever believed the contrary. This demands a continuous alteration of the past, made possible by the system of thought which really embraces all the rest, and which is known in Newspeak as doublethink.”
— George Orwell; 1984
Of course the bitter cold outbreaks in the northern hemisphere in winter are always due to changes in the polar vortex allowing Arctic air to move south and the Arctic to (temporarily) warm, ever since the earth was formed. Indeed, disruptions of the polar vortex can allow warmer air to enter the Arctic and escape to space, partially regulating global temperatures. None of this has to do with “global warming” (since a temporarily warming Arctic as above can cool the earth) or “climate change,” which is what articles like these are daftly implying.
The polar vortex needs to be seen in conjunction w the jet stream. They are tied to the hip. Id say the jetstream is primarily responsible for where the effects of the polar vortex occurs..
Yes, when the (stratospeheric, > 10 miles altitude) polar vortex is less stable in Arctic winter, this allows the (tropospheric, < 10 miles altitude) polar jet to produce incursions of Arctic air southward.
Aggregating the multiple news reports on the subject of warming climate over the past twenty years leads to the inescapable conclusion that EVERYWHERE is “warming faster than the rest of world” – which is impossible.
Aren’t the serious cold spells of north America caused by a strong polar vortex? But in Germany apparently by a weak polar vortex. Funny lot those Germans.
It’s the jetstream..
Yes, a single cold Winter does not define a trend. However, several in a row is a whole different thing! Before berating someone for pointing out an event that bucks the trend, perhaps they should wait to see what the future brings.
NYC has such strong tenants rights in nearly 1 million rent controlled apartments that they can’t pass along “green” improvements or other costs to renters:
https://www.foxnews.com/opinion/mamdani-sides-tenants-new-york-landlords-get-crushed-rigged-housing-laws
Then where is the incentive for landlords to improve the housing, let alone even maintain it?
This will DECREASE the amount of rental accommodation available.
AMO and Arctic warming is normal during a centennial low in solar activity. Rising CO2 forcing according to their global circulation models should be strengthening the polar vortex.
10.3.5.6 Annular Modes and Mid-Latitude Circulation Changes – AR4 WGI Chapter 10: Global Climate Projections
The expression “tipping point” is too often used by those that know not the meaning.
Sometimes it is used as a metaphor, but almost always as a scare tactic.
So, if the Arctic ice disappears, as it has done in the past, given the trans-reality alarmist definition, we would never see arctic ice again. How many times has Arctic Ice disappeared?
The 2019 IPCC Special Report on the Ocean and Cryosphere in a Changing Climate defines a tipping point as: “A level of change in system properties beyond which a system reorganises, often in a non-linear manner, and does not return to the initial state even if the drivers of the change are abated.”
Much like feedback is abused and heat is abused, not to mention “climate pollution”. It’s a long list.
How much ice/snow/cold will make the Climate Botherers happy?
Which arbitrary time in the earth’s history is the reference point for what the Earth’s climate should be?
It’s the same old story for the mainstream media and climate alarmists: when you’re losing the battle, pull out all the stops to salvage at least a fragment of the original argument. Here we see it again. They won’t concede that such weather is simply a part of the natural annual climate fluctuations; instead, they have to attribute it to the man-made and mythological climate crisis. Except they should rest assured that such variations won’t affect the increases in fossil fuel use and carbon emissions. Nor will it hasten any adoption of renewable and unreliable energy sources, or reduce air travel, or cause a decline in red meat consumption, or call for a demand in mass transit funding or inject new life into EV sales, etc. People have learned long ago how to handle weather changes; it’s only the alarmists who want them to start panicking.
Heads I win tails you lose. Nothing the mainstream media says means anything to me. Weather or climate it doesn’t matter one cold day can kill you that is why it is so important to have affordable, reliable, dispatchable power. Fire up all fossil fuel and nuclear generators, build new fossil fuel and nuclear generators, remove all wind and solar from the grid. Do all of this and you will have little to worry about whether it is hot or cold.