Honestly, I never thought I’d see the day. To quote Mr. FOIA from ClimateGate, “A miracle has occurred.”
Yesterday’s release of the DOE’s A Critical Review of Impacts of Greenhouse Gas Emissions on the U.S. Climate is a watershed moment in the ongoing debate over climate policy in America. Why? Because for the first time, a major U.S. government agency—on official letterhead and with a blue-ribbon cast of authors (John Christy, Judith Curry, Steven Koonin, Ross McKitrick, and Roy Spencer)—has published an open challenge to the central claims, data handling, and even the motivations behind mainstream climate science and policy.
This isn’t just another technical report. It is a systematic rebuke of accepted climate “wisdom,” and it does so with unusual clarity, scientific rigor, and (at times) a sense of humor often absent in climate documents. Most importantly, it directly confronts the exaggerated and politicized rhetoric that has dominated headlines for decades.
The Executive Summary from the DOE web page:
This report:
- Reviews scientific certainties and uncertainties in how anthropogenic emissions of CO2 and other GHGs have affected, or will affect, the Nation’s climate, extreme weather events, and metrics of societal well-being.
- Assesses the near-term impacts of elevated concentrations of CO2, including enhanced plant growth and reduced ocean alkalinity.
- Evaluates data and projections regarding long-term impacts of elevated concentrations of CO2, including estimates of future warming.
- Finds that claims of increased frequency or intensity of hurricanes, tornadoes, floods, and droughts are not supported by U.S. historical data.
- Asserts that CO2-induced warming appears to be less damaging economically than commonly believed, and that aggressive mitigation policies could prove more detrimental than beneficial.
- Finds that U.S. policy actions are expected to have undetectably small direct impacts on the global climate and any effects will emerge only with long delays.
What Makes This Report Unique?
- Official Status and Author Independence
Unlike think tank white papers or “dissenting” journal articles, this report comes from within the federal government, under the Trump administration’s DOE. Yet the authors assert full independence—no editorial oversight, no political vetting. It’s rare to see scientists of this caliber (with backgrounds at NASA, IPCC, and major universities) allowed to directly challenge prevailing policy narratives with government resources behind them. - Comprehensive Critique, Not Just a Narrow Rebuttal
Rather than focusing on a single point of controversy, the report systematically evaluates everything from CO2’s physiological role in plant growth, to climate sensitivity estimates, to the track record of climate models, to the real-world impacts (or lack thereof) on extreme weather and U.S. agriculture. Each chapter is loaded with extended quotes from peer-reviewed literature and clear explanations of scientific uncertainty and model error. - Explicit Address of Policy Missteps and Economic Risks
Most uniquely, the report doesn’t stop at “science.” It details the economic costs of climate policy—especially the social cost of carbon modeling games and the virtually undetectable impact U.S. mitigation will have on the global climate. This is a rarely admitted fact, buried in most government assessments but here discussed openly and at length. - Direct Critique of Media, IPCC, and U.S. National Climate Assessments
In one chapter after another, the report highlights the misuse of worst-case scenarios (RCP8.5), the prevalence of “publication bias” in alarming ocean acidification studies, and the outright neglect of positive CO2 impacts like global greening. The report does not hesitate to call out “systemic misuse of scenarios in climate research” and points to specific agencies and news outlets responsible for propagating misleading claims.
My List of the Eight Most Important Findings in the Report
- CO2 Is Not a Conventional Pollutant and Has Direct Environmental Benefits
Unlike actual pollutants, CO2 has no toxic effect at ambient levels, is essential for plant life, and has caused global greening—a fact barely acknowledged in IPCC summaries. - “Ocean Acidification” Fears Are Overblown
Oceans are still alkaline, and changes in pH are within natural variability; most ocean life evolved under much lower pH. The report exposes publication bias and lack of reproducibility in many alarming acidification studies. The Great Barrier Reef is currently thriving. - Climate Models Consistently Overestimate Warming
Most climate models run “hot,” overstating recent warming at the surface and in the troposphere. Data-driven climate sensitivity estimates are lower and more constrained than model-based ones, challenging the high ECS values used to justify drastic policy measures. - No Evidence for Increases in Most U.S. Extreme Weather
U.S. historical data shows no long-term upward trend in hurricanes, tornadoes, floods, or droughts. Claims of worsening disasters are unsupported by observations; fire trends are largely due to land management, not climate change. - Sea Level Rise Is Not Accelerating Dangerously
Global sea level has risen about 8 inches since 1900, but regional U.S. sea level trends are dominated by local land movements, not acceleration from climate change. Tide gauges do not show alarming acceleration. - Attribution of Warming to CO2 Is Far Less Certain Than Claimed
Natural variability, incomplete data, and significant model uncertainties make attribution of observed warming and extremes to human CO2 emissions tenuous. Solar variability may be underestimated in mainstream assessments. - The Social Cost of Carbon (SCC) Is Largely Arbitrary
SCC estimates, which drive regulatory costs, are shown to be highly sensitive to model assumptions, with no robust economic basis. The report demonstrates that realistic ECS values and updated economic inputs lead to much lower SCC estimates. - U.S. Emission Reductions Will Have Negligible Impact on Global Climate
Even extreme U.S. policy actions will produce climate changes too small to detect for generations—an inconvenient truth almost never discussed in mainstream policy or media reports.
Here is a Breakdown of How the Report Challenges Mainstream Climate Science
CO2: Pollutant or Plant Food?
The DOE report begins by demolishing the notion that CO2 should be treated as a conventional pollutant, as regulated under the Clean Air Act. It cites OSHA exposure limits (5,000 ppm—orders of magnitude above outdoor levels) and presents robust evidence from plant physiology showing that rising CO2 enhances growth, improves water use efficiency, and has led to the global greening phenomenon observed by satellites.
Notably, the report details how IPCC assessments downplay or omit this global greening effect, despite its direct connection to rising CO2. Even the IPCC’s own Special Report on Land concluded “with high confidence” that greening has occurred, yet this is absent from summary reports intended for policymakers and the public.
Ocean “Acidification”: A Manufactured Crisis?
The report’s treatment of ocean acidification is a case study in scientific skepticism. It points out that “acidification” is a misnomer—oceans remain alkaline, and pH fluctuations are within historic norms. Life in the ocean evolved under a much broader range of pH conditions. More importantly, the DOE authors highlight the growing recognition of “publication bias”: studies with null or minimal impacts from declining pH are difficult to publish, leading to a skewed scientific record.
A meta-analysis cited in the report finds a strong “decline effect” in ocean acidification impacts on fish behavior: early alarming results are rarely replicated by later, larger studies, which usually show negligible impacts. In short, the “crisis” has been grossly exaggerated in the literature and the media.
Model Failure: The Emperor Has No Clothes
The centerpiece of the DOE critique is the performance of global climate models. The report notes that despite decades of effort and billions spent, model projections have failed to narrow the uncertainty in equilibrium climate sensitivity (ECS). In fact, the spread of ECS in the latest (CMIP6) models has grown wider, not narrower, and the majority of models produce too much warming compared to observations—both at the surface and throughout the troposphere.
Crucially, the report provides detailed side-by-side comparisons of model projections versus observed data (see page 33–37). It notes that only models with the lowest ECS values match the actual temperature record since 1979. The majority of models overestimate warming, in some cases by more than a factor of two.
The report also skewers the widespread misuse of “worst-case” emissions scenarios (RCP8.5) in research and media. It cites analysis showing that the vast majority of climate impact papers used RCP8.5 as a business-as-usual baseline, despite the scenario being grossly implausible and far above observed emissions trends.
Attribution and Natural Variability
The report spends several chapters dissecting the uncertainties around attribution—the attempt to link observed warming and extreme events specifically to human GHG emissions. The authors document the wide range of natural variability (including the still-uncertain role of solar variation), and show that statistical “fingerprinting” methods are often inconclusive or circular. In some key cases, model simulations of vertical temperature profiles and the geographic distribution of warming simply fail to match real-world data—a fact not honestly conveyed in mainstream summaries.
The Social Cost of Carbon: An Economic Mirage
One of the most policy-relevant chapters debunks the “social cost of carbon” (SCC) calculations used by regulatory agencies to justify massive economic interventions. The DOE report shows that SCC values are essentially “made up,” highly sensitive to a few subjective assumptions about climate sensitivity, discount rates, and economic damages. When updated with realistic parameters and best-estimate ECS values, the SCC drops dramatically, sometimes to near zero or even negative (i.e., net benefits from CO2 emissions due to agricultural gains).
U.S. Policy: All Pain, No Gain
Perhaps the most striking section (and one likely to cause heartburn in certain policy circles) comes at the end: the scale of the U.S. impact on the global climate. The report quantifies just how little effect even the most aggressive U.S. mitigation policies will have—using the very models and assumptions of mainstream climate science. The answer: “undetectably small” impacts, appearing only after centuries, if at all. This fact is never honestly presented in the typical policy debate.
Of course, the Media is Panning It
Predictably, the release of the DOE report has drawn fire from mainstream outlets and climate advocacy groups. For example, the ever angry and alarmed, The Guardian wrote:
“Climate scientists have condemned the DOE’s new report as ‘dangerous disinformation,’ claiming it was designed to mislead the public about the risks of greenhouse gas emissions and to justify a rollback of U.S. climate policy. Several experts criticized the report for cherry-picking studies and downplaying the consensus on climate risks.”
LOL. Let’s address these lightweight claims, point by point:
Claim: The report is “disinformation” and “cherry-picks” studies.
Pushback: The DOE report is authored by respected scientists with deep experience in climate modeling, attribution, and atmospheric science—many of whom have published widely in peer-reviewed journals. The report is overwhelmingly referenced, including citations from the very IPCC reports it critiques, and in fact spends entire chapters reviewing both sides of contested issues. The presence of extended quotations from mainstream literature, including detailed reviews of opposing arguments, refutes the idea that it is simply “cherry-picking.”
Claim: The report “downplays the consensus” on climate risks.
Pushback: The DOE report does not deny climate change or human influence. It argues, with substantial evidence, that the level of risk is greatly overstated, that models exaggerate sensitivity, and that the costs of mitigation policies are vastly underestimated. It is not “disinformation” to present documented, peer-reviewed evidence that calls into question apocalyptic scenarios—especially when such scenarios are contradicted by the data.
Claim: The report is designed to justify policy rollbacks.
Pushback: The report’s authors explicitly state their independence and reject any suggestion of political vetting or pressure. They also include dissent and debate within the team. The report’s focus is on evidence, not policy prescription. The fact that it challenges established policy is a sign of its intellectual independence, not its bias.
Gavin Schmidt’s “RealClimate” website barely managed a whimper, starting an open thread, saying:
The EPA, along with the “Climate Working Group” of usual suspects (plus Judith Curry and Ross McKitrick) at DOE, have just put out a document for public comment their attempt to rescind the 2009 Endangerment Finding for greenhouse gas emissions.
I got a real laugh out of one of the four comments so far:
Secular Animist says
The proposed rule to rescind the 2009 Endangerment Finding is an ACT OF WAR against the human species by the fossil fuel industry.
LOL, bring it, you anonymous dork.
My Cold Hard Facts Conclusion
The DOE’s A Critical Review of Impacts of Greenhouse Gas Emissions on the U.S. Climate stands out as a landmark challenge to the status quo in climate science and policy. It is a detailed, referenced, and balanced review—one that will make uncomfortable reading for those invested in climate alarmism or rigid consensus. It doesn’t offer certainty; it offers scientific humility, transparency, and an honest assessment of the uncertainties and limitations in current climate science.
The real “dangerous disinformation” isn’t in this report—it’s in the repeated failure of the mainstream media and science to confront inconvenient evidence, model errors, and the economic reality of climate policy. It’s long past time for the climate debate to embrace the kind of open, skeptical, and evidence-based assessment represented in this DOE report.
REFERENCES:
DOE Report (Main Document)
- DOE, A Critical Review of Impacts of Greenhouse Gas Emissions on the U.S. Climate, July 2025 https://www.energy.gov/sites/default/files/2025-07/DOE_Critical_Review_of_Impacts_of_GHG_Emissions_on_the_US_Climate_July_2025.pdf
Key Peer-Reviewed and Official References Used in the DOE Report
1. IPCC Assessment Reports
- IPCC Sixth Assessment Report (AR6, 2021)
https://www.ipcc.ch/assessment-report/ar6/ - IPCC Fifth Assessment Report (AR5, 2013/2014)
https://www.ipcc.ch/assessment-report/ar5/
2. Climate Model Performance and Sensitivity
- Hausfather, Z., et al. (2019). Evaluating the Performance of Past Climate Model Projections. Geophysical Research Letters 47(1).
https://doi.org/10.1029/2019GL085378 - Scafetta, N. (2021). Testing the CMIP6 GCM simulations versus surface temperature records… Climate 9(11):161.
https://doi.org/10.3390/cli9110161 - Sherwood, S. C., et al. (2020). An assessment of Earth’s climate sensitivity using multiple lines of evidence. Reviews of Geophysics, 58(4).
https://doi.org/10.1029/2019rg000678 - Lewis, N. (2023). Objectively combining climate sensitivity evidence. Climate Dynamics 61, 3155–3163.
https://doi.org/10.1007/s00382-022-06398-8 - Pielke Jr., R., & Ritchie, J. (2020). Systemic Misuse of Scenarios in Climate Research and Assessment. SSRN.
https://ssrn.com/abstract=3581777 - Hausfather, Z. & Peters, G. P. (2020). Emissions – the ‘business as usual’ story is misleading. Nature.
https://www.nature.com/articles/d41586-020-00177-3
3. CO₂, Global Greening, and Fertilization
- Zhu, Z., et al. (2016). Greening of the Earth and its drivers. Nature Climate Change, 6, 791–795.
https://www.nature.com/articles/nclimate3004 - Chen, C., et al. (2019). China and India lead in greening of the world through land-use management. Nature Sustainability 2, 122–129.
https://www.nature.com/articles/s41893-019-0220-7 - Keenan, T. F., et al. (2023). A constraint on historic growth in global photosynthesis due to rising CO₂. Nature Climate Change 13, 1376-1381.
https://doi.org/10.1038/s41558-023-01867-2 - Haverd, V., et al. (2020). Higher than expected CO₂ fertilization inferred from leaf to global observations. Global Change Biology 26, 2390–2402.
https://doi.org/10.1111/gcb.14950
4. Ocean “Acidification” and Coral Reefs
- Clements, J. C., et al. (2022). Meta-analysis reveals an extreme ‘decline effect’ in the impacts of ocean acidification on fish behavior. PLOS Biology, 20(2), e3001511.
https://doi.org/10.1371/journal.pbio.3001511 - Browman, H. I. (2016). Applying organized scepticism to ocean acidification research. ICES Journal of Marine Science, 73(3), 529–536.
https://doi.org/10.1093/icesjms/fsw010 - Australian Institute of Marine Science. (2022). Continued coral recovery leads to 36-year highs across two-thirds of the Great Barrier Reef.
https://www.aims.gov.au/sites/default/files/2022-08/AIMS_LTMP_Report_on%20GBR_coral_status_2021_2022_040822F3.pdf
5. Extreme Weather Data
- NOAA National Centers for Environmental Information (NCEI) U.S. Billion-Dollar Weather and Climate Disasters:
https://www.ncdc.noaa.gov/billions/ - Rutgers University Global Snow Lab:
https://climate.rutgers.edu/snowcover/
6. Solar Influence and Natural Variability
- Connolly, R., et al. (2021). How much has the Sun influenced Northern Hemisphere temperature trends? An ongoing debate. Research in Astronomy and Astrophysics 21(6).
https://iopscience.iop.org/article/10.1088/1674-4527/21/6/131
7. Social Cost of Carbon and Economic Analyses
- Dayaratna, K., et al. (2017). Empirically-Constrained Climate Sensitivity and the Social Cost of Carbon. Climate Change Economics.
https://doi.org/10.1142/S2010007817500063 - Dayaratna, K., McKitrick, R., Michaels, P.J. (2020). Climate Sensitivity, Agricultural Productivity and the Social Cost of Carbon in FUND. Environmental Economics and Policy Studies.
https://doi.org/10.1007/s10018-020-00263-w
8. Emissions Scenarios Critiques
- Burgess, M., et al. (2021). Plausible 2005-2050 emissions scenarios project between 2 and 3 degrees C of warming by 2100. Environmental Research Letters 16 014016.
https://iopscience.iop.org/article/10.1088/1748-9326/abcdd2/meta
Official & U.S. Government Data
- NOAA Global Monitoring Laboratory CO₂ Trends:
https://gml.noaa.gov/ccgg/trends/ - U.S. EPA Criteria Air Pollutants:
https://www.epa.gov/criteria-air-pollutants - U.S. Occupational Safety and Health Administration (OSHA) Carbon Dioxide:
https://www.osha.gov/chemicaldata/183
Additional Useful Reports for Context
- Pielke Jr., R., Burgess, M. G., & Ritchie, J. (2022). Plausible 2005–2050 emissions scenarios… Environmental Research Letters 17 024027.
https://iopscience.iop.org/article/10.1088/1748-9326/ac4ebf/pdf
[snip AI generated spam~mod]
Try to rewrite it in your own words.
so we label as AI everything that hurts you? This is silencing as I have reported many times happening in this platform so that you can maintain you echochamber of propaganda… and you call yourselves supporters of freedom of speech and skeptiks…
The Critical Review of Impacts of Greenhouse Gas Emissions on the U.S. Climate (2025) by the Climate Working Group loses a lot of credibility because it cherry-picks evidence and presents climate science in a really one-sided way. That kind of selective framing can mislead both policymakers and the public.
For example, it goes all-in on the idea that more CO₂ is great for plants, pointing to things like global greening and better crop yields (see Section 2). But it barely mentions the flip side: how climate-driven droughts are already hurting plant growth, lowering crop yields, and even killing forests. There’s solid research on this (like Lesk et al., 2016, and Allen et al., 2015), showing how water stress can cancel out the supposed benefits of CO₂.
The report also downplays major climate risks, like the possible collapse of the Atlantic Ocean circulation (AMOC), brushing them off as unlikely without acknowledging their potentially massive consequences something the IPCC AR6 takes seriously.
It criticizes climate models for being too warm (Sections 5.2–5.4), leaning heavily on selective studies like McKitrick and Christy (2020), but skips over improvements in newer models (like CMIP6) or the role of natural varibility, which weakens the argument.
When it comes to extreme weather (Sections 6.2–6.5), the report highlights that there’s no long-term trend in U.S. hurricanes and tornadoes, but sidesteps clear evidence linking human activity to more heatwaves and heavy rainfall. Just look at the deadly 2021 Western North America heatwave Philip et al. (2022) showed it was made far more likely by climate change.
The report also leans on Connolly et al. (2021) to push the idea that the Sun has played a big role in recent warming, but ignores more up-to-date solar research from people like Chatzistergos (2022, 2024), Krivova, and Solanki. Chatzisergos (2024), for instance, debunked the old Hoyt and Schatten solar reconstructions and showed solar variability has been tiny nowhere near enough to explain the warming we’ve seen.
Its take on the Social Cost of Carbon (SCC) mentions how sensitive it is to assumptions but skips over newer, more policy-relevant approaches like target-consistent pricing. It also overemphasizes the worst-case RCP8.5 emissions scenario and barely touches on more realistic ones like SSP2-4.5, which skews how it talks about future risks.
Claims about urban heat distorting temperature records (Section 3.3) ignore the fact that datasets like HadCRUT5 already correct for that, so it doesn’t really hold up.
Even when talking about coral reefs (Section 2.2.2), the report highlights signs of recovery (like AIMS, 2023), but glosses over real threats like ongoing marine heatwaves (see Woods Hole, 2023).
Finally, the foreword from Secretary Wright frames climate change as a “challenge, not a catastrophe,” which kind of sets the tone for the whole report and makes it feel more like a politically motivated document than an independent scientific review.
In the end, by ignoring major counterarguments, downplaying real risks, and leaning too hard on selective evidence, the report just doesn’t give a fair or full picture and that’s a problem if we’re trying to base smart climate policy on it.
Pure propaganda for a report, celebrated by ignorant people in echo chambers and disinformation blogs.
Perhaps you’d get more traction and more respect if you wrote as clearly as Anthony or Charles or many of the others here, and left the political bile on your kitchen counter.
I have to try like 10 times until they let my posts through… The level of silencing taking place here is unbelievable.
But pal, facts remain facts no matter how much they and the delivery hurt your feelings.
You are so full of it. When I see clearly that it was written by AI I delete it as I’ve told you repeatedly. Maybe some gets through with the other moderators. But generally if you are not using a pejorative against another user, it gets approved.
you have flagged me to require approval with everything I say and you delete the things you don’t like. Remove the option for my posts to require approval if you don’t silence people…
In Nelson’s voice:
Dude, stop being an angry agitator and pay attention to our rules: https://wattsupwiththat.com/policy/
“Everyone who visits here is welcome to post, but please treat your visit like you would a visit to a private home or office. Most people wouldn’t be rude, loud, or insulting in somebody’s home or office, I ask for the same level of civility and courtesy here.”
FACTS? You are delusional.
facts are facts irrespectively of how many of you deny them
Lies are lies irrespective of how many you claim are true.
Science doesn’t really deal with facts- it’s all about data and theories- and those theories often get modified, improved, thrown out, etc. They are never facts. The fact that you fail to understand this shows you have no clue about science yet you call others science deniers. Looks like you are the real science denier. Please list your science education and where you work- and your real name, Mr. Scientist. But you won’t. Cowards always like to hide in a hole.
What you believe to be facts, rarely are.
It really is fascinating how paranoid you have become.
Nobody else has trouble posting. But everyone is out to silence you.
“how climate-driven droughts are already hurting plant growth, lowering crop yields, and even killing forests.”
Where is your proof of this? Grain crop yields are on a 30 year trend of continued record harvests for grains. What forests are being killed? Killed by CO2? What’s the process causing this?
What climate-driven droughts? As the article states: “Finds that claims of increased frequency or intensity of hurricanes, tornadoes, floods, and droughts are not supported by U.S. historical data.”
“possible collapse of the Atlantic Ocean circulation (AMOC)”
Just how possible is this? 10% chance? 50% chance? Without actual estimates that can be tested in the real world this is nothing more than “scary propaganda”.
“clear evidence linking human activity to more heatwaves and heavy rainfall”
What clear evidence? Reference please. How do “heavy rainfall” and “increased droughts” go together? Sounds like just saying what is needed in the moment – even if the assertions are contradictory.
“ignore the fact that datasets like HadCRUT5 already correct for that, so it doesn’t really hold up.”
Those “corrections” are poorly documented and have large internal uncertainties of their own.
“Pure propaganda for a report”
Pisses you off when someone you disagree with plays the same game the climate alarmists have been playing for decades, doesn’t it?
The fact that droughts harm plant growth is well documented, at least with science in the real world. Such things don’t reach this blog to not harm your feelings
And zero reading comprehension. We all know droughts harm plants, but where are the “climate-driven” droughts? I never really bothered reading your comments in context but my lord that one above is as stupid as it gets.
boy you are ignorant for an admin, inline with the ignorance of this place.
https://www.c2es.org/content/drought-and-climate-change/
Oooh, models as proof. It really is amazing just how stupid you are.
no shit that droughts can hurt plant growth- but what does that prove other than droughts hurt plant growth? Try proving that it’s due to human caused carbon emissions. Are you in 8th grade?
CO2 increases temperature, increased temperature leads to more droughts, more droughts harm plants more than more CO2 helps plants. End of the story for plants if we keep increasing CO2… it’s not rocket science pals..
And it’s not what the IPCC says.
But, but, but, increased temperature results in more moisture in the air resulting in bigger and badder rainstorms.
Sheesh.
It’s far beyond rocket science. Rockets are flying. All predictions from those supposed climate scientists predicting disaster, a few decades ago, failed to happen. Their rockets crashed. You have mastered the climate emergency dogma. I’m proud of you. You could probably get a great job here in Wokeachusetts’ state government where they love such “thinkers”.
Now you are just making crap up since the following shows that worldwide Droughts are DECREASING from Nature,
Global integrated drought monitoring and prediction system
LINK
======
Trend is flat over 150 years time.
Long-term variability and trends in meteorological droughts in Western Europe (1851–2018)
LINK
Do you have any evidence that higher temperatures will lead to droughts? According to the IPCC, higher temperatures lead to more rain.
Can’t you alarmists keep your lies straight?
The notion that droughts are caused by a warmer climate is counter factual and illogical. The reverse is true.
Data shows no increase in drought.. FAIL !!
As usual, when caught in a lie, change the subject. The claim was that CO2 was causing the increase in droughts.
Hilarious as your false beliefs are the subject of the Report. Rave on!
I speak truths with facts pal.
there you go again with FACTS
[now I am deleting some comments just for shear assholenss-mod]
but… but… he’s a great scientist trying to enlighten we ignorant science deniers 🙂
In his case, FACTS needs to be in quotations…
Fascinating how you define fact, as any opinion that you agree with.
Not sure why y’all engage with this JK person. He believes what he wants to believe. Facts are facts because he says so. Everything “he believes” is well documented and he won’t explore research (also well documented) that challenges his religion because that requires effort and critical thinking.
Sanity has returned to the debate, which diminishes his relevance. He’s not worth the energy.
It’s like bear baiting, except this bear is totally toothless.
i like that.
That’s for bloody sure!!
Give him the benefit of the doubt. He’s just trolling.
Mr. K: i do wonder if AI is capable of projection on this scale.
I wonder if anyone on this echochamber is capable of critical thinking… So far I haven’t found not even one
Sorry that we’re brilliant like yourself as you bring us FACTS. 🙂
We only have science. Like Steven Koonin and others. But you have facts like the Medieval Catholic Church which had facts, such as the sun rotates around the Earth and that God created everything in 7 days, only several thousand years ago.
The post, as written, includes yourself.
Not even yourself, congratulations!
I wonder if your real name is JoKe.
“So far I haven’t found not even one”
You know that’s a double negative, right?
Mr. Alberts: There you go, teaching Mr. K to count to two. His math skills just increased from a long, flat line (the handle)…….
And now critical thinking is defined as believing everything JK believes.
Hullo J K I think you should take a look at the IPCC’s AR 6 chapter 12 page 90 and consider the chart closely. It shows no observable change in the intensity or frequency of 31 climate metrics in the historical period. Personally I believe only the stats on tropical cyclones. Everything else is too fluffy
Harold The Organic Chemist Says:
ATTN: JK
RE: CO2 Does Not Cause Warming Of Air!
Please go to the late John Daly’s website: “Still Waiting For Greenhouse” at:
http://www.john-daly.com. From the homepage, page down to the end and click on:
“Station Temperature Data”. On the “World Map”, click on a region or country to access temperature data from over 200 weather station located around the world that show no warming up to 2002. These charts of temperature falsify the hypothesis that the increasing concentration of CO2 in the air causes an increase in surface air temperature.
Since I can post only one image per comment, I continue this comment in a second reply.
and of course there would be deniers of the greenhouse effect even… try to explain why Earth is not too cold pal… greenhouse effect, primarily through CO2 is what makes Earth warm enough for us to live here.
The sun and water. Sheesh.
The main green house gas H2O is what keeps the earth warm except in the winter And 71% of the earth’s surface is covered with H2O. Did you go to John Daly’s website to check out all the charts from the many weather stations? Did you read any of the articles?
Now check this out. Shown in Fig 7. (See below) is the IR absorption spectrum of a sample of Philadelphia inner city air from 400 to 4000 wavenumbers (wns) There are some addition peaks for H2O down to 200 wns which are not shown since the cut off the spectrometer is 400 wns. Note the temperature and RH. Only the absorption peaks for CO2 and H2O in the 400 to 700 wn range are involved in the greenhouse effect. Note how very sharp the CO2 peak at 667 wns is. The CO2 molecule are absorbing very little energy. In 1999 the concentration of CO2 at the MLO was ca 370 ppmv. One cubic meter of this has a mass of ca. 1.16 kg and contains a mere 0.635 g of CO2.
The gas cell was an 7 cm Al cylinder with KBr windows. The absorbance of the CO2 peak at 667 wns is 0.025. If the cell was 700 cm (23 ft) lenght, the absorbance would be 2.5 and 99+% of the IR light would absorbed, i.e., the absorption of IR light is saturated.
A major process for warming of surface air is conduction
and convection. The wind is a force for sweeping warm air right at the surface up into the air.
Page down and read my comments to Kip H.re the CO2 absorption saturation effect.
Fig. 7 was taken from the essay: “Climate Change Reexamined” by Joel M. Kauffman. The essay is 26 pages and can be down loaded for free.
BTW: Where do you live? Do you have cold winters?
PS: If you click on Fig. 7, it will expand and become clear. Click on the “X” in the circle to return to comment text.
I was gonna say this is Mosher under a silly pseudonym, but there’s too much punctuation.
And once again, you demonstrate that you either didn’t read the post, or weren’t able to actually understand it.
Mr. W: Funny how he seems so keen to demonstrate it even as he denies it, over and over.
How do you think greenhouse gases produce the greenhouse effect? What empirical evidence are you relying on?
“But it barely mentions the flip side: how climate-driven droughts are already hurting plant growth, lowering crop yields, and even killing forests.”
There are droughts and there always have been- but you wouldn’t know that, being so scientific and all. 🙂
oh boy… am I talking to people who don’t understand even what climate change is… you are so stupid to think that scientists tell us there were no droughts before climate change? are you really? (because that would explain a lot about the low level of this website)
I think what’s happening is evidence of your inability to follow the logic of an exchange, your inability to understand implications in others’ statement, your inability to understand any sort of rhetorical flourish, and just your general inability to engage in any form of opposition argument at all.
I wonder what high school he or she or it is in?
Yet are still here offering NOTHING of value to the rest of us some who have science degrees and others who are of the Milton Humason, Clyde Tombaugh class.
Why don’t you clean the dishes or something…….
This from the clowns who proclaim that every weather event is clearly caused by enhanced CO2.
If you find yourself being perplexed by the position of others being so different from how you interpret the evidence, you might want to consider the possibility that it is you who has the problem. It is my judgement that the IQ and level of academic achievement of commenters on this website is way and above that of typical MSN commenters and probably is one of the most elite group of commenters on the internet.
https://en.wikipedia.org/wiki/Dunning%E2%80%93Kruger_effect
ATTN: J.K. :Windmill construction kills forests by clearcutting and road building. Solar ruins cropland…as long as you’re being scientific and all, just trying to help out here.
And let’s not mention the massive amount of very toxic chemicals used in the production of wind turbines and solar panels, then pumped into huge toxic lakes in China.
And all the avian, land and sea creatures damaged during their use.
And the massive environmental damage in disposing of turbine blades and solar panels at the end of their short unproductive life-span.
“the possible collapse of the Atlantic Ocean circulation”
duh… it’s possible? is that hard science?
If the Earth stops turning.
Man these people believe that CO2 can do ANYTHING.
Apparently those people believe increased CO2 increases THEIR intelligence.
“… skips over improvements in newer models… ”
new and improved? you know for a fact that they are better?
Models that don’t apply data manipulation to force an agreement between sun and temperature are better for sure.
Models that don’t make unfounded assumptions about CO2 causing warming might get somewhere near reality.
The current ones are based on junk science.
The irony, it burns.
Well, they compared it with another model…
😄😆😅🤣😂
Willie Soon/Connolly/Scafetta’s crappy models good, real scientific models bad… I can’t argue with your illogical thinking
Models that support the climate warming nonsense, good.
Models that support reality, bad.
Gotcha.
CHIMP6 shows far more fantasy warming than CHIMP 3 or 5.
Models are getting WORSE, because they are based on fake science and cult-like agendas.
Some people like Ms. J K think models are facts.
“…. sidesteps clear evidence linking human activity to more heatwaves and heavy rainfall…”
Clear evidence? Not really. Heavy rainfall? I thought it was drought you are worried about. So heavy rain and not enough rain are all due to human caused carbon emissions?
you really can’t understand that different parts of the world have a different climate, and increasing greenhouse gases will affect them in a different way… I am mind blown by your ignorance here… honestly…
Everytime an alarmist spouts the supposed dangers of dangerous climate change, I just hear the Passover chant in Hebrew in my head.
but.. but… all that will happen if the planetary temperature goes up and stays up 1.5 C. All really smart people like J K know this. /s
But, but, but, you claim one world climate. Now there is more than one? How inconsistent you babble.
Different parts of the world have a different climate? I had no idea! Thanks for informing me. 🙂
Because you are citing what is an obvious but rarely referenced fact, perhaps you could tell me where you found the information about how the climate change differs in the various Köppen climate classes and the different ways that ‘greenhouse gases’ affect the different Köppen climate classes.
“The magic molecule” causes *everything bad* in the eyes of the Eco-Fascists.
Even things diametrically opposed to one another.
“… solar variability has been tiny nowhere near enough to explain the warming we’ve seen…”
The sun is mighty powerful- even a tiny change would be significant. But you know for a fact that it’s not a contributor to “the warming”.
Science is enabling scientists to measure it… but let’s not disturb your genius thinking… sun big, sun bad…. how can I argue with such geniuses like you.. did you think on your own that the sun is big, or did someone have to tell it to you?
No, I learned about the sun in an astronomy course before you were born, my little grasshopper.
“… threats like ongoing marine heatwaves…”
No doubt they exist and you can prove they are due to human caused carbon emissions? Nobody- is saying there are no floods, droughts, rise and fall of glaciers, rise and decline of sea temperatures. The planet’s features are and always have been variable.
humans have always died of natural causes, how can ever be murder… what an impeccable logical argument, not.
Such a logic fallacy.
Look! Grasshoppers!
hmmm… that makes sense- there has been murder, ergo the planet is endangered by carbon emissions- makes perfect sense! not
And human life span has increased markedly due to the advent of fossil fuels. Not just from the energy availability, but from the myriad of chemicals and products produced using them.
CO2 has helped bring about a huge increase in crop yields to feed this longer living, healthier world population.
You would not exist if there were no fossil fuels.
You whole existence relies on them.
Says the man who assumes that every death is murder.
“the report just doesn’t give a fair or full picture”
Just like how the the mainstream media, academics, bureaucrats and others who’ll stand to benefit from the wind and solar industries’ rising profits were fair about any challenges to the scare mongering?
what an argument…just because some will benefit from renewables let’s deny science so that others benefit from fossil fuels… how about not denying science and aim for as fair transition as possible? I know you are so sold to the idea of giving your money to billionaires from the oil industry that you can’t think of anything else…
No point engaging in a battle of wits with the unarmed. You never know when you have lost.
yup, science deniers… yup, we’re all denying science- despite most here having multiple science and engineering degrees- just ’cause we want fossil fuel companies to get rich- makes sense
No-one except the subsidy scammers benefits from unreliable supplies that disrupt the stability of electricity grids.
Wind and solar are the most filthy and environmentally destructive forms of energy there is…
.. most the huge amount of toxic chemical and pollution used in the manufacture,
… to the environment devastation during installation..
.. the the avian, land and sea creatures destroyed during usage..
.. to the massive pollution and land degradation when they are either dumped in landfill to leach toxins forever or are just left to rot where they stand, an eyesore for future generations to puke at.
Since there is no reason for a transition, why should anyone worry about whether the government thinks it’s fair or not?
Harold The Organic Says:
ATTN: JK
RE: No Warming Of Air in Death Valley.
Shown in the chart see below are plots of temperatures at the Furnace Creek weather station from 1922 to 2001. In 1922, the concentration of CO2 was ca. 303 ppmv (0.59 g CO2/cu. m.), and by 2001, it had increased to ca. 371 ppmv (0.73 g CO2/cu. m.), but there was no increase surface air temperature at this remote arid desert. The reason the was no increase in air is that the absorption of out-going long wavelenght IR light has become become saturated when the concentration of CO2 reaches 300 ppmv. What this means that increasing the of CO2 above 300 ppmv will not result in an increase in surface air temperature.
For more info on the CO2 IR absorption saturation effect see:
https://climateatglance/carbon-dioxide-saturation-in- the-atmosphere.
This is web page at the Heritage Foundation.
https://arixv.org/pdf/2004.00708v1 or https://arixv./abs/2004.0078
The title of the paper is:
“The Saturation of the Infrared Absorption by Carbon Dioxide in the Atmosphere” by Dieter Schildknectht
I briefly scanned the DOE paper and there was no mention of the above paper.
CO2 Update
At the MLO in Hawaii, the concentration of CO2 in dry air is 429 ppmv. One cubic meter of this air has a mass of 1.29 kg and has mere 0.843 g of CO2 at STP.
The Great CO2 Global Warming Scam was started by the IPCC in 1988. It is time to disband this global warming propaganda machine.
Having scanned the overall document and read several sections I can’t help but assume you didn’t actually read the report.
pick a topic I mentioned… I bet you didn’t read my post
nah. not worth the powder.
There would be no loss as you employ the evidence free word salad mixed in with fallacies and every time while you insult many here without cause thus many here think you are a definite programmed moron.
Why don’t you go back to watching your favorite cartoons.
Mr. tommy: His mom says anime angries up his blood, which is bad for a boy in his fifties. Please suggest he go back to Vicki’s Secret pamphlets.
FYI, you need to look at the SOCIAL BENEFIT of carbon dioxide.
The advent and use of fossil has built and continues to build modern civilisation.
There is very little in modern society that would be there or function without the use of fossil fuels.
Every facet of your pitiful existence is there because of fossil fuels..
You could never exist without them.
Did you know that there is no actual scientific evidence that CO2 effects climate in any way whatsoever.
One downside of the development of society using reliable energy from fossil fuels …
… is that it allows completely mindless clowns like you to produce meaningless AI generated garbage.
“showing how water stress can cancel out the supposed benefits of CO₂.”
Which explains why grasslands are penetrating into places like the Sahara.;-)
Increased CO2 actually means that plant need LESS water.
Most of the “climate-linked” claims are made using very FAKE attribution studies, where the result is established before the model runs.
Running one fake assumption-driven model against another fake assumption driven model, IS NOT SCIENCE.
“HadCRUT5 already correct for that”
Yep, by cooling the past ! 😉
If this site were the echo chamber you want to believe it is, you would have been banned a long time ago.
Long posts, just repeating tired lies.
Cope and seethe.
At last!
But I will be surprised if the BBC, or indeed any GB MSM outlet, reports this; but if they do the report will be derogatory.
The report seems simple but detailed enough that even lawyers, especially judges, can understand it.
As the major response will be lawfare, the courts are the intended audience.
The International Court of Justice will choose not to understand it.
Don’t count on any lawyers understanding it. There are still big bucks to be made with the Climate Warming Scam.
and reduced ocean alkalinity.
Tide gauges do not show alarming acceleration.
rising CO2 enhances growth, improves water use efficiency, and has led to the global greening phenomenon observed by satellites.
______________________________________________________________________________
Three items above I copied out for comment
Search shows nothing for Methane and the global warming potential numbers
Reduced alkalinity – – – – Well said
Carbon Dioxide is just as important to life on Earth as Water
Acceleration of sea level rise, a distribution shows it to be tightly grouped around 0.01mm/yr²
A proper analysis would calculate the mean and std deviation of the distribution, accounting for the uncertainties in the individual acceleration parameters. Can you produce that? If so, it would allow judging the significance of the overall acceleration.
Thank you for taking the time to reply. I’m not a leave no stone unturned scientist. I don’t possess the skill or determination. I am a fan of the Duck Test and back of the envelope calculations. The PSMSL produces data for annual values to 4 significant digits. As the chart states, I used the 2nd order polynomial provided by Excel’s
[display equation on chart]
function for trend lines. My non-calculous physics 101 taught me to use
[v2]-[v1]/t=a
and you know what? There was very good agreement with the quadratic via Excel.
Somewhere along the line I heard that a sample size of 30 or more of variable data is likely to yield accuracy to 5 significant places. Was that the “T” Test? Having typed it down, uh five places really? I don’t remember (I have a 1944 DOB), That makes me going on 81.
Anyway, the PSMSL web page is HERE
I can facilitate anything you’d like to email to Dr. Koonin. Just use the contact form to reach me.
Thanks. I’m guessing if he really wanted to carry on with a dialog, he’d show up here. Besides, I wrote all that for everyone to read and respond to if they so desire.
“Somewhere along the line I heard that a sample size of 30 or more of variable data is likely to yield accuracy to 5 significant places.”
Increasing sample size only allows a more precise calculation of the population average. It does *NOT* indicate whether the population average is accurate nor does it increase the accuracy of the population average.
This is also what is taught by blackboard statisticians – not physical scientists. To a blackboard statistician there is no such thing as measurement uncertainty which leads to the assumption that “numbers is just numbers”.
If the sample is made up of measurements then the data should be stated in the form of “estimated value +/- measurement uncertainty”. The measurement uncertainty determines the resolution of any subsequent calculations, including statistical descriptors like the “average”. There is no “5 significant places” unless the measurement uncertainty allows it. E.g. 10,999 mph +/- 50mph is poorly stated. Because of the measurement uncertainty you simply don’t know what the unit digit is. You barely know what the tens digit is. But a blackboard statistician will see no problem in this statement of velocity if the sample size is 100.
Reading a statistics site I bet. Using a sample size of 30 or more to characterize the “accuracy” of a mean value of a distribution requires dividing the standard deviation by the √30 (or whatever the sample size is) in order to estimate what the interval is where the mean may actually be. This is known as the experimental standard deviation of the mean.
One should first realize that a measurement is uncertain and should be expressed as an [“estimated point value” ±uncertainty]. In many cases, the mean of the population distribution of the ’30’ samples is considered to the “estimated point value” of the measurements. The standard deviation of the measurements is the usual calculation. When dividing the standard deviation by the √n, one is attempting to divine an interval surrounding the estimated point value (mean) where the true mean may lay. The more samples there are, the smaller that interval is. Thus one can assume the estimated point value is closer and closer to the population mean.
Here is the kicker, the measurement uncertainty is expressed as the standard deviation of the samples. This is because the dispersion of the measured values attributable to what you are measuring is the appropriate description of the range of values that are possible.
Ultimately the standard deviation and the standard deviation of the sample means are used to describe two entirely different things about a population distribution of values.
The instruction manual for the TI SR-51A calculator offers a way to use n or n-1 weighting for calculating the standard deviation. As I recollect (it may be in Excel) the recommendation is to use n-1 weighting for less than 20 samples.
More importantly, for trying to increase the precision of measurements, one can minimize random errors by increasing the number of measurements. However, all the measurements must be of the same fixed value, measured with the same instrument, and the assumption is that the distribution of those measurements will be Gaussian to justify dividing by √n. Thus, taking 100 measurements will justify adding an additional significant figure to the calculated mean.
“the assumption is”
and it must be JUSTIFIED explicitly, not just assumed implicitly.
“Thus, taking 100 measurements will justify adding an additional significant figure to the calculated mean.”
Not in the real world. You can’t even guarantee that when using actual physical measurement instruments that you will minimize the random errors with an increased sample size. Any measurement device using digital logic circuitry will have a “gray” area between what is considered a one and a zero. What the digital logic circuitry comes up with in such a case is not defined. It may be “random” but is not guaranteed to be Gaussian or even symmetric across readings. This is why it is absolutely necessary to understand the relationship between measurement resolution and significant digits. Even when calculating the mean from a large sample size you can’t add significant digits via averaging.
Actually, increasing the number of measurements doesn’t minimize the randomness of the measurements. It adds more data to the sample means distribution surrounding the mean. Consequently, determination of the estimated mean has a reduced interval where the mean value lays. In other words, it reduces the uncertainty in the estimated mean point value and it is called the standard deviation of the sample mean.
It is important to use correct terminology also. Precision is actually an uncertainty interval that describes how well a given measuring device can provide the same value in repeated measurements of the same thing. Repeated measurements can only better define that category of uncertainty.
Resolution is another category of uncertainty that can not be increased by more measurements. A digital device is illustrative. If a device has two digits of resolution, that is all a final average of multiple readings can have. Calculating a mode for a distribution of measurements is illustrative. Assume a Gaussian distribution. The mean, mode and median should all be the same. The values in the distribution are in the tens and units digits. A mean can be 10.5. What can the median be? If I make an even number of measurements, let’s say I get 10.5. However, if I make an odd number of measurements I will have either 10 or 11. How about the mode? Will I ever get a mode that has a decimal value? This is important stuff in metrology but not so much to statisticians and mathematicians where numbers is numbers.
A way too many statisticians interpret the standard deviation of the sample means as the measurement uncertainty. It is not, it is only a statistic that can be used to illustrate how well the point value of the mean is known. There is still a dispersion (random error) in the actual measured values surrounding that mean. That dispersion is characterized by the standard deviation, a parameter that informs one of the uncertainty in any given measurand.
I don’t intend to criticize your post because I know you have a great appreciation for measurements and their uncertainty. I am using your post to maybe illustrate to other folks that this isn’t a matter of little importance. It can cause things like the Challenger Space Shuttle explosion or bridge failures or high rise building collapse. It can also cause the world to spend trillions of dollars on something that may not be occuring.
Steve ==> Are those Tide Gauges correct for VLM? If not, the acceleration could simply be accelerated downward VLM…..
Kip, good point. According to expert Nils Axel Moerner, there are only about 70 long record (>60 years) tide gauges with sufficiently close dGPS to actually measure VLM. Those show 2.2mm/year and NO acceleration.
If you look at my chart, there were five that were negative six if you don’t throw out Trois Rivieres and there may have been a few in the zero column that were rounded up.
Otherwise interesting observation (-:
There is a huge amount of limestone in the oceans – how could the oceans become acidic? Furthermore, the secrets of the oceans are still not fully known – only in recent times has it been known that there is a 500 mile long salt deposit buried under sediment in the Gulf of America.
Compendium of all ocean surface pH measurements since 1910 shows, if anything, a slight increase in alkalinity.
Wait for it in Europe and Germany.
Great! Now I have to fight with my stupid printer to get this so I can hand it out to some folks. Way to screwup my day, DoE! 😉
Does the DOE offer reprints of this paper for free? They should print a great many copies and send them to anybody and everybody especially Gov. Gavin of NY and Gov. Kathy of NY.
I dunno-can they read?
It’s possible. Pretty sure their offices most likely receive at least the PDF as a USG electronic distribution. Whether they actually read it is the question.
Climate humility? Just when you thought they couldn’t tax anything else…
LABOUR’S NEW QUARRY TAX TO HIKE COST OF BUILDING ANY HOUSE
The Mineral Products Association is this week railing against plans for changes to the Landfill Tax which are meant to come in next year. The “quarry exemption” will be removed under current proposals set out in Labour’s new consultation.
https://order-order.com/2025/07/30/labours-new-quarry-tax-to-hike-cost-of-building-any-house-by-28000/
They need some excuse for the derisory number of housing starts which reflect the high cost of imported bricks now we can’t afford the energy to fire our own, and the costly net zero building standards imposition that has been in place since mid 2023, building homes that are unattractive with few windows etc.
What a pleasure: Science, not “Post-Normal Science” as the Left used to call their politicized fear-mongering.
I think there are very clear lessons in how this has been handled for those in the UK seeking to unwind net zero. Employing a top credentialled red team to debunk the findings of the Climate Change Committee offers the best chance to cement a rational approach. Appoint them to replace the incumbents, and force the BBC to broadcast the outcome and the science behind it.
Some think that simply repealing the Climate Change Act would suffice. It doesn’t: their false narrative must be properly shown up before you attempt repeal.
Moreover, the actual process of unwinding net zero policies is complex. They rely on all manner of stand alone legislation, grid codes etc. and there are contracts and assets we have and assets we have no longer like coal fired power. Just unwinding the CCC doesn’t solve those. But undermining the carbon budgets and interim decarbonisation targets does halt the march in the wrong direction, and can be done with the Climate Change Act still in place.
As soon as Reform UK gets power, we should ask this same committee to do a UK-specific version of this assessment!
“The centerpiece of the DOE critique is the performance of global climate models.”
This rear-view performance assessment is better than nothing, I guess. But the far more important point is that from the very beginning, it should have been recognized that using pre-stabilized, time-step-iterated, large-grid, discrete-layer, parameter-tuned models to apply assumed “GHG” “forcing” scenarios would never have any diagnostic or prognostic authority.
It was a circular exercise all along, posing the models as having embodied knowledge already obtained! NO ONE KNEW, and NO ONE KNOWS NOW, that the end result of rising pCO2 must be to de-rate the longwave emitter to space, so as to require a warmer substrate (i.e. the land and ocean surfaces) to make up the difference.
/rant
Thank you for listening.
So, in essence you are addressing is this.
An energy model with:
CO2 as input.
IR as transfer function
Temperature as output
Use mean earth radius, treating earth as a sphere.
Use 25 km grid and interpolate between lines.
Averaging temperatures.
Parameterize clouds.
Use mean earth orbit around the sun.
Sun is constant.
Fabricate bogus definitions of positive and negative feedbacks.
Treating a photon as a particle.
Redefining words such as thermalize.
About as bogus as they get.
And treating model outputs as data.
Input scenarios are experiments.
And this is the short list.
Scroll up and read my comments to JK. CO2 can’t cause recent any global warming because there is too little of it in the air and the CO2 absorption of out-gong IR light became saturated in 1920 at 300 ppmv.
I did.
Did you see the line: “About as bogus as they get” ?
Nope. I missed that.
A major process for moving surface heat into the atmosphere, up and away is conduction and convection. Have you come across any papers that have a quantitative estimate for this process? I don’t know how to use MS copilot to do searches. The Great CO2 Global Warming Scam is coming to an end.
This NASA article and image estimates conduction + convection from the surface into the atmosphere at 5% of total solar irradiation.
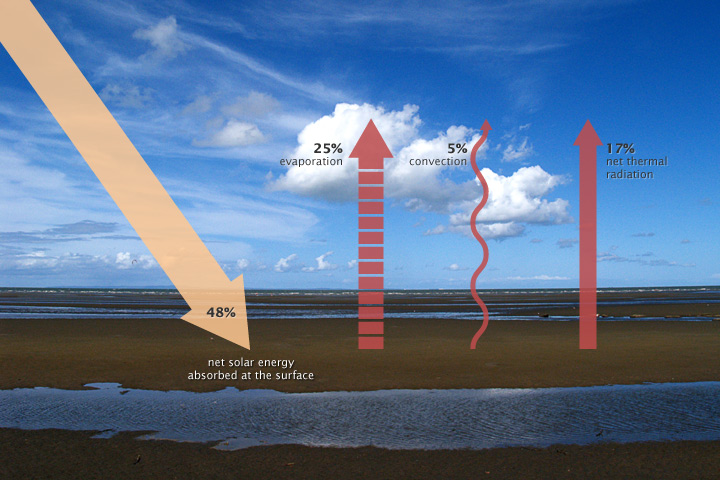 (specific image)
https://earthobservatory.nasa.gov/features/EnergyBalance (web article)
Thank you. The image is really cool. However, it appears that the image is of the ocean. How much warm or hot air right at the surface is swept up by the wind? A sirocco is a hot wind that blows out from the desert.
Shown in chart (See below) from the late John Daly’s website are plots of temperatures at the Furnace Creek weather station in Death Valley. Note the plot for hot summer. This is my favorite weather station because it so remote and the temperature data has not been homogenized and adjusted (and pasteurized!)
I would like to see plot of the annual average temperature from 2002 to 2024, but I do not how to access the GISS data base, down load the data, and plots. If we get lucky and the plot stays flat, then we have empirical evidence that CO2 does not cause global warming. Suppose there is a slight linear rise in temperature. We might use the data to estimate the ECS.
PS: If you click on the chart, it will expand and become clear. Click on the “X” in the circle to return to comment text.
Harold, a numerical answer was provided in response to your question. It represents a global average. You now seem uninterested in it.
Have a good day, sir.
Harold, just launch Copilot and enter a sentence into the box. Type the question as though you were asking instructions or a request from a human librarian. That is, just ask Copilot for technical citations on the specific thing(s) you want to have.
Wednesday Thunderstorm
The Met Office is to provide weather forecasting services for the BBC again, the broadcaster has announced. – The Independent
Featuring the MOs novel virtual (imaginary) weather station network.
Maybe the Met Office will also start creating imaginary storms, flood, and droughts to keep the narrative going.
I hear they plan on awarding the US a brand new level of their infamous “fossil awards”, called the “Galactic Fossil” at COP30. Yeah, we’re bad.
Where can I get one? 🙂
I recall there is a guy who is handing out a lump of coal as a fossil award. If the coal is hard coal, i.e., steel-making coal, I’ll gladly take it.
We Yanks won’t be attending COP30.
Story tip: stiff upper lip
Fury as Labour council approves ‘unsafe’ electric bus garage below high-rise flats
Thousands of lives put at risk by Edgware town centre redevelopment plan
https://www.telegraph.co.uk/news/2025/07/29/barnet-fury-labour-unsafe-electric-bus-garage-below-flats/
Would you like fries with that?
Oh,yes. And crispy strips too…got any sauces availble?
So, the gauntlet is thrown.
Well met!
Now grab a beer and a tub of popcorn. It is going to get really entertaining.
Popcorn with beer? Never! Peanuts are best.
Thanks for the summary.
Officialdom will respond. My acquaintances of the leftward persuasion are passive members of the ClimateCult™ and will not be swayed — even if, by chance, they hear of this.
I urge all here to avoid letting Mr. J hijack another thread.
Let him post comments. We can easily wipe him out! I use the John Daly Offence.
Go check out the website. From the page, page down and click on:
“Station Temperature Data”. On the “World Map”, click on a region or country to access temperature data from over 200 weather stations which showed no warming up to 2002.
Tell the Lefties to go the Late John-Daly’s website: “Still Waiting For Greenhouse” at
http://www.john-daly.com where they can learn CO2 does not cause warming of air. From the home page, page down to the end and click on “Station Temperature Data”. On the “World Map”, click on a region or country to access temperature data from over 200 weather stations which showed no warming up to 2002. The charts falsify the hypothesis that the increasing concentration of CO2 causes an increase of surface air temperature.
PS: If you click on the image, it will expand and become clear. Click on the
“X” in the circle to return to comment text.
The authors seemed to have enjoyed an awful lot of political vetting – no independent agency would ever believe that this who’s who of contrarians represents the leading experts in the fields covered by the report. In fact the authors seem hand-picked precisely because their views align with the politics of the current administration, not because of their scientific qualifications.
1 CO2 Is Not a Conventional Pollutant and Has Direct Environmental Benefits
The SC ruled that CO2 is unequivocally a pollutant under the terms of the Clean Air Act because it meaningfully endangers public health or welfare. Acknowledging that CO2 has benefits for plant growth does not negate the adverse effects from emitting mass quantities of it into the atmosphere very rapidly.
2 “Ocean Acidification” Fears Are Overblown
Yes, the oceans are still alkaline, they are becoming less so, i.e. they are becoming more acidic. This is just idiotic wordplay, no serious person views this as a legitimate scientific argument. The fact that life has evolved under different conditions than exist today does not mean that life is immune to changes in prevailing environmental conditions. This argument is a complete non-sequitur. The Great Barrier Reef is resilient but still in danger from environmental stressors. 2024 saw one of the largest coral bleaching events on record, the impacts of which were only partially captured in the 2023-2024 GBR surveys. The abundance of hard corals also does not necessarily signifiy that the reef ecosystem is in overall great health, as these fast-growing corals are particularly susceptible to bleaching events and other stressors.
3 Climate Models Consistently Overestimate Warming
Some, not most, models in CMIP6 show sensitivities above what scientists expect to be realistic, but overall models have been quite skillful at capturing surface warming trends. Organizations like the IPCC also do not simply rely on the total model spread, but on projections constrained by observations.
4 No Evidence for Increases in Most U.S. Extreme Weather
The IPCC AR6 explicitly reports medium to high confidence in observations of increases in weather extremes in North America, including heat extremes, precipitation extremes, and drought. But importantly, most of the most severe impacts of climate change are not expected to be acute for many years, some not even until the middle or end of the century. It’s not just about what we’ve seen, it’s about what we expect to see.
5 Sea Level Rise Is Not Accelerating Dangerously
The report conflates eustatic sea level with isostatic sea level. Globally, sea level rise is occurring and the rate is increasing over time. The rate of sea level rise during the 21st century has more than doubled relative to the rate during the 20th century. The US is as much at risk of this sea level rise as the rest of the world.
6 Attribution of Warming to CO2 Is Far Less Certain Than Claimed
Flagrantly untrue, the IPCC AR6 reports that the observed 20th century warming trend is unequivocally driven by anthropogenic CO2 emissions. There is no body of scientific research drawing any contrary conclusion.
7 The Social Cost of Carbon (SCC) Is Largely Arbitrary
The SCC is an economic estimate meant to guide policy by evaluating the potential future costs of carbon emissions. It’s a tool, not a forecast. Its utility or variability doesn’t diminish the physical science consensus on the severity of climate change, which is grounded in robust, independently validated research.
8 U.S. Emission Reductions Will Have Negligible Impact on Global Climate
While it’s true that US emissions alone represent only a portion of global totals, the argument overlooks two key points: first, cumulative global emissions determine climate outcomes, and US leadership can drive international cooperation and technological innovation; second, climate policy is not solely about immediate, detectable temperature changes but about reducing long-term risk, avoiding worst-case scenarios, and managing the economic and human costs of inaction. Framing the issue in terms of short-term detectability misrepresents how both climate systems and global policy mechanisms function.
The entire report is either misleading, incomplete, or flagrantly, inexcusably wrong. That such a document, written without any input from relevant subject matter experts (the idea that this handful of authors represent a depth of expertise across all of the domains this ranging report cover is beyond laughable), is being used to justify major regulatory dismantling by the EPA is abhorrent.
The claim that the DOE report cannot be “disinformation” or “cherry-picked” simply because it cites mainstream sources and includes some opposing views is misleading. Cherry-picking isn’t disproven by the presence of references, it’s defined by how selectively those references are used. A document can cite hundreds of studies and still misrepresent the weight of evidence by emphasizing outliers, outdated findings, or minority viewpoints while downplaying the broader scientific consensus. Just by presenting a “both sides have equally valid viewpoints” it reveals an inherent bias. The scientific literature does not reflect deep divisions over fundamental questions around the reality or severity of anthropogenic climate change.
Moreover, the breadth of the report, covering everything from atmospheric physics to economic modeling, raises serious questions about authorship. With only five listed authors, none of whom appear to be recognized leaders across all these domains, it’s implausible that the report meets the same level of expertise and peer scrutiny as the assessments it critiques, such as those from the IPCC or National Academies. Expertise matters, especially when drawing conclusions that contradict the overwhelming body of peer-reviewed science.
The often repeated claim that heatwaves are getting hotter, longer and more frequent is almost fully reliant on studies that commence after 1950. This is the type of cherry picking that you should be calling out. Geoff S
I would say that it reveals an objectivity and willingness to consider alternative hypotheses. Just by claiming that an open mind demonstrates bias, you demonstrate that you believe that ‘science’ is decided by ‘votes.’ That is, you implicitly believe that facts and logic have little weight in assigning veracity and that a hypothesis or paradigm is evaluated by how many scientists stand up when a journalist calls for a ‘division of the house’ and asks how many vote “Yes” on the correctness of a hypothesis.
“Weight of evidence” is a legal criteria, not a scientific one. As Einstein famously said, “Why 100? It takes only one to prove me wrong.”
Since you seem to be so impressed by credentials and don’t approve of only 5 providing their view on correctness, perhaps you would share with us your credentials and why you think that the readers here should accept your criticisms over the 5 that might serve as pre-publication peer reviewers, should you submit a paper for publication. That is, those of us who think that science should only be beholden to the facts, are being logically consistent when we speak on behalf of what we believe to be the facts. You, on the other hand, see the validity of a hypothesis as being a function of who, or how many scientists agree with you, as being the key to the truth. Therefore, we should know your qualifications for commenting, and know how many of the peers of THE five agree with you.
Your posting is an excellent example of one who has been taught what to think – not how to think. The usefulness of indoctrination is not lost on me.
Alan ==> Criticizing a summary is poor form. Read the full report (I have) — it is found here.
I’ve read the report in full, and Anthony’s summary is an accurate reflection of what it contains. My responses to the summary address some of the largest issues in the report itself, and I’m happy to expand on any of them.
Great news for civilisation, isn’t it, this getting rid of the fakery of CO2 endangerment.
Your response is mostly mantra clap-trap and misinformation.
“ncreases in weather extremes in North America, including heat extremes, precipitation extremes, and drought.”
Did you read this before you posted it?
more rain and less rain both at the same time? You are describing local weather, not climate. A common mistake from climate science.
Yes, North America is a big place, with many climate and ecological zones. Climate change is affecting all of them:
Climate change, which happens continuously, may well be the cause of lots of things.
The main debate is about whether CO2 is the cause.
That is not a debate that serious people are having. The overwhelming weight of scientific evidence shows that human emissions of CO2 are driving the ongoing climate change. The IPCC states it as “unequivocal.”
What areas on the globe have had their climate classification changed in the past 30 years? Give us some examples of this so-called “climate change”.
Bingo!
I have been doing that for a while now in several forums, their response is…. silence but they happily call me a climate denier.
They are mostly science illiterates parroting propaganda from mainly the media and from the IPCC reports they never read as it is always the single IPPC report link with ZERO quotes and no comments behind them.
Most people never read or heard of the Koppen Climate Classification Index.
LINK
Wladimir Koppen (1846-1940) and Rudolf Geiger (1894-1981)
are the original climate scientists. Their system takes into account the geology, geophysical features, weather data, flora and fauna of region.
Do you think you can capture the table in Wiki file and post it here?
A designation of “climate change” in region would require a detailed survey of the most the above parameters over long period to detect any changes.
PS: There should be an umlaut over the “o”.
Your delusion is off the charts. Get help.
His dedication is like that of a religious zealot, depending on scriptures for support.
Decades ago over 31,000 scientists, including over 9,000 PhDs, signed a petition saying that increasing CO2 was not a problem.
To me that is a considerable number of serious people.
The IPCC is a political organisation.
…political organization living off the global warming gravy train in Bern,
Over history, much science has advanced through the conventional wisdom of the time being shown to be incorrect.
There is no “unequivocal” category applied to scientific findings by experienced hard scientists. (I have 60 years of personal science experience in hard topics where data replaces handwashing assumption.) Geoff S
That doesn’t speak well for the IPCC. There is poor correlation between CO2 concentration and temperatures on geological time scales and during the COVID shutdowns. [ https://wattsupwiththat.com/2022/03/22/anthropogenic-co2-and-the-expected-results-from-eliminating-it/ ] It is only when the correlation, which is probably spurious, for the 1970s to present is smoothed, that there appears to be a correlation. Seasonally, there is an anti-correlation. The Law Dome ice cores strongly suggest that the causation is inverted for temperature and CO2.
There are so many problems with the paradigm, which are largely ignored.
CO2 is just a scapegoat. At its base its just s fear of change. Every climate alarmist I’ve conversed with sounds like Tevye in “Fiddler on the Roof”.
“TRADITION” Pre-industrial temps were good enuf for our fathers – they should be best for us as well!
You missed the entire point. On purpose perhaps?
You are still trying to conflate local weather with climate. The US High Plains is, and has been for recorded history, classed as a semi-arid desert as far as climate zones are concerned. I can’t find where the US climate zones have changed in recent history. Do you have a reference showing that the High Plains are now a desert or continental or some other climate because of climate change? Increased rainfall/decreased rainfall would be expected to cause some change in the climate classification – at least for most of us rational people.
I think you’re being intentionally obtuse, so it’s hard to address your asinine argument in good faith. Climate change does not mean climate zones will be reclassified. Arid regions will still be arid. Wet regions will still be wet. Areas prone to drought will see more frequent and more severe droughts. Areas prone to intense precipitation will see more frequent and intense precipitation events. That is the general pattern. It has been observed in the US and around the world.
Funny that’s exactly what you’re being. Intentionally obtuse.
You have no idea how ignorant you come across, there are only FIVE climate groups existing,
Polar, Tropical, Continental, Dry, Temperate
There are some variations in each group allowing for short term seasonal weather changes as shown in the link.
LINK
Go to Wiki and look up the Köppen-Geiger Climate Classification System.
Then what *does* it mean?
So no change in precipitation causing less aridity?
So no change in precipitation causing more droughts?
How will this happen if arid regions stay arid and wet areas remain wet?
You are spouting religious dogma, not reality or science fact.
It means a long term shift in temperature and weather patterns, not necessarily a change in classification (in theory if the climate of a region changed enough, it might need to be reclassified). You know this, so it isn’t clear what your motive in making these rather banal arguments is.
Weather and temperatures over the long term are how climate classifications are made! Go look up the name “Koppen”.
You simply have no knowledge base to draw on other than the Bible of CAGW.
Just to be clear, it’s your contention that unless a region receives a new Köppen classification, its climate has not changed? Is that your new pet theory?
Absolutely!!!
If climate at my location does not change sufficiently to cause a new classification, then I have little to worry about. The flora, the fauna, the temperature, the rainfall, the geology will not have an impact from climate change!
I see, you are operating on a personal definition of climate change that is unique to your own private mind. That’s fine. Now I’ll know what you’re talking about when you use the term. For future reference, I adopt the common meaning of the term shared ubiquitously across all of earth and environmental sciences.
Words mean what they mean. I am not the one that is asserting that the term “climate change” doesn’t actually mean climate change – you are. Weather is not climate. It *is* just that simple.
ROFL! If climate hasn’t changed then it hasn’t changed!
You are STILL trying to equate weather with climate.
That sounds like an article of faith. Can you provide a compelling argument for why that would be true?
Says who? You?
Do you mean less arid or more arid? Do you mean less wet or more wet? Define the time periods you are talking about. Years, decades, centuries, eons?
All your predictions, along with most warmists, derive from the Precautionary Principle. That is, something bad may happen so let’s change our ways. Have you ever read about Chicken Little?
More droughts and more rain.
And heat extreme.. using totally corrupted surface stations ??
Was the contribution done by fake “attribution” studies. 😉
Apart from the urban warming in the top chart.
… almost everything else is “Low Confidence” ie they don’t have a clue.
Heat extremes in the USA were by far more prevalent in the 1930’s
In Australia around 1900 was the hottest period.
Why not?! The who’s who of activists posing as “scientists” has been “believed,” and without actual empirical evidence to back any of their claims.
1 CO2 Is Not a Conventional Pollutant and Has Direct Environmental Benefits
CO2 is NOT a pollutant, it is a gas that allows for all life on the planet to exist.
2 “Ocean Acidification” Fears Are Overblown
The pH of the oceans is NOT decreasing. The compendium of ocean PH data shown elsewhere shows a very slight INCREASE in pH
3 Climate Models Consistently Overestimate Warming
Climate models are junk science, built on un-scientific assumptions and hindcast to garbage data.
4 No Evidence for Increases in Most U.S. Extreme Weather
Extreme weather attribution is done with fake assumption driven models.
5 Sea Level Rise Is Not Accelerating Dangerously
The is very little evidence of any sea level acceleration in the tide data, anywhere. Only the fake maladjusted satellite data shows any.. by cult intent.
6 Attribution of Warming to CO2 Is Far Less Certain Than Claimed
There is no measured scientific evidence of any CO2 warming in the UAH data.. or anywhere else for that matter.. you have shown that by being incapable of producing any.
7 The Social Cost of Carbon (SCC) Is Largely Arbitrary
The social BENEFIT of fossil fuels is many magnitude higher than any fake social cost.
8 U.S. Emission Reductions Will Have Negligible Impact on Global Climate
Emissions of CO2 have ZERO impact on the climate.. Makes no difference where they come from.
ps.. Most of the USA extreme heat was back in the 1930s,40s.
Those were The Dust Bowl Days.
Presently, there is a mega drought in AZ.
“show sensitivities above what scientists expect to be realistic,”
“Climate sensitivity” to CO2 is indistinguishable from ZERO.
A flea on an elephants posterior.
Colleague Dr Bill Johnston has shown that Great Barrier Reef temperatures measured several times a day on a scientific research ship in 1871 (not 1971) were statistically no different to temperatures in the 2020s.
How does this data fit into your ideas about climate change and postulated harm to the Reef?
It is detailed in Dr Johnston’s blog BOMWATCH.
Geoff S
The analysis is garbage. The absence of a statistically significant difference does not constitute proof of equivalence. Further, the 1871 data were collected via bucket measurements over a brief 3-week transect using thermometers with limited accuracy, no documented calibration, and known cold biases, making them incomparable to modern, high-frequency, instrument-calibrated datasets. Averaging these sparse historical values and comparing them to multi-decadal modern records without correcting for sampling differences, seasonal timing, or spatial heterogeneity (e.g., depth, habitat type) introduces substantial noise and bias.
The analysis is therefore irrelevant to my ideas about climate change and the vulnerability of the GBR.
In other words, unfit for purpose. Which is how one might describe the Argo temperature readings adjusted to the engine room water intakes that were used by Karl.
“no documented calibration” Can you show us detailed calibration documents for LIG thermometers on all land stations over the period from 1850 to 1980? Remember, calibration includes microclimate changes such as land use, screen deterioration, device drift, station moves, etc.
I want to see the detailed calibration records for each and every LIG device used in any of the current global land stations with periods exceeding 100 years. Do you have that information? If not, you are just waving your hands!
Then show us the calibration records for every MMTS/ASOS type global land station for the last 50 years.
According to the online Encyclopedia Britannica, the inorganic chemistry definition of an acid is, “…, any substance that in watersolution tastes sour, changes the colour of certain indicators (e.g., reddens blue litmus paper), reacts with some metals (e.g., iron) to liberate hydrogen, reacts with bases to form salts, …”
Sea water does NOT exhibit those characteristics. Therefore, it is NOT a mineral acid. It is illogical and grammatically incorrect to claim one can have “more” of something that does not exist. It also does not acknowledge the strong (bi)carbonate and borate buffering in sea water that resists changes in pH.
Furthermore, the “becoming more acidic” phrase implies that there is a continuum from zero acidity to maximum. That is only true for a range of pH from <7 to about -1 or thereabouts. Another way of looking at it is that the behavior of a water solution depends on whether there is an excess of H3+ (hydronium ions) over OH1- (hydroxyl ions). In the pH range of natural sea water, hydroxyl ions are dominant. The ratio is OH1- > H3+. At a pH of 7, there are equal numbers; that is, they have a ratio of 1:1 and is called “neutral.” Actual acids have an excess of H3+ ions (i.e. H3+ > OH1-) and are therefore able to ‘donate’ a proton in a chemical reaction. The distinction between an acid, base, and salt is fundamental to inorganic chemistry.
http://wattsupwiththat.com/2015/09/15/are-the-oceans-becoming-more-acidic/
Any movement toward the acidic end of the pH scale is called acidification, regardless of whether the substance crosses the neutral threshold. It’s the correct term used across peer-reviewed scientific literature and by every major oceanographic institution. I recommend you adopt the accepted terminology.
Cambridge dictionary: “the process of becoming an acid or the act of making something become an acid:”
Your definition is just one more corruption of language by climate science. Like you saying the term “climate change” doesn’t mean the climate has changed.
The process of making something become an acid involves movement toward the acidic end of the pH scale. Glad we’ve found common ground, bickering over semantics is such a massive waste of time when we already share a common understanding and there is zero confusion in the first place.
This is true only for environmentalists wishing to alarm people into believing that a problem exists. Physical scientists interested in technical accuracy do not call values that are less alkaline “more acidic”. The technical definitions of pH do not allow this.
Here is a link that explains the physical science description of pH. It is obvious you haven’t even had a high school chemistry class or you would know and use the proper technical terms.
pH – Basic (alkaline) vs. Acidic
Your use of pH is only a mechanism to sound “sciency”, similar to uneducated environmentalists. If you are going to use physical science terms, you should at least have the desire to do so accurately.
I could, but won’t bother to respond to all of your points. They read like alarmist propaganda, with little support for the claims.
However, consider this:
https://wattsupwiththat.com/2019/09/06/the-gestalt-of-heat-waves/
Michael Mann, the IPCC, and the rest of the Climate Catastrophe Industrial Complex will point to those authors and (rightly, more or less) proclaim them all to be heretics, climate deniers, climate skeptics, and nothing but a biased untrustworthy panel. Being backed by Trump will be all they need to tar it in the minds of true believers.
IANAL but I suspect the biggest benefit to this will be in the legal arena, especially backing up rescinding of the Endangerment Finding.
Anyone really interested in the climate issue should read the entire new report from the DOE. It isn’t hat long, only 100 pages of real materials (the rest is indexes, citation lists, usual blank pages etc).
The pdf is available here.
Not everyone here will love it, but it is a masterful document, very well put together.
I briefly scanned the report and found the following paper not mentioned:
https://arixiv.org/pdf/2004.00708v1 or https://arixv.org/abs/2004.00708
The title of the paper:
“The Saturation of the Infrared Absorption of Carbon Dioxide in the Atmosphere
by Dieter Schildknecht.
(cont’d from above)
He shows that when the concentration of CO2 in air reaches 300 ppmv, the absorption of out-going long wavelength IR light becomes saturated. In 1920 the concentration was ca. 300 ppmv in dry air was 300 ppmv. What this means that increasing the concentration of CO2 in air above this level will not result in a corresponding increase in temperature.
Now go back to the start of this thread and read my responses to JK. Pay attention to refence to John Daly. At the MLO in Hawaii, the concentration of CO2 in dry air is 429 ppmv. One cubic meter of this air has a mass 1.29 kg and contains a mere 0.843 g of CO2. This trace amount of CO2 in air can absorb only small amount IR light which can heat up large mass of air by only a very small amount if at all. Please keep in mind that 71% of the earth’s surface is covered by H2O, the one and only the one greenhouse gas of importance.
It time to put an end to the IPCC’s Great CO2 Global Warming Fraud and Scam.
Skeptics seem to finally be gaining real momentum in 47’s government.
Unfortunately, we are way, way past debate on this issue. The Climate Liars long ago declared “the debate is over”. They knew that their lies would be called out, so invented their “consensus science” to shut down all debate, and simply called those who disagreed “Deniers”. This is war, and it looks like finally, the truth and actual science will win out over the lies.
Hopefully, the truth will set us free.
Anyone else think J K and AlanJ are the same person?
Hard to tell. They all sing from the same climate hymnal.
Dual personalities can be a trait of deep-seated psychosis.
Mr. 4: We all wonder, don’t we? I think they’re not, both post falsehood “supported” by biased, debunked source, but Mr. K goes for the “pal” insult in a NY minute, while Mr. J is more passive for awhile. In any event, they may not be bots, but what would they do different if they were??!! They must work AWFULLY cheap to compete with bots!
In writing style, not even close. JK is probably constantly foaming at the mouth.
I think they both work for organizations that are going to have their work gored by an ox. Transparency is the ox by the way.
The level of disgusting ad hominem that Gavin Schmidt, an employee of USA’s NASA, allows on a Climate Science blog is beyond comprehension.
We are moving forward.
Over at real climate MarkR points to
https://iopscience.iop.org/article/10.1088/1674-4527/ac981c/meta
Which makes the point that the Connolly et at paper seems mathematically flawed.
This needs to be addressed or exchanged in the report