By P Gosselin
What’s happened to the global temperature since 2023?
By Frank Bosse, Klimanachrichten
We remember: by mid-2023, the data on global temperatures had shown a very marked increase. It had gotten warmer globally quite quickly, by an incredible 0.5°C compared to 2022. This led to a new record for the year being announced in 2024. The German public television Tagesschau (and many other media) did so in great detail.
The whole (climate) world asked about the cause. The Tagesschau correctly concluded that the (rather mediocre) El Nino could only make a very small contribution in the second half of 2023. Looking at the temporal change, the rise in global temperatures occurred simultaneously with the El Nino rise in ocean temperatures in the tropical East Pacific (an area called “Nino 3.4”) and that was already an indication that this could not be where the problem is: The lag is usually 3 months for global temperatures to follow Nino 3,4. Causality would have been violated.
It was already apparent in January 2022 that something was up. A volcano called Honga-Tunga-Honga erupted. It is an underwater volcano and large masses of water were hurled into the stratosphere. Here is a satellite image of it.
It has long been known that stratospheric water vapor causes temperatures on the ground to rise globally. But a volcano like this is a natural event, the warming effect is then added “on top” of the greenhouse gas effect. However, the “bump” itself was not man-made. Unfortunately, the news report did not mention this at all.
Every “impulse” that affects global temperatures (including land volcanoes such as the eruption of Pinatubo in 1991, which had a cooling effect due to many aerosols in the stratosphere) does so with some delay. The climate effect builds up slowly in the atmosphere and the thermal inertia of the Earth system as a whole does the rest.
Consequently, studies such as this one appeared at the beginning of 2023, which predicted a temporary warming of more than the “famous” 1.5°K deviation from pre-industrial values.
According to the Tagesschau, this is exactly what happened: “2024 was also the first calendar year to be 1.6 degrees warmer globally than pre-industrial levels from 1850 to 1900.”
However, the report itself attributes this to progressive man-made warming. At the time, this also partly reflected the state of knowledge that some literature on the subject sought to convey. This study from July 2024, which even determined an overall cooling effect of the volcanic eruption due to the aerosols that also occurred, should be mentioned here as a representative example.
Here’s the most complete possible development of global temperatures according to GISS:
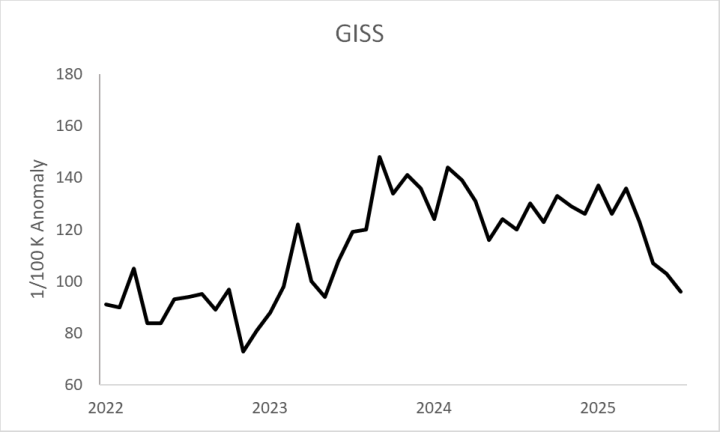
The values are extrapolated to the end of July 2025, this month is estimated using a model, 7 days before its end.
The volcano in question occurred at the end of January 2022. Not much happened until around May 2023. Then, however, the “impulse response” of the climate system probably took place: in September 2023, an additional warming of 0.58 °C was detected compared to the average for 2022. The entire year 2024 saw an increased level of 0.39°C compared to 2022. This can NOT be explained by the gradual increase in forcing by greenhouse gases etc.!
Between 1980 and 2020 there was a warming of 0.018 °C/year, now it should suddenly be a factor of 10 in the years 2022-2024? That was always completely unlikely!
Likewise the downturn in 2025 of over 0.4°C globally, within just 6 months.
So the (climate) world continues to puzzle. Here too, no definitive cause can be given for the roller coaster ride of global temperatures. However, the probability speaks for a course that was determined to a large extent by the underwater volcanic eruption with a lot of water vapor input into the stratosphere (unprecedented quantities, according to this study).
However, this is not suitable for warning of a man-made “climate catastrophe” by exceeding the (purely politically determined) 1.5°C mark, even with the wisdom of “accelerating warming”. The whole 2023/24 thing was very likely a natural event. The 3/10°C missing from the 1.5°C warming compared to pre-industrial times in 2022 could also be missing again in 2026, the gap will probably be a little smaller.
“Volcano is over”, hopefully also the propaganda and scaremongering!
The values are extrapolated
This seems to be the new standard methodology in climate change science – eg UKMO
One of the things most people are taught early in their scientific education is that extrapolation is unreliable. [Strativarius was taught it as a total no-no]
…
A huge percentage of popular debate in many fields (politics, economics, culture, science) falls prey to this fallacy. The fallacy is especially visible right now in the totally debased discussion of the causes and effects of climate change. Few of the loud voices on either side of this discussion, no matter how many times they mention the word “science” are actually doing anything remotely approaching a critical, sceptical, Popperian scientific method. It’s the victory of Kuhn’s description of science, but vulgarized to the level of cable news, and then repurposed for political ends. There’s barely a word written on this topic that isn’t dripping with confirmation bias.
https://in.relation.to/2011/06/10/the-dangers-of-extrapolation/
Once we were lectured by the high priests that weather is not climate. There had to be a [30 year] trend. And now suddenly weather is climate and with the superhuman efforts of Fredi Otto and chums at World Weather Attribution to point the finger of blame, weather is climate and it’s man made. Science settled. They find extrapolation, fudging and modelling to be politically expedient.
In the UK media the July weather is its usual boring and disappointing self, so now it’s back to Gaza…
Hi, in the article the word “extrapolated” is lost in translation. I used it in the sense of “estimated from a model” (linked) which forecasted the GMST 7 days before the end of the month quite well in the past.
Whatever way you choose to describe extrapolation – it’s invention.
NO! It’s a verified model for the last 7 days of the month, this is NO invention. I’ll let you know the final value for the month it it’s publisehd by GISS itself. It won’t change much.
Invention. It is not possible to predict the future any better than a 12 year old. Are you claiming that level of interligence?
It is now 9 AM where I am. It is sunny and bright. I extrapolate that in 12 hours it will not be sunny, and it will be dark. So far in my life, this model appears to work well.
Actually, that is not extrapolation as it is commonly defined . . . it is instead using logic that past history can be a useful predictor of future events.
Let’s pray there’s not an undetected, >10 km-size comet or asteroid headed to Earth that might impact in, oh, 15 hours from now.
Using past history as a predictor of future events doesn’t always work.
This is way logic is logically illogical. 😁
Have you never heard the phrase, “past performance is not indicative of future results”?
What does coupled non-linear mean to you? Can “logic” replace GCM’s?
No, that’s an assumption. Once again, a child could do as well.
Semantics can not change the laws of physics. No GHE.
Sorry about that, but I’m right.
Frank, Is the warming due to an enhanced greenhouse effect? If so, it seems like a good opportunity to quantity the greenhouse effect. If we know how much excess water vapor os in the stratosphere, and for how long it has been there, and if we know how much warmer it got, couldn’t we calculate the magnitude of an enhanced greenhouse effect? There would be other factors to take into account, but couldn’t we get a rough approximation?
I don’t think that the observed temporary warming was due to an enhanced GHG-effect. Much more likely is a feedback of the enhanced stratospheric water vapour to clouds in the troposphere. There are many recent papers describing the warming due to the cloud effect. What if this feedback is involved in 2023/24?
From the article: ““Volcano is over”, hopefully also the propaganda and scaremongering!”
No, that’s not going to happen. Climate Alarmists will continue the propaganda and scaremongering.
Trump said yesterday that the UK should stop building windmills.
I wonder if any Climate Alarmists will turn out to protest Trump’s visit? I imagine Trump calling for the end of windmills will generate some pushback by the CO2-phobes.
Trump shakes up the status quo. He is trying to make the UK Great Again!
Trump also said Europeans should put a stop to the illegal immigration or there won’t be a Europe.
Trump tells the truth and his opponents can’t stand the truth.
People make the big mistake of blaming primarily left white middle class liberals. As if these people wag the dog which is the deep state, super rich globalist. These are the people that are setting the narrative via education,the MSM and the left middle classes in general who need and want to believe the co2 mantra. They need net zero, faux mRNA jabs, ward and uncontrolled mass immigration. Gutteires in 2023/4 called it global boiling. Even grok AI dismisses Hunga Tonga. The plans of the Globalist elite is a reduced global population to around 500m with the serfs literally confined to 15m cities and program of behavioural so called vaccines while drinking cockroach milk. This is why the global warming net zero lies will continue. The left are just the useful idiots
‘…the dog which is the deep state, super rich globalist.’
Sounds like Jeffery Epstein’s ‘client list’, which is probably why the deep state wants it to go away.
““Volcano is over”, hopefully also the propaganda and scaremongering!”
Hopefully, yes. But in reality, no. New exaggerations and outright false claims will be fabricated like nothing ever happened.
But let’s acknowledge that any attribution of the reported longer-term warming trend depends on being able to isolate the cause of that ~0.016C per year (UAH LT) trend from within the ~200X larger annual cycle of warming and cooling in the global average surface air temperature.
https://climatereanalyzer.org/clim/t2_daily/?dm_id=world
And for that matter, is this measure even valid as an indicator of the energy state of the climate system? No. But it gets amplified attention from the climate worriers, and the mass media makes it sound scary. It’s not. The planet will be fine.
Two factors contributing to the delayed warming effect: 1) aerosols from big tropical eruptions cool the atmosphere for about a year, and 2) it took time for the water vapor to spread out in the stratosphere. The amount of sulfur compounds and other aerosols were reduced because the eruption was under water, but it was so huge that the ejecta still cooled the planet.
Again we only have one reason for the warming and now cooling.. the volcano?
There is more to it than one factor I’m sure since the Earth’s climate is a culmination of a lot of things adding and subtracting. We have had a lot of heat put into the oceans from undersea volcanic vents and that appears to be decreasing (but may change), the Sun is still in it’s active phase, Arctic sea ice is down (but may change) and the list goes on. The real issue is the Earth’s climate is so complex and climate scientists are such a myopic group of people that they will never figure it out. Maybe AI will in the year 2525.
We find that a herd of elephants stampeded within minutes of a pimple bursting on an elephants butt. We know that elephant stampedes can destroy villages. Ergo, pimples on elephants destroy villages. That’s how tenuous and ill-interpreted the effects of Hunga-Tonga are on Earth’s climate…
Does anybody really know what climate is?
Chicago
Seriously though, the Caterwaulists used to proclaim it was a 30-year period (cherry-picked, of course). But they’ve gone from that to pouncing on 1-year periods, and even weather “events” as being “climate change”. Desperate much Alarmists?
We’d be better off looking at 100-year periods, at minimum, if we want to try to see a trend. There are simply too many variables, and very likely, cycles within longer cycles within still longer ones.
Agree, 100 years much better, but 1000 years even better.
“Desperate much Alarmists?”
Yes, the Climate Alarmists are very desperate. They are reduced to attributing CO2 to every severe weather event. They assert, without evidence, that CO2 is the cause.
You are pretty desperate when you present speculation and unsubstantiated assumptions as established facts, and that is exactly what Climate Alarmists are doing. They have nothing else. They certainly have no evidence to back up any of their weather claims.
Presenting speculation as established fact is not science.
I estimate there’s still another ~0.2 C of cooling coming from dissipating HTe effects. There’s also cooling of another ~0.2 C from the PDO which moved into its negative phase a few years ago but its been hidden by so many other climate variables.
This is all prior to the next phase change of the AMO which could lead to as much as 0.6 C of cooling over the next 5-10 years. There’s a lot of heat to dissipate from the oceans which takes some time.
Of course, there will be ENSO events popping up to mask these longer term effects.
If my guesses prove true, it will be interesting to see how climate activists deal with it. Almost certainly they will come up with some man made cause.
They’ll trot out the old “the heating caused the cooling” story. 🙄
“It has long been known that stratospheric water vapor causes temperatures on the ground to rise globally.”
This is straight-up hand-waving – name a single instance; UAH LS lags SST.
“The whole 2023/24 thing was very likely a natural event.”
It was similar to and as natural as the 1997/98 El Niño that wasn’t caused by a volcanic eruption. Cooling from the El Niño peak was also not caused by the HTHH volcano/water vapor dissipating.
The HTHH eruption happened just as irradiance increased above the decadal warming threshold.
The volcano did not cause the 2022-2024 warming, solar irradiance and albedo did it, and the warming was predicted to happen by me at the 2022 LASP Sun-Climate Symposium in Madison.
Here are some results from my 2024 AGU poster on the subject, with a recent update:
Repetitive posting by skeptic sites of HTHH as the warming driver is by itself an act of propaganda.
Do yourselves a favor, stop before you dig a bigger hole for us to climb out of.
Thank you. The dreck constantly churned out by the volcano-worshipping Hunga Tonga cultists is an embarrassment to all true climate skeptics. The idiotic notion that a 1ppm increase in stratospheric water vapor caused a 1.5-degree increase in global surface temperatures 14 months later is just so brazenly stupid that it defies imagination. The Hunga Tonga cultists need to hang their heads in shame and leave this site forever. They are the absolute scum of the Earth.
The big temperature effect came from a reduction in clouds, not water vapor.
That’s not what the article said.
Please read or re-read the article.
Meanwhile…..the warming of 2025 cintinues in the USA – huge high pressure means 100 plus for next week…….it’s HOT baby!
This plot shows how different the spike is relative to previous El Niño events. It’s also curious that the two ENSO indexes don’t agree.
The only previous spike of this magnitude was in 1878. It too was preceded by a wet (but not underwater) volcano.
The 1878 spike was likely going to be a large event anyway, so it’s not clear that the Askja eruption was a factor. I say this because major El Niño events are predicted from 60 year Jupiter-Saturn conjunctions. The 20-year conjunctions also have an effect, both delayed by 14 years. These can also be seen in sunspot data delayed by 13 years.
The 2023/2024 spike was not solar in origin, though water vapor in the stratosphere at the peak of a solar cycle is unprecedented. UV dissociates H20, so who knows. Anyway, my prediction is that we’ll return to the slight cooling trend that began in 2016 and should last until 2035.
“The 2023/2024 spike was not solar in origin”
Yes it was, as I explained earlier, above. Your problem is a rampant belief in your own failed model.
Robert, you believe in your model so fervently that you can’t even see the obvious failure. You are saying solar didn’t do it in 2023/24 because your model didn’t predict it – any contrary facts be damned.
“Anyway, my prediction is that we’ll return to the slight cooling trend that began in 2016 and should last until 2035.”
The fact is Robert there hasn’t been a slight cooling trend since 2016 because 2023/24 > 2016.
From the years 2020 to now your model goes in the wrong direction. You completely missed it.
That is called a “failed model prediction” Robert.
Personal attacks — in bold, even? You must really feel threatened by my research, Bob.
A sunspot-based model is incapable of predicting the weather effects of volcanoes, or collisions with asteroids. In a few years I will happily admit failure if this spike turns into a step increase in temperature.
BTW, sunspots are a proxy for solar activity, they’re not solar activity, The small variations in TSI associated with individual cycles don’t drive climate. I know this because of the Schwabe notch in the temperature spectrum. Note however that 20- and 60-year Jupiter-Saturn cycles do appear to affect temperature..
because your model didn’t predict it
You completely missed it.
Personal attacks — in bold, even
Really?
You think they are ad-hominems? Can you explain why?
Any post that starts with “Your problem is a rampant belief…” does not set the tone for reasonable debate.The first bold fragment is OK as it challenges the model. I responded to that criticism in a reasonable way. The second was personal.
That is a joke. I have identified your problem and you don’t like it.
Your solar model failed to predict the outstanding solar influence of SC#25 on the climate, it’s that simple. According to your model there was no influence from SC#25. Your sunspot model is inconsistent, out of phase with reality from about 2020 to now.
How can you essentially claim one small solar cycle had a big climate influence while the next larger one had none? What made SC#24, the smallest sunspot cycle in 100 years, have so much more climate forcing in your sunspot model than the stronger SC#25?
Your solar model has already FAILED!!! You can admit it today.
Why in the world should I feel threatened by your failed model Robert?
BTW, I didn’t use the word sunspot in my earlier comment.
BTW, sunspots are the visible manifestations of solar activity, something I learned over a decade ago here at WUWT from a real solar scientist.
TSI is the ongoing sum of all of the active region & coronal phenomena.
BTW, TSI climate forcing from solar activity (vs orbital forcing) is all about climate energy accumulation above a certain solar activity threshold that is expressed by sunspot number, F10.7cm flux, and TSI, with terrestrial help from solar-induced albedo changes.
You don’t know this, as you’ve found the perfect way to fool yourself. Like I said before TSI climate forcing is all about energy accumulation above a solar threshold, something spectral analysis doesn’t register.
You made the claim that big planets cause the climate to change but you have given no mechanisms to connect the sun’s alleged barycenter motion to changes on the sun or in the climate, nor any other connection from the sun to the climate – in other words you are totally hand-waving and for whatever reason you expect your hand-waving to carry the day.
As I’ve often said, sunspots are a proxy for solar activity, they’re not solar activity. The information is in there, but not entirely encoded in the cycle amplitudes. I’d go so far as to say the amplitudes are more of a head-fake.
You are correct, Bob, I make no claim for how variations in solar activity affect climate. it could be variations in TSI, magnetic fields, or both. Whatever the mechanism, the oceans do integrate the variations. It would help to know how TSI varied over the years, but all we have are a bunch of models that don’t agree.
We also don’t know how the planets modulate solar activity; this is the problem I’m focused on. My list of climate related cycles has grown to more than 40, so it’s complicated, I’m currently looking at how changes in solar activity drive glacial cycles, DO events, and possibly even the Younger-Dryus event. The periods and phases in this plot are not fit, they come from Jovian orbits.
Given the lack of meaningful dialog on this forum, I
think I’ll post elsewhere after this.
Sounds like astrology to me. Do climastrologers do deep research into the movements of the the planets? Mars trine Venus synastry might explain some of the more bizarre climastrology interactions.
Sorry, just having a laugh. No offense intended,
No offense taken. All of the Jovian planets are involved, but Jupiter and Saturn have the greatest impact on solar activity, The plot I included takes into account both the non-circular orbits and and the influences of Uranus and Neptune. The inner planets, including Earth, are mostly just along for the ride,
As an aside, Earth’s orbit is also modified by the gas giants giving us Milankovitch cycles, though I doubt he was the first climastrologer.
From the above article’s fourth paragraph:
“It has long been known that stratospheric water vapor causes temperatures on the ground to rise globally.”
Not so fast! Science marches on onward.
Recently, detailed atmospheric modeling—albeit it modeling, but modeling that goes well beyond simply considering just water vapor radiation energy exchange occurring in the stratosphere—shows that an increase in water vapor in the lower stratosphere may indeed lead to an overall decrease in temperatures in the lower troposphere. This is asserted to be caused by the slightly-moistened lower stratosphere (with its increased LWIR-radiation absorption by the increased water vapor concentration) causing shifts in tropospheric wind circulation patterns that, in turn, result in overall cooling of the underlying troposphere.
“We show from a mechanistic climate model experiment and inter-model variability that lowermost stratospheric water vapor decreases local temperatures, and thereby causes an upward and poleward shift of subtropical jets, a strengthening of the stratospheric circulation, a poleward shift of the tropospheric eddy-driven jet and regional climate impacts . . . The related effects on atmospheric circulation are of similar magnitude as climate change effects. Hence, lowermost stratospheric water vapor exerts a first order effect on atmospheric circulation . . .”
— from the abstract of “Stratospheric water vapor affecting atmospheric circulation”, Edward Charlesworth, et.al., Nature Communications 14, Article number: 3925, published 3 July 2023 (free download available at https://www.nature.com/articles/s41467-023-39559-2 )
————————-
Also, there is this statement in the article’s fifth paragraph:
“The climate effect builds up slowly in the atmosphere and the thermal inertia of the Earth system as a whole does the rest.”
That claim is highly questionable if one looks at the UAH data for the global-average lower atmosphere temperature (GLAT) month-to-month variations, as most recently posted on WUWT (see https://wattsupwiththat.com/2025/07/06/uah-v6-1-global-temperature-update-for-june-2025-0-48-deg-c ). Month-to-month globally averaged LAT data just since January 2021 exhibits variations as high as 0.21°C (June-July 2021), 0.28°C (Oct-Nov 2021), and 0.28°C (June-July 2022) separate from—and without “volcano-induced” attribution like—the June-July 2023 variation of 0.26°C. This falsifies there being any “build up” of thermal energy (“somewhere”) that then, after a 15-16 month “delay”, is suddenly released into the stratosphere to cause a spike in GLAT.
Heck, even the article itself makes this statement: “The lag is usually 3 months for global temperatures to follow Nino 3,4.”
Bottom line: the delay from January 2022 to “mid-2023” (as admitted in the above article) for any response to the Hunga-Tonga volcano injection of water vapor into the stratosphere is quite implausible.
P.S. IMHO, as for what might explain the occasionally-relatively-large month-to-month variations in UAH GLAT data that I noted above, look to month-to-month variations in global cloud coverage (this can explain both the relatively large increases and decreases in GLAT from one month to the next).
UAH is lower troposphere, in the article the T2m (GISS) were used. The lower troposphere has a MUCH lower thermal inertia (thin air) than the T2m. Don’t compare apples and oranges!
You need to know that the “T2m” dataset provided by GISS is based on temperature measurements taken only over land masses (measured 1.5–2 m above the surface) . . . it is not a global average measurement and thus logically cannot be compared to UAH GLAT.
Speaking of apples and oranges, you also need to know that GISTEMP, the more-commonly referenced indicator of average “global temperature” fronted by GISS, is a mash-up combination of T2m measurements AND sea surface temperature (SST) measurements obtained from ships, buoys, and “satellite-derived estimates”. Hence, UAH GLAT is a more scientifically-credible measurement than is GISTEMP
It is true that GISTEMP has MUCH higher thermal inertia than UAH GLAT because it is a composite measurement that includes, in global percentage, a preponderance of liquid water temperatures that UAH GLAT does not. However, the lower thermal inertia of the lower troposphere only serves to make it a more responsive indicator of atmospheric temperature change than GISTEMP.
“You need to know that the “T2m” dataset provided by GISS is based on temperature measurements taken only over land masses (measured 1.5–2 m above the surface)…” No, you are not well enouhgh informed. There are also the SST involved with ERRSTv5. Sorry, I’ll stop any conversation because of some huge knowledge gaps of you. This is not too dramatic if you would not try to comment here and instead would try to learn silently.
GISTEMP uses GHCN for the land portion and ERSST for the ocean portion.
Yes and no. It is a global average temperature, but comparison with UAH-TLT is tricky since the former is measured at the surface and the later is measured over a thick layer of the troposphere.
No, it’s not. You must be confused. Maybe you mean it’s a mythical concept – a fantasy created by GHE believers calling themselves “climate scientists”, who simply refuse to accept that the Earth has cooled from a molten state, without providing any alternative explanation consistent with theory and observation.
Well, no it’s not, is it? Even if it was, what’s the point? Actual surface temperatures due to the unconcentrated rays of the sun vary between about 90 C and -90 C.
No GHE to be noticed – that’s because it doesn’t exist! You must be confusing science with religion, and blind faith with fact.
HTe also released cooling gases. This is why the warming response was delayed. It worked out the cooling gases mostly dissipated at about the same time as we had an El Nino. Made it look like El Nino was the only cause. However, El Nino faded away more than a year ago while temperatures are continuing to go down this summer.
Clouds were the biggest factor in HTe warming and I suspect they reversing themselves now.
Suspicion runs rife. Very suspicious.
The 2024 El Nino spike was a unique combination of solar maximum and Honga Tonga water vapor, layered on top of the normal El Nino/La Nina cycle. The Hunga Tonga eruption was the largest underwater explosion ever recorded by modern instruments. – It injected ~150 teragrams of water vapor into the stratosphere—a 10–15% increase over baseline levels. This was the first time such a massive stratospheric water vapor injection was observed in the satellite era (last ~50 years).
Common Sense Extrapolation
If one such eruption occurred in just 50 years of satellite monitoring, it’s statistically plausible that similar or larger events happened thousands of times over the past few million years.
These events would have gone undetected, leaving only faint geological or chemical traces.
An estimate of ~5,000 comparable events is conservative when considering:
The frequency of submarine volcanism.
The lack of continuous global observation before the 1970s.
Right, and any way that you slice it, the sudden “anomalous” spike in the UAH data in 2023 requires, if not one sufficiently large cause, then two or more amplifying events. If the HT eruption by itself isn’t enough to cause such a dramatic spike ~18 months later, then those other factors would need to be considered. I still find it a little too suspicious that this huge spike came a relatively short time after the largest underwater volcanic eruption in recent history. Let’s hope we don’t see a repeat anytime soon to test the theory…
Good for you! Do you intend to follow up your suspicion?
[Jenkins et al. 2023] predicted Hunga Tonga would increase the chances of exceeding the 1.5 C threshold in the next 5 years by 7% due to 0.04 C of warming.
[Millian et al. 2022] estimate about 150 MtH2O or about a 2 ppm increase as a result of Hunga Tonga. As a point of comparison about 15,000 MtCO2 was added to the stratosphere in the time since the HT eruption.
Right. So your own sources do not support your premise.
”Sources” without reproducible experimental support are just opinions – worth what you are prepared to pay for them.
There is no GHE, and both experiment and observation show that increased water vapour between the Sun and a thermometer lowers, rather than increases, the thermometer’s temperature.
Fact, rather than self-serving fantasy.
Sorry about that, but it’s true.
No. these studies only show the “looking for the needle in the haystack” of the climate science at this time. I looked at the timing (with up and down) to follow that there has been an external trigger. Perhaps there is a feedback at work, yet unknown. A candidate could be a cloud impackt due to much stratospheric water vapour.
The 2022 HTHH eruption really had unfortunate timing that obscured the true reality.
Just months into 2022 I predicted in my Sun-Climate Symposium poster in Madison, Wisconsin that solar cycle #25 would likely drive temperatures beyond the “famous” 1.5°C deviation. It happened.
The basis was the increase in TSI on top of relative cloudlessness caused by the triple-dip La Niña.
Everything I said then would happen, happened, and not because of stratospheric water vapor.
The relative cloudlessness was a consequence of tropical La Niña cooling that was in step with solar activity minima, followed by tropical and climate warming that stepped-up with solar activity. This has happened for at least the tenth time in a row now with SC#25. The odds over the previous nine cycles of this happening without solar forcing were 1.6(10^19):1, ie, impossible w/o solar forcing.
I have calculated using the S-B equation the expected changes in temperature from the TSI and albedo numbers to find there was adequate solar forcing to cause the recent step-up.
None of the papers including HTHH as climate driver after the fact have hit the mark. Not even close.
No it hasn’t. As Tyndall showed, higher temperatures result when there is less water vapour between the Sun and the ground. Death Valley and the Lut Desert are fairly good examples of this.
Fantasy about the miraculous heating powers of either water vapour or CO2 is obviously accepted as fact by the ignorant and gullible – notwithstanding high intelligence or extensive education!
No GHE – all dreams and wishful thinking.
1) GISS isn’t “the (only)” generator of GMST reconstructions / reanalysis products, and not even they are likely to insist on their version being “the most complete possible”.
2) All such products are presented as “temperature anomalies” — with a defined “Reference Period” to determine the “zero line” — rather than as absolute “temperatures”.
.
I cannot find a “monthly offsets” table for GISS, and they only go back to (January) 1880 anyway, but the reconstruction by NCEI / NOAA (ex-NCDC) all the way back to January 1850 can be downloaded from this embedded link (scroll down a bit then click on the “Download : CSV” button).
If you click on the “Data Info” button in the top-right corner of the webpage, however, you get an “overlay window” that you can scroll down until you reach a “Global Mean Monthly Surface Temperature Estimates” section.
Extracting the first column of numbers from that table gives us the “offsets” required to convert their “anomalies” dataset to “absolute” numbers instead. For reference, the numbers from that extraction are :
NB : Once “absolute” numbers are available it is easy enough to recalculate the “offsets” for any other desired “Reference Period”, e.g. the “1850-1900” one used by the IPCC as an approximation to “pre-industrial” GMST levels (see footnote 9, to paragraph A.1.2 of the SPM, at the bottom of page 5 of the AR6 WG-I assessment report).
An alternative contender for “the most complete possible” graph of GMST since January 2022 can then be produced … and attached to the end of this post.
Note the absolute swings in “temperatures” from ~13°C to ~17°C … and back again … every single year.
4°C is twice the “to be avoided at any cost” 2°C threshold you will often see touted by the “meeja” (and almost three times the “dangerous” 1.5°C one).
.
PS : Note also how changing the reference period to the “1850 to 1900 = Pre-industrial” one “pushes up” the highest individual anomalies numbers above the 1.5°C “threshold”.
For completeness, the equivalent graph for the entire NCEI / NOAA dataset.
Your graphs emphasize the fact that climate science should be required to develop a holistic absolute temperature value that is optimized for the earth. 16C (61F) seems pretty cold for an optimized temperature of the globe.
I have searched and searched to find information on determining an optimized absolute temperature average for the globe and have found little other than guesses.
99.99% of analyses pretend that anomalies are actual temperatures, rather than ΔT values. These change values basically assume the global temperature baseline period is the best temperature possible for the earth. That is not very scientific. One simply can not know if we are rising above the best temperature or if we are approaching the best temperature.
My pet peeve is that scientists have allowed and participated in the practice of treating ΔT values as actual temperatures. They are not actual absolute temperatures.