Essay by Eric Worrall
As Britain endures extreme cold and near miss blackouts, apparently now is the right time for an English scientist to tell everyone how hot it is.
My new dark red climate stripe for 2024 shows it’s the hottest year yet
Published: January 10, 2025 10.00pm AEDT
Ed Hawkins
Professor of Climate Science, University of Reading…
These “warming stripes”, adopted around the world as a symbol of climate awareness, action and ambition, have just been updated to include a new dark red stripe for 2024. It was a colour that I had to add for the first time last year when 2023 shattered the previous records.
No one experiences the global average temperature directly. But we can use the same approach to represent how we have lived through our own climate experience, locally. The UK had it’s fourth-warmest year on record. Other countries, such as Germany, had their warmest year on record.
…
Well done humanity. For it is us who have caused this rapid warming of the planet, and the devastating consequences for people and ecosystems that are so visible today and every day. Many extreme weather events have been made even worse by our reliance on burning fossil fuels, causing misery around the world.
Read more: https://theconversation.com/my-new-dark-red-climate-stripe-for-2024-shows-its-the-hottest-year-yet-246914
…
The article goes into all the bad things Ed Hawkins thinks global warming has caused, such as the Los Angeles fire. Strangely Ed forgot to include Britain’s current extreme cold snap in his list of climate disasters.
Given a choice between affordable home heating or climate action, I’m guessing most Brits right now would choose the affordable home heating option.
If an extreme cold snap with near zero wind and solar can occur at 1.5C global warming, it can obviously occur at 2C global warming or even 3C global warming. In fact, if Ed’s prediction of more extreme weather is correct, that could make cold snaps such as Britain is currently enduring more likely or more extreme.
Of course, given the failure of climate models to predict the current bump in global temperature, there are clearly substantial climate forcings which have not been captured by the models. So it is anyone’s guess where global temperature will go next.
Let us hope Britain doesn’t vote their way out of a survivable future, by embracing so much global warming action they all freeze to death. Because Britain’s ongoing effort to sabotage their own industrial competitiveness and energy affordability is having no impact on India and China’s determination to lift their people out of grinding poverty, by providing low cost fossil fuel electricity as quickly as they can build the coal plants.
Ed Hawkins has been at this game for a very long time. If he were to change his tune now, he would have to hand back the MBE he was awarded ‘for contributions to climate science’ in 2020.
If he chanes his tune Mr. Farage will give him a knighthood in 4 years time.
Unfortunately for reform uk Farage will be removed due to his Tommy Robinson stance. He’s got it wrong.
What is apparent is the injustice or two tier justice levy’d on poor Tommy from the establishment.
I’ll still vote reform but Nigel is not my pm unless he back tracks.
You read that wrong. There is clear blue water between them for very good reason.
The only perspective I see is that the beeb says Robinson is far right evil. Naturally I take that as strong evidence to the contrary. He repeated an opinion and goes to prison. If that is not evidence that there is no free speech in the UK, I must be missing something big.
What do you mean by ‘There is clear blue water between them for very good reason’?
He didn’t “repeat an opinion” he repeated a libel and as held in contempt of court for doing so since an earlier trial had found him guilty of libel. Freedom of Speech does not extend to libelling people repeatedly. This is currently the 5th time he has been in prison and clearly he knows what he is doing and does it just to gain attention.
The Loony Right in the UK is no better than the Loony Left. Both are led by self-important, politically illiterate thugs. Politics is about getting things done, and neither has a clue how to do that. They don’t even know how to put together a political program. Both are at the level of have a student demonstration, and then home to tea.
It’s rare when I agree with Izaak.
IMHO, the odious Robinson is in prison for contempt of court after he admitted 10 breaches of a 2021 High Court order barring him from repeating libellous allegations against Syrian refugee Jamal Hijazi, who had successfully sued him.
Everyone associated with the Hijazi case has been slapped with a non-disclosure agreement.
Make of that what you will.
Farage has probably the most acute political judgment of any politician now active in the UK. He has shown it repeatedly. You can trust his political judgment on individuals and policies. You may or may not agree with him, but if he goes in a certain direction it will turn out to be the right way to go for his particular political aims. Any association with Robinson will doom Reform.
He is correct.
Thanks for clarifying that for me gents
I agree that Nigel Farage is a savvy politician and it’s clear that whether or not there was an actual libel or a politically motivated judgment denying the man the absolute defence against libel (true statements), a lot of proper Brits are going to knee-jerk to a demand for polite decorum and refuse to associate with such low opinions of a loathsome ruffian. Harumph and tut tut. Free speech or polite speech, which will you allow?
In my view, sorry boys, this is why you deserve to live as sheep and die at the hands of the wolves devouring your country, my lamented ancestral homeland.
I reckon a lot of these jokers are just enthralled with the graphics constructs opportunities that global warming offers them.
Who knows, maybe they were deprived of crayons and coloring books at kindergarten and now they’re just making up for that deprivation?
Prof. Hawkins claims that “humanity …. has caused this rapid warming of the planet.”
Firstly, which rapid warming is he talking about? I can only find a slight slow warming.
Secondly, it would be nice if he could give us chapter and verse regarding how this rapid warming works or might work, ‘cos no-one else seems to be able to.
The global temperature has warmed by about 15% of the difference between an ice age and interglacial period in about 1% of the time. That is not slight or slow.
You’d feel so much better if we were 1.5° closer to a glaciation, eh AJ?
If you are right that the special cause of the observed warming is the increase in CO2 concentration from 280ppm to 425ppm, and you see that CO2 is rising by 2-3 ppm per year, shouldn’t that give you confidence that all is well for the foreseeable future?
After all, it’s unlikely that enough fossil fuel is left to squeeze out more than a couple more degrees of ‘manmade’ warming before we run out of economically extractible fossil fuel. Then we will be back to the inexorable decline toward glaciation.
The urgency is to stop the insane reliance on intermittent sources of power in places where extended power outages result in deaths.
Why is it unlikely that enough fossil fuel is left to squeeze out only a couple more degrees of warming? Have you read any analysis, or done your own?
Empirical analysis by Curry and Lewis puts the ECS at about 2K/2xCO2. If we are to achieve the first doubling to 560ppm, we need to burn again all the fossil fuels that we have ever recovered. Then to double a second time to 1120ppm we would need to find and burn another two times all the fossil fuels that have ever been extracted. While I would like to optimistically think that we would be able to find 3 times the fossil fuel that has ever been extracted, I don’t think it’s prudent to depend on it. We need to deploy better, cheaper nuclear power designs in the next century to avoid mass starvation and death when the next glaciation inevitably begins.
First, start with a value of ECS from the scientific literature, not an outlier like curry.
I can understand why you wouldn’t want to go with empirical evidence since it disagrees with your propaganda and your computer games.
An ECS value of 3C is the result of empirical evidence, from paleoclimate calculation as well as the current warming trend.
Please show me a paleo reconstruction which included a mathematical discussion of a potential proxy selection bias for the resulting temperature trends.
Liar. The relatively high resolution of ice core data clearly and consistently indicates that changes in temperature lead changes in CO2 concentration by at least several hundred years during all of the Pleistocene glaciations in the record. And if you don’t find that sufficiently inconvenient, there’s also the CENOGRID foram data that clearly indicates that transitions from warm (cold) to cold (warm) regimes had absolutely no dependence on CO2 concentrations, but rather were the result of tectonic movements over the past 65 million years.
Of course it indicates changes in temperature lead CO2 rise — because warming oceans drive CO2 into the atmosphere.
And it also shows that a larger rise in temperature FOLLOWS CO2 rise, as the buildup in atmospheric CO2 from the initial warming phase causes a rise in the atmospheric greenhouse effect. And the data shows that the second phase of warming is substantially larger than the first.
https://skepticalscience.com/co2-lags-temperature-advanced.htm
If anything, physics should be consistent. If CO2 actually played a role in determining surface temperatures, the ‘buildup’ in atmospheric CO2 would continue to cause temperatures to rise. Instead, the real data (and even Al Gore’s scissor lift stunt) clearly indicate that temperature begins to decline well before CO2 peaks. Repeatedly and consistently over the entire ice core record.
I must add that your continued special pleading on behalf of climate alarmism is somewhat admirable, but the reality is, it’s just tiresome.
“CO2 didn’t initiate warming from past ice ages but it did amplify the warming. In fact, about 90% of the global warming followed the CO2 increase.”
https://skepticalscience.com/co2-lags-temperature.htm
Like I said, tiresome.
Yes, we know that you find science and research findings ‘tiresome’.
WB, you make two mistakes. First, almost all the ‘scientific literature, including AR3 and 4, use model derived ECS of ~3-3.2.
All the scientific literature using observational EBM estimate about 1.7. Curry’s two estimates (second responding to critiques of first) are NOT outliers.
AR5 specifically refused to give a central ECS estimate precisely because of the discrepancy between methods.
Incorrect, Istvan. Current estimates for ecs are derived from paleoclimate data, modern warming trends, as well as models.
blob:https://wattsupwiththat.com/f97ff816-7a69-45f2-adf7-adb3d4c2e148
You’re not looking at all the empirical studies, eg: https://skepticalscience.com/climate-sensitivity-advanced.htm
You are looking only at AGW propaganda
Actual CO2 physicists say ESC = ZERO
https://www.youtube.com/watch?v=hQt_I-RvGF4
(summary at 57:00 if he rest to too much much for you)
You say “empirical studies” then tell us, from measurements, how much warming effect CO2 has had in the last 45 years.. with measured evidence.
And please, do not use the surface temperature fabrications, which are totally unsuitable for the purpose because they are so incredibly tainted by urban, made-up, airport, and homogenised fakery as to be a totally meaningless load of nonsense, that does not resemble even remotely the majority of real raw measurements from around the world.
SCS, ShmeeCS
The current warming is driven by the sun. Not 0.04% of the atmosphere.
Dead wrong. Solar irradiance was in a slow dimming phase for the 50 years from 1970-2020 — yet the Earth warmed at the fastest rate in millennia. Read science instead of making up theories out of whole cloth.
30 year (agw climate period) trailing TSI says otherwise.
Only atmospheric warming in last 45 years is from natural non-human-caused El Nino events.
Think otherwise.. show us the CO2 warming in the UAH data.. Do not use the El Nino, spike+ step changes.
Show us how much warming CO2 has caused over that period.. using data.
God save us …
*your* graph shows TSI varying just 0.2 W/m^2 from 1950 till now.
And that is at TOA.
So to get absorbed solar we need to divide by 4 (to get Earth’s shadow area) and multiply by 0.7 (albedo)
And what is the massive variation in TSI that results just 0.035 W/m^2.
That is variation not increase.
In that time the RF caused by increasing GHGs has increased by ~ 2.5 W/m^2.
“0.2 W/m^2”
What do you think that means, Anthony? After you told us that you had no interest in learning the precise meanings of any of these scientific words? Since they’re all just “semantic” games to you?
He meant YOUR words were just semantic games. Scientific data is just fine.
No, he said “why are you getting caught up in semantics”. That is because “semantics” means “the meaning of words”. Most of us learned by about age 4 that different words have different meanings, and those who couldn’t associate the correct meanings with the correct words got assigned to the short bus pretty quickly. Which bus did you take?
Look up thermal lag Mr twonk.
“Dead wrong. Solar irradiance was in a slow dimming phase for the 50 years from 1970-2020 — yet the Earth warmed at the fastest rate in millennia.”
Not true.
There are at least two other times in the recent past when temperatures warmed at the same magnitude as the current warming.
Here is a Phil Jones chart demonstrating the similarities:
Lol! My statement about man caused warming includes the very data you posted!
The Phil Jones chart shows three periods since the end of the Little Ice Age where warming took place and all three warmings are of the same magnitude. The decades of the 1880’s, and the 1930’s, show it was only a few years ago that these temperatures prevailed, not thousands of years ago, as you contended.
the point is that while the sun’s output slightly decreased over the 50 year period from 1970-2020, the earth warmed. Therefore, contrary to the previous post, global warming during that period cannot be due to changes in the suns output.
Here’s 45 years of empirical ECS
No source indicated, ECS not even mentioned.
ECS is effectively ZERO
You’re now off into totally made up stuff instead of partially made up stuff, Bnice. Did you forget your meds?
Lol.
I’m making an observation, not indicating a preference. The modern warming trend is a significant and rapid change over human timescales.
So you are indifferent to human flourishing?
You don’t seriously expect anyone to buy the idea that you have not presented the warming as a problem to be resolved?
The warming is ‘significant’ only in statistical terms in the sense that measurement error is (probably) low enough that we can be confident that temperature actually has warmed. It is not significant in the colloquial sense of having a meaningful impact.
The supposed rapidity of the warming is fairly irrelevant, especially if you are so certain that you understand the driver. As an argument, claiming that the rate of warming is unprecedented is only circumstantial evidence that the main cause is CO2 concentration. It doesn’t make a case that it is dangerous.
My comment did not do any of the following:
These are all diversionary claims you are attributing to me so that you don’t have to argue the substance of the point I made, which was, simply: the modern warming is rapid and of large magnitude on human timescales.
It is large in relation to past global changes on human timescales.
Do you forget that you post here on a regular basis?
We all know where you’re coming from. We’re not bound to evaluating your comments strictly on the words in the specific post.
It’s very disingenuous to pretend that you do not believe that the current warming trend is causing harm already, threatens to have catastrophic effects, and is caused by CO2 emissions enhancing the greenhouse effect.
I am not trying to deflect or divert from your narrow point at all. I largely agreed that there has been warming that is statistically significant. I disagree that there is a way to test a claim that the warming is unprecedented in human timescales (if that term refers to the period during which humans have lived on earth). I also disagree that we know that CO2 is the sole or primary cause of the warming.
There are no proxies that I am aware of that can reliably resolve temperatures to an annual or decadal period over the past 2 million or so years. You simply cannot know whether proxy data that blends 50 or 100 years into one value might have seen years of rapid warming and cooling.
Even if by human timescales you mean the extreme of a human lifespan, again I am not sure that the data for the 1930s is sufficiently global to draw any valid conclusion that it was cooler than today. Once we have a few centuries of satellite data you might be able to make some solid claims.
And what if the warming is unprecedented? The development of human society is also unprecedented during this period. If there is a beneficial warming and fertilization effect of our unprecedented use of fossil fuels, why must that be seen as a bad thing when it is manifestly a benefit to us?
Most importantly my main point is that the warming is not significant in terms of having a negative impact on society or ecosystems. If anything it seems to be beneficial to agricultural output and weather-related deaths.
You need to respond to my actual comment instead of some other contention you have with me from some other discussion you observed in the past about some other subject.
All of this is conjecture, you’re not providing any data to substantiate these claims. The modern warming period is more rapid than the deglaciations, it is more rapid than any global-scale change observed over the Holocene, and temperatures are almost certainly warmer today than any point in the past two thousand years. When Oldseadog said “a slight slow warming,” that was not an accurate depiction by any human scale.
“All of this is conjecture, you’re not providing any data to substantiate these claims.” Please provide the data. 😉
The temperatures are not any hotter than in the last two hundred years, much less in the last two thousand years.
You need to get that bogus Hockey Stick temperature profile out of your head.
“You need to respond to my actual comment”
When was the last time you responded to one of my physics questions, AlanJ?
“The development of human society is also unprecedented during this period.”
You obviously have not included the downward spiral in education and wisdom. lol
“It is large in relation to past global changes on human timescales.”
Nope. See Phil Jones’ chart just above, which shows we have experienced changes of a similar magnitude several times in the recent past.
We are not experiencing unprecedented warming today.
Dear Alan — If you haven’t noted already, you have ‘earned’ 37 ‘dislikes’ on WUWT for stating a fact: “The modern warming trend is a significant and rapid change over human timescales.”
In other words, essentially the entirety of WUWT denizens now officially admit to denying easily accessible data. This is the caliber of people now inhabiting the website. It’s a travesty that none seem to have any coherent explanation for the behavior of the climate, but are only interested in snark, ad hominems, or twisted logic to supposedly ‘defend’ dark silos of cognitive dysfunction. Some of this is expected on a Denier website. But these posts are so far below any standards of rationality it bogles the mind.
But please keep up the good work — for as long as you can put up with the replies
Thanks, Warren, likewise. The WUWT contrarian set seem to be more determined to dispute every word the “other side” says than they are to actually figure things out, to their own detriment. I think there’s value in pushing back against the misinformation, even if it never gets through to most here.
Certainly the “adjustments™” to the already tainted urban surface data have been rapid. !
Data that isn’t so tainted and mal-adjusted show nothing out of the ordinary.
Why is there a repeating trend that keeps getting warmer and warmer?
This is Hadley 3 data.. so already had the cooling trend from 1940-1970 partially erased.
Many places show 1980,90 as cooler than 1920, and 1979 being considerably colder again…..
… but not once the “climate brigade™” has finished with it. 😉
So this is an example of tainted and maladjusted data? Show me the untainted and un-maladjusted data please.
Phil Jones is one of the originators of the instrument-era Hockey Stick chart. All other Hockey Stick charts use his bastardized data in one form or another. That’s why they all have the familiar Hockey Stick Chart “hotter and hotter and hotter” temperature profile.
Here’s how to identify a bogus, bastardized Hockey Stick Chart: If the 1930’s, don’t show to be just as warm as today, then you are looking at a bogus, bastardized Hockey Stick Chart.
When asked by skeptics to supply the data he used to create this Hockey Stick chart, Phil Jones said he would not give his data to anyone because he thought they would try to criticize it and find fault with it.
So go ask Phil Jones how he created the instrument-era Hockey Stick chart. He won’t tell us. Maybe he will tell you.
But, regardless, the written, historic, regional temperature records refute the bogus Hockey Stick Chart “hotter and hotter and hotter” temperature profile. None of the regional temperature records have a temperature profile like that.
And Phil Jones got all the temperature data he had from these very same written, regional, historic temperature charts.
The historic temperature charts do not have a Hockey Stick temperature profile, so how did Phil Jones manage to create a Hockey Stick profile out of data that does not have a Hockey Stick profile? Something to think about.
There’s a lot of history being misrepresented here. The various global surface temperature datasets, such as those from the UK Met Office and CRU (HadCRUT) and NASA’s GISS (GISTEMP), share some common data sources because there are only so many observing stations globally. However, each organization also incorporates unique station records. For instance, CRUTEM includes many station records contributed directly to the Climatic Research Unit (CRU) through data-sharing agreements with national meteorological agencies. These agreements give HadCRUT access to data that is not necessarily in other datasets. So, it isn’t ‘Phil Jones’ data.’ It’s observational data from surface stations worldwide, collected and managed by national meteorological agencies.
Additionally, the station records in datasets like NOAA’s Global Historical Climatology Network (GHCN) are freely available to the public in their raw, unadjusted form, exactly as recorded at the stations. Anyone can access and analyze these records independently. NASA’s GISTEMP uses the GHCN dataset in their analysis.
It’s also worth noting that the global temperature datasets differ significantly in methodology. Each applies distinct approaches to quality control, bias adjustments, and spatial interpolation. These differences result in independent analyses, even when some data sources overlap. Claiming that all Hockey Stick charts are based on one ‘bastardized’ dataset is not only false but also dismisses the rigorous, independent verification performed by multiple scientific groups around the world.
Anthony Banton was at the UK Met Office for many years and can probably provide a better overview of this than I.
That is one reason Phil Jones gave during a heated exchange, but it doesn’t tell the full story. The primary reason he didn’t release all the data was that most of it was already publicly available from other sources. The CRU isn’t the primary steward of these datasets, they simply use them in their analyses, just as other organizations do.
Additionally, a limited amount of the data CRU used came from national meteorological agencies through private agreements that restricted redistribution. Jones was reluctant to release this data without permission because doing so could have jeopardized CRU’s partnerships with these agencies, which were essential for their work.
It’s published in meticulous detail in the peer reviewed literature. See, e.g., Osborn et. al, 2020.
You can get all of those same records yourself, and you can combine those records into a global temperature dataset. The skeptics at Berkeley Earth did exactly that. I’ve done my own analysis with the raw land-only datasets from GHCN. It isn’t some arcane practice that mere mortals cannot participate in. Do your analysis, present your results.
“It’s observational data from surface stations worldwide, collected and managed by national meteorological agencies.”
It’s not observational data. Observational data doesn’t show a Hockey Stick “hotter and hotter and hotter” temperature profile.
The only way to get a Hockey Stick temperature profile out of the Observational Data that has no Hockey Stick profile, is to bastardize that data.
You do know that some of the data that Climate Alarmists claim is “Raw” is not really raw at all, it has already been bastardized? You have shown a chart in the past showing a comparison of the Hockey Stick temperature profile with the “raw” data, and they are very similar. That is bastardized “raw” data. That’s why it looks like a Hockey Stick profile. Take that chart to Tony Heller’s website and see what he has to say about it.
The Raw data from all around the world shows no Hockey Stick temperature profile.
So where did Phil Jones and all the other bastardizers of the temperature record get the data they used? They didn’t get it from the written, historic regional temperature data because none of that shows a Hockey Stick profile.
Before the Hockey Stick chart was created, the weather was cyclical, where the temperatures warmed for a few decades and then cooled for a few decades and then the pattern would repeat, with the highs and the lows within a range of about 2.0C of each other, with equal highs, and equal low points.
The Human-caused Climate Change meme came along, and then the computer-generated Hockey Stick was created, and obviously it was created in such a manner as to bolster the Human-caused Climate Change meme by changing the temperature profile to mimic the increases in CO2 in the atmosphere. CO2 goes up and the temperatures go up. Such a BIG LIE!
I don’t see how anyone can believe in a Hockey Stick temperature profile if they have seen the written, historic temperature records which do not show a Hockey Stick temperature profile. Have you looked at any of the written, historic temperature data?
The temperature profile has been changed dishonestly, to promote a political agenda.
You are free to believe in fairy tales.
You are simply begging the question. The data in e.g. GHCN raw are the records as they were reported from the station, with no alteration. If these data indicate a long term warming trend, that is what the data shows.
If your claim is that these data have been fraudulently tampered with and are presented as being raw when they are not, well, that’s a conspiracy with no evidence. Tony Heller uses the GHCN raw values in his various analyses, so he doesn’t buy into this conspiracy.
Heller’s analyses focus almost exclusively on the contiguous US, that is one reason why they look different to the chart I posted, showing global temperature change.
Heller also employs egregiously wrong methods of aggregating geospatial data that fail to account for uneven sampling and changes in the composition of the station network, that is the other reason why his analyses don’t produce results consistent with anybody else.
I took all of the GHCN raw data (so land-only) and used a basic 5×5 grid to account for sampling distribution, then took the gridded averages (black line in the image below). It looks almost identical to the results from the major temp indexes from NASA, Hadley/CRU, and BEST:
No adjustments, no bastardization, just basic competence in working with geospatial datasets.
That would be because the author of that chart, Phil Jones, bastardized the temperature profile so that today would appear to be the hottest time in the instrument record, as a means of promoting the Human-caused Climate Change narrative.
Notice that Phil Jones got the magnitude of the previous warmings correct. He shows that the 1880’s and the 1930’s high points were similar and on the same level, but he found a way to make them appear to not be as warm as the current warming, in order to promote the climate change meme.
Now, if you were to put the 1880’s, the 1930’s, 1998, 2016, and 2024, all on the same horizontal line on the chart, then you would have an accurate rendition of the global temperature profile, where , since the Little Ice Age ended around 1850, the temperatures have warmed for a few decades and then the temperatures cool for a few decades and this pattern has repeated right up to the present day, with the high temperatures of the 1880’s, the 1930’s, 1998, 2016, and 2024, all being within a few tenths of a degree of each other at the high points.
This cyclical temperature profile I describe, and Phil Jones tried to erase, is confirmed by the regional, written, historic temperature charts from all around the world that all show a similar cyclical profile. None of them show a “hotter and hotter and hotter” Hockey Stick chart temperature profile.
All of them show we are not experiencing unprecedented warming today. It was just as warm in the recent past. In the memory of people still alive today.
The written, historic temperature records show a cyclical temperature profile. Temperature Data Manniplators changed that reality and as a result, have caused GREAT Harm to human society by scaring them into thinking CO2 is causing the Earth to overheat. No overheating is taking place.
The basic premise (the Hockey Stick) on which you base your climate change position is wrong. You are assuming too much. Don’t feel bad about that, you are not alone. A lot of people have spent a lot of money trying to make everyone into a climate alarmist. It works on some people. It shouldn’t work on people who have seen the written, historic temperature records, either.
Start living in the Real World. It’s a lot less scary, at least where the climate is concerned.
Too bad the historical record completely refutes what you want to believe.
Wrong, as usual. Temperature change at the end of the MWP was vastly faster than anything today.
Citation?
Garbage.
You’ve not shown one citation.
Global temperature?
Pull the other one; its got bells on
About 2.5 million people die each year due to the strokes and heart attacks caused by cold weather when the body attempts to conserve heat and constricts blood vessels raising blood pressure. About 500,000 die from heat-related causes.
https://www.thelancet.com/action/showPdf?pii=S2542-5196%2821%2900081-4
Maybe I should really bundle up before I have to go out and shovel. Come to think of it, when I ski fast sometimes when it’s really cold, I sometimes get an upset stomach feeling. I’m definitely going to look into this. Thanks for your comment.
Wearing a scarf helps. I recommend it.
Across the mouth and nose… around the neck-not so much.
It is both slight and slow, as well as being close to 100% natural.
15% depends on where you set zero and how many degrees to boiling point of water for example, doesn’t it? If I use Rankine I get roughly 6.4% and Kelvin about 0.6%.
According to AI The SI unit of temperature is the kelvin, represented by the symbol K. The kelvin is one of the seven base units of the International System of Units. So that would be the one to use.
The Kelvin scale has the same scaling as the Celsius scale, the change in temperature is the same in both.
If Mr. Hawkins truly believed this nonsense he would be standing in Tiananmen Square demanding China reduce their emissions as they are the only country that really matters at this point. The fact that none of these dolts ever mention China makes it clear it is entirely a grift.
Think Marxism globally, but act Marxism locally.
People like “free” government owned roads.
Since government is not completely incompetent when it comes to building roads, this proves that Marxism is a good thing?
A mixture seems to work well.
It’s absurd to say that public roads or other such government initiatives as firefighting constitute socialism. You’re swatting down a very weak straw man there.
Doesn’t a petroleum product or two go into the building of roads?
Isn’t a problem defined before a solution can be contemplated? Or do you normally work backwards — deciding that China’s behavior determines whether the earth is warming or not?
What an absurd comment, even for you Beeton!
The problem that Hawkins and you consider to be ‘settled science’ is that CO2 emissions from fossil fuel burning cause warming (and inexplicably that’s supposed to be bad).
Given that asinine assumption, it follows logically that the country producing the most CO2 emissions is the country causing the biggest part of the ‘problem’.
My comment went right over your head.
Oh did it? Well you are a spaceshot, so that may well be the case. Why don’t you type real slow like so us rubes can understand?
Just reread the post and think it thru.
You are a mental case Beeton
Most religious cult zealots are 🙂
Now let’s debunk this “religious cult” thing.
A religion relies on belief.
There is no proof that Jesus, Mohamed, Buddha etc were in any way divine and speaking the word of God.
That is belief.
Science relies on evidence. Observed data and causation science, giving correlation to boot.
Most peeps here are believers in the sense that they rely on scientists being either corrupt or scammers, by dint of taking some contrarian with similar “belief” using the data that scientists amassed and coming to their preferred solution.
The only “religious” cult here is the one that you are a member of.
Nah Anthony.
“If it walks like a duck and quacks like a duck, it is a duck”.
I give you AGW acolytes > religious cultists.
Mr Blanton cites the scientific research. You’ve cited none. Which qualifies you as one of a religious cult.
The first giveaway of a cult is that they have false objects to deify.
The Holy Hockey Stick is what the AGW religious cult worships.
Prove that I’m wrong.
“The Holy Hockey Stick is what the AGW religious cult worships. Prove that I’m wrong”
It’s not a “false object”.
It is a graph of the Earth’s ave temp for the last few hundred years.
Researched by hundreds of climatologists over decades.
It is what it is.
If you want to believe it’s the result of incompetence and/or fraud. That is your problem. I cant help you with your conspiracy ideation.
And so it goes on.
I say again a climate science is not based on belief – due physical science and corroborative observation. Causation and correlation.
Yours clings to the few who shout loudly and have ther alternative views siezed on here with no real push-back from the science side.
They don’t really care – to busy doing their jobs, of which they know more than you.
And so you think the contrarians are correct.
Using the bizarre thinking that WUWT is a good place for peer review that always makes the “win” by dint of numbers.
Wazza, believe whatever you like mate, just don’t expect me to.
(I also say this to proselytisers for other religious groups, so don’t feel you’re being singled out for special cult-rejectionism. I do believe in equal treatment and opportunity for all.)
And shouldn’t
“It is a graph of the Earth’s ave temp for the last few hundred years”
be –
” . . . ave Maria temp . . . ”
?
Faith without evidence is the essence of religious belief. Which is what Deniers exhibit. If, on the other hand, your understanding of the physical world is based on scientific theories and the data and evidence that confirms those theories, you are rational. In which category do you place yourself, Mr?
Well Wazza, if I was into categorizing other people (which I try to assiduously avoid until they out themselves by their own statements & actions), I would categorize myself as a rationalist who concludes that science is never “settled” (as claimed by the AGWist cult), and also that the only rational and honest take on “climate science” (whatever singular discipline that is supposed to embody) is –
“we just don’t know”.
oh, but in passing Wazza, I should also mention that I thoroughly agree with the IPCC’s position that the planet’s climates are –
“coupled, non-linear, chaotic systems”
and as such, predictions about long term future behaviors are not possible.
So at least we can both agree with the IPCC’s position on this, it being the bible for the AGW climate cultists?
The IPCC is referring to the short term. the IPCC didn’t say the climate was chaotic OVER DECADES,, , which is the time period over which climate projections are made.
Climates are ALWAYS chaotic systems Wazza.
Always have been, always will be.
Why would they stop being chaotic over just a few decades, and stay in states of order forever after?
Jeez, even I can read can read and comprehend IPCC reports.
Do try to understand this time. Its really not that hard: “Weather is chaotic because air is light, it has low friction and viscosity, it expands strongly when in contact with hot surfaces and it conducts heat poorly. Therefore weather is never in equilibrium and the wind always blows. The climate is mostly explained by equilibrium radiation physics, which puts the brakes on variations in global temperatures. Effects from weather, the Sun, volcanoes etc. currently only causes a small amount of chaotic behavior compared to the deterministic, predictable greenhouse gas forcing for the next 100 years”
Like to ‘interject’ here: Weather forecasters (projectioners?) cannot get my local forecast correct beyond 3 days… I don’t see how ‘climate’ ‘projectioners’ can do better… I’ll go with “we just don’t know”…, and ‘adjust’ to what Mother Nature gives.
So You claim to ‘follow the science’ but yet you dismiss the universal findings of science wrt human caused climate change. You can’t have it both ways.
I don’t think “universal” actually means what you think it means, Wazza.
You believe there are absolutely NO dissenting scientists’ positions about AGW in the whole universe, let alone our puny planet?
Just try and find one peer reviewed scientific paper, or one scientist who has published such a paper, debunking AGW. Go for it.
Ever heard of or read the positions of scientists such as Prof William Happer, Wazza?
https://en.wikipedia.org/wiki/William_Happer
Happer hasn’t published any papers in scientific journals debunking agw or the IPCC assessments.
‘peer reviewed’… again?
AH, but scientists do know the cause of the fastest planetary warming in millennia — Human activities, primarily the burning of fossil fuels. You haven’t figured that out?
I haven’t figured out how this old world works, Wazza, and neither has anybody else.
As far as how our thousands of climates work, they do what they do, how they do it, when they do it, why they do it , where they do it.
If it was all figured out, we wouldn’t have to continue with any more “climate research”, would we?
It would all be on apps every day along with the tides times tables.
The bottom line / last word on all this bullshit Wazza is –
“we just don’t know”
Yes, once again you’ve confirmed you don’t know much of anything.
What an ignorant bigot. And a fool.
And you’re not I suppose?
Would that be because you are among the echoes that hug and cheer each other along (rhetorical).
Not a valid statement (aside from being an ad hom), due the forum it’s placed on, and the fact that climate scientists, whom I quote, are far more knowledgable about their profession than any ideologically motivated peep on here.
But thanks for your kind words, Mr Operator – that has added a lot to the discussion … but I’m sure you feel better for it.
Bless.
“My comment went right over your head.”
I think your comment went over your head.
If CO2 is a problem, shouldn’t the country that is releasing the largest amount of CO2 as well as increasing their CO2 emissions by huge amounts, be included in the discussions regarding the emissions of CO2.
The fact that nobody in the alarmists camp cares to address the issue of China, is just more proof that the real issue was never CO2.
Read the logical construction of ringworldrefugee’s comment. He thinks China’s failure to reduce emissions is an argument against the validity of the scientific claim that climate change is a problem. Do you?
More absurd trolling. Rwr’s comment was that if Hawkins truly believed his claims then he would be calling for China to stop increasing CO2. And the fact that he is silent on that while loudly demanding that the irrelevant UK slash emissions indicates that the claim is motivated by how it benefits Hawkins.
He’s talking about the data, and what it means. China is an entirely different topic. Your argument is called ‘deflection’.
Your argument is called ‘defecation’.
“If CO2 is a problem, shouldn’t the country that is releasing the largest amount of CO2 as well as increasing their CO2 emissions by huge amounts, be included in the discussions regarding the emissions of CO2.”
Yes,
Trouble is Xi will do exactly what Xi has planned for China.
This is basically world domination.
He’ll not do that by giving up FF.
So the answer then is for everyone to also do nothing ?
YES! By Jove, I think he’s got it!
I can see where poor Climastrology acolytes have a hard time evaluating which is the way to go:
path 1:
Annihilate your own economy, enable your enemy’s domination of your country, have absolutely no impact on CO2 concentration.
path 2:
Build up your country’s economy, stop pouring trillions into your enemy’s economy, stifling their ability to dominate, have absolutely no impact on CO2 concentration.
Close.
If our spending trillions with no result is compared to spending some amount less than trillions towards adaptation, I vote adaptation.
This assumes the CO2 scare is legit in the first place.
They’re probably going to keep going up, exactly has they have been projected to for decades.
Or they could go down due to the changing AMO, the subsidence of the El Nino.
AGW prophecies are nothing more than low-level computer games, or tarot readings.
Temporarily they will certainly fluctuate in response to short term variability, over the long term they will continue to rise as they have been under continued GHG forcing. Projections have been on the mark for >40 years and have been consistent in showing continued warming:
Or they could go down, as temperatures dropped after 2 centuries of the medieval warm period.
They are still recovering Viking artefacts from recently melted glaciers, so the medieval warming was comparable to today.
There is no evidence of a globally coherent MWP comparable to or warmer than today:
(figure from P2k Consortium, 2019)
But this is irrelevant because the forcing regime in the modern period is driving warming, and unless human emissions of CO2 cease, that is going to be the prevailing driver over the coming decades.
Lol
There is plenty of evidence of a global MWP, including proxies in Antarctica which demonstrate MWP temperature fluctuations.
https://wattsupwiththat.com/2016/02/02/the-medieval-warm-period-in-antarctica-how-two-one-data-point-studies-missed-the-target/
There was even a Climategate email, the New Zealand Oroko swamp email.
Climategate email 3579:
Hi Keith,
Here is the Oroko Swamp RCS chronology plot in an attached Word 98 file and
actual data values below. It certainly looks pretty spooky to me with
strong “Medieval Warm Period” and “Little Ice Age” signals in it. It’s
based on substantially more replication than the series in the paper you
have to review (hint, hint!). In terms of rbar, sample size, and eps, it is
probably okay back to about AD 980 at this time. I still have 3-4 more
subfossil sections to process, but it is doubtful that the story will
change much. When I come over in October, I am thinking about asking
Jonathan Palmer to come over from Belfast for a visit. What do you think
about that?
Ed
The problem, as always, is that the people touting a globally warmer mwp have no global reconstruction showing such a thing, they have a set of disparate individual records indicating asynchronous periods of warmth in various locations. There is no effort to determine if counteracting cooling occurred elsewhere. The linked WUWT article sums it up nicely: “The exact timing and possible regional differences of the MWP warming still have to be worked out.” Well, the 2019 study I’ve cited above has done exactly that. There is no evidence of a globally coherent MWP comparable to the modern warming.
I am not going to bother posting , yet again, the myriad of studies from all round the globe that show the MWP was real and at least as warm, probably significantly warmer, as the peak of the now subsiding El Nino.
I would still like to see actual measurements of how much “CO2 warming” there has been in the last 45 years.
You can’t do it from urban surface data fabrications, because they are too tainted and corrupted to show anything.
You would have to use UAH data.. and there is no sign of any CO2 warming there, just the effects for some strong El Nino events.
Why are the El Nino events in the UAH data getting warmer over time?
Oh dear, you still haven’t realised that these warm El Ninos spread out warm water from the ENSO region.
Also, over the last 50 years El Ninos have produced far more warming than the small amounts of La Nina cooling
And I would still like to see actual measurements of how much “CO2 warming” there has been in the last 45 years.
Why did you avoid answering that part ??
This graph isn’t showing any change in the strength of El Niño events. Why do they keep getting warmer and warmer through time? What is driving that change in the climate? Do the El Niños produce the climate forcing themselves? How? And why is the earth not a cinder given that El Niño events have been occurring for a very long time?
Oh dear, seems AlanJ cannot see that the El Ninos are significantly more above the El Nino, than the La Nina’s are below the La Nina line.
Look at the chart, with both eyes….. and think !!
Absorbed solar radiation into the tropical oceans drives warming of the oceans, most recently added to by the HT event.
The 1950-1980 period had more La Nina than El Nino.
Earth is not a cinder because we are only a degree or so above the COLDEST period in 10,000 years. Very much on the edge of an ice age.
Most of the last 10,00 years has been significantly warmer.
You reference an outdated version of the index that doesn’t extend to present day. Here is version 2:
So your theory fails to explain observations. Nor does it explain why there would be a multi-decadal trend in the strength of EL Nino absent an external forcing to begin with.
If El Ninos drive long term surface warming and El Ninos have been occurring for a long time, the planet should be extremely warm by now. Why is it not?
It’s amazing how easy it is to get a consensus, when you start by throwing out any data that doesn’t fit the narrative you trying to push.
Why do you keep asserting this lie?
https://wattsupwiththat.com/2018/11/03/yet-another-study-illustrates-that-the-medieval-warming-period-was-not-regional-but-global/
This map shows that, at some point during the 200-year span broadly defined as the MWP, some places were warm (no indication of how warm, or the exact timing), some places were cold (lots of gaps, especially in the SH), some places were dry, some places were wet. It does not provide evidence of a temporally coherent global warm period with temperatures exceeding those of today. This is a vital distinction, which seems lost on almost everyone here.
The study I cited above takes all of the records shown in that map and combines them in a global climate reconstruction. This reconstruction shows no evidence of synchronous global warmth during the putative MWP.
“….some places were cold….”
like now ??
My feet are cold even though they’re under a blanket.
The warming today is globally synchronous because it is being driven by GHG forcing:
It would be necessary to show a similar map for the MWP to make the claim that is being made in this thread. Instead, such a map for the MWP would look something more like this:
First image is based on junk and non-existent data.
I’m sure you are well aware of that.
No it isn’t.
“Trends in global average surface temperature between 1990 and 2021 in degrees Fahrenheit per decade. Most of the planet is warming (yellow, orange, red). Only a few locations, most of them in Southern Hemisphere oceans, cooled over this time period. NOAA Climate.gov map, based on data from NOAA Centers for Environmental Information.”
This is becoming a clown show – again.
Please…PLEASE see the Mendenhall Glacier fossils above to find an indication of ”how warm”….so you never have to ask again.
I didn’t realize that the Mendenhall Glacier was the entire planet. Good to know.
Which places cooled during the MWP? Not Europe, not North America, not South America, not China, not Australia…
Mars. I hear it’s cold as hell. And lousy child care, too.
Mars ain’t the kind of place to raise your kids
In fact it’s cold as hell
And there’s no one there to raise them if you did
Probably because it isn’t …
https://www.carbonbrief.org/global-extent-of-climate-change-is-unparalleled-in-past-2000-years/
But what if it was?
what was the global driver (it must have been).
It can only have been our Sun.
But again, that is not the case now.
Ergo current warming is being caused by something else.
And what is that something if not a 50% increase in by far the most important non-condensing GHG ?
Now I see where that “2000 year” claim, made by another poster, came from.
According to the charts below, it was just as warm in the Early Twentieth Century as it is today. In both hemispheres.
Lots of regional charts Tmax and not, show the very same thing.
Why do climate alarmists ignore the past? I think we know why.
Don’t be a pillock !!
Lots of evidence of a globally coherent MWP;
Dendrochronology (of more than one tree !! ), Ice cores, Archaeology, Sedimentology …
I’ve just cited a paper, published in 2019, presenting a global climate reconstruction built from the largest database of paleoclimate records ever compiled, which states that there is no evidence of a globally coherent MWP. Any argument to the contrary needs to address this study, along with numerous other global reconstructions, none of which show.a MWP warmer than today.
Forget the evidence of your eyes and go with the reconstruction! Lol.
You should probably stop now.
What does this comment even mean?
Who was around to see the global temperature situation in the MWP??
All we have are proxy data, all of which indicate that any warming that existed during the MWP was localised and on nowhere near the range or scale that we see, with our own eyes, today.
So stupid doesn’t deserve an answer.
Did you mean your graph using proxies and modern instruments? If the proxies are so true, why the need for modern measurements?
Modern measurements are rather obviously better than indirect proxies. And the proxies themselves must be calibrated to the observational record.
Question. By what mechanism did the rest of the globe remain unchanged (or cooler) while the high northern latitudes remain warmer than today for 3 centuries? (the age of the trees below)
Yeah, and trees grew at higher elevations during that time, and tree line evidence is global, and it shows it was warmer in the past than now because trees today don’t grow at those elevations because it is too cold today.
Tree stump evidence and tree line evidence are rock solid evidence that the climate was warmer in the past than now.
If Scenario C is “as B w/constant forcings from 2000”, why do B and C start to diverge from 1985?
Scenario C assumes assumes a curtailment of emissions, starting in 1988, such that net forcing ceases to increase by the year 2000. The scenarios differ from the starting point. The models also include internal variability.
The labelling is extremely poor in that case.
It might be worth adding a note when posting that chart to avoid future confusion.
You assume that the intent is to inform.
Only to a limited extent, or the source of the figures would have been included. I assume it’s from the Hausfather paper.
Hmmm, it’s not from Hausfather et al 2020. It must be one of life’s little mysteries.
The labeling is adequate, the key difference is constant forcing from 2000. The graph is labeled with the source of the projections, so any interested readers can easily find their way to the additional context.
The labelling reads :Scenario C: As B w/constant forcings from 2000″
You wrote above:
“Scenario C assumes assumes a curtailment of emissions, starting in 1988, such that net forcing ceases to increase by the year 2000. ”
That indicates an additional undocumented difference from Scenario B”.
Sorry. Where is that labelled?
P.S. Figures printed in papers almost always have additional explanatory material in the caption, because graph real estate is best served by the visual representation of the data.
The labels adequately describe the principle difference between the scenarios, both B and C include curtailment of emissions.
The graph is titled “Hansen, et al. 1988 projections compared to observations.”
See Hansen, et al., 1988.
That might be what it’s titled, but it’s obviously not from Hansen et al 1988, unless they had a time machine.
Something like “Projections after Hansen et al 1998 compared to observations” would be closer to the mark, since Hansen et al 1988 figure 3a runs from 1958 to 2019.
Labelling Scenario C as “Scenario C” is fine, but it is not “As B w/constant forcings from 2000″. It is more like “forcing increases reducing from 1988; constant from 2000”.
That certainly doesn’t say that Scenario C is “As Scenario B w/constant forcings from 2000″. There are a number of differences between the scenarios, as can be seen in Figure 2.
The CO2 forcings do indeed diverge from 2000, trace gases diverge earlier, but the overall difference is minor prior to 2000.
Please note that Hansen’s Figures have explanatory captions.
The labeling was perfectly clear to me, and resulted in no confusion whatsoever. It does seem to have confused you, but luckily you seem to have located Hansen 1988 on your own and are no longer confused. All is well.
Not at all. The labelling of Scenario C is just plain incorrect.
That wasn’t luck. I read it years ago. It’s one of the foundational papers.
I wasn’t confused to begin with, and that hasn’t changed. The figure you posted incorrectly characterises Hansen’s Scenario C.
Re-reading the paper did remind me of the major flaw in the way the scenarios are handled, so that was worthwhile.
Alas, not. The Figure is still mislabelled.
The labeling of scenario C is not incorrect, it highlights the defining feature of the scenario, constant forcing from 2000 onward, which distinguishes it from scenario B. Both scenarios involve emissions curtailment, but scenario C assumes more aggressive and rapid reduction, leading to constant forcing.
You claim that you weren’t confused, so it’s curious that you’re insisting the label is confusing. No one else here seems to be struggling with it, and there’s no evidence of misunderstanding. The label is perfectly adequate.
There seems to be a fine line between confusion and curiosity, so they can become confused.
From Hansen et al 1988 Section 4.1
If you feel that “Scenario C: As Scenario B w/constant forcings from 2000″ fully characterises this, so be it.
From Appendix B
Is the defining feature of that “Business-as-usual”?
Would you prefer “misleading”? “Confusing” is a somewhat less loaded term.
In any case, the original question
has been resolved by reading between the lines in Hansen et al 1988.
It does raise more questions, which might be answered by the paper(s) from which the mystery chart and its friend were extracted. I incorrectly guessed the source as Hausfather 2019.
Could you provide a reference, please?
The “models” are total anti-science junk from the ground up.
Little more than GIGO, non-physics, assumption driven computer games.
Physical reality is not in their realm of simulation.
Roy Clark: A Nobel Prize for Climate Model Errors | Tom Nelson Pod #271
This video and the paper it’s based on are quite silly. Revealed starkly by the fact that Manabe’s early model, claimed to be wrong by Roy Clark, correctly predicted the tropospheric warming and stratospheric cooling resulting from GHG forcing that we observe today. Modern GCMs skillfully reproduce emergent features of the climate system, which they could not do if they were “junk from the ground up.”
It is little wonder that the paper has been published without adequate peer review in a fake journal created by climate contrarians.
The video is based on actual facts.
Models are build from the ground up on junk-science… period.
They use an atmospheric model that does not exist anywhere on the planet.
The atmosphere warming over the last 45 years has come from El Nino events, which Manabee’s model knew absolutely nothing about.
Modern GCM as just as bad when it comes to the actual causes of warming only coming anywhere near close when there is an El Nino event.
Once this current El Nino drops away, they will look even worse than they do now.
You’ll have to explain why the junk-science models have been making good projections for 40+ years and why the are able to skillfully reproduce emergent features of the climate system.
How do El Nino events provide long term climate forcing? Why haven’t they caused the earth to burn up?
“models have been making good projections for 40+ years”
They haven’t been…. The climate mafia have had to change and manipulate junk urban surface data to make things match.. even then, they have FAILED magnificently.
The rest of your comment is answered above, but I’ll show you the graph again, so you may start to understand…. or not.
Last 50 years El Ninos have been causing more warming than La Nina has been causing anything. In the 1955-1980 period La Ninos were more comment, so we got cooling.
Earth is currently in a global ice age, we are just lucky enough to be in what is referred to as an interglacial, but only a degree or so above the coldest temperatures of that period.
What is driving EL Nino to keep getting warmer, and how is a mode of internal variability in the system driving sustained multi-decadal warming?
“Why haven’t they caused the earth to burn up?”
Well, according to Al Gore, Greta (remember her ? ), & the head of the UN; the planet is on fire & the oceans are boiling, so at least we can enjoy boiled fish on toast.!!
Let us hope so, for the good of humanity!
But as I said earlier, even if you are right that we humans are driving this (entirely beneficial) warming, the jig is up sooner or later when fossil fuels get too expensive to extract. So the hopeful chart that you posted, which promises us a respite from the true catastrophic climate change of glaciation, is only a brief reprieve.
Hockey stick on roids
The recent warming has been caused by cutting down on air pollution allowing more sunlight to strike the Earth and oceans warming them. Two examples are cited below but cutting emissions is worldwide as has been going on for decades.
‘Shipping emissions reduction in 2020 led to 2023 temperature spike, study finds’https://phys.org/news/2025-01-shipping-emissions-reduction-temperature-spike.html
‘Pollution Paradox: How Cleaning Up Smog Drives Ocean Warming’
https://e360.yale.edu/features/aerosols-warming-climate-change
The continued use of unvalidated nonsense GIGO models is quite hilarious.
The continued use of deliberately super-adjusted urban surface data fabrications is also very funny.
Both represent nothing to do with “science”….. all to do with blatant propaganda.
“The continued use of unvalidated nonsense GIGO models is quite hilarious.”
Models aren’t necessary.
The observatons alone tell the tale.
Bar for the peeps who think that climate scientists (oceanographers and atmospheric scientists).
Are either:
Incompetent.
Fraudersters.
Or both.
The answer, of course to any one not ideologially driven, is common-sense.
They just know more than you.
Long term, now that’s funny. If you want long term, you could have gone back 1000 years, to the top of the Medieval warm period. That would show a drop in temperature, followed by the current warming that has barely made it back to the previous high.
Or you could go back to the end of the Holocene optimum which was as much as 3C warmer than it is today, and show the gradual cooling trend, punctuated by 5 brief warming periods, including the current one. Which would also be the warming period that started long before CO2 levels started its dramatic increase.
One thing for sure, there are more dumb and dishonest people around than ever before in global history.
The main result of increased CO2 !!
Except the MWP wasn’t globally synchronous.
And if it was there would have to have been a globaly driver of it which could only have been the Sun.
And we know it isn’t that now.
https://www.carbonbrief.org/global-extent-of-climate-change-is-unparalleled-in-past-2000-years/
“Or you could go back to the end of the Holocene optimum which was as much as 3C warmer than it is today”
And no, it wasn’t ( on a global basis) …
Why does warming have to be globally synchronous? Hubert Lamb (father of the MWP) always believed the MWP started and ended in different places at different times.
Because if it was not globally synchronous then it is not analogous to the modern warming, and there is no indication that the global mean temperature exceeded or met today’s.
To illustrate: imagine that during 900–1050 CE, temperatures in the Northern Hemisphere were as warm as today, but the Southern Hemisphere was cooler. Then, from 1050–1200 CE, the pattern reversed, with warmth in the Southern Hemisphere but cooler conditions in the Northern Hemisphere. While each hemisphere experienced periods of warmth during this MWP, global mean temperatures at any given time never matched or exceeded today’s levels – the change was not synchronous.
The contrarians here would look at this illustration and say “there is evidence of warm temps in both hemispheres between 900-1200 – it was just as warm as today!” But they ignore the the crucial detail that these warm periods did not occur simultaneously.
Did you even bother to look at the map? The legend specifically states that the proxies covered the period 1000 AD to 1200 AD. In other words, global in extent AND synchronous.
You really thought I wouldn’t notice your deceit?
“there is evidence of warm temps in both hemispheres between 900-1200 – it was just as warm as today!”
You claimed it is warmer today than it was during the MWP.
There is no evidence to the contrary.
Unless they go down, as they have done many times over the last hundred years or so.
PS: We are in a gradual cooling trend since the end of the Holocene Optimum about 5000 years ago, interrupted by now 5, brief warm periods.
Whether the current warming trend continues remains to be seen. However since each of the 5 warming periods was less warm than the one preceding makes it likely that the current warm period is pretty close to being finished.
The modern waring doesn’t seem to be analogous to any events during the Holocene:
(from Kaufman, et al. 2020)
This notion that it is merely another in a chain of similar warming events is simply not supported by the evidence. There is little doubt that the current warming will continue, because there is no indication of a substantial change in the forcing regime driving the warming barring significant action to reduce anthropogenic emissions of GHGs.
Junk science again.. So funny
Resembles absolutely nothing from anywhere around the globe.
Deliberately faked to get rid of the MWP.
There is little doubt the climate scam will continue, too much money on offer.
Real physicists have shown that CO2 does not cause any measurable warming
And that the climate models are farcical scientific nonsense computer games at best.
“Resembles absolutely nothing from anywhere around the globe.”
Dear God:
That is because it is for the entire globe !
An average.
Not aware of the concept of averaging blurring regional differences into an homogenous whole?
EG: *if* the NH an SH where opposite in sign for the period an addition would end up being zero-sum.
“Deliberately faked to get rid of the MWP.”
Sorry, I cant help you with your conspiracy theories being the answer to your anger that the world does not conform to your ideation.
Even assuming GAT has any physical validity, you genuinely believe it is possible to derive a GAT from thousands of years ago?
Of course, so does MarkW.
Perhaps you’re psychic. If not, thanks for confirming your total ignorance of Physics.
Thank you doctor, but I asked you why all the horrifically expensive medicines you’ve prescribed aren’t reducing the frequency of my migraines.
Many new American universities are simply re-labeled kindergartens. Nice to see that old good England is not far behind.
+1000
Warm bump explanation? We’ve been here before. A rather wet Icelandic volcano eruption appears to have had a similar effect. Any predictions for 2025?
After I noted the similarities in the two spikes, LT3 made the connection to Askja in an October 2024 posting.
Yes:
Was caused by one of the biggest El Ninos on record …
Anthony, Yes, but why?
Not my area of expertise, but it seems that normally the aerosols from a high latitude volcano would have less impact (less sun to block) but that water vapor might have a greater impact blocking upwelling radiation near a polar region. Could this have caused a stronger El Niño?
I’ve updated the graph to allow comparison of of both El Niño events.
gaslight
(chiefly transitive) To manipulate someone such that they doubt their own memory, perceptions of reality, or sanity, typically for malevolent reasons.
Synonym: head-game
The term originates in the 1938 British play Gas Light by Patrick Hamilton & the 1940 UK film ‘Gaslight’.
I have the bluray. Charles Boyer, Joseph Cotton and the beautiful Ingrid Bergman.
That’s the 1944 MGM version;
Here’s the original 1940 UK film
https://www.youtube.com/watch?v=UYmtzaHwCKo
& details …
https://en.wikipedia.org/wiki/Gaslight_(1940_film)
Nb: Music by Richard Addinsell who also wrote ‘The Warsaw Concerto’ for the 1941 British film ‘Dangerous Moonlight’
Yeah, Biden was doing some gaslighting today with his farewell speech, where he was singing his own praises.
Here’s the truth, Joe: You are the worst, most destructive, most dangerous, President Evah!
One more week and it will be a New Day!
If the planet is warming, and it is – slightly, it’s not warm enough yet. Humanity thrives in warmth, dies in the cold. We are only 11,000 years into an interglacial period with maybe 40,000 years to go until the next miles-thick slabs of ice cover half the planet again. The plants are still coming back – satellites show an increase of about 14% greenery overall in the last 50 years or so. As more area opens to agriculture with receding glaciers, and growing seasons expand, mankind is making a tremendous leap in culture and civilization. Weather related deaths are declining. People are overall healthier and happier with so much more leisure time that the rich intelligentsia are proposing everyone get free money because there’s so much less work that needs to be done. Humanity is living through a Golden Age. We only have one problem: there’s not enough CO2 in the atmosphere yet. At about 400 ppm we’re at a relatively low point over geologic history. As CO2 increases plants flourish and support the rest of the life on the planet. If CO2 levels dip below 150 ppm plants can’t use photosynthesis well, die, and the basis of planetary life goes away. But no worries: as the earth warms CO2 rises (not the other way around).
In a couple of centuries when fossil fuels start getting scarce, mankind is going to have to dedicate a nuclear plant or two, to the decomposition of limestone in order to release more CO2.
Note that the way the words “Reserves” and “Resources” are listed include a geologic and economic certainty. We have 100-500 years of metallurgical coal in the field my company is working, but only about 20 years worth have had the exploration and modelling done to a level to support a “Resources” status.
In my semi-professional opinion, we have thousands of years of economic hydrocarbons left. It’s selling price, not shortage of minable bodies, that will determine what is minable.
As the Earth’s oceans, that hold 70 times as much CO2 as the air, warm they can’t dissolve as much CO2, so it is released into the air, like warmed soda pop.
Bummer. I had hoped stories like this would be buried on some editors desk with so many countries in the Northern Hemisphere reporting near record or record cold.
Be interesting to see if all this “near record cold” in the northern hemisphere gets reflected in the UAH January update.
The latest surface temperature reanalysis data suggest it’s among the warmest Januarys on record for the NH.
But you think we’re going to see a “near record cold” January in UAH_TLT?
I don’t think so, but we’ll see.
Current Arctic sea ice extent is far higher than it has been for most of the last 10,000 years.
Really?!
Looks damn cold to me.
>> . For it is us who have caused this rapid warming of the planet
This claim stands on three legs and they must be improved beyond doubt, before such a claim can become a fact.
This is something apparently skeptics need to point out until the alarmists get their facts right.
If you calculate a trend, but the data does not represent temperature the result is completely ), where the growth could be
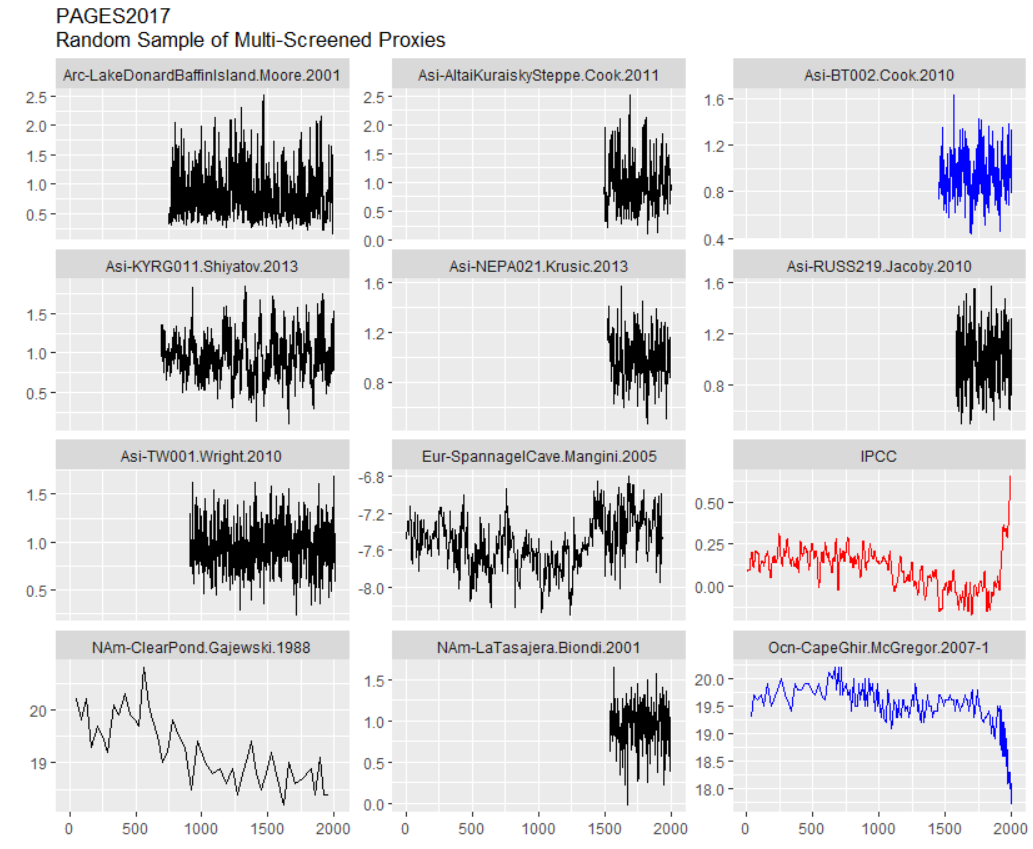 ?w=785), a proxy near
worthless, regardless of the algorithm used. This problem is easy to see looking at MBH98
stripbark bristle cone pines
impacted by a number of parameters besides temperature and Neukoms Cape Ghir
Marocco without apparent roman or middle age warm periods contrary to well documented
nearby histroy.
Again: A wrong proxy can falsify the whole reconstruction and a mathematical selection bias
discussion is missing in virtually all published proxy reconstructions.
with ground based station data as well as there are different algorithms looking at roughly
50 years of satellite data, I find Spencer´s arguments compelling (https://www.drroyspencer.com/2017/07/comments-on-the-new-rss-lower-tropospheric-temperature-dataset/)
and also think this recent NASA article supports him (see figure 13):
https://agupubs.onlinelibrary.wiley.com/doi/full/10.1029/2022JD037472
In any case, if some alarmists wants to use a different more alarming trend extracted from the
same data, the results of methodical differences must be shown as systematical errors.
A big part of this results seems to be related to improved cloud micro-physics in the newer
models.
^ Alarmists insisting that the older models reflected valid projections onto the real world, really do
themselves a huge disservice! While this statement seems correct in itself, it raises the
immediate question:
How can this be? (If the models project the correct trend independent of a valid cloud
representation, their calculations are not based on the real world, just like any bone oracle,
predictions of https://en.wikipedia.org/wiki/Paul_the_Octopus or using drawings of 4 year old
all vastly cheaper methods to make non-factual predictions!)
People like prof. Hawkins need to get these facts right, before they make statements like above. Otherwise they do not speak as trustworthy experts.
Since Roy Spencer wrote those comments about RSS in July 2017, his UAH data set has been warming at more or less exactly the same rate as RSS (+0.64C per decade in RSS versus +0.63C per decade in UAH).
Two strong El Ninos.
Still waiting for evidence of human CO2 causation. !
I can only show you the information, you need to read for yourself
(In this case the publication, here is the link again:
https://agupubs.onlinelibrary.wiley.com/doi/full/10.1029/2022JD037472
“”” The removal of the spurious warming drifts in NOAA-11 to NOAA-14 resulted in the warming trends in STAR V5.0 during 1979–2021 much smaller than the existing versions of the STAR and RSS data sets but close to the latest version of the UAH data set.”””
“Current temperature measurements are problematic, Watts and other pointed out problems with ground based station data … “
But not for who is thought to be the most guilty it seems …
So where is the ever climbing Climdiv index (due supposed UHI contamination) ?
Since 2005 vs the pristine USCRN there is none. In fact if anything the USCRN is warming slightly faster.
This reminds me of the global warming spirograph… but it’s been straightened out.
To jog your memories, look here;
http://www.theguardian.com/environment/2016/may/16/april-third-month-in-row-to-break-global-temperature-records
And then the El Nino’s effect started to fade.
2023 El Nino started at essentially the same temperature in UAH as the 2016 El Nino.
So there was no warming from the start of the 2016 El Nino to the start of the 2023 El Nino.
It’s SOOO hot!
How hot is it?
It’s so hot Los Angeles caught on fire.
It is in the 60s F in LA.
Some of the plants there make an oily substance that makes them quite flammable. They have been catching fire every year for millions of years. The Giant Sequoia trees even use the fire to open up their seed pods at the right time.
So who is reporting the correct information — Mr Worrall or Mr Hawkins? The answer might tell us something factual about the climate instead of the smoke and mirrors of this article.
Climate model version 98.5 😉
The fact that Mr Hawkins is obviously using GISS or similar fabricated surface data…
… which is full of made-up fake data, urban tainted data, near zero measurements from oceans for nearly the whole period, sparse erratically spaced land data for a significant part of…
…and has been deliberately adjust to get rid of the 1930s/40 peak that is prevalent in raw data from many areas of the world…
.. tells us that Mr Hawkins is nothing but a non-science, low-level propagandist.
Either he doesn’t know it is total junk data…. which is just ignorance.
Or he is deliberately using data he knows is junk… which is even worse.
“The fact that Mr Hawkins is obviously using GISS or similar fabricated surface data…”
Don’t know but prbably Hadcrut … which agrees with GISS and JMA
But, how about he uses UAH V6.1 …
He would get the same answer.
Is That “fabricated” as well ?
“The fact that Mr Hawkins is obviously using GISS or similar fabricated surface data…”
Don’t know but probably Hadcrut … which agrees with GISS and JMA etc
But, how about he uses UAH V6.1 …
Yes, yes .. all the world’s in on it (sarc)
He would get the same answer.
Is That “fabricated” as well ?
Why do you live in a world that is bipolar, that is, right or wrong. Is there somewhere in the middle?
You posted earlier:
The problem is not rising CO2, it is rising temperature. The real problem according to CAGW is that rising temperature is an existential threat.
What if rising CO2 and temperature is NOT a problem but a boon to humankind?
According to you we are right at or even have passed the goal post of 1.5 degrees. Tell us what awful things have occurred at that warming? What is going to occur at 2.0 degrees?
Tell us what events are going to occur as CO2 increases. The problem is not a temp rise but what occurs when a temperature is reached
So far, many, many predictions have failed. This doesn’t inspire confidence that the predicted problems are going to occur.
There have been no false or erroneous predictions by reaching climate scientists.(I challenge you to find even one).
And you’re not addressing the point “Isn’t a problem defined before a solution can be contemplated”. If you don’t think the answer is obvious, you’re way in over your head.
Massive fails on climate prophecies. !!
There is no “climate crisis”.
There is no “climate problem”.
Warming and enhanced CO2 since the LIA has been absolutely beneficial to all mankind, and plant life on the planet.
The whole of western civilisation exists because of the use of fossil fuels and the rise in atmospheric CO2, which allows the population to be fed.
Why do you want to destroy those things that support your very existence. ?? !!!!!!!
How about the prediction of an ice-free Arctic by 2013?
I said no false predictions by researching climate scientists. Do you really think Al Gore is scientist? Try again.🤣
Wadhams and Maslowski are not scientists?
Plenty more failed predictions here: https://wattsupwiththat.com/2022/08/20/failed-climate-predictions-willie-soon-phd/
They expressed a personal view.
Just as all touted people you worship do.
It, I’m sure, will never cross your mind that a personal view, no matter how well informed does not have it inevitably correct.
Neither has a consensus view …. But it’s the best way yet that we have discovered to endeavour that it is.
For that purpose there is the IPCC.
What Wadhams and Maslowski said was not what the IPCC was saying…
This was:
Bunter gets it wrong, as usual. ALL predictions are personal views.
https://www.theguardian.com/environment/earth-insight/2013/jul/24/arctic-ice-free-methane-economy-catastrophe
At least you admit their prediction was false.
Why does your map end over 20 years ago? Could it be because you don’t like the trend?
So you can’t answer the question. Why am I not surprised?
If you can’t point to things like increased hurricanes, increased flooding, increased tornadoes, failing crop harvests, the earth getting browner, etc. then you can’t prove anything worthwhile.
If you think IPCC and UN quotes are going to prove anything, then you have not been paying attention to what the general population attitudes toward global warming.
A new finding of trees having grown where glaciers were in the Rocky Mountains is evidence that the earth was warmer 5000 years ago. Tell everyone that is can’t be the case. Maybe it was just that locality, right?
all the signs of agw are itemized in AR6, A2-A7. And you really think your survey of ‘popular opinion’ has any merit whatsoever?
And you are now saying that Trees in regional mountains indicate that the overall earth was warmer than today? Did you forget the term is Global Warming? You’re hopeless, Gorman.
So you can’t answer the question can you? I suspected that would be the case. Here is a link from NOAA telling us that global temperatures were warmer 7000 – 5000 years ago.
https://www.ncei.noaa.gov/sites/default/files/2021-11/12%20Mid-Holocene%20Warm%20Period%20&%20Penultimate%20Interglacial%20Period%20&%20Early%20Eocene%20Period%20-FINAL%20OCT%202021.pdf
Don’t forget, we are discussing consequences of CAGW warming and not necessarily the cause. This period is known as the Holocene Optimum, optimum being the operative word.
Even NOAA admits we are not currently warmer than then. Yet, for some reason humans prospered rather than going extinct.
As I asked before:
You must define the problem that CAGW causes before contemplating a solution. Thus you are sadly lacking in your ability to show this audience what catastrophic events will happen as we pass 1.5 degrees, let alone 2.0.
Ed Hawkins should be fired and his teaching credentials taken from him.
There has to be some organization in the UK that is responsible for energy security. Whoever it is they have failed miserably. All the top managers should be fired and blackballed from ever holding a government position again. Promote those who are left with the understanding that we deserve and demand a stable energy system. They are to start down that road today and if they aren’t making satisfactory progress shortly they will be fired and blackballed.
The Earth is still in a 2.5 million-year ice age named the Quaternary Glaciation with 90% of the freshwater locked up in ice, in a still cold interglacial period.
https://en.wikipedia.org/wiki/Quaternary_glaciation
About 2.5 million people die from cold-related causes each year mainly from strokes and heart attacks from the higher blood pressure cold causes when the body attempts to conserve heat and constricts blood vessels, compared to about 500,000 who die from heat-related causes. Cold is the big killer of humans, not heat.
https://www.thelancet.com/action/showPdf?pii=S2542-5196%2821%2900081-4
Here in the UK, the 2 week cold spell is coming to an end yet the biased, lying, climate obsessed media are more interested in telling us how the awful Californian wildfires have been caused by ‘climate change’. The bbc even put out a “wildfires special” on the bbc2 channel a few days ago. We haven’t been told about the shortage of gas, except for a few words saying there was nothing to worry about, the media keep blaming every weather event on ‘climate change’ and nothing has been mentioned about what impact the cold spell has had on those who cannot afford to properly heat their homes.
As for the corrupt met office, they have been very quiet regards the 2024 UK temp as they spent last year saying how it would be in the top 2 “hottest years evah”, only to find out it was the 4th “hottest year evah”…..
At the rate things are going here, we are screwed.
There have been wildfires in California for millions of years. The Giant Sequoia trees even use the wildfires to open their seedpods at the correct time.
The Daily Mail says two men with gasoline.
The Met Office said that 2024 would be in the top 2 warmest years on record globally, not necessarily in the UK.
And guess what, 2024 was the warmest year on record globally, according to every data producer, surface or satellite.
So, credit where it’s due.
Are you saying they knew there was an El Nino coming… really !!
That would be a first for them… none of their models know anything about EL Ninos.
Funny how the “hottest year evah” only exists in GAT, not where anyone actually lives.
“As Britain endures extreme cold and near miss blackouts, apparently now is the right time for an English scientist to tell everyone how hot it is.”
Must be time for the promotions to be handed out- so he felt a need to sing the party line.
China and India have learned low-cost energy lifts people out of poverty, whereas Western nations “fighting climate change” don’t understand that high-cost energy pushes people into poverty.
Don’t understand, or don’t care?
Meanwhile where I am just had the coldest night for quite some time with a frost lasting all day long despite modest sunshine. It’s weather, UK weather, and we all know where that takes us.
See – what you need right now is a government policy of spending billions of pounds to try to make the weather colder.
“try to make the weather colder.”
While telling you that you are not allowed to have effective heat devices, or electricity or gas to run them…..
Just what you need… right 😉
A couple hundredths of a degree is “shattering the old records”?
Is this the same fellow that has just persuaded the UK to award him over 7 million GBP in research grants
On the positive side, this modest warming may benefit our future generations by reducing the likelihood of slipping back into an ice age again.
Think of it as a mitigation measure to protect our ecosphere from cold desolation.
A Quaternary earth science climate perspective on how to avoid the next glacial period:
A “professor” that creates a pretty coloured graph with no horizontal scale…. and no legend
… must be a professor of kindergarten art, or something. !
I like the 2nd picture on the BBC article.. shows just how much people LOVE this warmer weather. 🙂
Somebody got a new colouring set for Christmas, and people at WWUT are upset that he is playing with his new dark red crayon.