So extreme, they cannot be explained by global warming models!
From the Columbia Climate School and the “have you checked the accuracy and placement of thermometers” and the “weather is not climate” departments comes this new study that is hilarious in it’s lameness. It’s like these people have never heard of weather before, and they only exist in climate headspace. – Anthony
Earth’s hottest recorded year was 2023, at 2.12 degrees F above the 20th-century average. This surpassed the previous record set in 2016. So far, the 10 hottest yearly average temperatures have occurred in the past decade. And, with the hottest summer and hottest single day, 2024 is on track to set yet another record.
All this may not be breaking news to everyone, but amid this upward march in average temperatures, a striking new phenomenon is emerging: distinct regions are seeing repeated heat waves that are so extreme, they fall far beyond what any model of global warming can predict or explain. A new study provides the first worldwide map of such regions, which show up on every continent except Antarctica like giant, angry skin blotches. In recent years these heat waves have killed tens of thousands of people, withered crops and forests, and sparked devastating wildfires.
“The large and unexpected margins by which recent regional-scale extremes have broken earlier records have raised questions about the degree to which climate models can provide adequate estimates of relations between global mean temperature changes and regional climate risks,” says the study.
“This is about extreme trends that are the outcome of physical interactions we might not completely understand,” said lead author Kai Kornhuber, an adjunct scientist at the Columbia Climate School’s Lamont-Doherty Earth Observatory. “These regions become temporary hothouses.” Kornhuber is also a senior research scholar at the International Institute for Applied Systems Analysis in Austria.
The study was just published in the journal Proceedings of the National Academy of Sciences.
The study looks at heat waves over the past 65 years, identifying areas where extreme heat is accelerating considerably faster than more moderate temperatures. This often results in maximum temperatures that have been repeatedly broken by outsize, sometimes astonishing, amounts. For instance, a nine-day wave that hammered the U.S. Pacific Northwest and southwestern Canada in June 2021 broke daily records in some locales by 30 degrees C, or 54 F. This included the highest ever temperature recorded in Canada, 121.3 F, in Lytton, British Columbia. The town burned to the ground the next day in a wildfire driven in large part by the drying of vegetation in the extraordinary heat. In Oregon and Washington state, hundreds of people died from heat stroke and other health conditions.

These extreme heat waves have been hitting predominantly in the last five years or so, though some occurred in the early 2000s or before. The most hard-hit regions include populous central China, Japan, Korea, the Arabian peninsula, eastern Australia and scattered parts of Africa. Others include Canada’s Northwest Territories and its High Arctic islands, northern Greenland, the southern end of South America and scattered patches of Siberia. Areas of Texas and New Mexico appear on the map, though they are not at the most extreme end.
According to the report, the most intense and consistent signal comes from northwestern Europe, where sequences of heat waves contributed to some 60,000 deaths in 2022 and 47,000 deaths in 2023. These occurred across Germany, France, the United Kingdom, the Netherlands and other countries. Here, in recent years, the hottest days of the year are warming twice as fast the summer mean temperatures. The region is especially vulnerable in part because, unlike places like the United States, few people have air conditioning, because traditionally it was almost never needed. The outbreaks have continued; as recently as this September, new maximum temperature records were set in Austria, France, Hungary, Slovenia, Norway and Sweden.
The researchers call the statistical trends “tail-widening”―that is, the anomalous occurrence of temperatures at the far upper end, or beyond, anything that would be expected with simple upward shifts in mean summer temperatures. But the phenomenon is not happening everywhere; the study shows that maximum temperatures across many other regions are actually lower than what models would predict. These include wide areas of the north-central United States and south-central Canada, interior parts of South America, much of Siberia, northern Africa and northern Australia. Heat is increasing in these regions as well, but the extremes are increasing at similar or lower speed than what changes in average would suggest.
Climbing overall temperatures make heat waves more likely in many cases, but the causes of the extreme heat outbreaks are not entirely clear. In Europe and Russia, an earlier study led by Kornhuber blamed heat waves and droughts on wobbles in the jet stream, a fast-moving river of air that continuously circles the northern hemisphere. Hemmed in by historically frigid temperatures in the far north and much warmer ones further south, the jet stream generally confines itself to a narrow band. But the Arctic is warming on average far more quickly than most other parts of the Earth, and this appears to be destabilizing the jet stream, causing it to develop so-called Rossby waves, which suck hot air from the south and park it in temperate regions that normally do not see extreme heat for days or weeks at a time.
This is only one hypothesis, and it does not seem to explain all the extremes. A study of the fatal 2021 Pacific Northwest/southwestern Canada heat wave led by Lamont-Doherty graduate student Samuel Bartusek (also a coauthor on the latest paper) identified a confluence of factors. Some seemed connected to long-term climate change, others to chance. The study identified a disruption in the jet stream similar to the Rossby waves thought to affect Europe and Russia. It also found that decades of slowly rising temperatures had been drying out regional vegetation, so that when a spell of hot weather came along, plants had fewer reserves of water to evaporate into the air, a process that helps moderate heat. A third factor: a series of smaller-scale atmospheric waves that gathered heat from the Pacific Ocean surface and transported it eastward onto land. Like Europe, few people in this region have air conditioning, because it is generally not needed, and this probably upped the death toll.
The heat wave “was so extreme, it’s tempting to apply the label of a ‘black swan’ event, one that can’t be predicted,” said Bartusek. “But there’s a boundary between the totally unpredictable, the plausible and the totally expected that’s hard to categorize. I would call this more of a grey swan.”
While the wealthy United States is better prepared than many other places, excessive heat nevertheless kills more people than all other weather-related causes combined, including hurricanes, tornadoes and floods. According to a study out this past August, the yearly death rate has more than doubled since 1999, with 2,325 heat-related deaths in 2023. This has recently led to calls for heat waves to be named, similar to hurricanes, in order to heighten public awareness and motivate governments to prepare.
“Due to their unprecedented nature, these heat waves are usually linked to very severe health impacts, and can be disastrous for agriculture, vegetation and infrastructure,” said Kornhuber. “We’re not built for them, and we might not be able to adapt fast enough.”
The study was also coauthored by Richard Seager and Mingfang Ting of Lamont-Doherty Earth Observatory, and H.J. Schellnhuber of the International Institute for Applied Systems Analysis.
# # #
Have I accidentally arrived at the Babylon Bee?
I found this a bit confusing. I suppose the opening paragraph in italics is Anthony’s contribution and the remainder of the article below the horizontal line was from this “study”, but it wasn’t clear to me.
“… excessive heat nevertheless kills more people than all other weather-related causes combined, including hurricanes, tornadoes and floods.”
Seriously?
How about cold?
They have it backwards. Excessive cold kills more people than warm weather.
It’s not backwards, it’s for “the cause”.
In Europe it’s a10:1 ratio, 10 cold to 1 hot death.
I don’t think that’s accurate. Take, for instance, the deaths at Pompeii a few years back. They all died of a Weather-Cyclone-Heat-Bomb. ALL heat-related deaths….
Source:
https://beardyhistory.com/2018/07/19/pompeii-volcano/
Good piss-take JBP 🙂
Yup.
A single chart proves this study should be awarded a high distinction for ultimate BS.
 ?_=42884
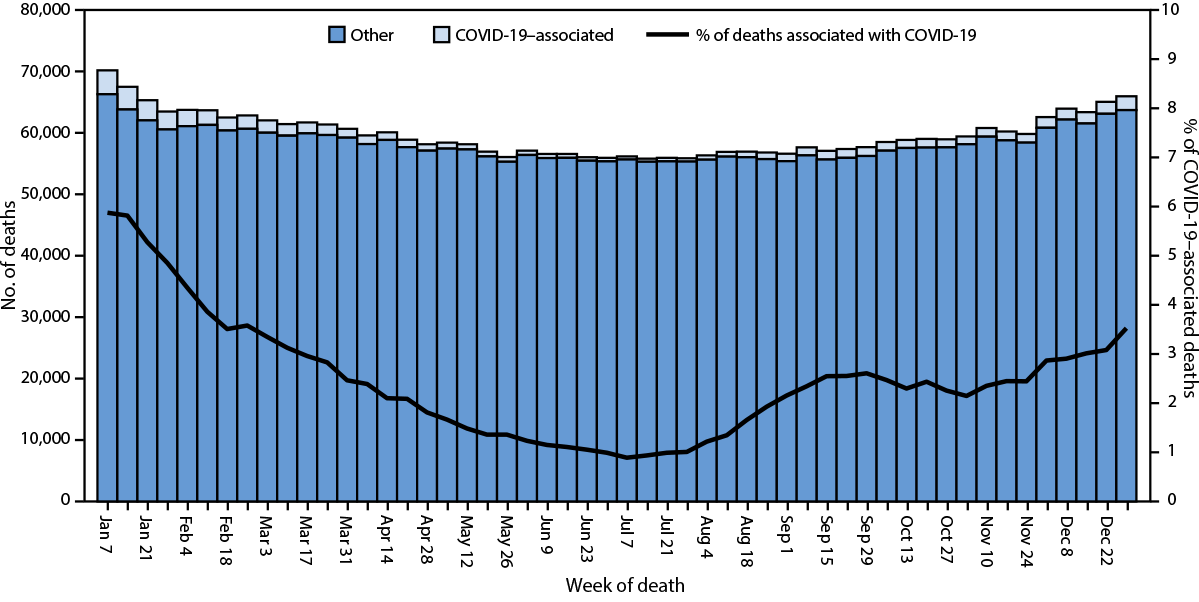
Quite obviously deaths in the first week of 2023 of 70,000 exceeded the typical July weekly figure by 10,000.
Is that US only?
Yes
https://www.cdc.gov/mmwr/volumes/73/wr/mm7331a1.htm#T1_down
If only they’d put the thermometers in the right place all those tens of thousands of excess deaths could have been avoided.
Oops poor fungal.
Less cold means less deaths.
PAY ATTENTION, muppet !!
And yes URBAN areas do get warmer in summer, and that is where most thermometers are.
Strange isn’t it?
While the obvious stares most rational people in the face, nick-pickers like your mate TFN get themselves transfixed by the obscure, the implausible, the illogical and the irrational.
On the positive side, I have faith that advances in immunotherapy will in time identify the DNA defects that make nick-pickers captives of their own irrationality, and an effective immunisation intervention can be developed and administered at birth.
Gaia is angry at humans and their success at adapting to temperatures from 50 C to -80 C and beyond. We must appease her by giving up the energy sources that power that adaptability. I nominate the alarmists to go first. Maybe their sacrifices will shut her up.
I wouldn’t go down the ‘Gaia’ line. Let’s not be silly.
Of course we will adapt.
It will just cost a heck of a lot.
But let’s continue to carry on letting fossil fuel interests pollute and make even more money and we’ll all pick up the clean-up bill while they laugh at us, right?
There is FAR more actual pollution from the making and installation and final removal of wind and solar !
Who picks up the clean-up bill for all the rubbish left from wind and solar farms.. usually the taxpayer.
Fossil fuels provide for EVERY PART of your existence.
Wind and solar only TAKE. !!
It is the wind and solar scammer that are laughing, as their bank balances skyrocket from unwarranted subsidies, and we continue to pay for ENERGY NOT DELIVERED.
The biggest fuel subsidy in the world is allowing fossil fuel companies to dump their waste into our shared environment at no cost to themselves but at massive cost to the rest of us.
We are the idiots paying for it.
Some of us idiots, such as your good self, are more useful than others.
“Of course we will adapt.
It will just cost a heck of a lot.”
It will cost FAR FAR less to adapt to any climate change which might occur (not the nonsensical “climate crisis” garbage) than it will to attempt to control the weather around the world.
Adapt? Adapt to what exactly?
Hilarious rubbish. All of England is a “giant angry skin blotch” on their map. Has anyone that lives here noticed it?
I can explain the apparent ‘rise’ in UK heatwave frequency:
The World Meteorological Organization defines a heatwave as five or more consecutive days during which the daily maximum temperature surpasses the average maximum temperature by 5 °C (9 °F) or more.
UK met office no longer use the WMO definition, they changed it in 2018 to:
“A UK heatwave threshold is met when a location records a period of at least three consecutive days with daily maximum temperatures meeting or exceeding the heatwave temperature threshold, dependant on location.” (currently that is just 28ºC max anywhere in the UK, including major cities)
https://www.metoffice.gov.uk/weather/learn-about/weather/types-of-weather/temperature/heatwave
Clearly this is so they can claim that heatwaves occur more frequently, which is an obvious lie if they have to change the definition to make that claim. Of course, this also means they can claim “hottest since records began”, as a new record started with the definition change. The Met office are all in on the globalist’s “climate crisis” scam, designed to rob you of your freedoms and tax you based on the vagueries of the weather. I’m pretty sure we have not had a heatwave meeting the WMO definition for many years, maybe decades.
Likewise if a single snowflake falls anywhere in the UK on Christmas Day the Met Office classify that as the UK having a white Christmas!
Thanks R-HS for explaining the Met Office’s sleight of hand.
Looking at their graphic of the Earth:
Out – “The Earth has a fever!”
In – “The Earth has chicken pox!”
I’m a believer that most communication is really difficult, especially presented in words. Surely the bit I quoted above was really trying to say
park it in temperate regions for days or weeks at a time. These regions do not normally see extreme heat. No???
Aside from such grammatical considerations, is there any evidence of the particular large death tolls the article quotes. I know most readers can parrot the general figures printed in a number of studies finding cold related deaths occur in much larger quantities that heat related deaths. I am asking if anyone knows about any of the specific numbers quoted in the article, not their mistaken claim that worldwide heat related deaths are especially high relative to other causes. Once once knows if the quantities claimed for specific events are accurate or not, one could compare them to previous heat related deaths in the same location as far back as records go to find out if any are really extreme.
Attribution of deaths to heat is essentially a subjective exercise. AFAIK, most death certificates only give the proximate cause of death, and don’t list temperature as a cause. Therefore, “climate scientists” are free to assert which deaths are heat related, with unchallengeable impunity.
It wouldn’t surprise me if there was a model that generates those numbers, and can be cited as a reference to add credibility.
In many jurisdictions, the numbers of deaths of elderly aged-care residents from the annual influenza wave dropped to near zero, while the deaths attributed to COVID skyrocketed.
Seem that influenza was suddenly, inexplicably cured in 2020 – 2022.
Ooohhhkaaaayyyyy.
A with elections, it’s not what boxes have been ticked on the ballot forms, it’s who gets to report the results.
You say that global heat deaths in 2023 were 2,035 and is the highest cause of death from all natural causes, but you make no mention of deaths from cold, which I have heard from several sources are many times higher. Is that true?
Yes, cold kills a lot more people than heat.
David:
A 2015 Lancet medical journal article reviewed Cold vs Heat deaths in 13 countries
[And for what it’s worth, the Lancet is a Top 5 medical journal]
https://www.thelancet.com/journals/lancet/article/PIIS0140-6736(14)62114-0/fulltext
[ ] = my notes
“Cold was responsible for most of the burden (total estimate 7·29%, 95% eCI 7·02–7·49%), while the fraction attributable to heat was small (0·42%, 0·39–0·44). ”
“In all countries, most of the mortality risk attributable to temperature was related to moderate cold, with an overall estimate of 6·66% (95% eCI 6·41–6·86). Extreme temperatures (either cold or hot) were responsible for a small fraction [of all deaths], corresponding to 0·86% (0·84–0·87%) .”
[Note: cold/heat death ratios of the 13 countries: 3.7- 32 with average = 14. “Tropical” ~ 4,
USA =15.7, UK = 28, China = 17.]
It may be instructive the watch this metric in the UK, which is the current crash-test dummy for rapid transitioning to renwable electricity production in a misguided NetZero by 2050 policy.
happy thanksgiving.
https://www.grunge.com/1155626/a-look-back-at-the-big-freeze-of-1963/ suggests the excess deaths ran at 89 per 1000.
The blue blotches (cold waves) seem to me to be as numerous and well distributed on the map as the red blotches (heat waves.). What were the weather anomalies and weather-related consequences in the blue areas? It seems to me that responsible scientists would have evaluated this issue as well.
” A new study provides the first worldwide map of such regions, which show up on every continent except Antarctica like giant, angry skin blotches.”
You want blotches? Get your daily dose of both red and blue here. Good luck predicting where they will be for any date in the future. Pro tip: the atmosphere does this because it is the compressible working fluid of its own heat engine operation. The resulting dynamics completely overwhelm the minor static radiative effects of incremental CO2, CH4, N2O. There has never been a good reason to worry even a little that human emissions would somehow “force” absorbed energy from the sun to accumulate down here as sensible heat – certainly not to any harmful extent.
https://climatereanalyzer.org/wx/todays-weather/?var_id=t2anom&ortho=1&wt=1
The reanalyzer graphs are fascinating to explore. In terms of these so-called blotches, have a look at the plot of worldwide 2-m air temperature. Look especially at July 1, 2023 to July 5, 2023. During those 5 days worldwide average temperature rose by 0.56 degrees C — mind you, this is the equal of four decades of “unprecedented” global warming. Assume this warming involves the troposphere alone, not any surface or near surface material. The heat capacity at constant pressure for air is about a kilojoule per kilogram of dry air, and if studies of EEI (excess energy) are meaningful, about another kilojoule for increased water vapor burden. Thus, calculated from this basis, this five day excursion amounts to . Where did such enhanced energy come from? Then it mostly disappeared over the next couple of days. Where’d that energy go?
Note further that this excursion is a southern hemisphere event, and appears hugely in the antarctic. This is the antarctic night, so was the antarctic suddenly the locus of a descending mass of air, previously dried out through precipitation, and now arrived at the 2-m surface — I.e. your “compressible working fluid”?
Note further that the reanalysis shows a ubiquitous low-level, high frequency noise. Is this real, or an artifact of the reanalysis?
Thanks for this reply.
“Note further that the reanalysis shows a ubiquitous low-level, high frequency noise. Is this real, or an artifact of the reanalysis?”
Well, I would say, “Yes, both.” The real weather involves very powerful mass and energy flows and energy conversions, so the global surface experiences all of this inherent natural variation. It’s also true that these values (the ERA5 daily average 2-meter air temperatures you linked to) are fictional artifacts in the sense that any computed average of worldwide conditions over the period of one day obviously cannot be directly measured. But the weather “noise” is a real input to the model through the assimilation of bazillions of temperature, pressure, humidity, altitude, and velocity measurements. So I regard the computed outputs as a valid approximation of the dynamic nature of the general circulation.
So the models themselves – in this case the ERA5 reanalysis, making no claim to prediction or diagnosis, just computed representation – help us understand how unreasonable it was, and still is, to say (my paraphrase), “We have detected the signal of human influence on the greenhouse effect through emissions of CO2!” No, you have not. No such thing can be isolated for detection and reliable attribution.
Thank you. Short, sweet, and absolutely on point. If the face of such natural variation how is it possible to attribute any man-made causal relationship to a portion of it. Like so much of climate science, the inherent uncertainties of the measurements themselves, let alone the additive uncertainty from adding temps together that have such wildly different variances, cover up any possible identification of man-made contributions. It just becomes a matter of “I see *this* in my cloudy crystal ball”.
Well at least they appear to realise that there are things they ‘might not completely understand’.
When I was young I learned that that discovery was the beginning of wisdom. Who knows?
These heatwaves are far from “unexplained” or even new.
I will illustrate by an analysis of heatwaves from 8 significant Australian cities, being the 6 State capitals plus Alice Springs and Darwin to improve national coverage. These contain some of our longest weather recordings, with Melbourne starting in 1855 and Sydney in 1856. I will use 5-day heatwaves from a choice of 1,3, 5 and 10 days.
Sydney had its hottest 5-day in 1960, at some 7.8 deg C above the all-year average for these heatwaves.
Perth, Sydney (second hottest) and Hobart have their hottest old 5-day records in 1896-7. They were about 7, 5.6 and 6.4 deg C above the average of all of the hottest heatwaves each year.
Darwin and Alice Springs have no prominent 5-day outstanding peaks in any year.
Brisbane in 1940 showed a 5-day peak about 4.2 deg C above the average.
Melbourne had a prominent peak in 1908, some 8.2 deg C above the average.
Please note that these events are not part of a smooth distribution. They are outliers, separated from the scatter of other years. Therefore they qualify for inclusion in the essay above. Since 6 of the 8 cities I studied showed at leat one exceptional year, the event cannot be described as rare.
I wish that researchers would actually research the available data before rushing to error-filled print. If the authors are to avoid a retraction, they first need to show me wrong. My data are the official numbers from the Boireau of Meteorology, raw, unadjusted. In more honest scientific times, the Bureau would be aware of these anomalous events and ideally, they would quickly write a correction. However, in this unfathomable age of cancel culture, odds are that these numbers will be ignored. Geoff S
https://www.geoffstuff.com/sixheat2022cdo5day.xlsx
“The region is especially vulnerable in part because, unlike places like the United States, few people have air conditioning, because traditionally it was almost never needed.”
I’m shocked that people in Europe will die from heat waves. It’s not as if air conditioners are expensive. I’ve seen small ones for $75 at Walmart. That could be in a bedroom where sick and elderly can go during the hottest part of the day. Maybe many of these deaths are really just due to “comorbitities”?
Just throwing this out there, maybe this is “weather” and not “climate?”
I’ve used a £250 portable AC in my south facing bedroomr during v hot weather.
It barely touched the heat (and the exhaust needs to go out of an open window).
ANd was to nisy to sleep with.
Houses in the UK and most of Europe are made of brick and act as thermal storage, leaking heat into the house through the night.
I’ve had portables and non portables. The portables are simply not as powerful- even if you get the biggest ones. Out an open window? Then you didn’t set it up correctly. They come with a plastic thing you put in the window- the window is closed- the exhaust goes through the rectangular plastic thing. So the window is not open. Looks like there is a huge market for contractors who can insult homes- even if it’s just a few rooms. Instead of offering tax breaks for EVs and wasting billions on ruinables, better to spend the money on insulting homes.
Also, what about windows? The should be double paned. Or instead of replacing the windows, you can add a storm window over the single pane. They’re not that expensive. Much of the heat gain/loss is through drafty windows.
And, your attic- it’s not that difficult to add heavy insulation in the attic. That can make a huge difference.
Yes, I’ve heard a building contractor say – “this joint is the worst shit-box I’ve ever had to work on”.
(Sorry Joseph, some typos serve up such opportunities they just can’t be missed 🙂 )
“They come with a plastic thing you put in the window- the window is closed- the exhaust goes through the rectangular plastic thing. So the window is not open.”
The window is open. The plastic thing, even if it fits well, is not even moderate insulation.
You could add the insulation.
I live in Northern Ireland, which is hardly anyone’s idea of a hot country.
It’s wet and miserable most of the time, winter and summer, which is fine by me, as I quite like it here in the gloom. Nothing a hot whiskey won’t cure.
But even I have had to invest in fans for the bedrooms over recent summers (not this one), which don’t so much remove heat as move it around, bringing temporary relief in the form of air movement over the skin.
I suspect that house design in countries like mine will be another adaptation to climate change.
Maybe if you stopped drinking hot whiskey you’d feel cooler.
Try 2 fingers Bushmills Black straight up.
(not shaken or stirred, 00zero)
This is not unexpected, because when we have an unprecedented event like the Hunga Tonga volcano, which produced an unprecedented global warming spike — which is still spiking, we can therefore expect unprecedented ripple effects — like heat waves and even monsoon-like rains over the Sahara. And since Tonga is an unprecedented submarine volcano, the models will not be able to properly interpret how Tonga is affecting our atmosphere.
It took 2 years? I don’t buy it.
You don’t buy it because that’s what the climate alarmists dictate. The Mt Tambora volcano caused global cooling 15 months after eruption, while the Tonga volcano caused global warming 18 months after eruption. Tambora’s aerosols caused cooling as they instantly reflected sunlight, while Tonga’s water-vapor took extra time to spread in the stratosphere and build up heating throughout the troposphere. There is no other logical explanation for the heating other than Tonga’s water-vapor (see image). Here’s more .. https://www.youtube.com/watch?v=W7GN96BUCEo
As has been noted by others MANY times:
Correlation does not necessarily equate to causation.
“logical explanation”? . . . as if we had perfect understanding of ALL the causes/interactions regarding weather and climate change!
The are many who are vested in the continuation of CO2 as a control knob and will never admit water-vapor is causing the 2023/2024 warming spike – which continues today. Besides, no one can identify a legitimate alternative explanation for the global warming spike other than Tonga. I discuss all attempted explanations — and show how they fail the data test — during my Tonga talks … http://www.climatecraze.com/talks.php
OK, when do YOU predict that the posted graph of GLAT based on UAH satellite data will return back to its trend line as established from 1979 to 2023?
Or do you predict that will never happen?
My take is that the HT eruption and resultant regional seismic activity added energy to the already from El Nino.
The second effect is the large amount of the extra water vapour in the stratosphere, which is slowing the normal escape of that El Nino energy.
Instead of the normal transient spike, I think we will see a slower drop-off of the atmospheric temperature
Scientists from around the world predict that Tonga’s stratospheric water vapor will dry out in about 5 to 10 years … but since Tonga is an unprecedented event — no one really knows. It will be fun to watch and see what happens. https://www.abc.net.au/news/2023-02-16/tongan-volcano-impact-australian-weather/101978886
while earlier you posted:
TILT!
YOU have a reading comprehension problem. I never claimed to make a forecast about the Tonga future (regarding “no one really knows”), but I did say I have data disproving attempts to discredit Tonga’s water vapor warming — and some of those attempts are discussed here … https://www.youtube.com/watch?v=W7GN96BUCEo&t=994s
My comprehension is that your phrase “to discredit Tonga’s water vapor warming” implies current and future warming.
Let’s let what lies in the past stay in the past if it has no bearing on the future.
Tonga’s temperature spike is past, present, and future. It’s called data.
Again, a global average is meaningless.
Correct — there’s just global climate alarmism. Global warming and increasing CO2 are good for planet earth.
“You don’t buy it because that’s what the climate alarmists dictate.”
Where do you get the idea that I’m a climate alarmist??
As for no other logical explanation… I haven’t seen any heating, period, since Tonga. is it very selective?
Here’s is the smoking gun graph showing the Tonga induced temperature spike, and here’s the Tonga science … https://www.youtube.com/watch?v=W7GN96BUCEo
The spike you show occurs ~2 years after the HTE.
That’s why no one other that conspiracists, such as your good self, think that it caused a warming spike 2 years later.
It makes no sense, unless you want it to.
As I previously said, Mt Tambora’s cooling began 15 months after eruption, while Tonga’s warming began 18 months after eruption. More importantly you offer no other explanation for the global warming spike other than Tonga’s water vapor. Here is more information … https://www.youtube.com/watch?v=W7GN96BUCEo
But if the water vapor entered the stratosphere at the time of the event, why did it take nearly 2-years for it to have the impact you say it has had?
Do you have any references to scientific peer-reviewed papers that back your assertion?
Roy Spencer and John Christie of UAH say it caused very little increase to atmospheric temperatures. Measured in the hundredths of a degree C at the time of the explosion; not years later.
What makes you sure that you know better than them?
Eruption, not ‘explosion’ (same thing, in a way).
In other words, YOU (and no one else) have no other explanation for Tonga’s water-vapor induced global warming temperature spike. Try again.
I tend to side with Willis on matters volcanic.
His conclusion (based on claims made by BEST), in this article:
LAKI, 1783: Occurred near the end of the fall in temperature that it is supposed to have caused.
TAMBORA, 1815: Occurred at the end of the fall in temperature that it is supposed to have caused.
COSIGUINA, 1835: Occurred near the middle of the fall in temperature that it is supposed to have caused.
KRAKATOA, 1883: Occurred at the end of the fall in temperature that it is supposed to have caused.
SANTA MARIA, 1902: Occurred in the middle of the fall in temperature that it is supposed to have caused.
NOVARUPTA, 1912: I can see why Muller omitted this eruption, which occurred just before a rise in temperature …
EL CHICHON, 1982: Occurred during the fall in temperature that it is supposed to have caused.
PINATUBO, 1991: This is arguably the only one of the eight volcanoes that could legitimately be claimed to cause a detectable fall in temperature … a whopping fall of 0.15°C or so.
The Willis article does not discuss submarine volcanoes which produce an entirely different temperature forcing mechanism — sunlight reflection versus greenhouse gas warming. The Vinos book includes Willis’ information plus newer scientific findings.
Makes plenty of sense, but you need to be beyond kindy level comprehension to understand it.
So bad luck.
It makes so much sense that no one can explain it. Right.
It shows a spike (in a meaningless global temp), but you’re assuming the cause. It might have happened without any eruptions. And, it did not make temps rise everywhere.
So now data is meaningless if it doesn’t fit the climate alarmist narrative — which makes you a data denier. So, for the uneducated, UAH data comes from government satellites. Second, this is the tropospheric atmospheric layer where our weather occurs. Third, the spike is very real as seen in land and ocean temperatures. Fourth, you and no one else is able to identify a better cause for the spike other than Tonga’s water vapor.
“Global Temperature” is not data. It’s a mathematical chimera which has no bearing on reality.
Your graph gives the false impression that temperatures have risen monotonically. That’s completely false. There are many places that have not experienced this “spike”.
Again, you seem to think I’m following some “climate alarmist narrative”. Not even close.
I did a little checking.
Tonga injected approx 39,000,000,000 (billion) gallons of WV into the atmosphere, which contains approx 36,000,000,000,000 (trillion) gallons of WV. That’s about a .1 percent increase.
I couldn’t find how much WV varies in the atmosphere, but I would have to think it’s more that one tenth of one percent at any given time.
I just don’t buy that the Tonga eruption even could have that much of an effect.
Not all areas change the same, which is why we have an average, which shows a global average temperature spike — caused by water-vapor and not CO2.
Yes, 39 billion gallons of vaporized water is tiny compared to the huge amount of vapor already in the troposphere, but Tonga added about 13% MORE vapor into the otherwise very dry stratosphere. Like Einstein said … everything is relative.
Heck, everyone knows that water vapor takes its own sweet time deciding when and where it will become LWIR-active so as to induce warming of Earth’s GLAT (as indicated in the UAH satellite data graph).
A 18-24 month delay . . . that’s nothing . . . it could have decided to wait five years!
Then again, it is well known that water vapor “decides” to respond very quickly (with just months or less-delay time) in the troposphere . . . from https://earthobservatory.nasa.gov/global-maps/MYDAL2_M_SKY_WV :
“These maps show the average amount of water vapor in a column of atmosphere in a given month. The units are given in centimeters, which is the equivalent amount of water that could be produced if all the water vapor in the column were to condense. The lowest amounts of water vapor (0 centimeters) appear in white, and the highest amounts (6 centimeters) appear in dark blue. Areas of missing data appear in shades of gray. The maps are based on data collected by the Moderate Resolution Imaging Spectroradiometer (MODIS) sensor on NASA’s Aqua satellite.
“The most noticeable pattern in the time series is the influence of seasonal temperature changes and incoming sunlight on water vapor. In the tropics, a band of extremely humid air wobbles north and south of the equator as the seasons change . . . Farther from the equator, water vapor concentrations are high in the hemisphere experiencing summer and low in the one experiencing winter.
“Another pattern that shows up in the time series is that water vapor amounts over land areas decrease more in winter months than adjacent ocean areas do. This is largely because air temperatures over land drop more in the winter than temperatures over the ocean. Water vapor condenses more rapidly in colder air.”
Note that the “column of atmosphere” mentioned in the above quoted text extends from the surface, through the troposphere, and up to the top of the stratosphere.
/sarc
“tail-widening” – a perfect term to quietly explain poorly correlated results. I could have really used it in my days as a big company researcher talking to management.
It is similar to “tail-tucking” when is caught fabricating data.
In England and Wales weekly deaths in winter exceed those in summer by as much as 5000 pw but by 2000 is quite normal.
https://www.ons.gov.uk/peoplepopulationandcommunity/birthsdeathsandmarriages/deaths/bulletins/deathsregisteredweeklyinenglandandwalesprovisional/weekending15november2024
The 2021 PNW heat wave was very hot, yes. But it’s gotten nowhere even close since then. It was an anomaly. None of these “hottest year ever” proclamations are relevant to reality, they’re just abuses of bogus averages.
The Texas Freeze of 2021 killed a reported 246 people and as many as 702. The
Polar Vortex was disrupted by an eruption of the Shiveluch Volcano on 12/22/2020.
The heat events from this piece I’ve not heard about before. The hot dry summer
of 2024 I’d point to the Hunga Tonga.
Uhhh, maybe “not-so-unexplained” hot spots around the globe, as duly noted by Anthony in his second, italicized lead-in paragraph to the above article.
With the possible exceptions of northwestern Canada and perhaps central Africa, I would look to unadjusted UHI-induced temperature anomalies as the basic explanation for the above article’s indicated “hot spots”, as they seem to be generally associated with areas that have experienced urban development, particularly those spots across Europe, near the cities of Qinghai and Sichuan, China, and across Japan and Oman, and along Southern Australia.
Even the “hot spot” areas that I mentioned as possible exceptions could be easily explained as just being bad data from poorly-maintained ground temperature monitoring stations, since they appear to be in very remote, difficult-to-access locations.
One would have hoped that lead author Kai Kornhuber, an adjunct scientist at the Columbia Climate School’s Lamont-Doherty Earth Observatory, and the editors of PNAS, would have presented a similar color-coded global map of “hot spots” based solely on satellite-based observations of surface temperature to see if there was a good match—thereby verifying the ground station based data—but such is apparently too much to expect in today’s world of “science”.
Good grief!
The weather was angry that day, my friends—like an old man trying to send back soup in a deli.
Climate models are to climate what fashion models are to Wallmart shoppers.
Maybe the title should say “virtual globe” because the hot spots seem to be the result of comparing actual temperatures with the output of a computer model. Another way of looking at it is that the models have a problem and the ‘hot spots’ (and ‘cold spots’) give a clue as to where the models are deviating from reality and by how much.
In other words, they are a metric for the measurement uncertainty (since the models are outputting a “measurement”) associated with the climate models. But climate science will never admit to that.
“excessive heat nevertheless kills more people than all other weather-related causes combined” I have always heard the cold kills more people than the heat. Which is it guys?
The not-so-subtle implication, as always, is that these “hot spots” are caused by (what else) “manmade climate change”. They then (predictably) proceed to yammer on about how “dangerous” they are, and how many people die from them, blah-blah-blah. And it’s our fault of course, because “fossil fuels”. It is pure propaganda and total nonsense, posing as “science”.
Thank you for reading this – so I didn’t have to.
Really shows how uselessly poor the climate models are.
Auto