By Kennedy Maize
“What has come to be known as ‘weather attribution,’ research assigning causation to observed weather events, is fraught with methodological problems. Veteran climate scientist Roger A. Pielke Jr. in his Substack publication The Honest Broker calls it ‘weather attribution alchemy’.”
Last year was hot, unusually so. The global temperature was almost 0.3°C above 2022 levels, so much higher that even conventional analyses of global warming didn’t appear to explain it. As a recent article in Science magazine notes, iconic climate scientist James Hansen was suggesting that a new, air-pollution-driven warming mechanism might be at work. NASA’s Gavin Schmidt posited that a novel, unknown force could be involved.
Wrong, says a team of six climate scientists led by Shiv Priyam Raghuraman (University of Illinois, Champaign-Urbana). The culprit is more likely the familiar climate confounder, El Niño (technically, the El Niño-Southern Oscillation or ENSO).
Writing in the journal Atmospheric Chemistry and Physics, published by the European Geosciences Union, the scientific team writes,
our results underscore the importance of the El Niño–Southern Oscillation in driving the occurrence of global warming spikes such as the one in 2023, without needing to invoke anthropogenic forcing, such as changes in atmospheric concentrations of greenhouse gases or aerosols, as an explanation.
They add:
Global-mean surface temperature rapidly increased 0.29 ± 0.04 K from 2022 to 2023. Such a large interannual global warming spike is not unprecedented in the observational record, with a previous instance occurring in 1976–1977. However, why such large global warming spikes occur is unknown, and the rapid global warming of 2023 has led to concerns that it could have been externally driven.
And:
Here we show that climate models that are subject only to internal variability can generate such spikes, but they are an uncommon occurrence (p = 1.6 % ± 0.1 %). However, when a prolonged La Niña immediately precedes an El Niño in the simulations, as occurred in nature in 1976–1977 and 2022–2023, such spikes become much more common (p = 10.3 % ± 0.4 %). Furthermore, we find that nearly all simulated spikes (p = 88.5 % ± 0.3 %) are associated with El Niño occurring that year.
The University of Illinois research fits with an August paper by four researchers from CICERO Center for International Climate Research in Oslo, Norway. Published in the Communications Earth & Environment journal, Bjørn H. Samset et al. wrote:
2023 was the warmest year on record, influenced by multiple warm ocean basins. This has prompted speculation of an acceleration in surface warming, or a stronger than expected influence from loss of aerosol induced cooling…. We show that the strong deviation from recent warming trends is consistent with previously observed sea surface temperature influences, and regional forcing.
“Weather Attribution” Alchemy
What has come to be known as “weather attribution,” research assigning causation to observed weather events, is fraught with methodological problems. Veteran climate scientist Roger A. Pielke Jr. in his Substack publication The Honest Broker calls it “weather attribution alchemy.”
Pielke notes that the U.N.’s Intergovernmental Panel on Climate Change (IPCC) describes weather attribution research as seeking “to attribute aspects of specific extreme weather and climate events to certain causes.” The IPCC adds:
Scientists cannot answer directly whether a particular event was caused by climate change, as extremes do occur naturally, and any specific weather and climate event is the result of a complex mix of human and natural factors. Instead, scientists quantify the relative importance of human and natural influences on the magnitude and/or probability of specific extreme weather events.
Pielke offers three important aspects of weather attribution.
- It is “tactical,” meaning political, “research performed explicitly to serve legal and political ends.” He notes that a key motive for the work of the UK-based World Weather Attribution (WWA) project is “increasing the ‘immediacy’ of climate change, thereby increasing support for mitigation.” WWA founder Frederike Otto has said, “Unlike every other branch of climate science or science in general, event attribution was actually originally suggested with the courts in mind.” Pielke says that “tactical science is not necessarily bad science, but it should elevate the degree of scrutiny that such analyses face, especially when they generally are not subjected to independent peer review.”
- Weather attribution reflects the IPPC’s inability to find with high confidence “increasing trends in the frequency or intensity of most types of impactful extreme events — notably hurricanes, floods, drought, and tornadoes.” He writes, “For instance, the IPCC has reportedincreases in heat waves and in heavy precipitation, but not tropical cyclones (including hurricanes), floods, tornadoes or drought.” Climate activists view this as a political obstacle to their policy agenda, “a problem that can be rectified via the invention of extreme event attribution.”
- The weaknesses of weather attribution should not obscure the importance of the climate issue, but that isn’t a license to ignore scientific integrity. “We live in a time when far too often calls for scientific integrity are criticized by political campaigners (including scientists),” he argues, “when certain scientific understandings do not align perfectly with this or that political agenda.”
Pielke writes that “some dismiss entirely the possibility of human-caused changes in climate while others quickly claim that every weather event is more extreme or more common due to climate change. These extreme positions are roughly aligned with the far right and far left respectively — and discussion of climate science and policy has long been dominated by these extremes.”
They’re looking for an excuse in Cuba.
What spike in 1976-77? 1941 possibly, but in reality the only similar spike was in the 1870s.
I tend to think that Javier Vinós has the correct theory with the HT volcano injecting water vapor into the stratosphere.
You cannot get anything real using massively urban-tainted and homogenised junk surface data.
I don’t deny that there’s UHI bias in the data, or political hockey-stick bias before 1900, but the overall warming trend is probably accurate to within two-tenth’s of a degree. The bad news is that warming will continue until about 2100. The good news is that we’ve already entered a period of slight cooling that will last for at least a decade. This is supported by both the harmonic models shown in the plot, and by my sunspot based models.
I suspect that AGW is going to be hard to defend over the next decade without fabricated aerosol data, or false claims of green-house gas emission reductions.
Two-tenth of a degree when the error bars well exceed that. LOL.
Humans would not recognize a change of two tenths of a degree in temperature even if their mother tripped over it.
“but the overall warming trend is probably accurate to within two-tenth’s of a degree.”
Sorry, but the data is too corrupted to say that.
—-
“The bad news is that warming will continue until about 2100”
Just a crystal ball wild-ass guess.. meaningless nonsense.
Even if it did, why is that bad news?
lol… Then you say we are entering a cooling trend.. why is cooling good ??
—-
“Harmonic models..”
Roflmao !!
The predicted cooling is good news because it will make it difficult to justify AGW claims. The return to warming is only bad because people may believe that the warming is permanent. That said, I suspect the slight cooling will last until 2050. My sunspot-based model, shows cooling for at least a decade.
Harmonic models are generally bad if they have a high number frequencies and the the frequencies are allowed to be randomly optimized. As you can see in the plot, most of the prediction comes from 4 cycles, the other two cycles just add detail. The frequencies are based on the orbits of the Jovian planets.
The year 2100 is not a guess, nor is the two tenth’s of a degree. These are predicted using another model that I will be sharing soon — a model that is not based on current temperature records. If you look at GISP2 ice core data you’ll see that the current interglacial period began with large ~950 year oscillations. Those died down before returning to give us the alternating warm-cool periods, the most recent being the Medieval Warm Period (MWP) and the Little Ice Age (LIA). Just based on this it’s not hard to predict that it’s going to be warm again 900-1000 years after the MWP. The current warm period, which peaks after 2100 has a larger than normal swing in temperature because we’re coming to the end of the Holocene interglacial period; an end that appears to be the product of chaos in the orbits of the inner planets.
Hilarious. !!
Here’s a teaser. The data in the plot was extracted from the motion of the sun around the solar system barycenter. The 950-year cycle is the inverse of temperature in the GISP2 ice core data, so the peak at year 2500 is the next cold period. The dashed line is just a sine wave for reference. The inner planets are responsible for the change.
Adjustments man it is all adjustments.
Untampered data shows no long term progressive warming.
Untampered data showed that by the late 1980’s, the then extant multi decadal cooling trend had erased all of the early 20th century warming.
The only long term and persistent warming is the warmup from the LIA in the second half of the 19th century.
You know, back when rivers like the Delaware, Thames, Schuylkill, etc, used to freeze up every Winter by Thanksgiving.
Look, there is only one place on Earth for which we have long term high quality data on weather conditions over an entire continent-sized area and in a highly detailed manner, and that is the USA.
No one has or can explain how the one area for which we have such data, shows no such trend as (let’s be real and call it what it is) made-up crap that the climate mafia buys from Fake Graphs-R-Us.
It is impossible for a continent to have long term trends that look nothing like the rest of the planet, to have 150 years of temperature patterns that bear no resemblance to the world on which that continent sits. Especially not since the US is directly exposed to the influence of the world ocean on 2+ sides, and is also at a latitude band that puts it directly under the main flow of the global winds that zip the atmosphere around the planet several times every single month.
Especially not when a close examination of the exact temperatures at specific locations, all over the globe, when graphed over long periods of time, very closely matches the patterns seen in such graphs taken from US cities, then and now.
Furthermore, there is no specific place that is having the hottest weather ever on anything but the usual very occasional and completely random basis. How can the whole world be hotter than ever if not one single specific location or place in the world is hotter than ever?
And finally, it is impossible for anything like what warmistas want us to panic over, to ever occur, for any reason. We have hundreds of millions of years of Earth History to inform us of that reality.
The atmosphere, the Earth, our planet, has plenty of extra cooling capacity that is unused at any particular time, but which can, will, and does cool off the Earth whenever it gets much hotter than average for that place and that time of year. Nearly every single night on nearly every single point on the globe, the temperature falls to near or to the dew point of the air below the boundary layer.
And this occurs long before the dawn hour. The hottest places on Earth routinely, and daily, cool down to very cool temps in a matter of hours once the Sun sets in the evening.
How much moisture is in the air at any spot on any particular day or night, is what determines what the temperature will be, within the context of the vast and endless flow of thermal energy from the surface and the tropics, to the poles and up to space.
We should be so lucky to have a nice long stretch of nice warm (IOW clement) weather.
Anyone who does not realize that is a fool or merely completely uneducated in the relevant subject matter.
The only crisis is the massive grift we are all being subjected to.
This is for ASOS. LIG uncertainty would undoubtedly be larger yet.
Don’t succumb to climate science’s unsupported theory that averaging multiple stations reduces uncertainty.
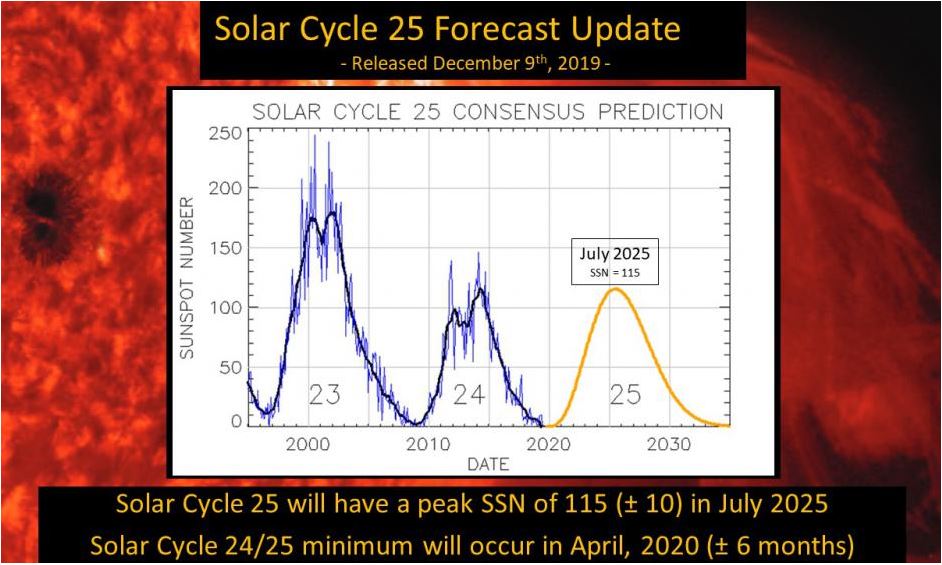
We are heading into a Grand Solar Minimum and global cooling is quite possible.
Seems the Sun itself did not get that memo, see as how July and Augst clocked in with sunspot numbers of just under and then well over 200. September was down, but I do not think there is any certainty whatsoever that we have seen solar max for cycle 25 yet. It seems doubtful to me, if the flare and CME activity of late is any indication.

When was the last time the Sun had such a spate of x-class flares?
(Top Solar Flares during Cycle 25) SolarHam
If there is a grand solar minimum, it is not at all like what the proponents of that notion predicted ahead of time:
I agree with you, in 1875 a very wet and very powerful series of eruptions occurred with the Icelandic volcano Askja, and two years later the world warmed to record levels, just like what we are living in the aftermath of HT.
Abrupt shifts between wet and dry phases of the 1875 eruption of Askja Volcano: Microscopic evidence for macroscopic dynamics – ScienceDirect
Interesting! I hadn’t associated this spike with a wet eruption.
“A one-year delay here, a two-year delay there, and pretty soon your talking about real climate dynamics”
— with apologies to former Senator Everett Dirksen
/sarc
Things do not happen overnight in the Stratosphere son. Volcanic ash is injected as well as water vapor in which the cooling effect of particulates overrides any radiative perturbations to the climate system, until the ash falls out which takes about 1.5 years, but the water vapor persists for years. Somehow, I gather that multivariate analysis is not one of your strong points.
In rebuttal, there is this:
“In the stratosphere, ozone reaches its maximum in the afternoon showing values several percent larger than the midnight value.”
— source: “A climatology of the diurnal variations in stratospheric and mesospheric ozone over Bern, Switzerland”, S. Studer, et al., June 2014, EGU Atmospheric Chemistry and Physics, https://acp.copernicus.org/articles/14/5905/2014/
Somehow, I gather that recognition of diurnal variations induced by sunlight falling on a rotating Earth is not one of your strong points.
BTW, your patronizing addition of “son” is uncalled for, as I don’t know you from Adam.
Well, not so according to the screen-grab response from Google’s AI, as presented here:
“What spike in 1976-77? “
The problem is they are defining a spike as the difference between one year and the next. 1977 was a lot warmer than 1976 because 1976 was cold.
January 1977 was the year it snowed in Miami, century old groves of avocadoes in Southern Dade County were wiped out, and about 15 years of periodic hard freezes began in that state, after several decades of few or no hard freezes in the orange growing parts of the state.
WHAT??? . . . absolutely no mention anywhere in the above article of the Hunga-Tonga volcano eruption of January 15, 2022, which was supposed to have injected an estimated 150 million metric tons of water vapor into the stratosphere . . . and thus has been hypothesized to be the strangely-delayed cause of the spike of global warming as seen in upward breakout of UAH GLAT tracking starting around mid-2023 (see UAH graph in right-hand column of this webpage).
Heck, even “climate scientist” James Hansen and climatologist Gavin Schmidt (Director of NASA’s GISS) ignore the HT volcano eruption as a possible cause of the 2023 “warming spike”!
Sic transit gloria mundi.
From the above article:
Writing in the journal Atmospheric Chemistry and Physics, published by the European Geosciences Union, the scientific team writes,
‘our results underscore the importance of the El Niño–Southern Oscillation in driving the occurrence of global warming spikes such as the one in 2023, without needing to invoke anthropogenic forcing, such as changes in atmospheric concentrations of greenhouse gases or aerosols, as an explanation’.”
So we now have the most-curious situation of UAH data showing clear evidence of a continuing “spike” in GLAT, starting mid-2023 lasting into September 2024, despite the fact that the WUWT ENSO meter just moved into the La Niña range. (Images of both presented in the column in the far right of this webpage.)
Oh, well . . . back to the drawing board, as the saying goes.
I can’t see how people get excited over this paper. It had a run last week too. We’ve had a temperature spike and an ENSO, and everyone’s first thought was that ENSO was the cause. But it seemed to be a bit too much response for a modest ENSO, so people wondered about other ideas. This paper says the first idea was right. So?
Yes, we had an wide-ranging El Nino, most likely exacerbated and maintained/extended by the HT WV in the stratosphere.
There is absolutely no evidence that human anything had any cause to this El Nino event whatsoever.
Solar activity has been up lately.
What about the theory that it was Iran’s clandestine testing of a nuclear bomb underwater off the island of Hunga-Tonga that triggered the volcano eruption, which in turn exacerbated El Nino starting in January 2022?
What about it?
Can we be sure it was not S.P.E.C.T.E.R.?
Yes, very sure.
The James Bond film “No Time to Die” (2021) featured the use of DNA agent-guided nanobots programmed to kill SPECTRE agents around the world and, consequently, the whole SPECTRE organization including the already-imprisoned head of SPECTRE Ernst Stavro Blofeld who was subsequently killed figuratively by the hands of Bond himself.
The HT explosion occurred about 4 months after “No Time to Die” was released in the UK and about 3 months after it was released in the US.
😉
The idea of a ‘global’ ‘average’ ‘temperature’ is ridiculous.
The idea that the mechanisms for measuring temperature (measuring equipment) and methods (max/min per day, hour, minute or second, attempts to average these) are consistent and appropriate, is ridiculous.
The idea that the global temperature can be measured to an accuracy of 0.1C is utterly ridiculous.
The fact that temperature itself is meaningless in this context, without consideration of humidity, which vastly changes the heat capacity of any volume of air, sometimes within minutes or even seconds, makes this measurement of temperature almost completely pointless.
The fact that the oceans hold roughly a thousand times the heat energy of the atmosphere makes the whole exercise ridiculous.
Measure the total heat energy contained in the atmosphere on an hourly basis, and of the oceans on a daily or even monthly basis, and I think we might get some meaningful information from this.
(The very fact that so-called ‘scientists’ don’t appear to understand the complete difference between ‘temperature’ and ‘energy’ (both unfortunately named ‘heat’, is a clear indication that something is badly wrong. They might as well be mixing up energy generation and energy storage capacity. Oh, hang on …)
A man after my own
hearthead.🙂
I couldn’t have said it better myself!
Fine, fine post of actual physical science!
Not to mention the conflation of thermal energy with electromagnetic energy, aka heat radiation.
That’s a whole separate issue, it’s true.
I’m somewhat of the unpopular mindset that electromagnetic radiation, ie photons, is the only pure energy. Every other type of energy is only potential energy, because it ‘could’ generate photons, but might not. Movement, ie kinetic energy (AKA ‘heat), is only relative to other moving bodies, so is only relative to the observer.
I can see why that is “unpopular”.
What about nuclear binding energy (the strong nuclear force carried by gluons and its directly associated energy as determined by the associated “mass defect” in a given atomic nucleus that is, in turn, equivalent to energy by the equation E=mc^2)?
What about gravitation waves (that are not carried by photons) which:
“H. Bondi in particular, rigorously proved that gravitational radiation was in fact a physically observable phenomenon, that gravitational waves carry energy, and that as a result a system that emits gravitational waves should lose energy”?
— ref: https://sci.esa.int/web/lisa/-/31417-gravitational-waves
Really? One question then: what is the temperature increase in a flywheel that stores 10^5 joules of kinetic energy and opposed to when it previously stored 10^3 joules of kinetic energy? By your assertion, the flywheel must have gotten “hotter”.
The kinetic energy of molecules is relative to every other molecule in the area.
The difference between low and high explosives is relative to the speed of sound. And everything that is anywhere nearby at an inopportune moment, as well.
The sea level in 2023 according to the satellites (see NASA and Climate4you) rose dramatically compared with other recent rises.
To my way of thinking there is no way that a warm, not hot, atmosphere could have added so much heat to the oceans in such a short period of time to cause such a large expansion. I am beyond doing any numbers these days and I have forgotten all my heat transfer training, but I doubt that the atmosphere could ever be hot enough to cause such a rapid transfer of energy to something that is 1000 times more massive.
“However, why such large global warming spikes occur is unknown, and the rapid global warming of 2023 has led to concerns that it could have been externally driven.”
So, the models may be wrong or at least incomplete? Or, if such warming can be caused naturally why on earth would we put all of our resources into stopping warming that will eventually happen whatever we do. Making sure we can adapt to any warming, predictable or not, seems obvious.
Blindingly obvious, 4 eyes (no pun intended). We’ve been going down the wrong road for 30 years, now…
I know it’s blindingly obvious, even I can see it, but this simple logic is what has to be put to regular folks to get them thinking, else they just spout the usual “all the climate scientists can’t be wrong”. Most people don’t actually think things through ‘cos they don’t know much, like me (and I did 4 years of eye-glazing thermodynamics) – they just accept what they assume is correct because supposed experts said it. However, they will respond to obvious logic. By the time this event has been explained we will be further down the road towards irreversible, expensive, economy destroying and probably unnecessary renewable energy.
Weather attribution is already a done deal. It’s climate change that causes extreme weather events as reported daily by all news agencies.
Of course, they have that demonstrably backwards. It’s weather change for 30 years that causes climate change per the definition of climate.
HT sent large amounts of vapour into the upper atmosphere.
The idea that it didn’t also add large amounts of energy to the ocean on the way through is ludicrous.
This would have lead to a much more pronounced and widespread El Nino event that indicated by the small ENSO34 region.
The magic HT eruption again, lol!
The main eruption occurred in January 2022. The exceptional global heat didn’t start until summer 2023, nearly a year and a half later.
Where was the heat hiding for ~18 months?
Even Spencer and Christy of UAH said that HT had “at most” an effect on global temperatures measured in the hundredths of a degree C; nowhere near enough to account for the new record temperatures that occurred a year and a half after the eruption!
By January 2023, a year after the HT eruption, UAH anomaly was negative.
So who on earth falls for this ‘it’s all about HT’ nonsense? It’s an any port in a storm mentality.
Here is the UAH global lower troposphere temperature from January 2022. Notice the extended period when all this Hunga Tonga heat hid itself from detection before magically appearing in the summer of the following year.
Christies comment was a “suppose”…. NOT SCIENCE..
Do you have ANY EVIDENCE AT ALL that there was any human causation?
Or are you just blathering mindlessly as you usually do. !!
1… Only a complete moron thinks that ocean heat expresses itself immediately, ocean energy takes a while to circulate.
2.. Only a complete moron thinks that an underwater volcano that sent WV into the stratosphere, doesn’t add a lot of energy to the oceans.
3… The ocean warming effect was obvious in the Antarctic sea ice extent in early 2023
4… The 2023 El Nino started much earlier in the year than usual… what caused that .. humans?
5.. It is funny that you now think extra WV doesn’t impede atmospheric cooling.. seems you are in DENIAL of the whole GHE. !!
6…Your continued ignorance and inability to present a single coherent or rational argument is hilarious… but then, you are a complete brain-washed idiot with zero comprehension of anything to do with climate.. so is to be expected.
It also added a loot of thermal energy into the atmosphere. Just the WV alone added thermal energy.
So why did it take a year and a half to do so?
It added a tiny amount of energy at the time of the eruption, as UAH shows.
Where did all that energy you imagine it produced hide from the time of the eruption until the long series of new monthly record high global temperature started a year and a half later?
This is not a complicated question.
So where was the HTE hiding for 18 months, bsilly?
Thank you. The Hunga Tonga crap is really the most ridiculous story I have ever heard from this side. It invalidates all their decades of greenhouse gas skepticism and it is just plain preposterous.
Your first name is a misnomer.
How fast does thermal energy move in the ocean?
Latency is important.
What has this got to do with how the HT eruption supposedly produced massive global warming 18-months after it occurred?
What you obviously fail to realize is that the heat capacity of the world’s oceans is nearly infinitely larger than the energy released by the HT eruption of January 2022.
From https://en.wikipedia.org/wiki/2022_Hunga_Tonga%E2%80%93Hunga_Ha%CA%BBapai_eruption_and_tsunami :
“Meanwhile, Vergoz and others estimate the blast yield to be 100–200 megatons of TNT and place the corresponding VEI at 5.8. Likewise, a study by Diaz and Rigby estimates the energetic output of the eruption to be equivalent to 61 megatons of TNT, making the event more powerful than the largest nuclear bomb ever detonated (Tsar Bomba).”
So, taking the largest estimate, 200 megatons of TNT, that converts to an equivalent energy of about 8.4E17 joules, conservatively assuming it all appeared as thermal energy (i.e., ignoring the energy consumed in lofting ~150 million metric tons of water into the stratosphere, as well as the acoustic energy generated by the explosion). Sounds like a lot, right?
However, the heat capacity of just the Pacific ocean is estimated to be about 5.5E24 joules/°C (per Google AI overview – see attached screen grab).
Therefore, the HT eruption can be calculated to have raised the Pacific ocean temperature, assuming volumetric equilibration of energy, by at most 8.4E17/5.5E24 = .00000015 °C.
Now, you were saying something about ludicrous . . .
This article fails to explain why the climate was still warm through September 2024 after the El Nino ended in May 2024,
AFAIK, there is a lag between the end of the El Nino phase and the decline of temperatures in the UAH record.
I believe it is usually on the order of five months, but may have significant variability.
Correct. The generally-accepted delay is 4 to 5 months. The last peak in sea surface temperatures (SSTs) in the Niño-3.4 region of the equatorial Pacific Ocean was for April 2024 (the basis for the Oceanic Niño Index, ONI). So, we are now five months after that and, therefore, if the relationship remains valid, we would expect to see UAH global temperatures to start to drop next month (October report). If not, that may be more significant. In more detail …
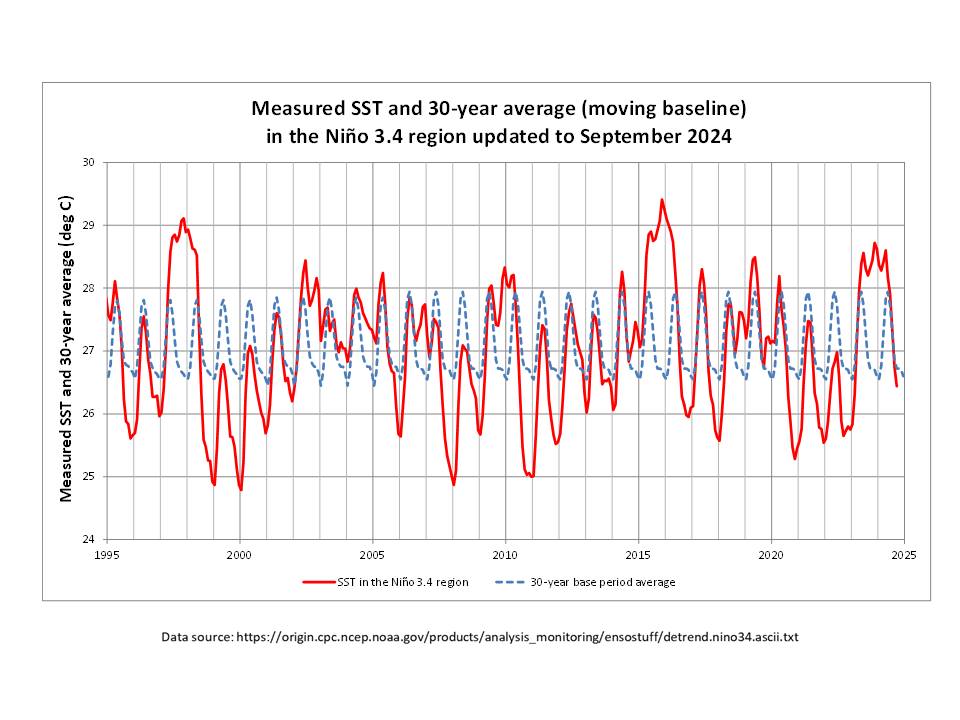
The Oceanic Niño Index (ONI) is one basis used for defining El Niño/La Niña events, where it reflects the rolling three-month average of sea surface temperature (SST) anomalies in the Niño-3.4 region of the equatorial Pacific Ocean. In the figure below, I show the measured SST values themselves (not the anomalies) which is quite informative in my opinion. The plot also shows the 30-year average SST values, which are used to compute the anomaly values (i.e. the difference between the two curves).
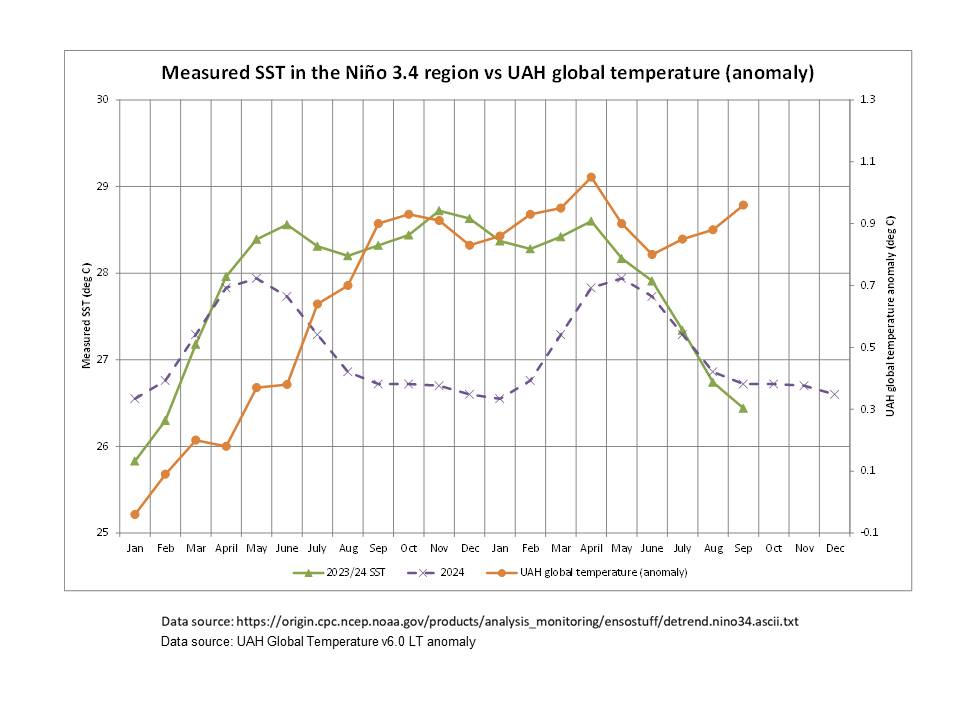
The SST values show very clearly the distinction between significant El Niño (warmer than average) and La Niña (cooler than average) events, with the two ‘very strong’ El Niño events (1997-1998 and 2015-2016) clearly standing out. The recent (2023-2024) El Niño is over now; it followed a similar pattern but peaked at around 0.5C lower, hence the classification as ‘strong’ rather than ‘very strong’. The overall duration of the high 2023-2024 SST event was virtually identical to the two ‘very strong’ El Niño events with higher SSTs than average extending from May through to the following May (May is the peak of the average SST values shown in blue dashes). In other words, there was no significant difference in overall duration of the three strong to very strong events from a ‘local’ SST perspective. Zooming in, with UAH data added …
An apparent difference can be seen, however, in the shape of the SST variation within that period of raised SSTs. Perhaps it is just noise, but the three peaks of the SST values highlights the possibility that the current UAH global LT temperature data could still be entirely consistent with a 4 to 5 month delay. The SST peaks in the Niño-3.4 region were June 2023, November 2023 and April 2024, while the UAH global peaks were October 2023 (4 months) and April 2024 (5 months). If October’s UAH global LT temperature shows the start of a decline such that September turns out to be another peak, this would also equate to a 5 month delay.
We will need to be patient before drawing any firm conclusions regarding the current UAH global LT temperature reflection of the recent El Niño. Of particular interest will be the UAH temperature that reflects ENSO-neutral conditions.
Surely you don’t think it is from anything humans have caused. !
It is very obvious the effect of the El Nino has NOT ended.
The conundrum raised is valid, and it is one for which I have no “explanation”.
It is also one that you are unable to “explain”.
It is one that nobody has, so far, been able to “explain”.
Wondering why one (relatively) short article on the Internet should be able to (fully) “explain” this particular phenomenon comes under the heading of “unreasonable expectations”.
.
For now, “we” are limited to observations about the phenomenon.
The attached graph shows UAH (TLT), ONI (an ENSO proxy) and atmospheric CO2 data since 1979.
Question 1 :Are the short-term fluctuations in UAH “caused by” changes in CO2 levels ?
Answer 1 : No.
Q2 : Are ENSO and UAH related ?
A2 : Yes. Changes in UAH seem to “follow” changes in ENSO, but with a variable delay … and there are “obviously” several other factors that “modulate” the link(s) …
Q3 : Why has the latest step-up in UAH “stuck” around the +0.9°C anomaly level for so long ?
A3 : I cannot “explain” this. Neither can you. Neither can anybody else … yet …
The following “zoomed in” graph is purely for contemplative and speculative purposes.
It doesn’t (attempt to) “explain” a damn thing.
Some thoughts about the three possible relationships:
Q1: Agreed, but the key is to look at changes in the rate of growth of atmospheric CO2 rather than concentration. Such a plot clearly shows a similar relationship of peaks and troughs to that of ONI and UAH, but with a delay to ONI. Also, it should be noted that ONI data are intentionally de-trended by the anomaly calculation process (rolling 30-year average). (I show some of the ‘raw’ SST data above.)
Q2: Agreed.
Q3: See my comment posted above. I agree that it is too soon say anything definitive about the UAH response, but it is important to note that the duration of the ONI anomaly data at El Niño levels during 2023-2024 (and the underlying ‘raw’ SST data above average levels) are the same as other recent very strong El Niño events, so we should soon see if there is a material deviation between these data and UAH temperature spike duration.
Also, on your zoomed in plot, note that the ONI data have been smoothed (rolling three month average). Not trying to be pedantic here as you are probably well aware of these issues, but not all readers will necessarily be.
My very crude approximation to this was to use “CO2 level for Month/Year – CO2 level for Month/(Year -1)” deltas as an “annual rate increases” proxy.
See attached graph below.
Note that I personally don’t like this visualisation, but mostly for aesthetic reasons. I consider it to be “too crowded / busy”.
This graph just highlights the “weird” sequencing of events following the 2023/4 “El Nino / ENSO peak”, especially the length of the ongoing UAH “plateau”.
NB : Willis has an alternative take on how (not) to use Mauna Loa CO2 data in his “No, The Carbon Sinks Aren’t Sinking” post here on WUWT just yesterday.
.
My bad. I keep forgetting my shorthand “ONI” label actually means “NINO 3.4” !
At the bottom of this CPC “Description of Changes to ONI” webpage you will find :
and the following link.
https://origin.cpc.ncep.noaa.gov/products/analysis_monitoring/ensostuff/detrend.nino34.ascii.txt
What I label “ONI” in my graphs is actually the (last) “ANOM” column of that file, which currently has monthly values up to September 2024 … but changing “ONI” to “NINO 3.4” now would mean having to update so many legends on so many spreadsheet graphs …
Many moons ago I compared this “ONI” timeseries with the MEI one, and concluded it was reasonable to consider it to be a good “ENSO proxy” that was usually promptly updated.
Thanks for the response and clarification regarding the references to ONI. I use the same file for the ‘raw’ SST data. Interesting to see that the anomaly calculation seems to remove some of the detail that appears in the SST data, both at the peaks and the troughs but, as I mentioned above, this could just be noise. We will know more in the next one or two months.
That might be so but claims of CO2 induced radiation imbalance is based in climate fisiics; nothing at all to do with measurable, repeatable physics supported by observation.
The study published by scientists from the EGU defines a “spike” in their study as a year-to-year increase in the global average temperature that exceeds 0.25K. This is strange methodology for learning about an altered state of a system because identical global averages can be calculated from multiple different physical states.
The climate is always changing, the question remain how much what way and what time period. That question remain unanswered! Let alone quantified.
The most honest and convincing answer I ever heard about climate(s) behaviours was provided by a a retired atmospheric physics professor who said about most climatic effects –
“We just don’t know yet. We don’t even know what we don’t know yet”
2024 summer has been pretty hot in Europe, too. I have a neighbour who came from Cyprus originally and they told me that, over there, temperatures of 42C did serious damage to the tomato and olive plants, plants which normally thrive in the Mediterranean.
In the UK, the summer wasn’t hot at all in terms of maximum temperatures, although paradoxically, ‘average temperatures’ can increase by having a very cloudy period when night time temperatures simply don’t drop very much. This teaches you that how you define ‘temperature’ can alter perceptions of what kind of a summer it actually was. Pleasant 15-16C nights help plant growth enormously and are very beneficial. Lack of sunshine during the day doesn’t help very much, though.
So a perfect weather pattern would be sunny days, cloudy/rainy nights ,wouldn’t it? This would also record very high ‘average temperatures’. But farmers would record extremely strong growth…..
It would be nice to have a model that correctly tracks the known past without help before we.trust anything to be remotely capable of predicting the future.
Ah, those models already exist. It is very easy to hind-cast data with just five parameters.
“With four parameters I can fit an elephant, and with five I can make him wiggle his trunk” | Real Climate Science
The problem is the predictive ability of any of those models is lacking.
Hind-casting (ass in a sling) is simply curve fitting.
I can take all of the Mega Million draws, develop software that accurately predicts all of those previous draws and run it for the next drawing. Will I win? Chances are 1 in 302E6.
What a load of lukewarmer BS! Pielke is playing divide and conquer politics with climate science.
The truth is not an extreme position. It is not extreme to scientifically. categorically reject human-caused climate changes due to man-made carbon dioxide emissions, based on facts
As an empiricist I am appalled at the constant attempts by those skeptics who think they can badger people rhetorically into some negotiated outcome premised on piss-poor AGW science.
Only a dunderhead would pretend that a lagging indicator is ‘leading’. THAT is extreme.
Apparently the truth about CO2 doesn’t align with Roger Pielke’s politics.
Human activity and CO2 are elements of climate change, but absolutely not the “control knob” as the Climate Syndicate wants us to believe.
Human activities, basically changing local ecologies from grass to tarmac have an effect. This is not a driver.
CO2 increases from energy production has an effect, a slight change, very slight change in the specific heat of air.
Neither are zero. Neither are the drivers of a multiple coupled chaotic energy systems such as the earth.
Whilst I tend to agree with the main point of the paper, I’m not sure about it’s method.
It’s defining spike entirely in terms of the relative difference with the previous year. Hence 1977 is held to be similar to 2023 just because 1976 was a cold year. In contrast 2022 was not especially cold despite being a La Niña year.
It would be better to measure the strength of the spike by comparing it to the long term trend.
Talking gibberish again, I see.
You should be well aware by now that the so-called long term trend comes only from El Nino spike + step events
There is basically zero trend between them… cooling from 2017 – 2023.4
The article contains “Global-mean surface temperature rapidly increased 0.29 ± 0.04 K from 2022 to 2023″.
The error term of +/- 0.04K is ludicrous. It immediately places the credibility of the authors in doubt. They have ne excuse because this material has been done over and over in the scientific and statistical literature.
In short summary, much statistics involves a population of numbers (that could be like the population of the Earth” from which a sub-population of numbers is selected (that could be like females ages 40 to 50 at last birthday). It is essential to establish that the sub-population represents the whole population in some accurate, described manner.
For these global temperature estimates, there are two extremes that we could use to illustrate the problem. The parent population, being the entire global temperature, could be sampled by one instrument in a satellite that circled the globe taking measurements from one instrument. We have a close approximation to this with the UAH series of Dr Roy Spencer at Alabama. The sub-population, being the local temperature could be observed by a large number of calibrated thermometers in standard housings set some agreed distance above the ground and observed by constant protocols such as readings at 9 am. We have this type of arrangement for the global temperature reported here as that silly 0.29+/-0.04K.
The accepted practice for the sub-population of ground readings is that they are NOT a sub-population of the parent whole globe case. This is because each ground weather station has so many different variables to the next that they cannot be assumed to measure the same property. Therefore, while it is OK to use one type of statistics to describe a single station with repeated readings over time, so that most variables do not change, another set of statistics is requited to calculate the error between many stations where more variables are at play.
There are many Web articles about this choice, boiling down to whether or not to divide the standard deviation by the square root of N where N is the number of samples.
Here is the first article that my search showed.
When to Use s / sqrt(n) in Statistics
….
The calculation of 0.29+/-0.04 was done by dividing by the square root of a large number, itself a large number, to generate an artificially small 0.04 which is invaliad because these are the stats used when the N samples are taken under similar conditions.
To return to the satellite measurement, there are fairly uniform conditions for the single thermometer on the satellite, but there are orbital corrections that are a source of error. IIRC, Dr Spencer quoutes his error as +/- 0.1K. It is unlikely that the ground station measurement will be better than this, so the preferred global calculation (for a start of the correction process to eath station mumbers) ) would be 0.3+/-0.1K.
Geoff S
On a (hopefully) related note:
What is the theoretical basis for reducing the uncertainty to far below the resolution bounds of the instruments used to take the measurements?
I asked this in the comments to another article, but by and large Elvis had left the building.
If we want to watch the ‘panic stressed’ individuals collective heads implode, ask them to reset the temperature record start to 1750-1790-ish. I’ll get the popcorn. Who wants butter and salt?
NOT FAIR! . . . sheesh, as everyone knows, there wasn’t any climate change prior to about 50 years after the start of the industrial revolution!
/sarc