Arvid Pasto
August 2024
A major climate parameter called “climate sensitivity” has been the subject of scientific inquiry for literally hundreds of years. This parameter, basically, is the amount of global temperature increase caused by a doubling of atmospheric CO2. If the parameter’s value is 2, then the world’s temperature will increase by 2°C when the CO2 level in the atmosphere reaches twice what it is now. It is therefore, by implication, a constant number. Scientific estimates have ranged very widely, from much less than 1 to well over 6 (see later). Exact knowledge of its value is “priceless” to climate modelers and alarmists, much like the Golden Fleece was to its owner(s) in Greek mythology.
Inasmuch as global warming is considered to arise from the presence of greenhouse gases in our atmosphere, a great deal of attention has been paid to assessing the effects of these gases (principally CO2, methane, and nitrous oxide, along with a myriad of gases typically occurring at very low concentrations).
Blaming global temperature change on any single factor, such as CO2, is folly. Beer’s Law1 describes the well-known phenomenon of “saturation”, wherein as CO2 increases, atmospheric temperature will rapidly increase starting at a CO2 level of 0, but as it increases, the temperature increase is NOT linear. Instead, it decreases, ultimately appearing to level off. (Figure 1) Thus, you can see that, using only one factor, climate sensitivity is NOT a constant. However, at high levels of CO2, the climate sensitivity can be considered to be “nearly” constant. There is a perfectly good reason for that behavior, as can readily be shown1. The major result of this expression is that, after some given amount of CO2 has been added to the atmosphere, any additional amounts will cause smaller temperature increases. At some level, these increases will be insignificant.
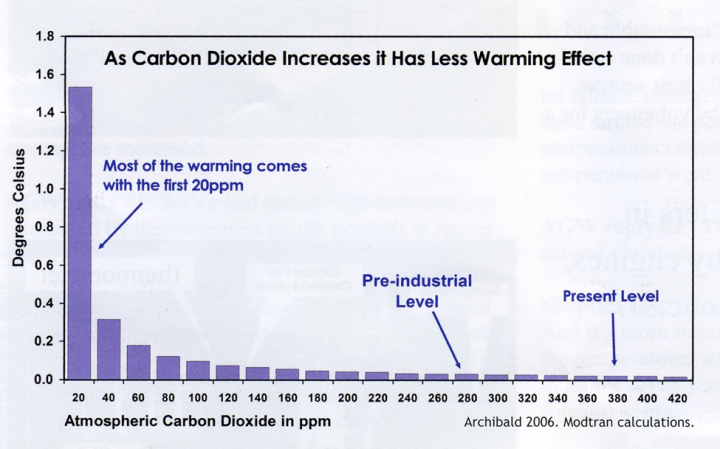
Figure 1. The effect of CO2 Concentration on Atmospheric Warming
(From page 8 of The Skeptics Handbook, Joanne Nova 2009)
The same non-linear relationship is true for any gaseous species in the atmosphere. And of course, our atmosphere is composed of anything but a single gas. Each will exhibit its own self-flattening concentration-temperature curve, depending on its properties.
Theoretically, knowing the atmosphere’s exact composition, and the requisite spectroscopic properties for each gas, it should be simple to calculate the resultant absorption curve. Earth’s global temperature is thought to be governed by a balance between the incoming solar radiation plus the earth’s own internally-generated heat, and the outgoing heat (radiation).
Gaseous molecules will absorb heat from both the incoming and outgoing radiation. The incoming heat is absorbed primarily via electronic transitions, while the outgoing heat is absorbed via vibrations and/or rotations of the molecules. These interactions can be easily measured via spectroscopy, with each species showing a distinct spectrum of absorption versus radiation wavelength (or frequency). See Figure 2.

Figure 2. Absorption of energy by several gases as a function of incident radiation wavelength, and their affect on incoming solar and outgoing earth radiation. (From a presentation by Dr. William Happer, of Princeton University, at Marshall University)
One can then calculate how much heat will be generated in the atmosphere via these processes, since the specific heat of each component is known. The calculation basically asks: how much heat is generated, and then how much temperature change does that heat cause.
Such calculations have been done for many years, with results such as shown below. These calculations allow for a more precise estimation of the “greenhouse gas effect” of a certain gas, since one can simply double the concentration of the species of interest in the calculation and see what happens. (Figure 3)

Figure 3. This figure shows that increasing the CO2 level from 0 ppm (green line), to 400 ppm (around today’s value, black line) has a significant effect, raising earth’s temperature from what it would be with no CO2 (ca. 16°F) to today’s level (ca. 60°F). You can plainly see that doubling the CO2 to 800 has almost no effect (red line). [Ron Clutz.com 2021]
The two principal “evils” of climate change, CO2 (carbon dioxide) and CH4 (methane) are easily shown to be unlikely to cause any significant global warming, through calculations like those discussed above. Both are known to be continuously increasing (Figures 3 and 4), and have been painted as the major cause(s) of global warming for decades.
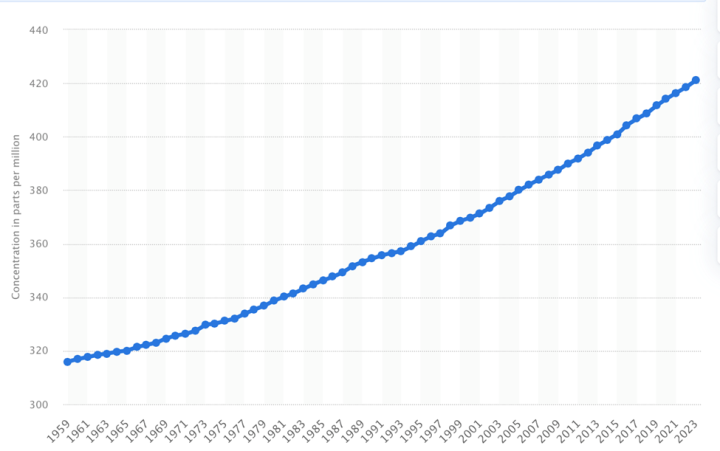
Figure 3. CO2 concentration in earth’s atmosphere through 20232.

https://www.yahoo.com/news/methane-emissions-speed-tracking-improves-143117916.html
Obviously, then, something is missing from these global warming calculations. Many factors, other than atmospheric gaseous heating, can be easily inferred. These include assumptions about how much incoming solar radiation is reflected or absorbed by clouds or the oceans, how much incoming light is scattered by clouds or “dust” in the atmosphere, how much incident light is reflected by clouds, or ice and snow patches on the earth, and numerous others. The latest climate models have defined all of these terms in great detail (Figure 5).

https://wattsupwiththat.com/2024/07/30/the-return-on-your-investment/
Additional hard-to-account-for factors include extraneous heat sources (underwater volcanoes, underground coal- or- methane fires), soot deposited on glaciers (heat absorbing), the recent huge world-wide wildfires (which produce heat, soot, and CO2), and others.
Finally, there are the so-called “feedbacks”: these include interactions between two gases such as CO2 and water vapor, and others. These can be positive, wherein the presence of one gas, e.g.- CO2, is thought to cause an increase in the presence of another, e.g.-water vapor, from enhanced evaporation from the oceans. They can also be neutral or negative. (Figure 6) The heat inputs, called “forcing factors” are added to the “feedbacks” in climate models.
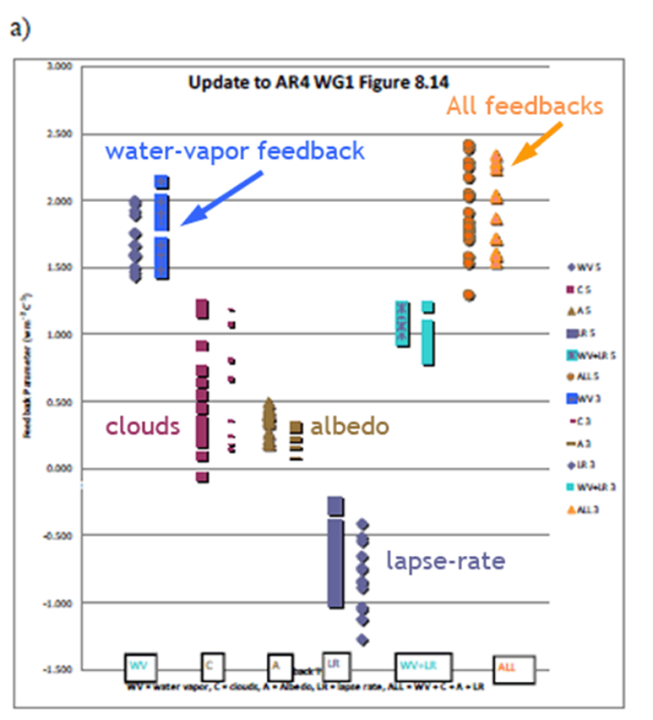
Figure 6. Climate feedback considered in global climate models. [From IPCC AR4 report.]
The water vapor feedback is especially troublesome: it is NOT known to be “positive”, much less as positive as climate scientists claim to know.
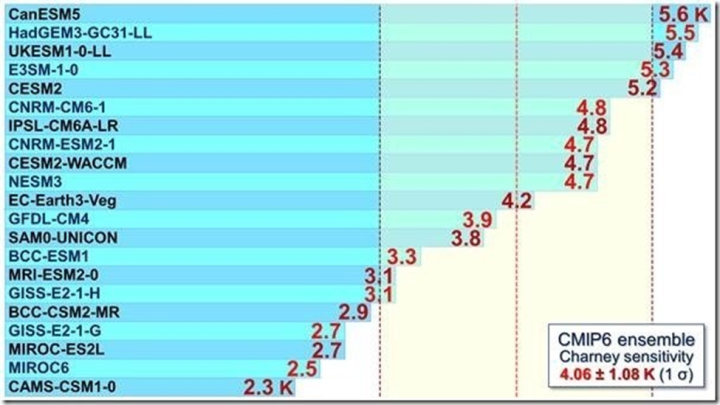
Because there are so many forcing factors, and so many complicated feedbacks, climate sensitivity is impossible to calculate a priori. Assumptions must always be made. Yet scientists have tried in vain for decades to do just that. (Figures 7, 8, 9)
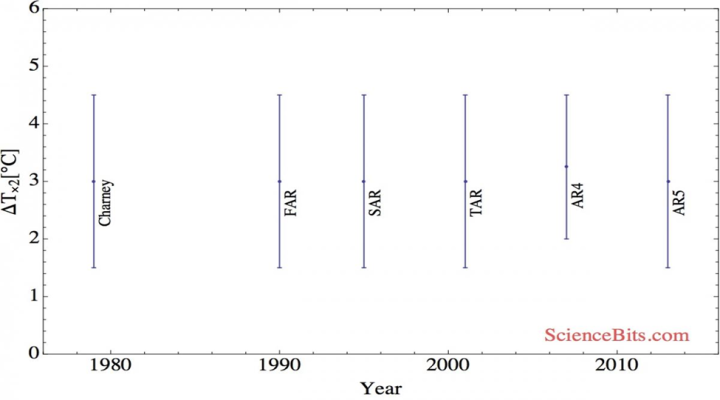
Figure 7. Scientific estimates of climate sensitivity. In 2013, Nobel Prize-winning physicist Nur Shaviv said, about this graph, “More seriously, let me put this in perspective with the most boring graph I have ever plotted in my life. Below is the likely range of climate sensitivity as a function of time. As you can see, with the exception of AR4 with its slightly smaller range mentioned above, the likely range of climate sensitivity did not change since the Charney report in 1979. In other words, after perhaps billions of dollars invested in climate research over more than three decades, our ability to answer the most important question in climate has not improved a single bit!”
https://wattsupwiththat.com/2020/01/12/paper-praising-models-predictions-proves-they-greatly-exaggerate/2019
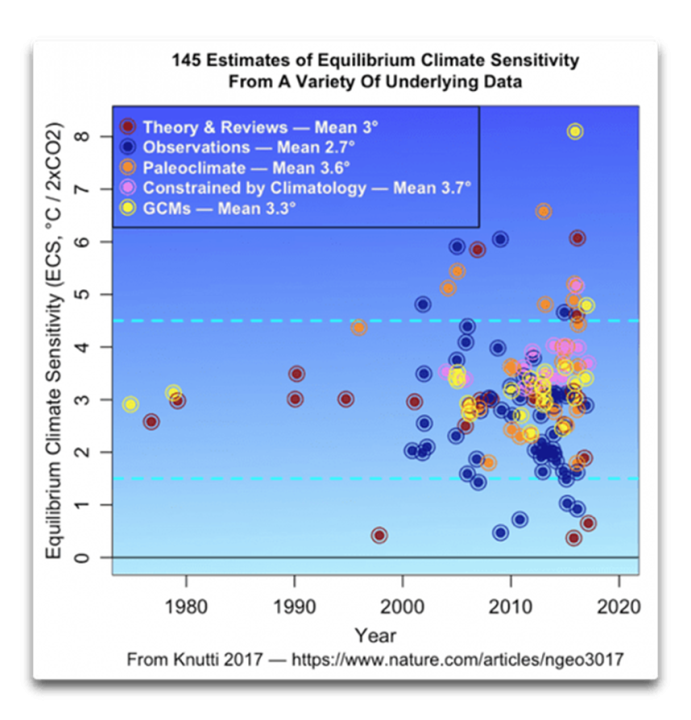
Figure 9. Historical estimates of climate sensitivity.
It turns out that climate sensitivity is actually a physically useless term, except to help show what influence certain forcing factors or feedbacks may have on global warming. Global atmospheric temperature can now be measured directly 24 hours per day via satellite and/or weather balloons, and ocean temperature via diving buoys, and “earth” temperature via thermometers located on every continent. (The latter two have their own problems, especially the surface measurements, but these will not be discussed here).
Global climate models currently utilized on supercomputers worldwide do not actually use “climate sensitivity” as an input, but their output can be used by generalists to suggest its value from the computer’s input and output.
Given the results of actual global temperature versus the results of computer climate models (black line on Figure 10), one can see that earth’s temperature is NOT increasing at anything like the rate that would be predicted by a “climate sensitivity” of over 2.
The global CO2 level in 1976 was2 332 ppm, and the starting temperature change is taken as 0.00. In 2016, CO2 was 404, and the rise in temperature was 0.3°. At an average rate of 2 ppm/year increase, it would take 166 years to double from 1976. {I use 2 ppm/yr, even though from 1976 to 2016 it was 1.8 ppm/yr, but it has been increasing to over 2 ppm/yr lately}. Now, 40 years represents 0.24 of that time difference (40/166). Thus the “climate sensitivity” starting in 1976 would be 0.3°C/0.24, or 1.25. If the climate sensitivity (C.S.) had been 2, the expected temperature rise would have been 0.48°, and if C.S. was 3, then the rise would have been 0.72°C, and etc. The average of the climate models shown on the graph gives between 4 to 5 for the climate sensitivity (and increasing).
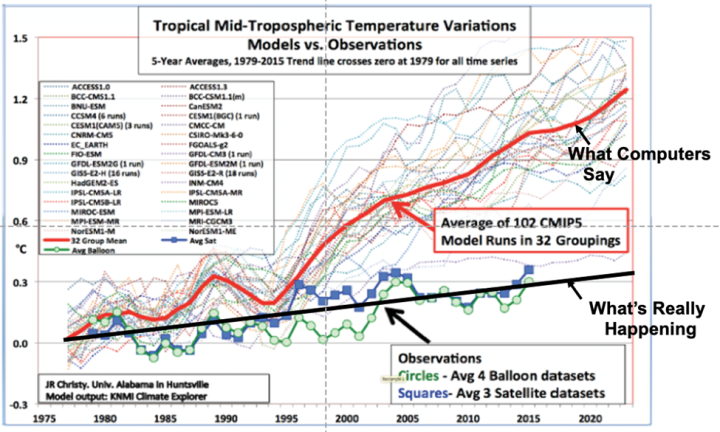
Figure 10. Comparison of computer climate model forecasts and actually observed global temperature. [From Dr. John Christy, Univ. Alabama-Huntsville]
If the rate of rise rate in CO2 dramatically increases over the next few decades, then the climate sensitivity will also increase, and so will the predicted global temperature. Actually, the CO2 emission rate is expected to slow, which will extend the CO2 doubling time, and decrease the climate sensitivity.
However, since actual temperature and CO2 data result in a current climate sensitivity of ca. 1.25, there is plainly something wrong with the current “fad” for climate sensitivities of 3 or more.
AND…the real problem with the term “climate sensitivity” is that it implies that CO2 is the driver of climate change, which it is not.
REFERENCES
- M. N. Berberan-Santos, “Beer’s Law Revisited”, Jour. Chem. Ed. 67, Sept. 1990
- https://www.statista.com/statistics/1091926/atmospheric-concentration-of-co2-historic/q
CO2 and “climate scientists” reminds me of the parable about drunks, car keys, and street lights. “ But the light is so much better over here”.
Climate’s “Golden Fleece”
Those Subsidy Farms containing either Solar Panels or Wind Turbines
That is how the public coffers are being Fleeced
“…Subsidy Farms…”
_______________________________
Good one +10
All the countries are being “fleeced” via their voluntary “donations” by the UN, the UNFCCC, the IPCC, and the UN COP and a coterie of unscrupulous climate scientists (aka the whited-coated welfare queens).
I did a search on: UN COP Budget, and found that for 2023 it was 67 billions.
COP distributes the funds via grants and programs to poor countries to help
them cope with global warming and climate change.
67 billion sure isn’t very much considering the trillions being spent on getting rid of fossil fuels worldwide.
I think we can all agree that AGW/climate change is one big “fleecing” exercise.
Computer models spit out what they are programmed to spit out. Reality? What’s that?
And what is spit in is temperature data accurate to +/-5C and spitted out are numbers allegedly accurate to two decimal places.
The UN’s IPCC was given the job to show humans caused global warming and that’s what they did.
Well, actually, they haven’t shown that at all. Not by any real scientific method.
They only pretend that they have.
There’s always this:
IPCC TAR Chapter 14 Page 770 pdf3
The climate system is a coupled non-linear chaotic system,
and therefore the long-term prediction of future climate states
is not possible.
I guess predicting something is better than predicting nothing when you are tasked with and getting paid to predict warming.
In summary: nobody knows, on the basis of which let’s self-destruct.
If, in order for there to be a causal link between two variables there must be correlation, and since correlation between rate of Manmade CO2 emissions and rate of global warming – according to that confection, Global Mean Temperature Anomaly – ceased in the late 1990s, then the ‘theory’ is falsified.
All the graphs and maths and algorithms and measurements cannot change that fundamental fact.
There is also correlation on a geological time scale that temperature rises precede CO2 increases. Probably because not as much CO2 can dissolve in warmer waters.
The ocean temperature limit of 30C is a function of atmospheric mass. Hence the impact iof doubling CO2 is not measurable because it is such a low proportion of the atmospheric mass.
Anyone who believes the GHE nonsense needs to be able to explain why CO2 is selectively reducing cloud everywhere apart for a few degrees north of the Equator and over a small region of Antarctica:
 ?ssl=1
Regarding figure 3:
The molecular absorption coefficients needed to make atmospheric transmittance calculations have only about 3 digits of resolution, claiming a difference between 277 and 274 W/m2 of integrated irradiance can’t be justified, it isn’t resolvable.
Regarding figure 5:
Another example of the typical energy balance cartoon—the measurement uncertainties of the radiometric quantities needed to calculate these differences are too large to resolve differences of 0.01 W/m2, or even 1 W/m2. In addition, the numbers are global, annual averages, and the actual values at any given location and time will be quite different.
277 is equivelant to -8.5C. Any flight you have taken temperature outside stopped cooling at -8.5C. The graph is modeled not actual observations.
A meaningless equation is used
260K σ T^3 = 1 x 3 to calculate CO2.
In excel its 260^3*0.00000000567*3
Note the attribution of the top diagram – Archibald 2006, Modtran**.
About 15 years ago, I inquired of David A. about this and was told he had “moved on” – his current interests include cancer research, climate science, oil exploration, COVID science and fighter aircraft design.
**MODTRAN – MODerate spectral resolution atmospheric TRANSsmittance algorithm and computer model
MODTRAN is now in Version 6. Perhaps it is time for a researcher^^ to produce a new chart. It might be the same, but how do we know?
^^Beyond my pay grade.
The real heart of MODTRAN (as well as LOWTRAN and HITRAN) are molecular absorption coefficients which were produced by the US Air Force Geophysical Labs in the 1960s-70s (as well as the original FORTRAN codes). By the 1980s they had made the code free for the cost of a 1″ magnetic tape. I doubt any of the versions since then have made significant changes to the absorption calculations.
Well, there is also the attached graph (unfortunately, date and MODTRAN version not stated) that compares the MODTRAN predictions for TOA radiance from Earth to the actual radiance as measured by the IRIS spectrometer that was flown on the Nimbus-4 satellite (ref: https://catalog.data.gov/dataset/iris-nimbus-4-level-1-radiance-data-v001-irisn4rad-at-ges-disc ).
The source of the graph is listed as the University of Chicago and the label references a technical paper/report: “MODTRAN Infrared Light in the Atmosphere”
I would say that whatever version of MODTRAN was used in this comparison, the computer program is darn good . . . not perfect, but darn good . . . at reflecting reality.
Update:
I was mistaken in saying that “MODTRAN Infrared Light in the Atmosphere” referred a technical paper or report. Instead, it refers to the website “MODTRAN Infrared Light in the Atmosphere” that is accessible at https://climatemodels.uchicago.edu/modtran/modtran.doc.html .
Also, this website states the IRIS spectrometer data used in creating the referenced graph (available directly on this website) was from the Nimbus-3 satellite, not the Nimbus-4 satellite that I mentioned, with the data referenced to “Hanel et al., 1972”.
Also, please note this notice of an update to the aforementioned website:
https://www.researchgate.net/publication/322539560_Updates_to_Modtran_Infrared_Light_in_the_Atmosphere_See_URL_fileCUsersDougDownloadsPease_Extended_Abstract20Bestpdf
The funny thing about this graph is the suggestion of Ts = 320K. The satellite measurement was done just after noon in summer. The meteorologic air temperature (in the shadow) might easily be 320K. But that is not the surface temperature.
The sand would be a lot hotter, maybe like 335K. But sand is also a pretty poor emitter, especially in the right half of the atmospheric window.
Since you appear to have tracked down the rather-precise time of the IRIS observational data used in the referenced comparison graph, can you please cite the specific latitude and longitude of the ground location for it?
The “Sahara” (only location ID given on the graph) is not uniformly sand everywhere (see attached photo, for example, from the reference cited below).
“We know it is strange to find trees in the desert. Even more when its number reaches 1,800 million. Yes, one thousand eight hundred million. It is not a mistake. This is the amount that has been registered at the Sahara Desert: a total of 1,800 million trees and shrubs . . .
“For the study, researchers have included the tree and shrub species whose crown covered at least 3 m2.”
— https://medomed.org/2020/more-than-a-thousand-million-trees-in-the-sahara-desert/
The shadows provided by trees when the sun is overhead do, in fact, cool the underlying sand/soil, not just the “meteorologic air temperature”.
This is one of the things that has always bugged me. What is the surface? Is it the physical soil, sand, rocks, etc., or is it the atmosphere 2m above the surface. The atmosphere is always described as unable to absorb sunlight, so the surface must be what absorbs the sun’s energy.
What you have described is why the so-called “back radiation” simply can not be warmed by the atmosphere.
I have always thought the “back radiation” was developed to cover the difference between the hard surface temperature and the 2m atmosphere even though it is the difference between the absorbed sunlight and the resulting warming of the atmosphere.
Sorry, Jim, but that is simply not correct . . . at least in terms of scientific studies of Earth’s atmosphere and its interaction with the solar spectrum from UV to near-IR wavelengths.
Just one well-known, information-dense example (well, among scientists, that is) is provided as Figure 2 in the above article. Hint: look at the second graph down in the figure, the one that shows the variation in percentage of sunlight absorbed and scattered by the atmosphere over the range of 0.2 to 3 microns wavelength.
In particular, notice the particular impact that water vapor in the atmosphere has on this incoming radiation.
I know that. There are plenty of graphs of sunlight showing the atmosphere absorbing some sunlight and refracting some also. But, the masses have been trained to know that the atmosphere doesn’t absorb sunlight. Consequently, all the extra warming arises from “back radiation”, primarily from CO2. God forbid sunlight would warm CO2 as that would mean some of the warming arises from something other than CO2 absorbing radiation from the surface.
Hard to tell if that’s sarcasm or really what you assert to be happening.
In any event, I’ve never given much weight to what the “masses” have been trained to know. To me, it matters much more if they’ve ever been trained to think for themselves . . . and if that training has been in any of the hard sciences, all the better.
BTW, the science says sunlight warm water vapor, independent of its effect on CO2 (which the referenced Figure 2 does show takes place).
Ooops . . . my last sentence above should read “. . . sunlight warms water vapor . . .”
Oh well, let me just point out what it is all about with VW feedback. Interestingly it is not derived from radiative transfer models that yield a much lower figure than the 1.8W/m2.
Rather it is based on satellite data and thus empiric data. And that may all sound nice and good, if it did not include a fatally wrong assumption. The idea is, that if surface temperature (Ts) changes, outgoing longwave radiation (OLR) might follow the planck feedback (PF), of some 3.6W/m2 for clear skies.
If dOLR/dTs should be smaller than PF, that would indicate a fast positive feedback, only attributable to WV. On top of that comes the assumption, that as Ts changes, the troposphere would do so even more, because lapse rate feedback (LRF). So if the surface was to warm by 1K, the troposphere (Ta) should warm even more, like 1.5K for instance. With most of OLR comming from the troposphere, dTs/dOLR should exceed PF due to LRF.
However, since dTs/dOLR is observed to be smaller than PF, that would indicate an even stronger WV feedback. The graph illustrates the logic.
What “climate science” failed to check, is if dTa/dTs > 1. They just assumed it, and it might be theoretically true in the long run, although one might dispute this based on Christy’s chart above. However, in the short term, like with seasonal temperature variations, it is definitely not true. Rather it is the opposite, like below..
dTa/dTs < 1. That will explain for the largest part why the observed dOLR/dTs relation is well below PF. The estimate on WV feedback thus is baseless and falsified.
https://greenhousedefect.com/the-holy-grail-of-ecs/the-incredibly-stupid-case-of-water-vapor-feedback
I agree. There is sufficient evidence in my opinion that the WV feedback must be much smaller or even negative. Otherwise the decrease in lapse rate, particularly at the tropics, should be detectable and it is not.
The Earth’s climate is strongly stabilized by a very powerful water cycle. Increasing the surface temperature simply increases the water cycle, strongly limiting the resulting warming. The key to climate change is at the poles, where there is no WV.
As I have pointed out long ago, WV as it is, is not really a GHG.
Also quite important is an accurate attribution of the GHE..
The system seems to maintain a linear change in OLR with Ts by any means necessary. That is the feedback in a nutshell. Models diagnose the Planck feedback to the surface-atmosphere warming as slightly less than a pure stefan boltzman blackbody response ~ -3.8 W/m2/K (PF about -3.3 W/m2/K). The reasons for this are not completely understood.
The reason is named in the article, and in the Cess quote below..
not really. the general idea going around is that it emerges as a special case of CO2 forcing from models with the stratospheric cooling. This diminishes slightly the response. It does not respond as such from other forcings, such as aerosol change.
ES read your greenhousedefect.com link. You went through unnecessary convolutions to (not) get the often stated Planck feedback of 3.3.
It comes about as follows:
TOA= 240 W/m^2
IR from 288 C surface = 390 W/m^2
Change in surface IR per degree = 5.4 W/m^2
so 5.4 x 240 / 390 = 3.3 ……to refer “forcings” to TOA.
There is lots of room for criticism of this conventional treatment, especially regarding treatment of CO2, water vapor, and clouds which all have different IR characteristics than simply assuming 240 at the top and 390 at the bottom and linearizing them….
Personally, I prefer Modtran which does IR and water vapor absorption on a line by line, and layer by layer basis…and stops self declared cliSci experts from saying water vapor feedback will triple temperatures and similar nonsense.
Well, thx for explaining to me, what I explained way more thoroughly. You might also make up your mind if it is “convoluted” or whether there is lots of room for criticism.
Also it is important said planck feedback is not based on a “linear” change of temperature thoughout surface and atmosphere. If that was so, we could approximate it with 255K. Than the planck feedback would be 3.76W/m2/K (=4*255^3*5.67e-8) with all skies, and ~4.1W/m2/K with clear skies.
Instead, as the quote by Cess et al shows..
..the consensus planck feedback figure has no rationale basis at all.
Not that this was main point however.
You needn’t take my comment as an insult. I was merely pointing out that the derivation of the 3.3 number was simplistic in nature and easy to demonstrate where it comes from….instead of readers envisioning teams of Ph.D. students spending months of thesis research….
Article says:”…heat will be generated in the atmosphere via these processes…”
The atmosphere “generated” zero heat. The atmosphere has internal energy (u) but no heat generating capacity.
Heat (energy) is indeed “generated” in the atmosphere by the degree to which atmospheric gases absorb both incoming solar radiation and outgoing LWIR surface radiation.
Such radiation absorption changes the internal energy of the atmosphere.
Heat is a type of energy that is only recognized at a boundary and there must be a temperature difference, thermal gradient.
You are wrong there is no heat generated by the atmosphere.
Do you not therefore find it strange the science uses the terms “heat of fusion” and “heat of vaporization” to define the intrinsic property (i.e., not a boundary property) of substances where internal energy increases/decrease without a temperature difference?
If certain molecules with permanent or induced dipole moments can interact with and absorb LWIR radiation photons that have insufficient EM energy to excite electron levels in the respective atoms (which is what actually happens with “greenhouse gases”), in what form is that absorbed EM energy temporarily transformed into if not heat?
Hint: in physical substances, contained heat energy is a physical reflection of the various forms of the kinetic energy of the atoms/molecules comprising the substance (as distributed across all available kinetic degrees of freedom, such as translational velocities and bending, stretching, rocking and rotating vibration motions, including such motions in free electrons in solids). Again, these are all intrinsic properties of substances, not depending on boundary or outside factors).
So, a more accurate scientific statement would be: EM energy is transformed into heat by the atmosphere . . . what some might view as a distinction without a difference.
Absorb is the key. The molecules absorb rather than generating heat (energy) internally.
I’ll repeat the question to you: in what form is that absorbed EM energy temporarily transformed into if not heat?
That isn’t the question. The question was about CO2 being a source. A source has two ways to become that way, internal generation or absorption. CO2 has no internal generation, therefore it can only become a source by concurrent absorption.
mkelly originally said:
If the atmosphere is colder than the surface, then it is not a source of heat. The atmosphere may be a source of energy through absorption, but it can only be a heat source when radiating to a colder body, i.e., upward to colder temperatures.
Or, you can do as so many climate scientists do and add fluxes, even if they are in opposite directions.
That is a common misconception that is absolutely wrong. All substances with a temperature above absolute zero emit thermal radiation energy (aka “heat”), in general conformance with the Stephan-Boltzmann equation.
A substance at a given temperature above absolute zero has no way of “knowing” what configuration of other bodies (and their individual temperatures) exist externally . . . and in fact the correct expression of the Stefan-Boltzmann equation radiation energy only involves the state (i.e., physical conditions, such as area, emissivity and temperature) of the single radiating body.
Thermal radiation is not really “thermal”, it is an Electromagnetic Wave exactly like any other, be it microwave or ultraviolet. It is considered as a infrared frequency that has energy that can be absorbed.
Take sunshine for instance, no one calls it thermal radiation, yet it can raise the temperature of molecules that absorb it.
If two objects are at thermodynamic equilibrium, they are passing equal amounts of energy between themselves, yet no “heat” is passed.
The formula for heat is Q = m·c·ΔT. There must be a temperature change for heat to be passed. A cold object can not raise the temperature of a hot object.
See my previous post to you with a quote from phys.libretexts.org.
This doesn’t say energy can’t flow from cold to hot. It says heat can not travel from cold to hot. That is why SB two body is set up with Tcold being subtracted from Thot. The net heat flow is positive when calculated from hot to cold.
Depends on how you define “generate”. The atmosphere doesn’t generate its own heat intrenally and actually neither does the surface.
I never claimed that either the atmosphere or the surface did such. But I did make reference to the atmosphere being able to transform EM energy into heat energy, which is true.
The second law of thermodynamics says HEAT flows spontaneously from hot to cold. If the energy in the atmosphere originates from the surface, the atmosphere can not be a source of heat to the surface, energy maybe, but not heat.
The atmosphere can pass heat upward to colder atmosphere, but not downward to the surface.
Forget trying to equate energy and heat. They are not the same thing. Energy can flow both ways between objects. Heat can only flow one way, hot to cold.
Your confusion arises from your misunderstanding of the Stefan-Boltzmann equation for thermal radiation energy from a single body (or substance) versus the Second Law of Thermodynamics that governs the net exchange of energy between two bodies at different temperatures. The two laws actually are NOT in conflict because the scenarios are completely different (both hypothetically and actually in physical approximation to the hypothetical).
If one wants to extend the S-B law to a two body configuration, the situation is different from the single body configuration because while the cooler body does radiate energy onto the warmer body (and thus adds energy to it since there is no such thing as a perfectly reflecting body), the warmer body conversely radiates energy onto the colder body and thereby adds energy to it. Simultaneously, both bodies are radiating energy to deep space (to ~infinitely and not to a material body) in the view factors not blocked by each other’s external object, thus there is an overall increase in entropy in the “control volume” due to the energy being dispersed by the unrestricted radiation.
On the other hand The Second Law of Thermodynamics (as regards the direction of energy or heat flow) simply cannot be applied to the hypothetical situation of a single object or substance radiating to space vacuum since space vacuum is not a material substance. However, in that specific case the Second Law of Thermodynamics (as regards the general increase in net entropy resulting from energy/work change) does apply because the energy of thermal radiation from a single body does cause an overall increase of the entropy of the system since the energy is gradually dispersed into the universe as compared to being concentrated originally in the single warm body.
As regards your statement: “Heat can only flow one way, hot to cold”, I have this question: when liquid water at 0 °C freezes into water ice at 0 °C, is there any heat flow, and if so, in what direction?
https://phys.libretexts.org/Bookshelves/College_Physics/College_Physics_1e_(OpenStax)/15%3A_Thermodynamics/15.03%3A_Introduction_to_the_Second_Law_of_Thermodynamics_-_Heat_Engines_and_their_Efficiency
From Planck’s Theory of Heat Radiation
The phase change of water between ice and liquid is a COMPLETELY REVERSIBLE thermodynamic process.
Separately, as I previous stated, there is no such thing as a perfect reflector . . . therefore, the blub you provided on “Plank’s Theory of Heat Radiation” that implies obtaining reversibility by reflection is not close to realistic . . . heat (energy) will always be transferred from the radiating body to the physical matter comprising any real reflector. So, any body radiating thermal energy into space (at a 3K background temperature) is undergoing an irreversible process, thereby increasing entropy in the universe.
BTW, none of the many words you provided addressed the fundamental question that I posed to you. Wanna take another shot at it?
“If the rate of rise rate in CO2 dramatically increases over the next few decades, then the climate sensitivity will also increase, and so will the predicted global temperature. Actually, the CO2 emission rate is expected to slow, which will extend the CO2 doubling time, and decrease the climate sensitivity.”
This statement assumes the CO2 content is controlled by our emissions but there is strong evidence that nearly all of the recent increase in CO2 is natural. This article makes valid points about the interaction in the atmosphere that effect the surface temperature. The bottom line is CO2 increase is not responsible for most of the warming we have seen, will not produce a climate crisis, and is not human caused.
“ Fig. 3 …You can plainly see that doubling the CO2 to 800 has almost no effect (red line)”
The difference between the lines is 3 W/m^2 by Happer and vanW (its their graph). They might be ignoring the atmospheric water vapor increase that should occur due to warming of our wet planetary surface, my mind has slipped and I don’t want to reread Happer and vanW just now…. But you can run that yourself on Modtran using offset temperature and select constant relative humidity. Still a low number, but in the “some effect” region, so saying the 3W has “almost no effect” is failing to address the actual CO2 warmers viewpoint. In fact, fig. 1 could be updated to include the water vapor using The constant RH method in Modtran
All in all, this is a very good review for WUWT readers, especially for new readers. Glad to see graphs updated to 2023 and ppm to 420, Willis’s 2 level radiation balance Fig. 5 is still the best…so often we see Christie’s old 2015 graph, your Fig 10…etc…good work, Arvid Pasto
Oops, spoke too soon, on Fig 10, you didn’t extend the satelitte and weather balloon readings past Christie’s 2015 lines.
Current temperatures are 0.2C below the model average. The spread has dramatically narrowed since 2015.
“If the rate of rise rate in CO2 dramatically increases over the next few decades, then the climate sensitivity will also increase..”
I’m not a scientist nor math wizard. Just like to ask questions. I don’t understand why, in theory, the climate sensitivity would correlate with the rate of rise of CO2. I could imagine, that maybe, the sensitivity would correlate with the level of CO2 but not the rate of rise. Somebody enlighten me. Actually, I thought the sensitivity didn’t change at all or very little.
Mr. Pasto, thank you an excellent summary with really great charts to emphasize and simplify the fundamental scientific facts to be considered.
Unfortunately, I note the following necessary correction (bolded text) in the second sentence in the descriptive title for your Figure 3:
“
YouMost—but not CAGW alarmists, AGW alarmists, the IPCC and the Biden/Harris administration—can plainly see that doubling the CO2 to 800 has almost no effect (red line).”Sad, but true.
Prof. Nir Shaviv is not a Nobel award recipient.
“Thus, you can see that, using only one factor, climate sensitivity is NOT a constant.”
The article explains at the start that sensitivity is in described in terms of a doubling of CO2. Obviously if something is constant in respect to a logarithmic scale, it will not be constant in respect to a linear scale.
“Figure 1. The effect of CO2 Concentration on Atmospheric Warming”
That graph is showing a warming of around 0.3°C caused by a rise from 20 to 40 ppm. If the sensitivity is larger than 0.3 the temperature scale should be much bigger.
“At some level, these increases will be insignificant.”
Handwaving nonsense. At current levels the difference between a log scale and linear is hardly distinguishable. And this is irrelevant if CO2 is not increasing linearly.
That is not at all obvious to me, or to mathematics. If ln(x) = constant1, then x = e^(constant1) = constant2.
“ln(x) = constant1”
ln(x) is not constant. What can be constant is the climate sensitivity, the amount temperature changes in response to a logarithmic change – e.g. every doubling of CO2 leads to an increase of S°C where S is a constant.
“then x = e^(constant1) = constant2”
e^S is not a linear function.
e^S, where S is a constant (your words), is not a function of any kind.
“Function, in mathematics, an expression, rule, or law that defines a relationship between one variable (the independent variable) and another variable (the dependent variable).”
(source: https://www.britannica.com/science/function-mathematics )
“e^S, where S is a constant (your words), is not a function of any kind.”
It’s a constant function, and still has nothing to do with the point.
“It’s a constant function . . .”
Then please state the dependent and independent variables that are involved.
Going from 40 to 80 in Figure one is less than 0.3…and 80 to 160 less so…and so on. Not constant, even on a linear scale, and more and more insignificant with higher concentrations. Don’t be so obtuse.
“Going from 40 to 80 in Figure one is less than 0.3…and 80 to 160 less so…and so on.”
Then you’ve been mislead by the graph. It should be showing an equal change from 40 to 80 and from 80 to 160. To see that you would have to add u[p all the individual bars to see the cumulative change from 40 to 80, or from 80 to 160.
The graph is, unsurprisingly, intentionally designed to be confusing.
Only needs to be above primary school level to confuse AlanJ. !
It is a simple chart Alan your confusion is predictable as you are perpetually confused by a lot of basic things here.
How come you couldn’t bring up a higher resolution-based chart neither has Bellman thus a lot of empty words…..
The graphic is meant to show that climate sensitivity is low, but it is anything but obvious that the graph already has an assumed climate sensitivity baked into it of 0.4 degrees per doubling of CO2, which Archibald obtained from a single paper written in 1998. This fact is almost certainly not known by the dozens of commentors celebrating the findings of the post.
You really don’t understand saturation do you? As you double concentration there is less and less available for the new doubling to absorb so there is less and less change.
Have you never heard of the example of taking one half of the remaining distance between two points as you travel toward one of the points. Each distance step will become smaller and smaller. IOW, you will never reach the point you are moving toward. What do you think a graph of this would look like?
My objection is not to the notion that warming is logarithmic with respect to concentration, my objection to the graph is that it assumes a low climate sensitivity, and thus cannot be used to demonstrate that climate sensitivity is low, as the post is doing. The fact that few in the comments realize this fact is why I’ve said the graph is intentionally confusing and misleading.
That is exactly what you are objecting to.
If you think going from 220 to 440 should result in 4.5°C then show a graph starting at 0 ppm and showing that amount of warming between 220 and 440. I wonder what the rise from at the beginning will be?
It is not remotely what I’m objecting to. I am objecting to the notion that one can assume the conclusion in their premise and still produce a logically coherent argument.
If you have an objections, then show a graph of what you think it should look like.
You have yet to describe a concrete physicality that can be graphed.
If it can’t be graphed based upona temperature versus a CO2 concentration, then say so.
You cannot construct the graph as shown without knowing what the climate sensitivity is (you have to convert from forcing, which is what the MODTRAN model outputs, to delta T using the sensitivity parameter). The author of the graph assumes a climate sensitivity of 0.4 degrees C. Thus you cannot point to the graph and say that it shows that climate sensitivity to CO2 is low, because the climate sensitivity indicated by the graph is an assumption the maker of the graph baked into it.
I think I’ve run out of different ways to say this. The fact that you are still confused just reinforces my point yet again. It is a confusingly designed data visual seemingly intended to mislead readers.
0.4 from what concentration to what concentration? You do realize this graph is designed to show that climate sensitivity is NOT A CONSTANT. It will change as the concentration is more and more saturated. When the level of CO2 absorbs all the radiation it can, adding more will do nothing to the radiation being absorbed nor the temperature. Going from 200 to 400 may produce some amount of warming. Going from 400 to 800 will probably reach the saturation level and minimal temperature increases afterward for a doubling.
If you are taking something else from the graph, you are assuming some things that aren’t in evidence. Don’t just assume the climate sensitivity to a doubling will remain constant.
The graph is intended to trick viewers into thinking this, but sensitivity is explicitly defined as the warming resulting from a doubling of CO2, and the graph shows that this is a constant value. To determine the warming from each doubling from the graph, you have to add the heights of the bars between each doubling, and you will see that it is approximately 0.4 degrees (again, this arises because the author has assumed that climate sensitivity is 0.4 degrees and built the graph from that assumption). Importantly, the first bar does not represent warming from a doubling from 10pm to 20ppm, it represents some amount of warming from a concentration near zero ppm (so a 20x increase in concentration), a fact not disclosed by Archibald.
I’ll repeat – the fact that you are still confused about the implication of the graph cements my point that it is intentionally confusing.
“If you think going from 220 to 440 should result in 4.5°C then show a graph starting at 0 ppm and showing that amount of warming between 220 and 440. I wonder what the rise from at the beginning will be?”
Climate sensitivity is not a constant across all ranges of CO2. You can;t assume the same amount of warming from 1 ppm to 2 ppm as from 220 to 440. You’re making the same assumptions as Monckton did, assuming that feedbacks will be identical for all temperature ranges.
And it’s nonsense to talk about starting at 0 ppm – that would require infinite warming as soon as you introduced any CO2 into the atmosphere.
If you did assume the sensitivity is as high as 4.5 and that that holds for a world with just 1 ppm, then getting to 20 ppm would be 4.3 doublings, so would mean around a 20°C rise over virtually no CO2.
Why would warming have to be infinite? Show us some calculations that going from 0 to 1 ppm would have an infinite climate sensitivity? If ECS is calculated to be logarithmic for each doubling of concentration, the first doubling wouldn’t be from 0 to 1. It would be from 1 to 2, 2 to4, 4 to 8, … . You would end up with 100 to 200 at 4.5. 200 to 400 at 4.5.
I’m not the one that is proposing an ECS for a doubling of CO2, your climate science savants are doing that. Maybe you can come up with a range and domain where that is applicable.
Climate sensitivity is defined as the temperature change resulting from a doubling of CO2. This is the definition that David Archibald was using in constructing the graph. In the 2007 paper the graph is from, he states:
This “temperature response demonstrated by Ido (1998)” is a climate sensitivity of 0.4 degrees per doubling.
Again, the point here is that Archibald has assumed an extremely low sensitivity in making the graph, and thus the graph cannot be used as evidence of a low sensitivity.
“Why would warming have to be infinite?”
Under the assumption of a logarithmic increase. You can’t divide anything by zero. You can keep doubling zero indefinitely and it will still be zero.
“If ECS is calculated to be logarithmic for each doubling of concentration, the first doubling wouldn’t be from 0 to 1. It would be from 1 to 2, 2 to4, 4 to 8,”
Then why ask for it starting at 0?
In any even, 1 what? 1 part per million? 1 part per billion? 1 molecule of CO2?
You cannot simply project the idea of a logarithmic warming rate too far out.
“Have you never heard of the example of taking one half of the remaining distance between two points as you travel toward one of the points. Each distance step will become smaller and smaller. IOW, you will never reach the point you are moving toward. What do you think a graph of this would look like?”
You really don’t understand mathematics. Logarithmic growth does not converge. You will always reach any point you are moving towards, just at an increasingly slower rate.
Regardless, though, it’s still an irrelevant point. We are only interested in a local range of values. As you get to higher values you need a bit more CO2 to get an equivalent rise, but that doesn’t make the extra warming insignificant.
Here’s a graph showing the log for different CO2 levels from 280 to 1000 ppm.
Nice graph, now do it for temperature as the author did.
As I’m sure you know, the temperature depends on the sensitivity.
If you assume the vary low sensitivity of 1.25 claimed in this article, then the graph looks like this. If the actual sensitivity was 2.5, just double all the values on the y-axis.
If you want something more like the graph in this article try this. It’s showing how each increment of 20 ppm changes the equilibrium temperature. (Going up to the 500 ppm level, rather than stopping at 420 as this article does.)
So where does saturation occur in your graph?
What saturation? I’m only showing what happens with logarithmic growth. That never stops. If you think there’s some point where additional CO2 has zero effect, then it’s up to you to explain at what point that will happen, and why.
If you just mean the effect reduces due to logarithmic growth, than that’s just what the graph is showing. But that’s already taken into account in models so I’m not sure why anyone here thinks it’s a miracle cure.
Even Dr Spencer points out this argument doesn’t hold water.
https://www.drroyspencer.com/2024/08/yes-the-greenhouse-effect-is-like-a-real-greenhouse-and-other-odds-and-ends/
That was a trick question from primary school. If you start on a journey of 1000 miles travelling exactly 1/2 the distance each day, when do you arrive?
Your school needed to define “arrive”.
After 25 days you are within 2 inches of your destination, and could easily ring the door bell.
After 55 days you are within an atom’s width of your destination.
So (∞ / 2) doesn’t exist?
n / 2 → ∞ as n → ∞.
I guess that what bellboy is trying to say is that now we are up in 400ppm region, small changes in CO2 can be treated as having a linear effect to simplify calculations
A guy called Leckner did some actual lab experiments and path length calculations and found that the relationship is not actually logarithmic (that is just another IPCC simplification), but absorption became saturated on the central band at around 280ppm.
So instead, became basically flat from there upwards.
“I guess that what bellboy is trying to say is that now we are up in 400ppm region, small changes in CO2 can be treated as having a linear effect to simplify calculations”
Try thinking rather than guessing. What I’m saying is that the difference between linear and logarithmic is not as big an advantage as these sort of articles pretend.
Here is the graph of CO2 against time on a log scale. It’s pretty close to linear because there has been up to now a slight acceleration in the rise of CO2.
Now what happens if the CO2 rises at a linear rate of 2.5ppm per year until the end of the century?
You see a slight deviation from a linear rise, but it’s does not mean the rise becomes “insignificant”.
What happens if unicorns do big farts in the middle of the desert?
You are saying that CO2 rise is NATURAL, and related to temperature,
Since CO2 causes no measurable warming.. Not much will happen.
“You are saying that CO2 rise is NATURAL”
Lie all you want. It just demonstrates how desperate you are.
Poor muppet.
.. you don’t even understand the implications of what you are saying.
Immaterial nonsense as usual. If the absorption flattens out at 280ppm, doesn’t matter what CO2 does above that.
Now, do you have any empirical scientific evidence of warming by atmospheric CO2 ??
Or are you just a flightless twit flapping your wings and jaw.
“Immaterial nonsense as usual.”
You need to understand that I’m arguing against what this article claims, not the fantasies in your own head.
Poor little thing.. beaten to a pulp and still making pathetic whimpering sounds. 🙂
Now, do you have any empirical scientific evidence of warming by atmospheric CO2 ??
Still waiting !!
Only if all the warming was due exclusively to the increase in CO₂, if anything else is contributing to the warming, then the climate sensitivity would be much lower.
sensitivity is the expected temperature response to an initial radiative forcing. Sensitivity does not depend on radiative forcing. It depends on the nature of the system.
Yes, but it can only be calculated from the warming if “all” the warming is due directly and indirectly to the increase in CO₂. As Roy Spencer explained in 2018, if there is a natural component causing part of the warming, the climate sensitivity drops dramatically. And all warming caused by other anthropogenic emissions and land uses changes also reduce the climate sensitivity calculated from the change in temperature,
yes I understand from that perspective it has devolved into an ad hoc accounting scheme. Ideally, sensitivity would be deduced a priori assuming it is a real physical parameter.
Seeing as how the major climate shift to warming occurred over ten millennia ago, it appears that nature, not man, rules the roost.
This is a point that needs to be stressed since the Natural environment is still operating thus needs to be fully accounted for.
“Only if all the warming was due exclusively to the increase in CO₂,”
That precludes using the surface data for any calculation of sensitivity…. we know urban warming and bad sites etc make up an unknown, but large, part of the warming
It also precludes using UAH over El Nino spike/step events, which are most certainly not caused by CO2.
That leaves those periods in UAH between the major El Ninos as the only sensible period to attempt a “sensitivity” calculation.
And those periods have a linear trend which is pretty close to ZERO !!
+100,000,000,000,000,000
“In 2016, CO2 was 404, and the rise in temperature was 0.3°.”
Not sure where that 0.3°C comes from. Even UAH shows a warming rate of 0.113°C / decade up to 2016. Over 4 decades that’s 0.45°C. Surface data shows warming of around 0.6 – 0.7°C over that period.
I’m not sure what the rest of the calculations are doing. A better calculation would be log2(404/332) ≈ 0.28.
0.45 / 0 28 ≈ 1.6
Or
0.7 / 0.28 ≈ 2.5
But that’s ignoring lots of other factors, and is not giving you equilibrium sensitivity.
“Even UAH shows a warming rate of 0.113°C / decade up to 2016.”
WRONG.. from 2001-2015 there was basically no warming in the UAH data.
You are using the 1998 El Nino step change, pretending it was caused by CO2.
And surface warming, from growing UHI effects, is not from CO2 either.
Silly child !
The claim was about warming since 1976, not 2001. But keep shouting – it makes you look so smart.
And you keep using data that is manifestly NOT CO2 related.
You know that, so it must be pure stupidity or deliberate deceit.
You look like a moron either way.
“ pure stupidity or deliberate deceit.”
Seems all bellboy can do is give a red thumb.
Probably can’t decide which one applies most to him.
Stop whining.
I haven’t given you a down vote, but why do you care? No amount of votes will disguise the fact that you have the debating skills of an immature 5 year old.
You FAILED.. as always.. you should be used to it by now.
“And you keep using data that is manifestly NOT CO2 related.”
Please at least try to think. The claim is that there has been 0.3°C warming since 1976. I’m asking about that claim. I’ll repeat the sentence I was asking about
The fact you are so desperate to turn this argument into one about El Niños makes it clear that you realise the 0.3° claim is wrong. So as always you distract with your childish ineffectual name calling, rather than admit the error.
Still trying to justify using El Nino non-CO2 temperature to do calculations to get a fake result.
Hilarious.
Do you know how pathetic that makes you look !
He never posts a temperature chart MINUS the El-Nino effects on Temperature changes because as we both know the absence of it would badly hurt his case.
Interesting idea.
Here’s a graph of UAH annual anomalies, where I’ve removed the fitted affects from ONI and AOD.
Producing the above, also suggested an improvement over my previous linear model. Here’s the improved version which better represents the effects of volcanic activity.
Your “linear model” is totally meaningless JUNK.
You have proven you are clueless.
Adding glitter to a ****, makes no difference.
Using the El Ninos as always.
You are a manic FAKER !!
You HAVE NOT removed the effect of the El Nino.
You have left the step change fully in tact.
Only person you are FOOLING is yourself.
Removing the transient+step effect of the El Ninos from the UAH data give NO WARMING AT ALL.
The only usable data, that might not be affected by urban warming, El Nino events etc, are the UAH periods 1980-1997 and 2001-2015.
Both those periods have basically ZERO trend.
You could also include the period between 2017 and 2023.4, which showed a cooling trend.
Facts .. poor ignorant red-thumbers really don’t like them, do they. 🙂
Figure 1 & 2 are modeled not observations. Figure 1 shows a % as UV, Visible (56%) therefore 52% is heat. Of the 1kw that strikes the earth, 527w-m is IR(52%), 33 is UV(4%), 440(44%) is visible. Of the 527 is the partial movement of heat from north pole to south pole during a year which is made up of.
Pole(Winter) to pole(summer) 155 watts
10hpa Latent heat 42 watts
Half of the heat from the sun 670w (340w)
Figure 2 isn’t a measurement.
114,270,600,000 watts (65.9% of incoming heat) / 336,000,000 km(65.9% of earth) 340w.
Heat loss of 189w is observed and 104w-m2 (110hpa) + 42 at 10hpa (146w) by greenhouse gases.
Figure 2 has 394 (as 42 is added when its at 10hpa not the surface) in global temperature for July. Water heat is removed from surface and released at top of atmosphere. Heat does not return to surface. It is released to space. But flow keeps 10hpa near constant.
352 escapes to space as earths heat is the other half of 704w (1408w total July).
Reason sun total heat is split in 4 and not 2.
1360 (whole) x 127,500,000 (1/4 of earth) = 172^11 watts * 66%(albedo) 114^11/(66% of 510^6(whole earth)) emmisivity =340w.
(night & snow/ice reflection) 2/3 of earth isn’t solar absorbed.
Carbon dioxide role is to help ozone remove UV from stratosphere via the mesosphere. CO2 plays role in temperature of the surface.
This arcticle assumes modeled data(presented) is based on actual observations.
Correction : CO2 plays no role in temperature of the surface.
Still waiting for the HOT SPOT which must be hiding because the awesome climate models say it should exist, being shy…..
Where is the Positive Feedback Loop the one that was supposed to generate the scary run-away warming trend to boiling oceans.
Without these two decades old predictions AGW isn’t worth shit and everything else that generates the SCAM is a waste of time.
positive feedback simply implies a feedback that is less negative (stabilizing) than a stefan boltzmann response. Feedback starts at around -3.8 W/m2/K and it’s chipped away from there to something slightly less stable. Models estimate about -1 to -2 W/m2/K. Still stable, just slightly less so.
I know that positive feedbacks exist, it is the idea of it being a LOOP that implies it goes up and up and up which never happened in the last Billion years or so……
I don’t think there are any credible claims for an unstable climate, i.e. one where the sum of feedback kernels is positive. However, Eisenmann has some conjecture where it’s possible at very cold temperatures, tipping into a snowball Earth mode. He finds no reason to think it can happen into a heating mode. Lambda maxes out around -0.5 W/m2/K. https://www.nature.com/articles/s41467-024-50406-w
The above article’s Figure 7 thru Figure 10 clearly falsify the claim that “the science is settled” as regards to climate change™.
Can we please just bury that meme once and for all?
As carbon dioxide increases, it transforms fractionally less radiant energy into kinetic energy. This is different from smaller increases in warming.
Whether the kinetic energy influx increases sensible heat (warmth) or not, is the big question.
If the frequency and/or intensity of tropical thunderstorms increase in response, there may be no detectable increase in sensible heat.
Or if the rate of Hadley cell circulation increases.
Or if cloud fraction and/or type changes to increase albedo a touch.
Or if all of the above. Or if something else.What if increased algal photosynthesis increased the size and frequency of biological marine oil slicks, increasing the reflectivity of the ocean surface?
My own view, now, is that increased CO₂ forcing has no detectable impact on atmospheric sensible heat.
It’s negative feedbacks all the way down.
Net effect, yes. Otherwise we wouldn’t be here to respond so amiably to each other’s comments.
Making the final effect basically ZERO.
That is why you have so much difficulty presenting any empirical evidence of warming by atmospheric CO2.
At some point you will have a growth spurt, and then maybe so many points won’t fly over your head.
You will always remain with the mind of a 5-year-old.
Your tantrums at being sprung using non-CO2 warming to calculate a CO2 sensitivity are quite hilarious.
Noted yet again, a juvenile attempted avoidance of any empirical evidence of warming by atmospheric CO2.
“Your tantrums…”
Some serious projection there from bnice. He doesn’t realise that anyone can look through his comments and see how agitated he gets whenever someone disagrees with him.
“In 2013, Nobel Prize-winning physicist Nur Shaviv said”
Nobel Prize??
If that’s the only nit you have this time, thanks (it’s a reasonable one).
See you next effort.
Huh?
Nothing in Nir Shaviv – Wikipedia about a Nobel Prize.
Very nice.
I think with the Solar Irradiance over the past 100 years being the greatest of any 100 year period in the last 400 years, that extra heat might warm the air and the oceans and a warmer oceans would dissolve less CO2 in it, leading to more CO2 in the atmosphere.
https://lasp.colorado.edu/lisird/data/historical_tsi
Figure 2 shows how water is by far the most significant “greenhouse gas” (I’ve read elsewhere it is the source of about 75% of the “greenhouse effect”. It makes sense that it is thus also the greatest “feedback effect” factor impacting climate models of global warming.
However, the complex role of increasing water vapor on our climate is not fully understood and even harder to measure. It has some global cooling effects from increased cloud formation. It is also integral to the meriodonal heat transfer away from the tropics to higher latitudes where more heat is released to space than is absorbed from solar radiation. This results from the massive heat released during condensation of this water vapor. The global cooling effects of water vapor condensation is analogous to a water-cooled engine where the heat transferred in the form of the phase change of water to a gas and back is exponentially greater than that resulting from the convectional heat transfer by winds or ocean currents.
Figure 10 above is fascinating but disappointing in that the data ends in 2015. It would be much more credible if it was current, say through 2023. Any chance anyone has updated this graph? As a scientist, I would no longer reference it as it may hide a significant change between models and actual data.
Yes, is there an updated version?
Jose, you can kind of fill in the last 9 years by looking at the info in the right sidebar on this site. My take is not much has changed in the divergence. (unless the models were drastically toned down).
This is a version updated through 2023:
Christy’s graph shown in fig 10 follows an odd convention of centering all of the series on a single point so the “trend line crosses zero in 1979” instead of the typical convention of placing the series on a common baseline, so it looks bit different visually, but the trends are the same and can easily be compared. Here is the same comparison, but for CMIP6 instead of CMIP5 (I believe Christy’s graph is for CMIP5):
And this is a similar comparison, but for near-surface trends instead of trends in the mid-troposphere:
Near-surface data has been artificially warmed by the adjustments.
And massive urban warming.. It is a FAKE AS !!
The adjustments cool the near-surface data:
ROFLMAO
That same FAKE graph from Zeke the CON-man (or is it from Gavin the chief faker)
You are so, so GULLIBLE. !
Either one of the FAKE graphs is totally meaningless as any representation of Earth’s climate because it is built almost totally from massively corrupted urban surface sites.
You have never provided a shred of evidence of the graph being fake, and I’ve replicated the results for the land stations myself. You have to put in more effort if you want to be taken seriously.
You have never produce anything that isn’t manic and blatant propaganda.
You have been asked several times to produce the data used for several sites in both instances.. and FAILED completely
You will have to make a tiny amount of effort if you don’t want to appear as a gormless, brain-washed twit.
If you think that I’ve failed to provide proof where proof is needed, is is your chance to be the better scientist and provide proof of your claim that the graph is fake.
Nope, it doesn’t work that way!
Your graph is an assertion made by you. You need to provide the resource(s) or evidence needed to support your assertions . Otherwise, you are simply saying, “Trust me, I am correct!”. ROFL!
The graph was not made by me, it was made by a climate scientist named Zeke Hausfather. My assertion, that adjustments reduce the global warming trend, is supported by the graph, prepared by an expert climate scientist with a robust publication record. NASA shows the same graph.
Bnice is making an assertion, that the graph is fake, ergo he bears the burden of proof for that assertion. You are excusing him from dereliction of this responsibility because of your own prejudices. This could be a good moment for you to engage in self reflection.
Do you know what the word “cite” means? Don’t use others work without acknowledgement.
Apologies for my oversight. I welcome you to join in me in calling for bnice to provide proof of his allegation now.
And what are the uncertainties associated with those? Not the spread, but the actual uncertainty. Show a reference about where the uncertainties are calculated.
Model uncertainty isn’t well characterized by statistical methods due to much of the uncertainty arising from structural differences between models, scenario uncertainty, uncertainty in the initial conditions, and internal variability between model runs. This model uncertainty is often characterized by the spread of ensemble outputs, although strictly speaking these are “ensembles of opportunity” and shouldn’t be taken to be equivalent to a probabilistic uncertainty envelope.
More regurgitated gibberish trying to cover for garbage models..
It is hilarious to watch your antics.. 🙂
You have to do better.. but we know you can’t.
You pays you to write your gibberish ??
So in essence you don’t know how to propagate measurement uncertainty of the input data through the model into the output!
Is all the data input 100% accurate? If not you are missing the real physical variances of input data. Why am I not surprised that mathameticians/statisticians/programmers simplify physical reality to get a back of the envelope answer and portray it as an exact description of reality.
No one claims that climate model output is an exact description of reality. As noted, the uncertainty in climate model output extends beyond just the propagation of measurement errors in the initial conditions (which is not a critical component of uncertainty in long-term projections to begin with). Monte Carlo methods and ensemble approaches are some of the best tools we have for characterizing this uncertainty given all the complexity described in my earlier comment, and is hardly “back of the envelope.”
Really? No one?
The IPCC doesn’t use these to support Net Zero?
You do realize that uncertainty is additive betweenn model iterations, right?
Show a result of a Monte Carlo analysis of uncertainty within a model iterations and how that is propagated into the next iteration.
You have shown nothing to support your assertions.
How does anyone verify your assertions?
Good luck on anyone accepting your assertions.
Can you cite anyone? Saying that climate models provide actionable information about likely future outcomes is not the same thing as saying they are exact descriptions of reality.
It’s quite obvious on inspection that model results diverge more and more the further out the projections go, so this seems to be a given.
A difference with no distinction.
The IPCC quotes results of what temperature growth can be expected via increased CO2. How many news articles are quoting that we are doomed because 1.5°C has been passed. Where do you think the doom originates. It sure isn’t here.
You have no idea what measurement uncertainty is nor how it propagates through a model do you.
The quote a range of possible outcomes.
Yet they are absolutely incorrect from the smallest growth to the largest. The models are unverifiable, you casting that they are is done from belief, not from evidence.