Guest Post by Willis Eschenbach
Over in the X-Twitterverse, I see that Roger Hallam (@RogerHallamCS21) is doing his very best to scare people. Here’s his xtweet:
If ever there was one datapoint which proved that humanity is inevitably moving into a period of revolutionary social disruption, it is the top right hand point of this chart.
The global sea level temperature for the first 5 months of 2024 is literally off the chart. The super exponential hypothesis is alive and kicking.
Meaning, in everyday language, things are going to get so bad so quickly political regimes are going to collapse like dominoes.
As I keep saying – the key question of our time is this: WHAT COMES NEXT? – Fascism or Radical Democracy?

Figure 1. Roger Coppock’s graph referred to in Roger Hallam’s tweet.
So what’s not to like about this chart?
Well, first off, every dot in the chart represents a full year of data … except for the dot at the top right, which only has 5 months of data, from January to May. If memory serves, this is known as “comparing apples to orange peels” or something similar. And in any case, under any name … it’s not done.
Next, they’ve thrown away about 90% of the data by averaging it into years. Why not use monthly data, since we have it?
Next, the idea that a few months of warmer-than-usual sea levels “proves that humanity is inevitably moving into a period of revolutionary social disruption” is a joke. It assumes that we’ve never seen rapid sea surface temperature increases before.
So, what would a real graph of the ERSST data look like? To answer that, as is my habit, I went and got the underlying data and graphed it up. Here’s the result.

Figure 2. Graph of the full ERSST.V5 monthly sea surface temperature (SST) dataset. Periods with red line and blue background are times of rapid warming or cooling.
Now, there are several interesting things about this dataset. First, there were two times in the past, around 1878 and around 1942, when we saw similar large jumps in the sea surface temperature. I’ve highlighted those two anomalies, along with the current warming, in red. Curiously, neither of them led to, what was it … “a period of revolutionary social disruption“. In fact, were it not for thermometers, nobody would even have known they occurred.
I mean, when’s the last time you woke up and thought “Wow, it certainly feels like the global ocean surface temperature is a quarter of a degree C warmer than a couple of months ago!”?
So what caused the jumps in 1878 and 1942? And more than that, in both cases why did the temperature return quite quickly to the status quo ante?
As we used to say during the many seasons I spent commercial fishing, “More unsolved mysteries of the sea.”
Next, although the CO2 levels were rising during the half-century from 1860 to 1910, sea surface temperatures were dropping over that time… go figure. Another unsolved mystery of the sea …
Next, there’s a relatively strong cycle with a period of about 9.1 years in the data … too short to be sunspot-related. Why nine+ years? Dang those mysteries!
Finally, we come to the question mark in the upper right corner in Figure 1—what will tomorrow bring? My first guess would be that it would do what it did in the past, go up and come down again. However, to get a better sense of where it’s going, Figure 2 shows a closer look at the recent part of the same data shown in Figure 1, with the same yellow/red smoothed lines as in Figure 1.

Figure 2. Same data as in Figure 1, but only showing the recent sea surface temperature since 2016. Yellow/red lines are the same CEEMD smooth of the data as shown in Figure 1
And this reveals a curious fact … sea surface temperatures are not skyrocketing as Hallam and Coppock claim. Quite the opposite—the temperature peaked in August of last year, 2023, and has generally dropped in the nine months since then.
And finally, we can see why in the Hallam / Coppock graph the average of the first five months of the 2024 temperature data is so much higher than the average of the full twelve months of 2023 data, despite the fact that sea surface temperatures have been dropping for nine months.
TL;DR Version: We may indeed be “moving into a period of revolutionary social disruption”, but it’s not because of one very misleading dot on a graph of global sea surface temperatures …
My very best wishes to all, now I gotta go mow the lawn.
w.
Yeah, you’ve heard it before: When you comment, please quote the exact words you’re discussing. I can defend my words, but I can’t defend your interpretation of my words.
And if you want to show I’m wrong, here are instructions on How To Show Willis Is Wrong.
Typo? should …during the half-century from 1860 to 2010… be,
…during the half-century from 1860 to 1910?
Thanks, fixed.
w.
That is all lot of data, with likely very changing methodology over 170 plus years. Anyone care to put some error bars on it? I recall some very controversial methodology for SST in the past.
Nicely done all around, WE. I believe it was Twain who said,”Figures can’t lie, but liars can figure.” As here. Maybe this is how Guterres got his ‘boiling oceans’ notion for the last COP.
He did not get that on his own. It was fed to him, and he ran with it, similar to Biden, who is just a third rate mouthpiece, who cannot even repeat what is on a teleprompter.
FOUR MORE YEARS OF THIS?
I slight variation of economist Ronald Coase’s proposition states: “if you torture statistics long enough they will confess to anything!”
We must have a different understanding of the term “off the chart”.
I can definitely see a green dot in the right corner of the chart.
Literally.
We also have a different meaning of the word literally. “Off the chart”, means on the chart. “Literally off the chart” means REALLY REALLY ON the chart.
And WTF is a “sea level temperature”???
The jumped out at me as soon as I read it. It means the guy who wrote this does not know shit otherwise it would jump out at him too.
What I’m getting out of this is that, in the 1850s, we launched a flotilla of satellites capable of mapping surface temperatures with sufficient resolution to calculate a reasonably accurate global mean within 0.1 degrees or so, such that we can reasonably create a continuous dataset extending over the ensuing 170 years or so? And this is to be the basis of policy now?
You didn’t know that cyberpunk was about deeper reality?
IFA, forget the 1850’s, & calculate a reasonably accurate global mean within 0.1 degrees or so.
Couldn’t even get that close in 2014.
Adjustments galore. Went looking for accuracy and just what they are able to measure after a post of Bob’s Dec, 2014 and had a real awakening. Seems that overall measuring of ‘sea surface temps’ has problems. Original bucket & thermometer (no depth control), ship intake (well below surface and varied depth due to load +/-20 feet), buoys (seem to rock in the wave with depth resolution of a meter), then IR satellite (cannot get thru the clouds) to microwave (get thru the clouds, but not the rain & surface mist). Oh and did I mention one of the satellites was doing reasonable until they had to boost the altitude, then had problems with pitch, yaw and just had no idea the height it was flying. The number of adjustments to correct is staggering. Includes (but not limited to); wind speed, rain, cloud amount/percent and cloud water vapor, daytime diurnal warming, high latitudes, aerosols, SSTs <10C, columnar water vapor, higher latitudes show a slight warm bias, seasonal cycle wind direction for SST retrieval, fast moving storms and fronts, wind direction error and instrument degradation.
http://images.remss.com/papers/rsspubs/gentemann_jgr_2014.pdf
Still their abstract reads –
Errors were identified in both the MW and IR SST data sets: (1) at low atmospheric water vapor a posthoc correction added to AMSR-E was incorrectly applied and (2) there is significant cloud contamination of nighttime MODIS retrievals at SST <10C. A correction is suggested for AMSR-E SSTs that will remove the vapor dependency. For MODIS, once the cloud contaminated data were excluded, errors were reduced but not eliminated. Biases were found to be 20.05C and 20.13C and standard deviations to be 0.48C and 0.58C for AMSR-E and MODIS, respectively. Using a three-way error analysis, individual standard deviations were determined to be 0.20C (in situ), 0.28C (AMSR-E), and 0.38C (MODIS).
Meaning that it is impossible to KNOW differences less than about 0.2C. Calculating differences in the hundredths digit is nothing more than reading something out of a cloudy crystal ball – a WILD ASS SUBJECTIVE GUESS.
An “accurate global mean” is still meaningless.
It won’t be a warmer winter in the Southern Hemisphere.

Yeah, ocean temperatures are local, not global. Some parts of the ocean are warm, and some are not.
And some, such as the line along the Equator, resemble smoke signals. Episodic pulses of heat? Now what could cause that in the oceans?
Of course, but as your own charts show, the highs and lows keep getting, well, higher. Despite efforts to downplay it, your graphs highlight how extraordinary the past few months have been compared against the historical record, and the trend keeps on going up.
True, if the comparison of global mean to a time when a handful of guys were dropping a thermometer off a sailboat every 200 miles or so is any indication.
Actually, throwing a leather bucket over the side, hauling it in, AND then chucking a thermometer in the bucket…
That is actually better than the subjective, paid-for computerized model industry comes up with
To no defined depth……
And done by an illiterate Seaman Stains, when he could be bothered.
+1000 for the Captain Pugwash reference.
Here is a link – surface pressure observations – that indicates that – even today – some areas of the oceans are rarely visited.
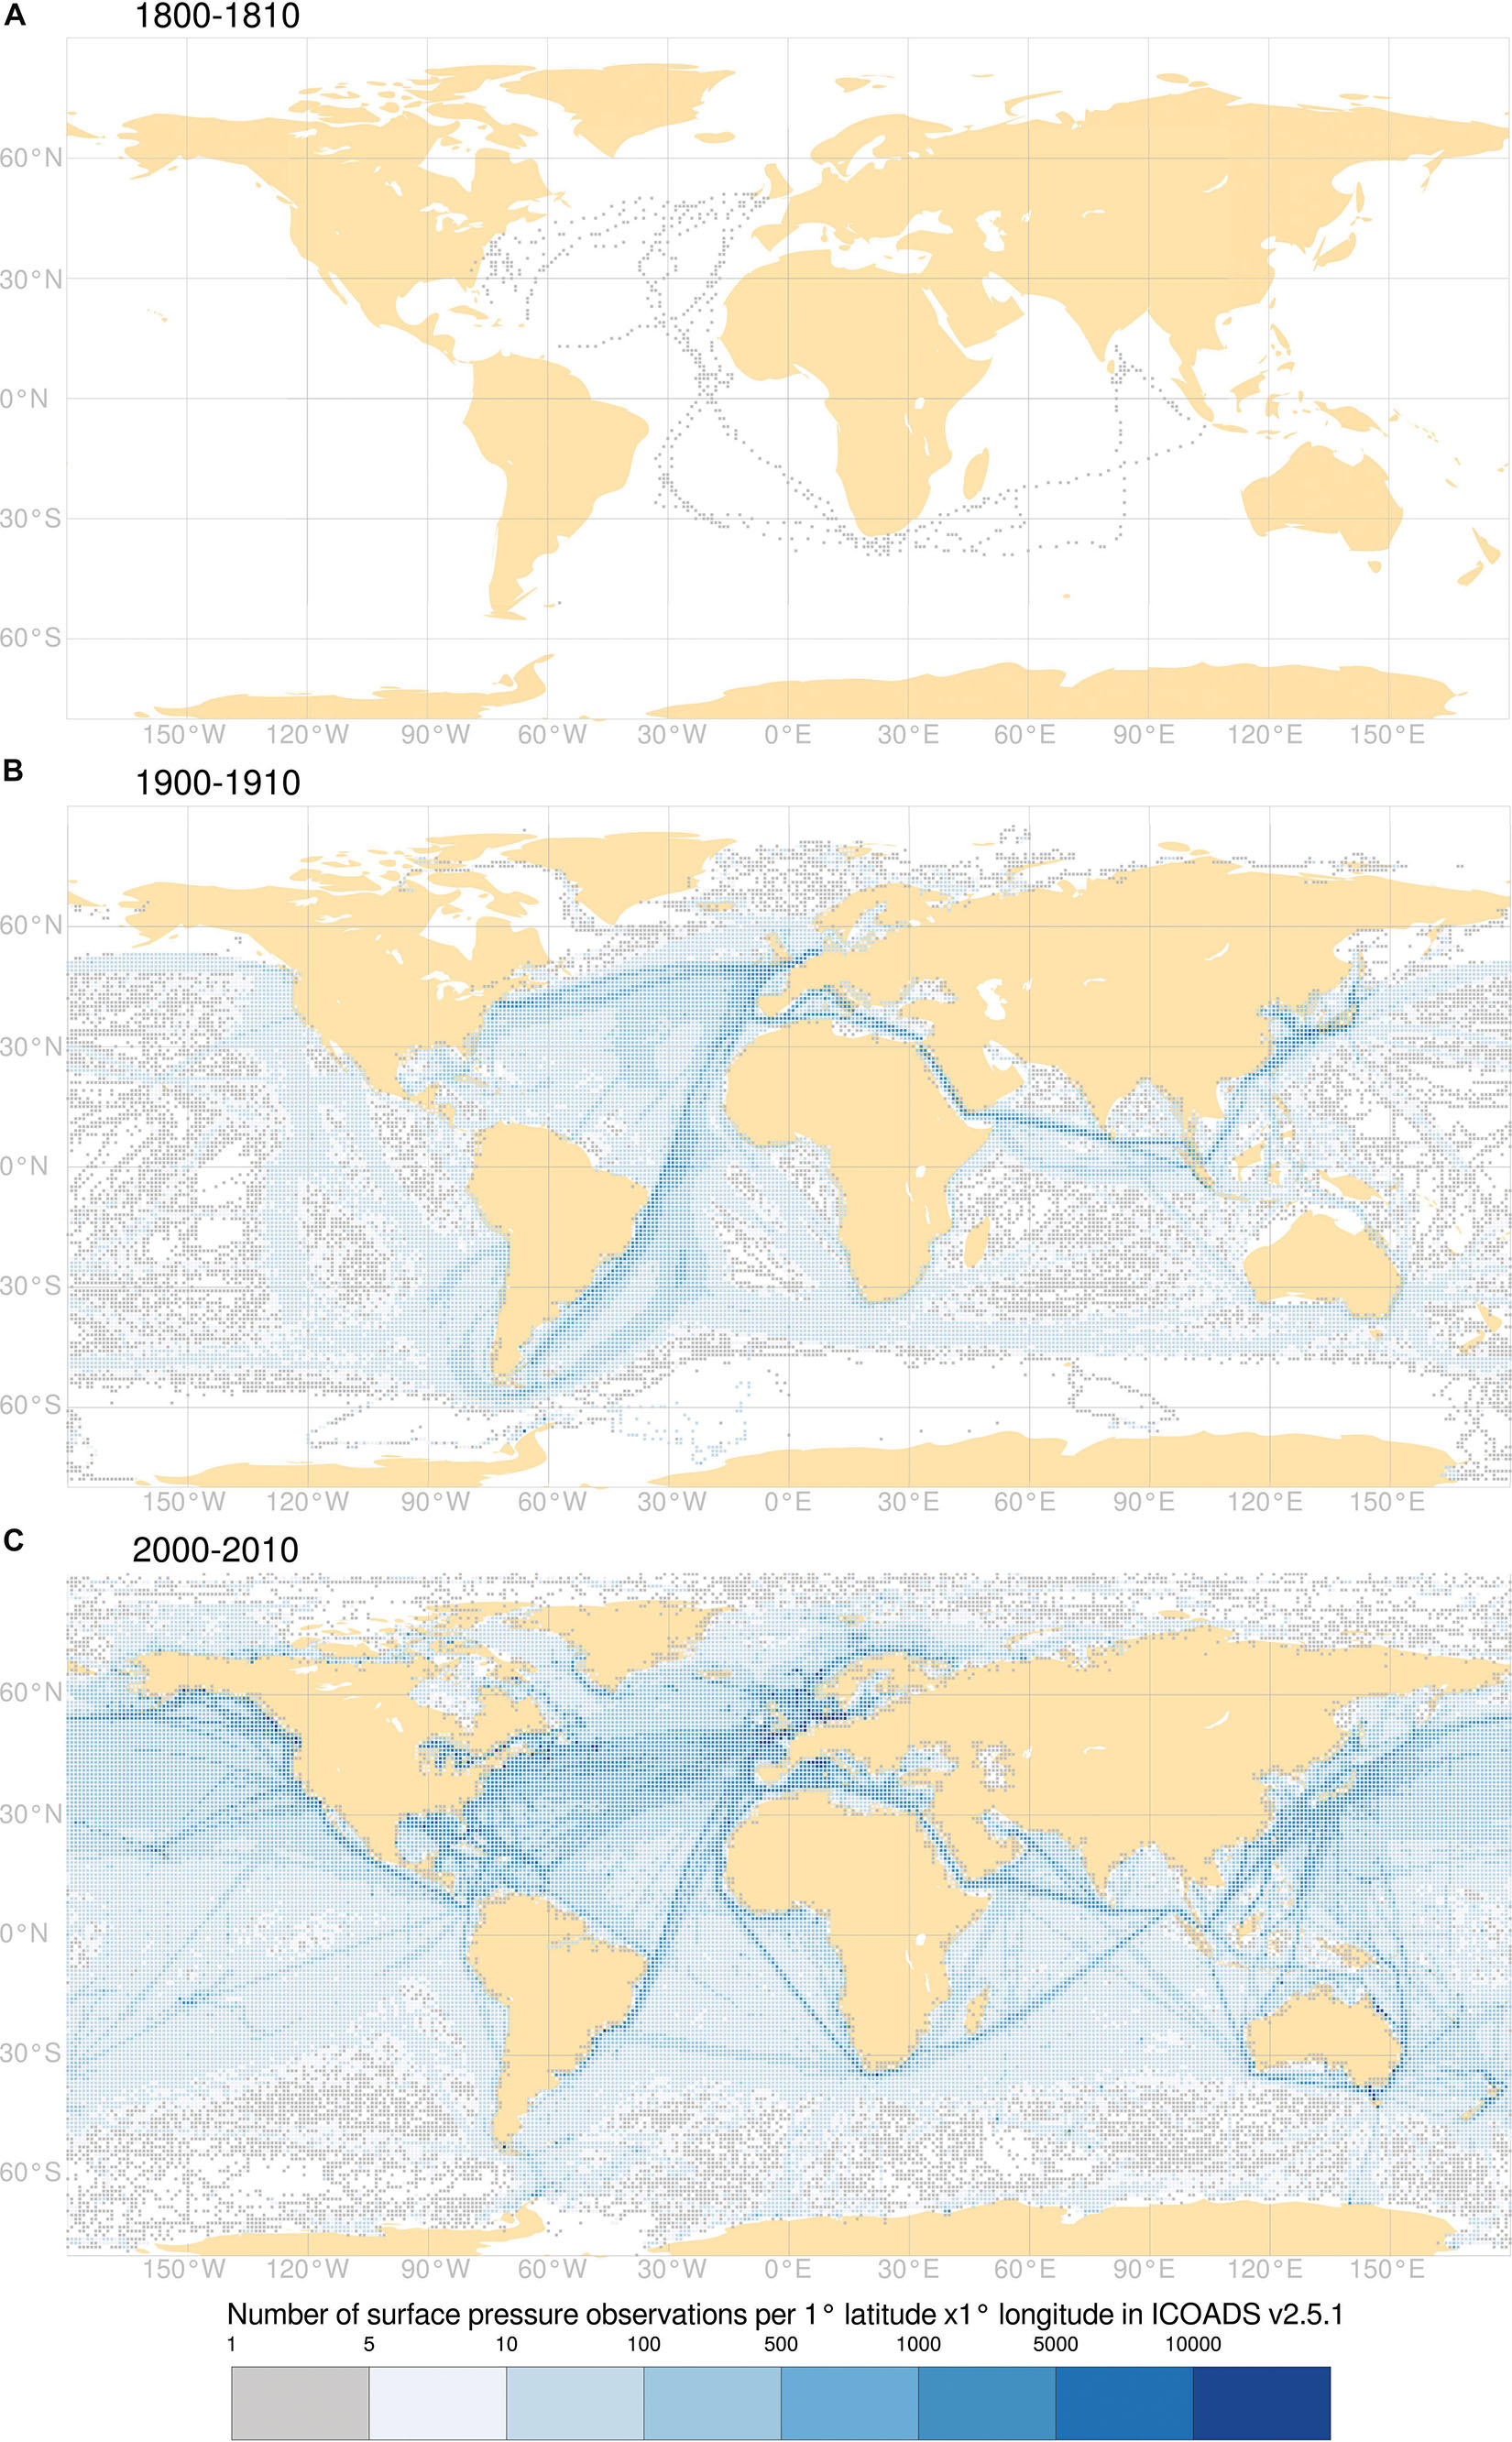
Three charts –
1800-1810;
1900-1910
2000-2010.
Looks like the number of observations in a 1degree by 1 degree rectangle, over a year. By eye, half the oceans have less than two observations a week [100/year] in an area of sometimes thousands of square miles.
And, since I started doing Met Observations in about 1973, the bucket was rubber [UK Voluntary Observing ships]; top half metre or so of the water – it didn’t sink much further at the service speed of, typically, 15 knots
Auto.
And how much of the oceans did not cover? Outside of the regular trade routes I imagine there was close to no data.
Phil Jones said they made it all up.
That how they cooled the 1880’s and 1930’s to make it appear that these periods were cooler than today, all the better to sell their human-caused climate change narrative.
The 1880’s, the 1930’s and today’s temperatures should all be on the same horizontal line on the graph if it reflected reality.
If they were, then it would be obvious there is no unprecedented warming today and would call into question whether CO2 is the temperature control knob or not. So to eliminate that train of thought, the temperature data mannipulators used their computers to create Hockey Stick science fiction that erased this view of the past, and portrays today as the hottest time in human history.
It’s a Big Lie.
“Phil Jones said they made it all up.”
Big call Tom. Do you have a quote for where Phil Jones said they “made it all up?”
Yeah, he actually said about the SH, “mostly made up”. But that doesn’t do anything for the accuracy. 😉
Again.. you haven’t been paying attention at all have you, simpleton.
Come on clown
Show us where all the sea temperature readings for the most of the Southern Hemisphere came from.
Tom… Tom is that you?
No need to take anyones word for it.
Argo floats weren’t deployed until around 20 years ago. Historic data until then are largely junk.
Why is it so hard for “climate scientists” to admit that the date they are dealing with is not fit for purpose? If one must “make up” biases decades after the fact in order to justify adjustments, the data IS NOT worthy of the name scientific.
*crickets*
You eat them instead of meat?
It was well known years ago before you reached diaper stage which is why you are getting a cold shoulder about Dr. Jones statements by a few here myself included read what he wrote.
If it was well known….. you should have no trouble providing a quote. So let’s see it.
Along the same old, restricted trade routes. (1750 – 1800)
Authentic frontier Pidgen.
Rarin’!
How does back radiation from CO2 heat the ocean, which is virtually opaque to the bandwidth being radiated? Thanks.
Upwelling heat from the oceans moves through the skin layer of the ocean via conduction, and it is the top of the skin layer where the heat can move to the atmosphere via radiation. The rate of this transfer via conduction is determined by the temperature gradient across the skin layer. IR radiation from the atmosphere does not penetrate much further than the skin layer, but increasing this IR lowers the gradient across the skin layer, reducing the rate of heat transfer from ocean to atmosphere. The skin layer is thus absorbing and emitting via radiation, and Increasing the downward flux is equivalent to reducing the upward flux.
One might as easily ask how a heat lamp keeps food warm on a buffet, when the food is largely opaque to the IR emitted by the lamp.
You have just invented a more efficient electric kettle with the heating element in the lid. You apply for the patent, I’ll alert the media.
No need for that. It’s already been invented. Just use your hairdryer to warm your coffee up in the cup and your bathwater from above. Funny that the manufacturers missed advertising this multipurpose device for these functions to increase sales. Boy are they stupid.
If you want your bathwater to stay warmer than room temperature, putting a heat lamp above it will help achieve this purpose. Is that something you disagree with? On what basis?
That’s fair but of course the heat lamp is additional energy to the system. If one put a heat exchanger in the bath to draw energy and generate electricity to run the heat lamp then the bath would cool more quickly or ignoring all inefficiencies, stay the same.
The heat lamp can only cause more evaporation. Fill a tub with hot water and see what happens to a mirror hung just above the tub. Where does that condensation come from?
There is more evaporation off the surface of a pot of boiling water than a pot of cool water, yet the pot of boiling water is still hotter. How is this possible?
You really don’t know? Read this link.
9.3.2: Boiling, Evaporation and Condensation – Chemistry LibreTexts
Simplified explanation. Boiling occurs throughout. All the water in a container has enough energy to vaporize. This is what creates bubbles.
Evaporation only occurs at the surface. Only the molecules at the surface are able to break the intermolecular H bonds and become gas.
This is something learned in high school chemistry. Yet you are intelligent enough to tell us we are wrong?
Jim, this doesn’t answer the question. My point is that it is the temperature of the water controlling the rate of evaporation. The evaporation increases because the water is warmer.
It does answer the question. IR is absorbed by surface H2O molecules which increases evaporation. None of the other molecules below the surface is affected.
Boiling water, AS YOU STATED, has had enough heat added to make all the water attempt to evaporate at the same time.
You should have read the lesson I referenced.
The end result is that evaporation will increase… because the water is warmer. The other molecules below the surface are indeed affected, because the water is warmer.
You obviously didn’t read what I posted earlier. Here it is again.
From Wikipedia;
From Brittanica;
End result, vaporization DOES NOT WARM the surface molecules. That energy is stored as latent heat and is used to break the H bonds between H2O molecules allowing them to become vapor.
Where do you think the latent heat stored in water vapor originates, maybe magically?
In the case of the earth there is a constant energy supply via the sun. The atmosphere is doing nothing more than returning some of the energy that would otherwise have been lost directly to space.
In the case of food on a buffet, you could try to minimise heat loss by putting a reflective surface above it but unless it reduces convection (eg aluminium foil directly covering the food), it won’t really help in a practical sense.
And guess what, that energy adds to the skin molecules’ energy and evaporation occurs even faster.
The heat lamp transfers heat to the bath, not the bath water.
All extra infrared does in increase evaporation.
And fantasy CO2 ” back-radiation” cannot change the net radiative flux, anyway.
Remain ignorant, your only endearing feature.
“All extra infrared does in increase evaporation.”
https://www.drroyspencer.com/2014/04/can-infrared-radiation-warm-a-water-body/
“I frequently see the assertion made that infrared (IR) radiation cannot warm a water body because IR only affects the skin (microns of water depth), whereas solar radiation is absorbed over water depths of meters to tens of meters.
Before discussing the issue, though, we first must agree that temperature and temperature change of a body is related to rates of energy gain and energy loss by that body. If we cannot agree on the basic concept that temperature changes when energy gain does not equal energy loss, then there is no basis for further discussion.
If the surface of a water body is emitting IR, then IR must be part of its energy budget, and therefore of its temperature. Evaporation only occurs at the skin, and we know that evaporation is the major component of heat loss by water bodies. How is it that evaporation can perform this function, and IR cannot?
The temperature of land clearly is affected by IR, and that only occurs at the surface of the soil. So, how can IR affect land temperature and not ocean temperature?
If you claim that any additional IR (say, due to increasing carbon dioxide) is immediately lost by the water body through evaporation, how exactly does that occur? The surface doesn’t know why it has the temperature it does, it will evaporate water based (partly) on surface temperature, and it does not distinguish where the heat comes from (solar radiation from above, mixing from below, IR from above, sensible heat flux across the air/water interface). To claim that any energy gain from IR is immediately lost by evaporation is just an assertion.”
https://www.drroyspencer.com/2015/06/can-infrared-radiation-warm-a-water-body-part-ii/
“(This is a follow-up to my post from a little over a year ago, but with some experimental results).
I sometimes see the claim (usually in comments on a blog post) that infrared radiation cannot warm a water body, because IR only affects the skin surface of the water, and any extra heating would be lost through evaporation.
I have tried to point out that evaporation, too, only occurs at the skin of a water surface, yet it is a major source of heat loss for water bodies. It may be that sunlight is more efficient, Joule for Joule, than infrared due to the depth of penetration effect (many meters rather than microns). But I would say it pretty clear that any heat source (or heat sink) like evaporation which only affects the skin is going to affect the entire water body as well, especially one that is continually being mixed by the wind.”
So: “Remain ignorant, your only endearing feature.”
It seems that Dr Spencer “remains ignorant”.
In this case Dr Spencer is ignorant. The top most layer of the water is actually colder than the water immediately beneath it.
DLR isn’t warming the water, its very definitely slowing the rate of cooling down and increasing evaporation.
If the topmost layer were to mix down, it’d be cooling the ocean which is warmer directly below it.
“DLR isn’t warming the water, its very definitely slowing the rate of cooling down and increasing evaporation.”
Indeed it is.
However the deltaT between the bulk warm water below the skin and the evaporating/radiating surface is reduced and as the 2nd LoT says heat flows from a warm to a cold body (net) and so the reduced temp gradient also reduces the heat flux and by so doing the ocean retains more heat.
As your diagram shows:
ON the left the skin temp is colder that the bulk below. (good 2nd LoT)
ON the right the skin temp is warmer than the surface layer below the skin (Poor 2nd LoT – even reversed)
The left is the night temperature profile and the right is the daytime temperature profile. Note the log scale.
The daytime “hook” is maintained by convection of warmer water coming from below from the SW radiation heating the ocean. Convection gets the warm water close but its conduction that gets the energy to the very surface.
The very surface is cooler because that’s where the net energy loss is occurring as a combination of radiation and evaporation.
You’re still missing the point.
The energy flux from ocean to atmosphere exits at the skin.
During the day SW warms surface waters such that the water below the upper most water is cooler than that of the skin.
Heat flows from hot to cold and it’s not going to do so if it is colder than the skin.
Yes, the skin is cooler than just below but it is warmer than the bulk below.
Does this make it any clearer?
I’m not sure what you think I’m missing but you appear to be adding an incorrect condition that the water needs to have a temperature gradient at the surface for it to cool (ie radiate energy)
But what point are you actually trying to make here?
Another important consideration…
If downwelling IR has no effect on the radiation budget then the implication is that sea water has an albedo of 1. It does not!
But you must also categorize how the energy is distributed. Water has a very high specific heat. That means it can absorb a lot of energy without raising its temperature. Don’t tie energy to temperature when discussing H2O. Think of the term LATENT HEAT. Energy stored without changing temperature. What that internal energy does is allows inter-molecular bonds to break and H2O to evaporate.
From:
JMSE_Article_23Sep2023.pdf
That isn’t true. Heat diffuses into soil regardless of whether it arrives as IR or SW. Soil temperature DOES increase at depth. It is done by conduction. The soil becomes a heat sink that can release energy at a later time, again, by diffusion from depth to surface.
Jim, you say:
Sorry, but this isn’t true in the slightest. If water absorbs even the slightest amount of energy, it raises the temperature.
All the high specific heat means is that water changes temperature less per unit of absorbed heat than many other materials.
w.
H2O has a unique property whereby molecules have a structure that allows its molecules to cling together by forming H bonds. That is why it “wets” glass or will continue to pull water for a period of time over the lip of a cup.
https://www.khanacademy.org/science/ap-biology/chemistry-of-life/structure-of-water-and-hydrogen-bonding/a/cohesion-and-adhesion-in-water.
Latent heat upsets the H bonding and allows water to evaporate. A side effect is that rotational motion of molecules is quenched and as with any liquid or solid, translational motion is minimal.
IR from CO2 only hastens the evaporation at the surface making the cooling occur more quickly.
From Wikipedia;
From Brittanica;
I reread this and I need to add this. I don’t mean to imply that water cannot have its temperature increased, it obviously can. SW can be absorbed and cause a loosening of the H bonds such that the volume increases. IR simply doesn’t travel past the skin and so can’t warm the lower levels.
Yes Dr Spencer did remain a bit “ignorant”.
If you read the whole report you will see that the temperature of the Aluminium sheet was 80 deg. F while the clear sky was only 7 Deg. F. But he does not say what the Air Temperature was above the baths during the test period. He only measured the air temp between the 2 baths.
So we do not know how much of the 80 Deg. from the plate was transferred to the air via conduction. The experiment should have had 2 gauges measuring the Air temps directly over the two baths.
We also do not know the heat loss profile for the Aluminium plate, was it the same as the Bath water or the same as the Air?
He uses a simple heat balance model on an Excel worksheet which uses DWIR of 431, where does this value come from?
Why is it fixed for 11 hours?
If the 360 DWIR from Goodwin Creek was used instead of the 431 the results are completely different.
The temperatures in the sheet do not match the temperatures in the Report with no explanation, 0.5 deg. drop versus 9.0 deg. drop in the report with different starting temperatures.
So as far as “controlled experiments” are concerned I am not impressed, although you obviously are.
That seems correct to me, Alan.
Rick, what makes you think differently?
Because CO2 can only warm the top of the skin layer. What happens when it gets warmer? It evaporates thereby cooling the skin layer. An increased gradient at the skin layer that will trap heat as postulated just doesn’t exist. Ask yourself where the water vapor that creates thunderstorms over the ocean originates. Can CO2 slow down evaporation by heating the skin layer?
The skin layer is not being warmed by CO2, it is just being cooled less. The flux of IR is always from the ocean to atmosphere, as it must be to balance incoming sunlight + downwelling IR. The sunlight is providing the energy that will eventually cause the ocean to warm.
What malarkey. The skin is cooled by evaporation, not by radiating IR. Evaporation is increased by absorbing incoming IR. Show your math that explains no warming, but less cooling.
The skin layer is cooled by both – the ocean emits IR, that is how satellites measure the skin temperature. But the point is that no matter how the energy is leaving, it is being somewhat offset by downwelling IR, and increasing this downwelling IR necessarily increases the offset, and this necessarily reduces the convective gradient beneath.
“The skin layer is not being warmed by CO2, it is just being cooled less”
RUBBISH !!
A .25 degree warmup……the thermometers aren’t that accurate. First rule of graphing in Stat 101 is the X axis should always be zero. If you scaled the Y axis properly you would have a straight line.
Not in a Log graph.
The warming lamps I have seen at buffets are emitting most of their energy in the visible.
Very good AlanJ
Don’t forget the effect of evaporation. The skin layer is where evaporation is taking place and the most energetic molecules can leave the ocean. Increasing the downward flux adds energy to those molecules.
So yes that’s how the ocean can heat in principle but in practice there are other factors to account for.
Yes, TTTMan. There are many factors involved.
Simply put, given its high variance, short term sea surface temperature is probably largely a result of internal dynamics (El Nino, other ocean currents, etc). It is not a particularly useful climate metric.
Poor AJ, stuck with heating his hot water with a ray lamp from above.
Cold showers all its life, and it has frozen its brain.
There is no evidence that CO2causes any warming of anything.
You are talking gibberish fantasies .. yet again.
Alan, urgent;
read up on ‘latent heat’ before you make a pratt of yourself … Oh, too late, you just did !!
The radiation from CO2 cannot heat the ocean period. The energy is coming from within 10 meters. When an IR photon from the lower atmosphere strikes the surface. The lower atmosphere is cooled and the surface is warmed. This disturbs equilibrium and would require violating the 2nd Law for it to remain. As a result the ocean conducts slightly more energy back into the atmosphere and equilibrium is restored.
Keep in mind that temporary warming may in fact cause evaporation to occur. This removes energy from both the ocean and the lower atmosphere cooling both of them.
There is no evidence that fantasy CO2 “radiation” can change the temperature gradient…
… or the net radiative flux, which is controlled by the temperature gradient.
“There is no evidence that fantasy CO2 “radiation” can change the temperature gradient…”
There is (of course) ….
https://agupubs.onlinelibrary.wiley.com/doi/10.1002/2017JC013351
Try rereading my comment and pay attention this time. Your paper measures radiation from clouds and even admits they have been unable to measure any change from GHGs.
Different physics is involved. No longer is the radiation coming from extremely low in the atmosphere. Hence, there’s no change in the temperature of the low atmosphere and conduction is not driven to the same level.
This factor is driven by saturation.
The GHE effect is due GHGs and that includes water vapour/water (clouds).
It’s irrelevant where the DWIR comes from – it causes the surface layer of the ocean to have a lower DeltaT through which the bulk water heat flux can get to the skin and hence radiate/convect.
Have you ever heard of latent heat? Exactly how does latent heat of H2O create a ΔT?
Actually, IR is NOT heat. It is an electromagnetic wave. Up welling IR is surface heat converted to EM wave. Down welling IR is heat in gaseous atmosphere converted to EM wave.
At the surface, a percentage of down welling IR is absorbed according to surface albedo for IR which is demonstrably less than one. Therefore, there is a net electromagnetic flux at the surface which is less than it would be in the absence of down welling IR.
The down welling IR is not heating anything. It is simply changing the surface EM Wave budget, reducing the outgoing energy.
To deny this is to infer a surface albedo of 1 which would require us to see an up welling IR greater than the amount that would be predicted by surface temp and this would indeed be a violation of second law.
You are describing a decaying function.
If x is the initial heat received and it is all re-radiated then then only Bx will be returned from the atmosphere. If only BCx is then re-absorbed then only BCx can be re-radiated by the surface. Of that BCx amount only BCBx will be returned. And only BCBCx will be re-absorbed.
If B and C are less than one you have a decaying function.
The emission of a photon from a CO2 molecule doesn’t reduce the temperature of the molecule and therefore doesn’t cool the atmosphere. It does warm the water via the mechanism of adding to the translational energy of the water molecules, some of those molecules will acquire enough energy to escape into the atmosphere others will transfer that energy deeper into the water.
Where do you think latent heat originates? Translational energy and latent heat energy are TWO DIFFERENT THINGS. In your scenario, the translational energy would need to be transformed into latent heat by magic. That just doesn’t happen.
I’ll repost these descriptions. Notice the phrases “latent heat” and “heat of vaporization”.
From Wikipedia;
From Brittanica;
Latent heat has nothing to do with what I posted.
A water molecule changing phase from liquid to vapor does not involve latent heat?
“Latent heat (also known as latent energy or heat of transformation)”
Sure looks like latent heat is involved in the phase transformation.
No a single molecule that is traveling fast enough can travel from the liquid phase to vapor.
https://www.verticallearning.org/curriculum/science/gr7/student/unit01/images/boltzmann1.svg
All I get here is a graph of something but I don’t know what.
A molecule can leave the surface if the water below the skin is warm enough to generate the heat required to make a molecule break the H bonds holding molecules together from transitional speed only.
Here is what the section you drew the graph from says about increased temperature.
Evaporation will be faster. Guess what that causes at the skin layer. Faster cooling maybe? That doesn’t seem like it would block heat from below leaving the surface.
The point is that excitation by a CO2 emitted photon can increase the kinetic energy of a water molecule sufficiently to cause it to leave the surface of the liquid and enter the gas phase. Otherwise the extra kinetic energy can be transported to deeper in the water.
“ Otherwise the extra kinetic energy can be transported to deeper in the water.”
Thus raising the average kinetic energy of the deeper water which will result in higher average kinetic energy at the surface.
You are postulating that the ocean is a perfect sink, always absorbing heat but never releasing it.
The caption for the graph wasn’t included, it’s the probability of a H2O molecule’s velocity in water at 20ºC.
Most of the heat transfer is done by convection or by water vapor (latent heat).
AlanJ goes the PHANTASY FIZZUCS route.
Very funny !! 🙂
The effect of clouds on daily air temperature is irrelevant in the greater scheme of things.
Air temperature may vary from negative night time temperatures to temperatures in excess of 50c at midday.
Day to day air temperatures are fleeting, ephemeral, evanescent, transient, momentary, extremely brief…..
Average air temperatures are moderated world wide by ocean temperatures and heat is stored/buffered in oceans.
Ocean heat is circulated/distributed from lower to higher latitudes by ocean currents.
The only MEANINGFUL consideration with regard to average long term global atmospheric temperature is the rise or fall of ocean temperature.
Ocean temperature rise or fall is dependent on SHORTWAVE solar energy.
Longwave energy is a trivial factor.
Clouds shade the ocean to a lesser or greater degree and thereby moderate SHORTWAVE solar energy penetration of the ocean.
Clouds are therefore the most relevant factor to be considered in the climate debate!
https://oceanservice.noaa.gov/facts/light_travel.html
Shortwave energy penetration:
Sunlight may be detected as far as 1,000 meters down in the ocean, but there is rarely any significant light beyond 200 meters.
Cloud cover will affect the depth of penetration and therefore the energy transfer.
Two causes of the sea surface warming have just recently been discovered.
The reduction in smog, especially over China which drifted over the Pacific and blocked sunlight cooling the Pacific, and the reduction in sulfur emissions from ocean-going vessels which before seeded clouds that blocked the sun rays from warming the oceans.
With those two cooling mechanisms removed the ocean is warming.
https://e360.yale.edu/features/aerosols-warming-climate-change#
https://www.livescience.com/planet-earth/climate-change/cutting-pollution-from-the-shipping-industry-accidentally-increased-global-warming-study-suggests
“With those two cooling mechanisms removed the ocean is warming.”
Not all the oceans are warming. Some are cooling.
Bob Tisdale showed very clearly what was causing the ocean warming.
AlanJ, over all geological time, at any given point the earth has been either warming or cooling.
At present, it’s been generally warming in fits and starts since the end of the Little Ice Age around 1700 … and the first half of that warming can’t be from CO2.
So I’m not sure what your point is here. How about you get back to us when someone figures out why, instead of continuing to cool after 1700AD, or even just staying cold, it started warming? Or why temperatures rose until they peaked around 1000 AD and then started falling?
Thanks,
w.
A little perspective … The earth warmed by 1 °C since 1700. If the air surrounding a person warmed by 1 °C over a few minutes, they would not probably not even notice it. Nobody would notice 1 °C of warming over 325 years, it because nobody lives that long.
Your plot seems to be missing a few years of observational data:
it is pretty clear at a glance that what is happening today is unlike what had been happening in the two millennia prior.
But my point would stand either way: the graph you present highlights how unusual this year has been against the historic instrumental record. There is a pronounced and apparently accelerating warming trend underlying the up and down oscillations of climate variability.
UHI.
Is this instrumental records grafted onto proxies?
Is it exactly the same thing Willis posted above? Yes, yes it is.
Neither of you should have done it. If the proxy doesn’t show the current increase itself then adding thermometer data only serves to construct an advocates narrative, not show what happened.
Although to be fair to Willis he’s quoted Ljunqvist who did it. And his overlay isn’t temperature but CO2 levels.
Doing so is completely unobjectionable. The Ljungqvist reconstruction ends in 1999, so it is necessary to add the last quarter century of temperature change in order to compare the modern change to the reconstruction.
But not mal-adjusted urban temperatures.
It then become low-level farce. !
I don’t think UHI is the issue. The issues will be such things as geographical location, resolution. All the many ways in which proxies are different from instruments and arguably measuring different things.
Since 1999 there have been two very solid El Nino events that are responsible for all the atmospheric warming
No evidence of any human causation.. as you have shown multiple times.
Unobjectionable by who’s standards?
If you want to show a reconstruction with more modern temperatures, find one that includes more modern samples.
Once you go backwards before accurate temperature measurements you have no idea what the real absolute temperature was. The “temperatures” being tossed around here are not real temperatures, they are ΔT’s, i.e., rates of change.
Can anyone on here tell me the absolute temperature of the globe or the global SST in 1850 as compared to today with any accuracy at all.
The actual ΔT’s could be occurring at vastly different absolute temperatures and may be meaningless when comparing the effects on the earth.
I think this must be right, partly because of resolution differences.
Well. One, I don’t see, from Willis’ chart, anything very remarkable happening. Nothing to justify the statement that ‘what is happening today is unlike what had been happening in the two millennia prior’.
But, second, I don’t believe that you can compare a proxy temperature from the year 1000 with an instrument global temp from the year 2000. Give a total proxy record, and then at least you have the same thing measured in the same way for big sections of the period.
How about just extending the Lundquist series with proxies, and compare like with like right up to 2024?
Yes, I do know this is a loaded question.
The proxies used by Ljungqvist likely don’t extend past 1999 – they end when they were collected. And the study was published in 2010, so in the very best case it cannot possibly include the past 15 years of data. If you want to construct an entirely new reconstruction, using only proxies that extend to the present day, you’ll have to go do the research and identify proxies in paleo data archives that meet that requirement, and then figure out your methodology.
The proxies are calibrated against the instrumental record, though, so there is no reason whatsoever not to plot the insrumental record alongside them. You’re comparing temperature estimate against temperature estimate. People on this forum keep objecting to the idea, but nobody can articulate a specific reason as to why. And it’s interesting, isn’t it, that Willis was the person who originally posted the comparison, but all the fervent objections are directed only toward me. Why could that be?
The proxies typically have lower resolution, are calibrated against the anomaly not the absolute and suffer from selection bias.
There’s 3 good reasons.
Exactly. And there is Briffa’s divergence, familiar from Climategate.
But its a question of how much of a bet is justified. You have to believe that a proxy estimate of global temps in the year 1000 or 1100 or whenever is the same as an instrument record average for those years, if it had been available. How sure are you?
Sure enough to spend trillions and upend the economies and society of the whole planet? Or at least, to try to do that, though it won’t happen in practice – we know that in practice the only ones whose societies will be at all changed will be the West.
Don’t think so.
Ljungqvist does not use Briffa’s series in his reconstruction, and the divergence occurs at 1960 or so anyway, not 1999, so that is not the reason why the reconstruction ends in 1999.
Proxy reconstructions are not the sole basis for proposed actions against climate change, so this framing is utterly disingenuous. The reconstructions are robust, in generally good agreement (particularly for the past two millennia) and based on the best evidence available. The alternative to trusting reconstructions is to pretend to know nothing about past climate states at all.
The proxies here have a minimum resolution of ten years, and the instrumental data I plotted is a ten year average, so they have the same resolution. Calibrating against the anomaly is the correct thing to do – the reconstructed temperatures are presented as anomalies. Your last point is just a bald assertion made without evidence, and needs no rebuttal.
Don’t believe it. That is, don’t believe that the average of daily readings over ten years necessarily produces the same score as a proxy with a ten year resolution for the particular period in question.
Need some proper proof that this is a reliable method. Anyone done a study? Shown in what circumstances they coincide and in which they diverge?
The proxies were calibrated against the decadally average instrumental data, so it should be expected that they are scaled consistently. This is clear from the agreement between reconstruction and instrumental data in the graphs posted by Willis and myself. There is a lot of literature on this topic, the first to use this “composite plus scaling” method were Bradley and Jones in 1993:
https://www.geo.umass.edu/faculty/bradley/bradley1993b.pdf
Again, all you know is that the ΔT’s scale, you don’t know at what absolute temperature they occurred at. It is like saying that at the end of the last glaciation the ΔT’s were the same as now. So what? the absolute temperatures were vastly different. One would hope a +1 at the end of the glaciation would occur. It wouldn’t be a bad thing.
The anomalies are computed against a common baseline, if the anomaly for a given time is the same as for another time, then the absolute temperature for those times would be the same. Both have the same deviation from the baseline.
You need to find a study that says if anomalies are the same then the baselines are the same.
That doesn’t even work for monthly averages. You are trying to convince people that +1 in Antarctica has the same absolute temperature as a +1 in Tampa, Florida! Give me a break!
I am referring to global or hemispheric means, as in Ljungqvist.
The anomaly isn’t the temperature local to the proxy, it’s typically a temperature from far away.
Theres another reason.
Definitively selecting data that calibrates against the modern warming is impossible to do anyway. There is simply no way to know whether the correlation is by chance or because temperature was the primary signal. And no way to know whether temperature was always a signal or not either.
But it’s all we have so it’s what we do.
+10
In this case, the temperature is North American temperature data from HadCRUT, and the reconstruction being calibrated is a North American reconstruction. How else would you propose the calibration be done?
The individual proxies being used have already been determined to be temperature sensitive, the calibration places the entire reconstruction onto the same temperature scale as the instrumental data.
O Rly? And how did they do that?
Let me head you off at the pass to save time, choosing trees at the tree line doesn’t ensure they’re temperature sensitive above say nutrients or water for any year(s). There’s just no way to know.
All proxies have their pros and cons and none of them are thermometers and there’s simply no way to know. The best that can be done is getting enough of them and hoping you can extract a signal.
But inevitably they’re subject to selection bias against modern temperatures because what else can you choose to corelate with? And its wrong to do it but its all we have.
You can’t calibrate ΔT’s against themselves. ΔT’s are determined by using both an absolute temperature and a baseline absolute temperature. You have no idea if those are comparable at all when using proxies. All you know is that the ΔT’s MAY be in the same range. Not scientific, just a wild ass guess.
Proxy’s tend to be multi year averages and often much longer.
From WE’s first ocean temperature graph a decadal average would have much lower highs absorbing the spikes.
That was really what WE was saying, the run up we have seen in recent years temps is likely to become a spike.
So business as usual.
But, second, I don’t believe that you can compare a proxy temperature from the year 1000 with an instrument global temp from the year 2000. Give a total proxy record, and then at least you have the same thing measured in the same way for big sections of the period.
No you don’t have the same thing being measured. ΔT’s are calculated by using a baseline absolute temperature over a constant period of time. When looking at a tree ring or whatever proxy, I may estimate the change in temperature, i.e., ΔT that it represents, but I have no idea what the absolute baseline temperature was.
I’ll say it again, +0.5 @ur momisugly 14C is different that +0.5 @ur momisugly 15C. You are not examining apples to apples.
That would be impressive if that really were observational data. It’s not.
These are anomalies.
Is a 1C anomaly at 0C the same as a 1C anomaly at 20C?
Or are the impacts of each different?
While I read these climate blogs in fits and starts and I’ve been told that the theory that Svensmark’s cosmic ray/cloud theory has been discredited as the cause of the movement of global temperatures over not just 150 years but much longer cycles, I still haven’t seen many other theories that can even approach the intuitive explanations of Svensmark.
That increasing or decreasing global cloud cover percentages due to the nucleation effect from cosmic ray intensity, an intensity moderated by the size and strength of the heliosphere as the solar activity moves through both its short and long-term cycles (11-year sunspot cycle plus its longer solar minimums and maximums).
I get this isn’t the place for this discussion but, for my money, while there is a lot of focus on the last 160 years and CO2 emissions and modeling those years, the thinking around the longer temperature cycles seems to be the place that needs the most attention from the best minds.
Alan, please stop using fossil fuels every day, have you not heard about the climate crisis? Get solar panels on your roof to stave off the rising tides, don’t be a hypocrite like all the other climate faithful, and walk the walk, and stop driving and flying and heating, and turn off that computer too. thx!
and don’t eat meat!
He can’t do that.
Everything in his meaningless and pitiful existence is absolutely dependant on fossil fuels.
He could not possibly exist without them.
Just like everyone else…
Lose the clothes and meds and pre-packaged food. If you did not walk or bike to the farm to pull the food from the ground, shame on you.
Also, make sure the farmer does not use fertilizer.
And stop posting. Electronics and electricity all use carbon-based materials.
“compared against the historical record”
That made me laugh.
How can we accurately measure any global temperature to a 0.1 C resolution?
You can’t. Climate science even directly averages hot/cold southern hemisphere temps with cold/hot northern hemisphere, when each has different variances in the data. How do you average data sets with different variances directly?
Better yet is a 1C anomaly at a 20C temp different in impact than a 1C anomaly at 0C? Climate science does no weighting to account for the differences in impact. Why don’t they?
Temperature is *NOT* a good proxy for climate. Las Vegas and Miami can have the same temps with vastly different climates. How does climate science account for the different climates in their global average?
The historical record is a blip from the end of the coolest period of the last 10,000 years by all credible accounts. No one can say why or what it means and calling it “unprecedented” is an appeal to ignorance. Why is it that the current fashion is to make everything sound ominous?
Grant money!
It’s OK to go mow your lawn with a gas powered mower !
Where can I buy a wind-powered mower?
Eat beans & use a hose to the carb of a gas-powered mower !!
‘Pollution Paradox: How Cleaning Up Smog Drives Ocean Warming’
“New research indicates that the decline in smog particles from China’s air cleanups caused the recent extreme heat waves in the Pacific.”
“The idea that cleaning up air pollution can worsen atmospheric warming sounds counterintuitive. But small particles suspended in the atmosphere, collectively known as aerosols, are very different from greenhouse gases. Instead of warming the planet by trapping solar radiation, they shade it by scattering incoming sunlight and sometimes creating clouds.”
https://e360.yale.edu/features/aerosols-warming-climate-change
There was a post at this site yesterday about how reducing sulfur emissions from ocean shipping vessels has warmed the oceans. It seems that the sulfur emissions helped clouds to form blocking sunlight and removing has let more sunlight through to the oceans, warming them
https://wattsupwiththat.com/2024/06/04/almost-all-recent-global-warming-caused-by-green-air-policies-shock-revelation-from-nasa/
‘Cutting pollution from the shipping industry accidentally increased global warming, study suggests’
“A reduction in sulfur dioxide emissions may have caused “80% of the measured increase in planetary heat uptake since 2020.”
https://www.livescience.com/planet-earth/climate-change/cutting-pollution-from-the-shipping-industry-accidentally-increased-global-warming-study-suggests
Oops …and removing them…
Yes! Most of the rising temperatures are due to increased insolation and not CO2. Several here try to equate this to “shielding and/or preventing” heat from CO2. Increased insolation would warm the earth even if CO2 concentration was falling. Attempts to tie the warming to only CO2 are a joke.
“In 2020, fuel regulations abruptly reduced the emission of sulfur dioxide from international shipping by about 80% and created an inadvertent geoengineering termination shock with global impact. Here we estimate the regulation leads to a radiative forcing of +0.2±0.11
Wm−2 averaged over the global ocean. The amount of radiative forcing could lead to a doubling (or more) of the warming rate in the 2020 s compared with the rate since 1980 with strong spatiotemporal heterogeneity. The warming effect is consistent with the recent observed strong warming in 2023 and expected to make the 2020 s anomalously warm. The forcing is equivalent in magnitude to 80% of the measured increase in planetary heat uptake since 2020. The radiative forcing also has strong hemispheric contrast, which has important implications for precipitation pattern changes.” Yuan, T., Song, H., Oreopoulos, L. et al. Abrupt reduction in shipping emission as an inadvertent geoengineering termination shock produces substantial radiative warming. Commun Earth Environ 5, 281 (2024). https://doi.org/10.1038/s43247-024-01442-3
Abrupt reduction in shipping emission as an inadvertent geoengineering termination shock produces substantial radiative warming | Communications Earth & Environment (nature.com)
Turns out that a volcano sitting in close proximity to the stratosphere more than likely blasted an effective amount of water vapor into the stratosphere on and before 1875, which is very similar to the current situation.
And the source of elevated Stratospheric Water Vapor in the 1930’s and 40’s is a no brainer.
(PDF) The Askja volcano eruption in 1875 – where did all the water come from? (Invited) (researchgate.net)
The first large temperature rise in Figure 1 starts in 1874. It’s very unlikely that the Askja eruption could travel 11 years back in time to cause the rise …
w.
The eruption began in 1874, the 11 year number does not compute?
Ah. My bad. I misread the number.
Thanks.
w.
And as far as the start of the rise, there is nothing to indicate that it was nothing but a normal change in ENSO state amplified by something else, but I see no sharp rise at 1874, just natural variability, the sharp rise occurs a couple of years after the eruption, just as it should. It exists throughout the temperature records of that time.
“Turns out that a volcano sitting in close proximity to the stratosphere more than likely blasted an effective amount of water vapor”
Askja is on land, max altitude 1514 m, nowhere near the stratosphere. A land volcano has no access to the amounts of water required.
The Stratosphere starts just 7km up at that point of the globe.
The paper referenced clearly indicates that the eruption transitioned to wet and dry multiple times. And this was observed by scientists of the time (1875) so if they were able to determine this with the limited capabilities and knowledge of the time it must have been substantial.
Do you have a reference for “A land volcano has no access to the amounts of water required”
If not, my working theory still stands, at least from my understanding of scientific principles.
HT water vapor had no noticeable effect on global temperatures until it made into the Northern Hemisphere one year later. There is also growing evidence that there is currently more H2O in the stratosphere than can be justified by the eruption implying that a water vapor feedback has occurred.
Water Vapor does not rain out of the Stratosphere its only way out is the top in which it eventually gets split apart by extreme UV or catalyzed with other molecules in a variety of chemical processes as it breaches the ozone layer.
Thanks for that link to the 1874 eruption.
Can you elaborate on this?: “And the source of elevated Stratospheric Water Vapor in the 1930’s and 40’s is a no brainer.”
Billions of gallons of aviation fuel burnt at the top of troposphere in the Northern Hemisphere during WWII. For every gallon of gasoline combusted a gallon of water vapor is produced.
but not the stratosphere.
If you are flying well above the clouds, you are at the boundary.
Essentially, every year global air travel puts at least 50% of the water vapor in the Stratosphere that the HT eruption did. If humanity stops dumping 50 – 80 billion gallons of water into the stratosphere each year, the world will cool considerably.
“For every gallon of gasoline combusted a gallon of water vapor is produced.”
For every mole of octane burned 9moles of water are produced, where do you get this idea from?
“The burning of gasoline generates water vapor as well as carbon dioxide. The chemical reaction formula for burning octane is:
2C8H18 + 25O2 → 16CO2 + 18H2O
So for every molecule of carbon dioxide produced by burning gasoline there is about one molecule of water produced. It is the number of molecules produced which is relevant for the greenhouse effect, not the weight.
A gallon of gasoline weighs 6.073 pounds or 2,754.7 grams. One mole of octane is equal to 114 grams so one gallon of gasoline is equal to 24.164 moles of octane. From the chemical equation for the burning of octane we know that 2 moles of octane produces 18 moles of water and 16 moles of carbon dioxide.
Therefore one gallon of gasoline produces about 217.5 moles of water. Each mole of water has a weight of 18 grams. So the burning of one gallon of gasoline produces 3,914.6 grams of water. This is equal to 8.6 pounds of water, which has a volume of 1.033 gallons.”
w.
Do you ever wonder if some of these folks ever took high school chemistry let alone college?
Thanks for showing the calculation Willis, I’d never seen that statement before, always worked in Kg, moles and m^3. Strange concept by the poster of a “gallon of water vapor”.
Well done😁Thank you.
“ “moving into a period of revolutionary social disruption”, but it’s not because of one very misleading dot on a graph of global sea surface temperature”
The dot is evidence that a group of people wants to accomplish just that result by lying and and agitating. It’s not an effect, it is evidence of a cause.
Why do people get excited by FAKE data?
It’s a warm El Niño period, so what? The only sad thing about that is that it is going to end ..
Warm pulses to the AMO typically peak in August. They can occur directly through negative North Atlantic Oscillation conditions, as in summer 2023, or following an El Nino episode, through lagged negative NAO, being a feedback from the El Nino. 1878 was the latter. The effect of El Nino episodes driving 8 month lagged major warm pulses to the AMO operates during a warm AMO phase only.
Tony Heller has done some good articles on 1878 droughts and famines, I bet fishermen and coastal communities noticed the warmer North Atlantic too,
What a shocker. It’s almost as if they were raising the alarm to attract more funding for an activist organization like Extinction Rebellion or somefink.
Among the many doomsday scenarios there is the collapse of the AMOC and subsequent significant cooling. But a recent study says not to worry.
. “But this is a piece of good climate news that hopefully will dissuade people from climate doomism, and give people hope, because we do need hope to fight the climate crisis.”.
Doomism???
“Deaths in climate-related disasters declined 99% from a century agoBjorn Lomborg”
What crisis?
Has anyone an idea about newer AMO data than these here:
https://psl.noaa.gov/data/timeseries/AMO/
ending in Jan 2023
Thanks in advance
Where are the published studies that Anthropogenic released atmospheric CO2 warms seawater again?
I’ve looked and looked and I just cant find them anywhere. But it must be somewhere because all climate alarmists continue to maintain that it is a real, measurable and observable phenomena.
“Where are the published studies that Anthropogenic released atmospheric CO2 warms seawater again?
I’ve looked and looked and I just cant find them anywhere.”
Actually an easy Google search.
“Experiment on ocean skin temperature to IR” brings it up as the top return.
Here:
https://agupubs.onlinelibrary.wiley.com/doi/10.1002/2017JC013351
A serious data quality warning about ersst. Until ARGO, most readings were either a bucket over the side (old school), or (new school) engine cooling water intake, which by definition isn’t at the surface—the underwater intake depth depends on ship and lading. In both old and new schools, the readings were highly trade route dependent, meaning no data at all for much of the ocean surface.
Just because ersst comes from psl.noaa.gov does NOT mean it is trustworthy.
I think I was typing my comment below as you were typing yours. 😎
The ARGO data is the best we have now.
Before ARGO we had buckets lowered into the water and a thermometer stuck in the bucket.
Or measurement of what went into the engine cooling system on ships.
The “official” ocean temperatures have been … adjusted … to give more credence to the bucket system, much like surface station temps have given more credence to poorly sited stations.
For both ocean and surface temps, we don’t actually know enough about what was to declare what has “changed”. (Let alone the cause of any change.)
Did Man cause a “change”? Or is it just Ma’ Nature going through yet another change?
‘Great minds’ thinking alike.
Would love to see where they accurately measure sea surface temperatures in the period 1850-1920 😉
Next, they’ve thrown away about 90% of the data by averaging it into years. Why not use monthly data, since we have it?
and ceemd throws away 100%.
pleas if your going to plot smooths dont throw away the dots.
Mosh, not clear what you mean by “don’t throw away the dots”. The CEEMD smooth has one smoothed point for each data point in the original. So it has the same N as the original. What’s “thrown away”?
Best to you, hope you’re doing well,
w.
Another incoherent load of gibberish from a failed Eng-lit wannabe.
Was your main language “gibberish”?
I don’t know who Roger Coppock is, but there are three major errors:
The big one, averaging absolute temperatures, not anomaliesNo area weightingAs Willis says, comparing Jan-May for 2024 with annual elsewhereThe lack of area weighting inflates the effect of high latitudes, and explains why his figures are about 2C less than Willis. And Jan-May is mostly summer in the SH, and biased high relative to annual.
Here is a proper plot using anomalies, and with area weighting. It’s still only 4 months (I don’t have May) for 2024, but puts things in proportion.
Lies, Damn Lies, and Hockey Stick charts.
Show us where global sea temperature were accurately measured before even 2005.
Ask Willis. I’m emulating his plot.
It’s Coppock’s plot.
bnice and other folks questioning my use of this dataset, you don’t get it.
I’m discussing Coppock’s graph, and to do so, I have no choice but to use the data he used. I made no investigation or analysis of the dataset. It’s what he used, and to show how he misused it, I needed to use it myself.
Regards to all,
w.
Willis,
How telling it is of ignorance of science procedures that you have to write to folks questioning.
If you are like me, I find it increasingly frustrating to write scientific comment because so few commenters have shown that they understand the thrust of what I write. If I wrote of divs, grads and curls in math, I could understand. Most of what I write should be acceptable to a lower level of education than those math, but I know not where the lower level is.
.
Please to not let my words reduce your effort. You have skills that I lack and so I learn from you, hoping that many others also will. Geoff S
Let me double down on what you say. Like you, Willis has done things in this old world and with that comes some ideas of the complexity of the physical world.
He should keep up educating some of these computer modleing jocks that wouldn’t know a feeler guage from an anvil.
I’ll echo this sentiment!
Here is the largest problem with what you have displayed. Let’s look at that ~ +0.75C ΔT. Could it have occurred at an absolute temperature of say, 13C? Now look at the lowest ~ -0.45C. Could that have occurred at 17C?
Without knowing the absolute temperature, there is simply no way to compare these ΔT’s in a proper fashion.
That isn’t science, it is propaganda.
Well.. are you certain that you got 2023 right?
At least by eye about half of that year´s temperature was pretty high.. makes no sense to me that the 2023 average or median or whatever you do ends up particularly low.
Also.. anyone willing to speculate about the reason for this potentially alarming jumping increase?
It couldn’t be related to the Tonga eruption as any serious alarmist tells the world that this event didn’t produce any significant warming . . and it would screw up their narrative..
Nick,
To study the height of a group of people, I measure their height. To find their average height, I sum those and divide by the number of people. I do not then proceed to calculate an anomaly by division by a mean because this increases uncertainty and because there is no logical reason for heights like these.
Nick, what makes it desirable to convert to anomaly form when dealing not with heights but with these typical temperatures?
In case you claim that it makes station data more comparable by reduction of the size of some variables, like bringing numbers to a similar altitude, this can be approximated by use of lapse rate. If distance from the Equator needs levelling, this has its own formula. In a study of 40 or so stations as near to pristine as I can find for UHI work, a good deal of station-to-station offset variation remains even after these adjustments or after making anomalies. The impression is that each station has an X factor whose cause is not yet identified. It is as if the average temperature of a screen is highly sensitive to the type of material painted on the screen, but I have no good evidence for it being that.
Because even pristine stations close together fail to look uniform after adjustment, the reason for adjustment is weak. It does not achieve what is sought.
The matter of variation from one device/location to another is widespread in measurement science. One common, initial, almost mandatory technique involves an estimate of precision by sets of devices observed in parallel in groups like 20 or more to see if they respond similarly. I have not found this type of experiment reported with clusters of screens in the literature. If you have, a link would be most appreciated. Geoff S
Microclimates vary. It is as simple as that. These all cause situational variations that are simply differences but not errors. Homogenization destroys these perfectly normal differences.
Measurement uncertainty isn’t understood and many DON’T WANT TO UNDERSTAND. Uncertainty ruins their ability to use milli-kelvin values with 0.1 milli-kelvin “error”. Better to ignore it! Pseudo-science at its best.
Even the best rural stations are subject to microclimate variation. Even if no one lives within 10 miles of the station, if it is rural then the microclimate can range from having corn vs soybeans in nearby fields, each with their own impact on wind, evapotranspiration, etc. Or it could be a pasture nearby or an grove of trees along a river bed or most anything. All of it will have an impact at some level in temperature readings, ranging from the units digit to the mili-kelvin digit. So it’s not just immediate station infrastructure, its EVERYTHING! It can even affect *trends* and not just moment to moment measurements.
Very nice Willis. If the CAGW crowd had any science it would be plastered all over the place. They have nothing that is why we get crap like this.
They do “have it”.
Thing is you wont find it here – unless you follow links from the likes of those who get red-thumbed.
If you work really hard, then one day you might get to be as smart as you think you are now.
What. As smart as the authors of the paper I linked?
Cant you do better than weak Ad Hom?
Look to the Oxymoron bnice for lessons.>
In no other science would such sparse, varied and adjusted measures suffice to form any major conclusion. At best, they’d create an interesting dataset for discussion and supposition.
Bias Corrections for Historical Sea Surface Temperatures Based on Marine Air Temperatures
THOMAS M. SMITH AND RICHARD W. REYNOLDS
National Climatic Data Center, Asheville, North Carolina
(Manuscript received 8 January 2001, in final form 24 July 2001)