From Dr Roy Spencer’s Global Warming Blog
Roy W. Spencer, Ph. D.
The Version 6 global average lower tropospheric temperature (LT) anomaly for April, 2024 was +1.05 deg. C departure from the 1991-2020 mean, up from the March, 2024 anomaly of +0.95 deg. C, and setting a new high monthly anomaly record for the 1979-2024 satellite period.

The linear warming trend since January, 1979 remains at +0.15 C/decade (+0.13 C/decade over the global-averaged oceans, and +0.20 C/decade over global-averaged land).
It should be noted that the CDAS surface temperature anomaly has been falling in recent months (+0.71, +0.60, +0.53, +0.52 deg. C over the last four months), while the satellite deep-layer atmospheric temperature has been rising. This is usually an indication of extra heat being lost by the surface to the deep-troposphere through convection, and is what is expected due to the waning El Nino event. I suspect next month’s tropospheric temperature will fall as a result.
The following table lists various regional LT departures from the 30-year (1991-2020) average for the last 16 months (record highs are in red):
| YEAR | MO | GLOBE | NHEM. | SHEM. | TROPIC | USA48 | ARCTIC | AUST |
| 2023 | Jan | -0.04 | +0.05 | -0.13 | -0.38 | +0.12 | -0.12 | -0.50 |
| 2023 | Feb | +0.09 | +0.17 | +0.00 | -0.10 | +0.68 | -0.24 | -0.11 |
| 2023 | Mar | +0.20 | +0.24 | +0.17 | -0.13 | -1.43 | +0.17 | +0.40 |
| 2023 | Apr | +0.18 | +0.11 | +0.26 | -0.03 | -0.37 | +0.53 | +0.21 |
| 2023 | May | +0.37 | +0.30 | +0.44 | +0.40 | +0.57 | +0.66 | -0.09 |
| 2023 | June | +0.38 | +0.47 | +0.29 | +0.55 | -0.35 | +0.45 | +0.07 |
| 2023 | July | +0.64 | +0.73 | +0.56 | +0.88 | +0.53 | +0.91 | +1.44 |
| 2023 | Aug | +0.70 | +0.88 | +0.51 | +0.86 | +0.94 | +1.54 | +1.25 |
| 2023 | Sep | +0.90 | +0.94 | +0.86 | +0.93 | +0.40 | +1.13 | +1.17 |
| 2023 | Oct | +0.93 | +1.02 | +0.83 | +1.00 | +0.99 | +0.92 | +0.63 |
| 2023 | Nov | +0.91 | +1.01 | +0.82 | +1.03 | +0.65 | +1.16 | +0.42 |
| 2023 | Dec | +0.83 | +0.93 | +0.73 | +1.08 | +1.26 | +0.26 | +0.85 |
| 2024 | Jan | +0.86 | +1.06 | +0.66 | +1.27 | -0.05 | +0.40 | +1.18 |
| 2024 | Feb | +0.93 | +1.03 | +0.83 | +1.24 | +1.36 | +0.88 | +1.07 |
| 2024 | Mar | +0.95 | +1.02 | +0.88 | +1.34 | +0.23 | +1.10 | +1.29 |
| 2024 | Apr | +1.05 | +1.24 | +0.85 | +1.26 | +1.02 | +0.98 | +0.48 |
The full UAH Global Temperature Report, along with the LT global gridpoint anomaly image for April, 2024, and a more detailed analysis by John Christy, should be available within the next several days here.
The monthly anomalies for various regions for the four deep layers we monitor from satellites will be available in the next several days:
Lower Troposphere:
http://vortex.nsstc.uah.edu/data/msu/v6.0/tlt/uahncdc_lt_6.0.txt
Mid-Troposphere:
http://vortex.nsstc.uah.edu/data/msu/v6.0/tmt/uahncdc_mt_6.0.txt
Tropopause:
http://vortex.nsstc.uah.edu/data/msu/v6.0/ttp/uahncdc_tp_6.0.txt
Lower Stratosphere:
http://vortex.nsstc.uah.edu/data/msu/v6.0/tls/uahncdc_ls_6.0.txt
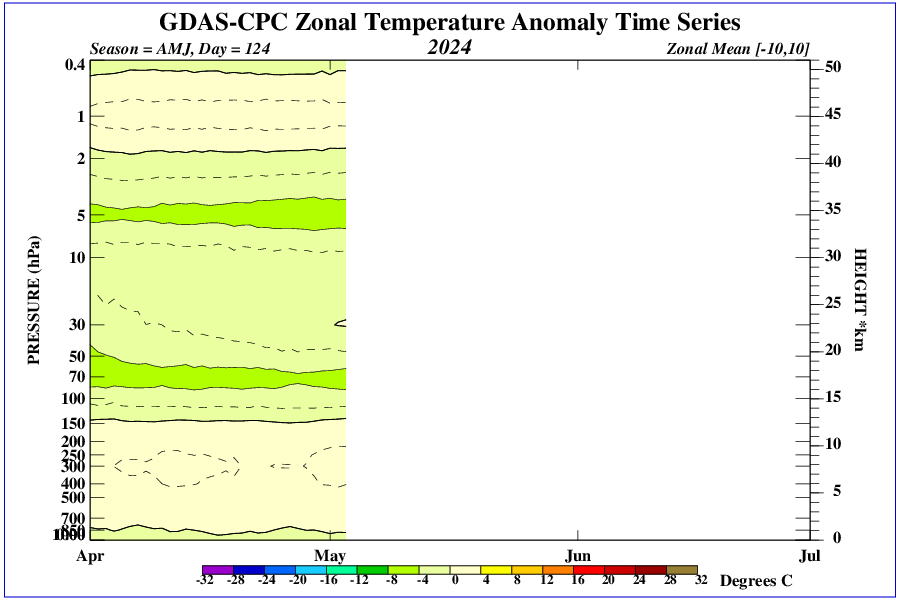
Moreover, the high temperature of the troposphere hinders cloud formation, which can result in high summer temperatures in the northern hemisphere and low winter temperatures in the southern hemisphere.
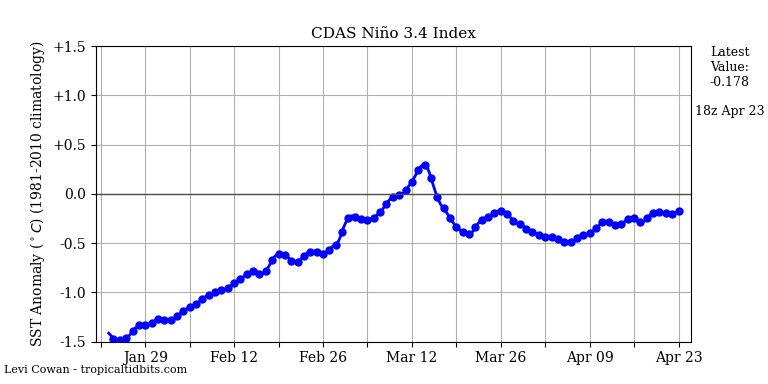
You can see that near the surface of the equatorial Pacific the temperature is dropping.

http://www.bom.gov.au/archive/oceanography/ocean_anals/IDYOC007/IDYOC007.202405.gif
Imagine if they were trying to claim the actual slow decline of total energy per cubic meter of air at ground level was a sign of a coming run-away ice age!
I think Nick, TFN etc should explain how 2ppm more co2 year over year caused this?
I agree it’s not an issue in and of itself, a pulse that is already collapsing at surface.
Nick please show your work. Hand waving isn’t work.
I don’t think 2 ppm more CO2 is the cause of the spike. As I keep saying repeatedly ENSO is the primary cause of the spike. What CO2 did is set the background higher thus making it more likely for the ceiling of the spike to be higher than previous spikes. Here is my work. Note that I am not saying UAH TLT is modulated by only 5 factors here. This is but a trivial model that helps demonstrate how UAH TLT can be explained by several factors working together. All I needed was 5 factors to explain most of the variation including ups, downs, pauses, spikes, etc.
It is likely that UVB radiation in the troposphere, which can be absorbed by water vapor over the equator, is increasing. The decrease in ozone production may result in a decrease in temperature in the stratosphere and an increase in the upper troposphere, due to the increase in UV radiation.

Declining heat in the equatorial Pacific.
