Guest Post by: The Competitive Enterprise Institute, The Heartland Institute, the Energy & Environmental Legal Institute, the Committee for a Constructive Tomorrow, and the International Climate Science Coalition, and Truth in Energy and Climate.
Editor’s note: This summary serves as a fact check on the biggest false claims made in the media in March, 2024.
According to NASA satellite data, the planet remained in the grip of the naturally-caused warming during a waning El Niño phenomenon in March:

In contrast, the real-time surface station temperature measurements from Temperature.global report that temperature remained cooler than at the height of the prior El Niño during 2015-2016.

As always, average global temperature is not a physical concept. It is merely a notion invented to push the global warming agenda. We mention it merely because it is what the excitement is all about. More on this at the end of this month’s fact checks.

Links: The Washington Post, Arctic sea ice extent.

Links: Minnesota Public Radio report, Associated Press report.

Links: The Weather Channel report, The Washington Post article.

Links: The New York Times op-ed, Anthropocene New York Times post.

Links: January 2024 study, Read more.

Links: The Washington Post article, UHI effect in Washington, D.C.

Links: CBS article.

Links: The Washington Post article, Army Corps of Engineers report, NASA report, Greenland ice loss.

Links: Reuters article, previous Climate Fact Checks.

Links: CNN article, February Climate Fact Check.
We’ll close out this month with an interesting commentary in Nature magazine from NASA’s chief climate scientist, Gavin Schmidt.

Schmidt acknowledges that emissions-based climate models don’t explain the apparent ongoing warming that started in July 2023. Recall that we’ve been told since the 1990s that climate science is “settled.” That doesn’t seem so, now does it?
Don’t miss these other great fact checks and articles from March. Until next month…
- The AP’s Coverage of UN’s ‘Climate Red Alert’ Is Nothing More Than a Red Herring
- WIRED Is Pushing False Claims About Climate Change and Human Health, Again
- Wrong, Al Jazeera, Coffee Production Is Setting Records, Not Declining Amid Climate Change
- Wrong, NBC News, Climate Change Doesn’t Threaten Minnesota Ice Fishing
- New York Post Misses the Boat on Sea Level Rise
- BBC’s Failed ‘Fact Check’ of Daily Sceptic Report on Arctic Sea Ice
- Get Ready For Underwater Holidays, Says Dopey Telegraph Reporter
- No, Ohio Capital Journal, Climate Change is Not Causing ‘Weird, Violent Weather’
- Wrong, Daily Mail, Climate Change Isn’t Causing a Chocolate Easter Egg Crisis
- The Seattle Times Says Washington State is in a Serious Drought. Is this True?
See you in May for the April Climate Fact Check!
Originally published at Junkscience.com, republished with permission.

Steve Milloy
Steve Milloyhttps://junkscience.com/
Steve Milloy is a recognized leader in the fight against junk science with more than 25 years of accomplishment and experience. He is the founder of JunkScience.com and a policy advisor to The Heartland Institute.
“Climate science” as exemplified by the IPCC went over to outright preaching, not science, when they advanced Michael Mann’s “hockey stick” paper MBH98. Aside from obviously violating historical accounts of temperatures, it also had major internal faults that soon became obvious. The IPCC has yet to renounce this paper, who’s factor analysis will produce “hockey sticks” from red noise.
People don’t need to pray for things to happen like they once did.
All people need to do now is to get a decent job for most things to happen.
People don’t have to pray to have enough to eat, they can go to the supermarket and get food from all over the world.
Many farmers don’t have to pray for rain, they have irrigation systems to water their plants.
People don’t have to pray that their horse or donkey will make a long trip, they can drive or take a plane.
We even have hospitals and doctors so praying for good health isn’t as necessary as a hundred or so years ago.
People still have their belief circuitry, and that has been co-opted by the “Climate Change” movement.
Few people have even seen the “models” that the climate change agenda depends on yet they believe the models are true without examinations or good proof.
“People don’t have to pray to have enough to eat…”
“People don’t have to pray that their horse or donkey will make a long trip…”
They never “had” to, they just felt that they did. The praying never actually did anything.
The temperature.global website does not describe the methodology used to calculate the series. Can anyone provide any documentation whatsoever?
Yes it does… Temperature.Global calculates the current global temperature of the Earth. It uses unadjusted surface temperatures. The current temperature is the 12M average mean surface temperature over the last 12 months compared against the 30 year mean…. and, if you search the data sources used from the front page (madis/noaa/etc), you can go to here: https://www.ncei.noaa.gov/access/metadata/landing-page/bin/iso?id=gov.noaa.ncdc:C00532
and they state the Integrated Surface Dataset (ISD) is composed of worldwide surface weather observations from over 35,000 stations, though the best spatial coverage is evident in North America, Europe, Australia, and parts of Asia. Hope that helps…
That describes the data source, not the methodology. It’s a bit like saying,
“how to draw an owl:
”
There is some stuff missing.
Is this difficult to understand?
If what they are doing is taking a simple 12-month running mean of the data as reported that would be a very bad methodology indeed, so I hope that there is more to it than that. But no one seems to be able to say.
That is your opinion!
Tell everyone what facts and references you use to find fault.
There is no physical measurement of a global temperature, it is a calculated metric. Why is this metric worse than any other?
This isn’t an opinion, it’s common sense, especially for anyone who recognizes that the earth is a sphere and that the reporting is not equally distributed in space or time.
The “metric” I described above would not provide an estimate of global temperature, so by default it would be worse than any metric that does provide an estimate of global temperature.
Again, that is your opinion. You have quoted no facts and no papers that have validated that using an average is what is actually measured at the center location.
A validation over many locations is needed to assess the uncertainty that should be applied when averaging two stations to get the center point value.
This is simple to do. Many TV stations show maps of reported station temperatures for sizable chunks of a state. They can be downloaded from most web sites of TV stations. Use those as a starting point.
Which part is the opinion:
You still have not presented any fact based analysis showing that when two temperatures are averaged that the average has no uncertainty.
Do that and we’ll discuss sampling of samples and how grouping is accomplished.
I never said that, so that’s not a thing I need to substantiate. I do urge you to try again once you’ve re-read the discussion to this point and have ensured you comprehend what has been said.
No, I said it. But you STILL have not answered.
In brief;
When will you have a reference?
That isn’t something I believe, so why would I have or even care to track down a reference stating such a thing?
You haven’t presented a single piece of documentary evidence of the easter bunny. What gives? Gimme it now.
Now we are getting somewhere.
You don’t believe that;
I couldn’t tell you where it is that you think you’re getting to. Homogenization of surface station records is proper and effective, as has been proven in the research literature. Understanding the uncertainty of global or hemispheric temperature indexes is absolutely worth our time, and happily there is abundant literature available to help us. You’ll of course be quite familiar with it all.
Show a study paper or work you have done that averaging absolute temperatures of two stations consistently provides an accurate value for an in between station. I have not found one.
Example: 3 stations A, B, and C in a line each separated by 30 miles. Does an average of A and C ALWAYS match with the measured station at B. If not, what is the measurement uncertainty?
Deleted.
“A validation over many locations is needed to assess the uncertainty that should be applied when averaging two stations to get the center point value.”
Averaging temperatures from different stations is a scientific no-no. Intensive properties…
An estimate of global temperature is even more meaningless than the concept of global temperature.
It is if that’s all the details given. What 30 year mean? How is the global average calculated? What are the uncertainties? That last one should bother you as you keep saying any anomaly given without uncertainties is practically fraud.
But regardless of their method, it’s difficult to see how it can be correct, given all the oddities. Why would there be huge fluctuations between the global values during the first two years, yet it’s practically flat since then? How is it plausible that every single year has been below the 30 year average, when every other source suggest we have had some of the hottest years on record during that period?
Be honest with yourself. If anything like this showed warming was twice as fast as all other data sets,you would be the first to demand they explain their method.
What does it matter as long as it is a common factor? . You need to define exactly what your concern is.
Again, can you tell how the uncertainty of the GAT has been propagated from daily Tavg to the final GAT publicized figure? If you don’t know that, why don’t you ask those folks.
Why wouldn’t there be large fluctuations as you start a running average over 12 years?
It is an average. That isn’t rocket science. The fact that this metric show something different than the one you prefer doesn’t mean it is wrong, only different. It’s average certainly seems to track better with all the stations globally that are not UHI contaminated. Have you thought about that?
“What does it matter as long as it is a common factor?”
I really can’t believe you have to ask that question. They are publishing anomalies which they claim are relative to a 30 year period, but they neglect to mention which particular 30 year period. If nothing else, this suggests very sloppy presentation, and goes with the 101 other factors they neglect to mention. It’s an especially bizarre omission when the main claim is that every one of the last 9 yeas has been below this mystery average period. Something no other data set shows, for any 30 year period.
If it’s being claimed that this somehow invalidates the UAH data, then that’s an either bigger problem. How do you even know if they are comparing like for like?
“Again, can you tell how the uncertainty of the GAT has been propagated from daily Tavg to the final GAT publicized figure?”
Hwy should I have to do that? It’s their data, they should provide their own uncertainty estimates. How can anyone know the uncertainties if there is no published method? And why do you not care about the lack of uncertainty in this data set, when you’ve been screaming about the uncertainty in all other data sets for many years?
“Why wouldn’t there be large fluctuations as you start a running average over 12 years?”
Well if it’s a running average over 12 years, that would explain a lot. But they actually claim it’s a 12 month average, not 12 years.
“The fact that this metric show something different than the one you prefer doesn’t mean it is wrong, only different.”
It’s a pretty enormous difference. UAH shows every year since 2015 as being above the 1991-2020 average, whilst temp.globe shows every year well below a mysterious 30 year average.
“It’s average certainly seems to track better with all the stations globally that are not UHI contaminated.”
How are they avoiding this UHI contamination? According to them the data is not adjusted? And, why is this relevant to a comparison with satellite data?
I’m truly amazed that you don’t see your own contradictions here. If this was the same web site, but showing faster warming than other data sets, would you be making all these excuses – or would you be screaming about the lack of transparency in their methods?
You can’t even answer a simple question. Let’s assume the baseline is 60°C. If temperature were growing the anomaly would get less negative. If temps were falling anomalies would get more negative. It isn’t the absolute value of an anomaly you are looking at since it isn’t a temperature anyway. It is an amount of change over a baseline.
You might ask yourself why a common baseline makes this the smallest metric vs UAH somewhat larger and the GAT the largest. Gee, could averaging ~9500 station anomalies all with different baselines contribute to the difference? Maybe the GAT has something wrong?
Two different metrics. One satellite and one surface. Satellite supposedly has 100% coverage over its path. Obviously surface temps don’t.
My fault, a senior moment.
They aren’t my contradictions, they are yours. I don’t think any of them treat measurement uncertainty correctly. For surface measurements you simply can’t introduce massive uncertainty at the very first calculation when using Tavg and assume it disappears by averaging.
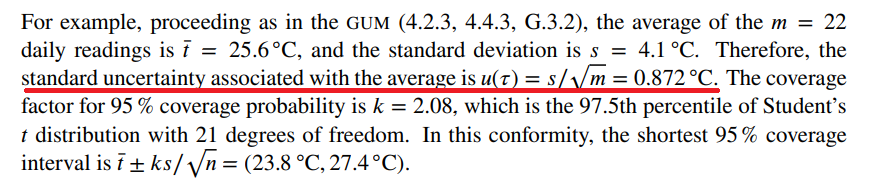
Read these pages and see what you obtain for a monthly average when “J = 1” and “K = 22” as in TN 1900 Ex. 2.
2.4.3.2. 2 level nested design (note carefully the requirement that:
2.5.6.3. Sensitivity coefficients for measurements from a 2-level design
Maybe these will explain why NIST claimed negligible measurement uncertainty and only used the level 2 calculation.
“Let’s assume the baseline is 60°C. If temperature were growing the anomaly would get less negative. If temps were falling anomalies would get more negative.”
Congratulations. You’ve finally figured out what others keep telling you. That if you are interested in the rate of change, it makes no difference if you are using anomalies or absolute values, or which base period you use. The trend will always be the same.
But the issue with this data set, is they are claiming all the years are below a 30 average, giving the impression there has been cooling since that base period, but not saying what that period is. This is both indicative of the lack of detail on the site, and highly suspicious given no other data set remotely indicates that.
But seeing as you are now interested in the trend, has it ever occurred to anyone bigging up this data set to look at what the trend is?
Guess what. Based on their annual values for 2015 to 2023, the rate of warming is 0.38°C / decade. Not significant of course, but much faster than UAH at 0.14°C / decade, over the same period.
I’m more interested in the “bias” source.
The study of the climate used to ruled by actual, unbiased, science.
For 30 or more years it’s been ruled by political science.
Ike warned of the military-industrial complex. Clisyfy has taken than warning to a whole new level!
The WMO redefined “climate” to be only 30 years of weather, so it is always changing.
This fact check starts out very badly by relying on the no-name Global temperaure report, also featured on the front page of WUWT. This index is put out by people who won’t give their names or say anything about their methods. In fact it seem clear that they just take a running average of whatever comes in from METARS. No anomalies used, no spatial weighting. All it tells you is whether the data coming in happens to be a warm place or a cool one.
Then there is the melting and earth rotation study. This is not new, and the “fact check” clearly doesn’t understand it, since it talks about sea ice. In fact the rotation calculations are simple physics. Angular momentum is conserved, to if the Earth rotation slows, that can only mean that the moment of inertia has increased. Mass is conserved, so that means that it must have moved further from te axis. This happens when land ice melts and raises sea levels nearer the equator. Thermal expansion of the sea has a simlar effect.
Then the claim that Finland is warming because of Northern lights, with a speculatine study, along Svensmark lines. But that doesn’t say why warming is increasing.
The Anthropocene stuff is just silly. There was an argument, people put their viewpoints. A scientific panel said that in their judgement there wasn’t yet enough evidence. That doesn’t mean the other view made an error of fact.
Emissions warming the ocean? The counter here is just bizarre. They quote a paper about entropy generation. It doesn’t say anything contrary at all.
Washington cooling? They quote a document from a group representing the forestry, saying trees will help against UHI. But they don’t say UHI has increased by 4.7F while washington was warming by 3.6F. They just estimate the absolute effect at 4.7F. They don’t say it has increased over that period at all.
“Explosive Hurricane Season”? The WP is just saying the same thing as Charles Rotter at WUWT here 3 days ago, leading with Bastardi’s forecast.
If there was a useful real-world application for a global average temperature construct, it would be offered as a free give-away instead of steak knives.
Come to think of it, I’d ask if the steak knives are still available.
An insightful comment, I guess???
But many of the articles at WUWT are about global average temperature, and what they think might be influencing it.
Nick,
Are you claiming that an accurate (even useful) estimate of global land surface temperature exists? Much remains unknown about UHI – the timing, the magnitude, the location, possible correctioons and so on?
As an aside, do you believe that when such global temperatures change, heatwave peaks change accordingly? Or is there some barrier to increases, such as appears to exist over oceans, with surface sea themperatures reluctant to rise above 30 C? I ask this to get a better feel for your feel about uncertainty of global land surface temperature estimates.
Geoff S
What is most commonly spoken of is land/sea global temperature anomaly. And of course accurate estimates of that exist; I calculate one myself every month. Many articles at WUWT discuss GAT. They would make no sense if it didn’t exist.
Land temperature is less commonly discussed, but I think it can be well esimated. UHI has always been there, so is not responsible for the 2023 record warmth. Heatwave peaks – it’s hard to say. Some seem to be much greater than AGW would suggest, but maybe that is because we only notice the wramer ones.
AS to natural bounds – no, I don’t think there is one. I’m dubious about the 30C ocean one too. It’s true that for now, such levels transfer heat by evap to some cooler place. But the cooler places are getting warmer.
“And of course accurate estimates of that exist; I calculate one myself every month.”
It’s complete nonsense–as usual.
Indeed. Utterly meaningless.
“so is not responsible for the 2023 record warmth.”
OMG! are you ignorant of the fact we have just had a major protracted El Nino event.!!
Stop trying to pretend there is anything remotely human caused in these transient temperatures…
… which , btw are still well below what they would have been for most of the last 10,000 years
“But the cooler places are getting warmer.”
Not through anything humans have done, ..
…. apart from urban development.
Record cold in Mongolia… massive cold spell has kill millions of livestock this year..
“Getting warmer”………… whatever !!
” And of course accurate estimates of that exist;”
Never heard such a rubbish comment, even from you.
There is absolutely no possible way that urban surface data can produce anything remotely resembling a real global temperature.
Certainly, it is totally unfit for the purpose of estimating global temperature changes.
UHI has not “always been there”.. another absolutely stupid comment.
It is a massive warming effect over time, starting a basically none for a surface site placed a km or so out of town, with up to several degrees of warming as the urban expansion and densification swallows it up.
One only has to look at the percentage of people involved in all farming in 1850 versus currently to derive a growth factor for how much urbanization has taken place. Have you ever seen a climate science that discussed this as part of the warming? I haven’t.
I found this for farm population in the U.S.
1850 64%
1916 32%
1920 30%
1987 2.2%
Looks like a hockey stick doesn’t it?
“Accurate estimates” is an oxymoron.
Poppy cock! I have done enough monthly evaluations to know that the land monthly Tmax average temperature measurement uncertainty as calculated in NIST TN 1900 Example 2 is fairly common. It is ±1.8°C (±3.24°F).
Show us how you calculate a monthly average measurement uncertainty for land temps and how you propagate it into an anomaly ΔT. While you are at it show your measurement uncertainty calculations for a land baseline temperature average.
What! Your asking NS to do proper maths!!! Don’t be rude!
One day you are going to wake up to the fact that the TN1900 Example 2 is disagreeing with everything you claim.
You claim that a temperature average is not a measurement, and even say you cannot have a temperature measurement – but here’s NIST treating it as a measurement, with measurement uncertainty.
You claim that measurements are not true value + error, but that’s exactly how NIST models it.
You insist that you cannot ignore instrument uncertainty, but your example assumes it’s negligible.
You keep rejecting the “meme” that all uncertainties are random and Gaussian, but that’s just what the example assumes.
You are positive that the uncertainty of the average is the standard deviation of all the values that were used in calculating it – and are adamant that you never under any circumstances, divide the standard deviation by √n – but never seem to notice that your preferred method does exactly that.
You have no idea of what you are talking about. NIST declared their measurand as:
That is a very detailed description of the measurand. t is the random variable made up of measurements of “τ + ε”. τ is the mean of the random variable. The expanded standard deviation of the mean is then calculated. I may not agree with that and would not recommend it, but I have no problem if someone wants to use it.
However one must show the calculation that was used along with the DOF. One of the most important statements in the GUM says in C.3.2,
This allows one to understand which type of measurement uncertainty is being quoted.
You use the the word “example”. Do you know what an example is for?
As to why they didn’t pursue using a measurement uncertainty. The reason will point out your lack of interest in studying metrology.
NIST has a document called the Engineering Statistical Handbook. You should study it.
If one reads the NIST Engineering Statistical Handbook carefully, one will find that uncertainty is divided into 3 levels. Level 1 deals with uncertainty in repeatable conditions, that is, multiple measurements of the same thing with the same device by the same person over a short period of time. Level 2 deals with reproducible conditions over a span of days and is used to assess changing conditions. Level 3 deals with reproducible conditions over a long period (fyi, think about a baseline average).
NIST goes out of their way to declare that the “average Tmax measurand” meets level 2 reproducible conditions for a measurand.
Section 2.1.2.2. Data Collection says
The variable “J” is used to reference the calculations done for a repeatability measurement uncertainty that meets the traditional multiple measurements on the same thing with the same device in a short period of time.
The requirement for J = 2 or more measurements for temperature measurement data is not met with current temperature data. There is only one measurement of any given temperature. So “J = 1”.
This makes it necessary to use a Type B uncertainty for instrument measurement uncertainty. That is why NIST didn’t deal with it in their example.
One, I don’t deny that temperature random variables can’t be Gaussian. I do require some proof. Why do you never show histograms confirming a Gaussian distribution. Two, this example actually uses a Student’s T expansion because it is likely that the tails match that distribution more closely than a Gaussian.
I have already addressed this above. My position is that the standard deviation describes the DISPERSION OF VALUES OF MEASUREMENTS that surround the mean.
The standard deviation of the mean only describes the interval in which the mean may lay. It is a description of the VALUES THE MEAN MAY HAVE.
That IS NOT a description that tells anyone what values of measurements may be expected when repeating the measurement.
“You have no idea of what you are talking about. NIST declared their measurand as”
Followed by a quote saying the measurand has been defined as an average of daily maximum temperatures. Something you’ve repeatedly said is not a measurand.
“τ is the mean of the random variable.”
No it is not. It is the “true” value of the monthly means.
“The expanded standard deviation of the mean is then calculated.”
What on earth is the “expanded standard deviation”?
“The variance of a variable z should be carefully distinguished from the variance of the mean z“.”
Which is the point we keep trying to tell you.
“You use the the word “example”. Do you know what an example is for?”
You keep claiming it as the one true way of determining uncertainty for mean temperatures.
“One, I don’t deny that temperature random variables can’t be Gaussian. I do require some proof. Why do you never show histograms confirming a Gaussian distribution.”
Not sure what you mean here. I’m always being accused of assuming that all distributions are Gaussian. I don’t. I’ve shown you graphs of temperatures which make it clear they are not Gaussian.
“Two, this example actually uses a Student’s T expansion because it is likely that the tails match that distribution more closely than a Gaussian.”
But the Student-t distribution does assume that the data distribution is Gaussian.
“My position is that the standard deviation describes the DISPERSION OF VALUES OF MEASUREMENTS that surround the mean.”
You keep changing your words every time you say it. Previously you were claiming that it describes the dispersion of values that could be attributed to the values that made up the mean – or some such, and were trying to claim that this was how the GUM definition of uncertainty should be interpreted. I.e. you were implying that the standard deviation was the uncertainty of the mean.
“The standard deviation of the mean only describes the interval in which the mean may lay. It is a description of the VALUES THE MEAN MAY HAVE.”
And you keep saying that as if that wasn’t what the uncertainty of the mean is.
“That IS NOT a description that tells anyone what values of measurements may be expected when repeating the measurement.”
Of course not – that would be the uncertainty of the measurement, not of the mean.
From TN 1900
Is {tᵢ} a random variable?
Is τ the mean of each tᵢ?
Do you not recognize that NIST is telling you that each temperature measurement “tᵢ” is being treated as if it had been determined by multiple measurements taken from a Gaussian distribution?
https://online.stat.psu.edu/stat414/lesson/26/26.4
==================
I am tired of teaching you things you claim to know but obviously don’t. In the future post references to support your claims as I do. Without references you will receive no responses from me other than a URL to study.
“Is {tᵢ} a random variable?”
No. {tᵢ} is a set of values taken from identically distributed random variables.
“Is τ the mean of each tᵢ?”
No. τ is the mean of a random variable. It is also the supposed true mean of the month.
However, looking back I see I made a mistake above when I said it wasn’t the mean of a random variable. It’s just that that isn’t it’s main purpose. The assumption is that all temperatures are the true value + an error term, and that does indeed make τ, both the true mean and the mean of each random variable.
“Do you not recognize that NIST is telling you that each temperature measurement “tᵢ” is being treated as if it had been determined by multiple measurements taken from a Gaussian distribution?”
It is not. This has been one of your misconceptions all along – that a random variable only exists if you take multiple values from it.
What it is assuming is that each daily reading is a value taking from a random variable, and as the daily random variables are iid, you can estimate the distribution from the distribution of daily values.
Regarding you patronizing attitude about the Student-t distribution. I did not say it was assumed to be a normal distribution, but that the data distribution was normal. This is explained in the very link you sent.
If you insist I provide references
https://en.wikipedia.org/wiki/Student%27s_t-distribution#How_the_t_distribution_arises_(characterization)
https://www.statsref.com/HTML/t_distribution.html
How much it matters in practice is another issue. But you are the ones who keep rejecting every statistical process unless you can prove normality.
Is {tᵢ} a random variable?”
Read this again. From the TN.
T1 is a sample from a single Gaussian distribution with unknown mean τ and σ.
T2 is a sample from the same Gaussian distribution with unknown mean τ and σ.
T3 is a sample from the same Gaussian distribution with unknown mean τ and σ.
t22 is is a sample from the same Gaussian distribution with unknown mean τ and σ.
{ti} is a random variable containing 22 samples taken from a Gaussian distribution with an unknown τ and σ.. In other words, it is a sample distribution. This what NIST is assuming. Guess what it does? It let’s the CLT apply.
You haven’t read NIST’s Engineering Statistical Handbook at all have you? Level 1 uncertainty requires 2 or more readings under repeatable conditions to assess repeatability uncertainty on a day. Level 2 uncertainty requires measurements on multiple days of the measurand in order to assess reproducibility uncertainty.
Funny how you never quote references from organizations that deal with measurements. Statistical sites are ok for learning about statistics. Measurement sites are more appropriate for dealing with measurements.
Here are a couple.
https://sisu.ut.ee/measurement/32-mean-standard-deviation-and-standard-uncertainty
See if you can figure out why multiple pipet experiments might be like 22 days worth of temperature measurements of the measurand – monthly average.
https://www.itl.nist.gov/div898/handbook/mpc/section5/mpc5311.htm
Which is what I said.
“T1 is a sample from a single Gaussian distribution with unknown mean τ and σ.”
That’s not what they are saying. The entire set {tᵢ} is a single sample from a Gaussian distribution.
“{ti} is a random variable containing 22 samples taken from a Gaussian distribution with an unknown τ and σ.”
Please explain how a continuous random variable contains 22 samples.
“Guess what it does? It let’s the CLT apply.”
I’m guessing you don’t know what the CLT is.
“You haven’t read NIST’s Engineering Statistical Handbook at all have you?”
Why don’t you stick to the subject? Every time it becomes obvious you are wrong about a subject, you reach for a completely different subject. You are describing check standards here. How is that relevant to Example 2? It’s already assumed that any calibration errors are insignificant. There’s no suggestion that the thermometer is drifting over time.
“Here are a couple.”
Could you actually say where these disagree with anything I or TN1900 are saying.
“Which is what I said.”
“T1 is a sample from a single Gaussian distribution with unknown mean τ and σ.”
“That’s not what they are saying. The entire set {tᵢ} is a single sample from a Gaussian distribution.”
That is one interpretation. However, that means you have ONE sample of, in this case, n = 22.
For the CLT to apply, there must be multiple samples so that the means of those samples form a sample means distribution from which you can calculate an estimated mean and a variance for the sample means distribution which becomes the SEM.
One sample does not allow for either of those.
Now, you can take a leap of faith and say the 22 values have the same mean and variance as the sampled distribution. And, in fact that is likely what NIST did in the example. That isn’t likely which is why NIST also requires multiple reading under repeatable conditions in Level 1 repeatability uncertainty assessments. But be that as it may.
You then run into the conundrum of whether to use the standard deviation or the standard deviation of the mean as the measurement uncertainty. NIST chose to use the expanded standard deviation of the mean.
You pick either one you want. You still arrive at a measurement uncertainty that disallows using temperatures in the one-hundredths or one-thousands place. You can’t have your cake and eat it too.
It is beyond funny to see monthly averages like 20.025 ±1.8°C. No one in the physical sciences would believe this. They would be ROFL!
“For the CLT to apply, there must be multiple samples so that the means of those samples form a sample means distribution from which you can calculate an estimated mean and a variance for the sample means distribution which becomes the SEM.”
Still as untrue as the first few hundred times you said it. Example 2 demonstrates why it is untrue.
“Now, you can take a leap of faith and say the 22 values have the same mean and variance as the sampled distribution.”
See, you are almost getting it.
“You then run into the conundrum of whether to use the standard deviation or the standard deviation of the mean as the measurement uncertainty.”
Not a conundrum if you are clear about what you are measuring, and what uncertainty you want. Standard deviation is telling you about the uncertainty of the individual measurements – the range of values you are likely to see with the next measurement. Standard error of the mean is telling you how much uncertainty there is in your estimate of the mean. TN1900 correctly goes for the latter.
“NIST chose to use the expanded standard deviation of the mean.”
“expanded” is irrelevant here. The SEM tells you the standard uncertainty of the mean, expanding that is a choice in how you present the uncertainty. The first tells you the “average” error there is likely to be in the mean, the second gives a “coverage” interval.
“You still arrive at a measurement uncertainty that disallows using temperatures in the one-hundredths or one-thousands place.”
It doesn’t “disallow” it. TN1900 gives the standard uncertainty to the one-thousandth place. They just round the values to a more reasonable single decimal place for the final result. Most single station monthly averages are only quoted to 1 decimal place – which does produce some rounding errors.
“It is beyond funny to see monthly averages like 20.025 ±1.8°C”
Could you provide an example of that. You shouldn’t quote a figure beyond the digits of the uncertainty. Either 20.0 ± 1.8, or 20.03 ± 1.81, if the figure is being used in calculations, would be better.
But when you are just downloading data from a data base there’s no point in worrying about too many decimal places – better to have too many than too few.
You refuse to use the values from the TN. NIST said the interval was:
Why do you think they did not quote the interval with an uncertainty of 3 decimal places?
Why didn’t you characterize the 3 decimal places as using the rule that allows additional decimals during calculation so that rounding errors don’t occur?
What is the rule for stating a measurement based upon an uncertainty?
Here is what TN 1900 says:
You also never mention this admission in the TN (it shows a ±2.0 uncertainty).
All you have to do is look at a graph of anomalies. Many include values to the one-thousandths. In order to do that, you must have measurements (monthly average and baseline average) that have that have that same number decimal places.
You your self have talked about decadal averages to the one-hundredths digit. That is an order of magnitude smaller than the uncertainty allows.
How would that happen unless measurement reccomded rules are not being followed?
“I have done enough monthly evaluations to know that the land monthly Tmax average temperature measurement uncertainty as calculated in NIST TN 1900 Example 2 is fairly common. It is ±1.8°C (±3.24°F).”
As usual, no clue at all. The monthly average is not a measurement. It is a calculation. The uncertainty is not (mostly) uncertainty of measured temperature . It mainly reflects weather variability – ie to what extent the days measured are a typical month.
Here is NIST TN 1900. E2 is on P 29. They do measure a month, and quote an uncertainty of 0.87C. But uncertainty of instrumental measurement is only a small part of that. It’s mostly just the day-to-day weather. Here is what they say:
“The {εi} capture three sources of uncertainty: natural variability of temperature from day to day, variability attributable to differences in the time of day when the thermometer was read, and the components of uncertainty associated with the calibration of the thermometer and with reading the scale inscribed on the thermometer.”
You didn’t read the TN for meaning did you?
The interval used for uncertainty IS NOT ±0.87. 0.87 is the standard uncertainty of the mean. Because it is likely that the data is closer to a Students T. To achieve a 95% confidence interval, which is appropriate when using the standard deviation of the mean, the 0.87 is expanded using a DOF of 21.
The end result is a measurement uncertainty interval of 25.6 ±1.8°C. You should notice that another method gives an interval of ±2.0.
That statement is insane. Even your beloved GAT starts with a monthly average using day to day variation!
These are MEASUREMENTS. Measurements have uncertainty. You display your ignorance of what you are dealing with. Show a reference that the mean of a random variable doesn’t also need variance to describe the data from which the mean was calculated.
If Tmonth = {D1, … , Dn} where Dn = daily temp, then that random variable has a mean & variance. The variance is used in determining the measurement uncertainty of the measurand Tmonth.
These aren’t just numbers you can play with as a mathematician. They do actually mean something as evidenced from the trillions being spent based upon them.
“The interval used for uncertainty IS NOT ±0.87. 0.87 is the standard uncertainty of the mean.”
Huh?
Here is what you said:
“I have done enough monthly evaluations to know that the land monthly Tmax average temperature measurement uncertainty as calculated in NIST TN 1900 Example 2 is fairly common. It is ±1.8°C (±3.24°F).”
Here is what NIST said:
The standard uncertainty is 0.87. What you seem to be trying to talk about is the coverage interval.
Do you know why the coverage interval is used in metrology?
https://www.itl.nist.gov/div898/handbook/prc/section2/prc263.htm
Now look at the statement at the end.
See that τ ± k(s/√n). “τ” is the mean and “k(s/√n)” is the interval of values that can be attributed to the measurand.
Nick, you really need to study measurement technology and analysis. You always portray the attitude of a mathematician whereby numbers are the most important thing in the universe. You ignore the fact that measurements provide critical information concerning physical attributes. People trained in physical science like analytic chemistry, engineering, and physics live and die on measurements and their implications. The information conveyed is the lifeblood of physical science.
If you knew metrology you would know that when you calculate the standard uncertainty of the mean, and NIST should have used more precise language, you are determining the interval where the mean itself may lay and not the dispersion of measurements attributable to the mean. The standard deviation of the mean can be so small it doesn’t even encompass any of the measured values.
Confidence intervals describe the range of measurements where the population mean may lie. In other words, the dispersion of the measured values that can be attributed to the mean. That is why the standard uncertainty is expanded. See above.
It is why NIH allowed this to be published.
https://www.ncbi.nlm.nih.gov/pmc/articles/PMC2959222/#
As more people move to the cities, where most weather stations around the world are located, more concrete and asphalt are poured and those absorb heat during the day and release it at night, much more so than soil does, which warms the average temperature.
The temperatures at the poles where few people are living are probably a better reflection of the Earth’s overall temperature.
Thank you, Nick.
Many of the sea surface temperatures used for global averages are guesses, because no measurement devices existed in the area at the time.
Can you refer me to a text book or authoritative paper that details a methodology for the calculation of uncertainty of guessed input data? Geoff S
“But the cooler places are getting warmer.”
Not in my neck of the woods. Our record temperatures were in the past.
Which illustrates the fallacy of a global average.
Well Nick if they asked me what I thought was influencing gat constructs, I would tell them –
“too many cooks in the kitchen spoil the broth”
Several people calculate it properly. We all get the same answer.
“calculate” –yes; “properly” –no; “same answer” –of course–you all are using the same silly technique.
You don’t seem to be able to offer an alternative technique.
NIST TN 1900 Example 2 for monthly average temperatures.
NIST Engineering Statistical Handbook has all kinds of good information on measurements and finding their uncertainty.
Last but not least, GUM – JCGM 100:2008
These all have excellent information on resolution, repeatablity, rreproducability, and uncertainty.
Do you need more?
I need you to present your technique for calculating the GAT. The claim is made that everyone calculating GAT is using a “silly” technique, so I want to see the non-silly technique, and an explanation of why it’s better.
The problem with GAT is the measurement uncertainty calculation. Maybe you can elucidate how the monthly measurement uncertainty from NIST TN1900 gets propagated into the anomalies and from there into the GAT.
If you can’t do that, don’t be asking other folks to prove something.
Treatment of the uncertainty would not explain why the major temperature indexes arrive at the same result. The claim is made that all organizations derive the same result because they are using the same “silly” method. I want anyone who believes this to present their better, non-silly method, and show that it produces a different result. I’ll be eager to see their uncertainty analysis at the same time.
“If you can’t climb a tree, don’t ask other people to bake an apple pie.” Solid logic you’ve got there.
Nice dance! If everyone was jumping off a cliff, would you jump also?
Maybe they get the same answers because they are using similar data and similar methods. Methods that throw away variance in each random variable at each step of the calculation. You seem to be familiar with the calculations and approve of the method so tell us how this works.
You didn’t even address my question.
You just danced around it.
That’s exactly the claim being made. If you claim that a different valid methodology will produce materially different results, I invite you to present us with your approach. Show us how it is better, and show us how the results are different.
I claim they’re getting the same answer because, well, that is the answer. I’ve yet to see anyone present a valid way of calculating the GAT that arrives at a different conclusion.
It’s not up to me to show anything.
If you want to disprove or claim something is wrong have at it.
Otherwise any claim you make that some method is wrong is based solely on your opinion.
I don’t claim a method is wrong, I claim nobody has actually shown any alternative method. If you want to dispute that, you have to show a method. Otherwise sit back down please and thanks.
It sure looks like you think something is wrong with it.
There is no indication that this is what the temperature.global people are doing (because they don’t document their methods…), it was a hypothetical discussion, and was not presented in response to my request for an alternative method of estimating GAT – are you presenting this as a valid alternative method?
I am saying it is a metric using absolute temperatures and it has a defined method.
Until you or someone shows mathematically why it gives an incorrect representation of a global temperature it is a legitimate metric.
Do I think the absolute values have significant measurement uncertainty, of course I do. But, I also think that the GAT has significant measurement uncertainty that is also ignored. The lack of any quotation of measurement uncertainty must lead one to the conclusion it has been totally ignored.
I think all have enough uncertainty that it is impossible to justify temperature changes in the one-thousandths digit as is commonly done.
You will notice that this global metric appears to have anomalies only to the one-tenths digit. That is a significant improvement.
Ultimately it is another tool in the box to consider what is happening globally.
I made a comment in another thread describing why you cannot simply slap together an average of the absolute values of a station network whose composition is transient through time. It is the same situation here. Doing so will introduce spurious trends.
But, again, we don’t even have the results of using this method, since we are only guessing that it might possibly be maybe what the temperature.global people did (again, they don’t describe their methodology). If they did use this method, their “metric” contains spurious non-climate signals, and shouldn’t be used to assess global climate change. But who knows what they’ve actually done. Maybe, optimistically, they actually have used a valid method, but no one can point to any documentation of such.
And here is why averaging anomalies is incorrect.
Let’s make it simple for you.
January +0.5 @ur momisugly 15.0 global temp
February +0.6 @ur momisugly 14.7 global temp
March +0.7 @ur momisugly 14.5 global temp
What the true growth rate?
Is it (0.5 + 0.6 + 0.7) / 3 = 0.6 ?
Or is it (15.0 + 14.7 + 14.5) / 3 = 14.7
With an anomaly of [(15.0 – 14.7) + (14.7 – 14.7) + (14.5 – 14.7)] / 3 = (0.3 + 0 – 0.2) / 3 = 0.1 / 3 = 0.03
That is why a single baseline for the globe is needed. The monthly anomaly can be based on varying baseline temperature each month. It is incorrect to average ΔT numbers with different bases.
It is why I posed this problem to you.
If I tell you one car changed its speed by 1 mile/hour and one by 2 mile/hour which one is going faster? When you can give a correct answer, we can move on.
Does the average tell you anything about the speed change. No. And you couldn’t even come up with the correct answer.
“Is it (0.5 + 0.6 + 0.7) / 3 = 0.6 ?
Or is it (15.0 + 14.7 + 14.5) / 3 = 14.7
With an anomaly of [(15.0 – 14.7) + (14.7 – 14.7) + (14.5 – 14.7)] / 3 = (0.3 + 0 – 0.2) / 3 = 0.1 / 3 = 0.03”
Obviously the first is the correct average anomaly the other one is a completely different average.
In the second you have determined what the current average temperature of these three months are. All you are saying is the average of those three months minus the average of the same three months is zero (or it would be if you didn’t introduce a rounding error).
If you compare it to the average of you actual base line
(14.5 + 14.1 + 13.8) / 3 ~= 14.1
With an anomaly of [(15.0 – 14.1) + (14.7 – 14.1) + (14.5 – 14.1)] / 3 = (0.9 + 0.6 + 0.4) / 3 = 1.9 / 3 ~= 0.6
You refuse to address the fact that you are averaging values that have a different baseline and that causes an unintended offset .
The proper way to do this is to convert ALL temperatures to Kelvin or Rankine and then average temperatures. Forget anomalies, If more are warmer the average will rise and if more are cooler the average will go down.
Hmmm, does that sound like an average WUWT already published?
You still haven’t figured out that there is absolutely NO WAY you can use current and past surface data to get an indication of global temperature change.
The surface data is way too urban-contaminated, site-contaminated and agenda-mal-adjusted to ever give you anything that could be remotely representative of real temperature changes over time.
Yet you can see the signal of your beloved El Niño plain as day in this “urban-contaminated, site-contaminated, agenda-map-adjusted” data. So how does that work out exactly?
Because it is outside the control limits. You do know how those work right?
The GAT is currently calculated using Tavg. What a joke. When Tampa, FL and Fargo, ND can have the same Tavg on the same day with different Tmax and Tmin, just what does Tavg inform you of? A proper metric should inform one of the differences being observed. Tavg won’t do that.
Do you know how to calculate the measurement uncertainty of two daily temperatures? Let’s use 75F and 50F, for Tmax and Tmin respectively. What is the measurement uncertainty for Tavg. Be sure and specify it properly as defined by NIST and International bodies of measurement.
An American family in New York City might have two parents and an American family in Topeka, Kansas might be a single parent household, but that doesn’t mean that knowing the average size of the American family isn’t a useful metric.
Global temperature can distinguish between ice ages and interglacials, and can tell us when the planet was descending into or coming out of these same periods, so it is clearly as useful metric.
Why do we need GAT to tell us whether Earth is entering or leaving a glaciation? A handful of punctual temperature series will do the same.
You really need to take some calculus based physical science. The GAT IS NOT a temperature. How many times do you need to have this explained. The GAT is a metric of change, a ΔT. It is like the speed of a car that has increased speed or decreased speed by a given amount.
If I tell you one car changed its speed by 1 mile/hour and one by 2 mile/hour which one is going faster? When you can give a correct answer, we can move on.
Why have you not answered my question about measurement uncertainty? If you can’t compute an answer, you have no business lecturing people about temperature measurements.
If we are measuring the change relative to a baseline speed x, then I can say that car two is now going faster, and I can say this without knowing what the shared baseline speed is.
I didn’t tell you that because the GAT doesn’t tell you that either. You have no way to deduce a baseline value for either. That is why you can not deduce a baseline temperature from the GAT.
Your answer is incorrect. See if you can reason out why!
To calculate the mean anomaly, you compute the individual baseline averages, then calculate the anomalies as the difference between the observations and the baseline average, then you combine the anomalies. That’s why you can’t back out the baseline values from the total average. That doesn’t mean there is no baseline.
I know how they are done.
You fail to recognize that you don’t compute a GAT baseline!
Knowing what an average change in a GAT is gives you no reference point to know if the global temperature is warmer or colder.
Can you assure me that GAT average temperature last month is cooler/warmer than this month? No! All you know is that the average anomaly increased but you don’t know if cooler areas warmed or if warmer area warmed.
Do you see why everywhere claims to be warming faster than everywhere ekse?
I never said you did.
Of course it does. That’s why the anomaly is lower during ice ages, and higher during interglacials. Literally that’s… all the GAT anomaly does.
You are insane. You don’t know what the global temperature is that the monthly GAT is based on. It could be -10°C +0.24 or it could be 40°C + 0.24.
If you have a way to use the GAT to deduce the absolute global temperature, then tell us what each month in 2024 was in absolute temperature.
While you are at it, tell us what measurement uncertainty is for each of those months.
Are you going to dodge these questions too?
The global mean anomaly is not based on a single global temperature, the basis of the individual anomalies is the regional climatology. I’m not sure what point you’re attempting to convey here.
Do you think I am stupid? Of course I know how anomalies for a station is calculated and accumulated through averaging.
Let’s make it simple for you.
January +0.5 @ur momisugly 15.0 global temp
February +0.6 @ur momisugly 14.7 global temp
March +0.7 @ur momisugly 14.5 global temp
What the true growth rate?
Is it (0.5 + 0.6 + 0.7) / 3 = 0.6 ?
Or is it (15.0 + 14.7 + 14.5) / 3 = 14.7
With an anomaly of [(15.0 – 14.7) + (14.7 – 14.7) + (14.5 – 14.7)] / 3 = (0.3 + 0 – 0.2) / 3 = 0.1 / 3 = 0.03
That is why a single one baseline for the globe is needed. The monthly anomaly can be based on varying baseline temperature each month. It is incorrect to average numbers with different bases.
Anyone chasing GAT is a fool.
“You don’t seem to be able to offer an alternative technique.”
Your first mistake is assuming there is such a thing as a global temperature. For that to be true, the Earth’s atmosphere must be in equilibrium. If that was so, then there wouldn’t be any climate change.
No, you use all the absolute junk data from the surface stations.
You are not doing anything “properly”.
Knowingly using bad data is the absolute anti-thesis of proper science.
Yes, and if you were all making pea & ham soup using the same packets of peas and the same leg of ham, you should all produce the same tasting p&h soup.
But if you each cook it for different lengths of time, each batch is gonna taste that little bit different. By about 0.004 degrees of bland.
Is there an ISO for gat constructs?
“Several people . . . .”
The unknown, made-up, supporters of this nonsense.
Which several people?
Myself and Clive Best, for a start. But also Robert Rohde, Roy Spencer, Carl Mears. And of course, NASA, NOAA and HADCRUT.
And you know that intensive properties can’t be averaged. I’m surprised that so-called scientists violate thermodynamics on a regular basis.
Just curious- but what is the meaning of “intensive properties”?
It is a property that doesn’t depend on mass basically. Take a block of iron. If you cut it into two equal pieces, the mass of each is calculated by dividing by 2. That is an extensive property.
However, if the block is at 100 degrees and you cut it into halves, the temperature of each is not calculated by dividing by two. That is an intensive property.
Think of properties that don’t change. Hardness, boiling/melting point, color are a few. Those are intensive.
Yep, but if you cut the block into two halves, the Enthalpy of each block is indeed half that of the original block. Obvious to everyone except Stokes and his ilk.
“Just curious- but what is the meaning of “intensive properties”?”
I see Mr. Gorman already answered your question. Let me state it a little differently.
Suppose you have two identical containers of water that are both at the same temperature, say 50 degrees C. Now thoroughly mix them together in such a way that neither energy nor matter are exchanged with the surroundings. The total volume of water is doubled, but the temperature remained the same. Volume is an extensive property, but temperature is an intensive property. Now halve one of the original containers such that neither energy nor matter are exchanged with the surroundings. This time the volume is reduced by one-half, but the temperature still remains unchanged.
Let’s repeat the first step, but this time one container is at 40 degrees C and the other container is at 50 degrees C. Also, the two containers are not equal in size and each contain unknown amounts of water. Again we mix the contents thoroughly together in such a way that neither energy nor matter are exchanged with the surroundings. What is the final temperature?
I presented this same scenario Mr. Stokes a couple of years ago, and he changed the problem. He specified the amount of water in each container and came up with an answer. Like Greta, she and Mr. Stokes know they are blowing smoke up our nether regions, and that “climate change” is a made-up hoax.
Actually, there’s no way to know the exact temperature of the final mixture. It will lie somewhere between 40 degrees C and 50 degrees C.
Notice the usual action by climate activists/scientists is to say the temperature is exactly 45.0 degrees C. They also violate the rules of significant figures by incorrectly adding more significance. And what exactly is an average temperature–does it represent an actual physical quantity?
There are Scientists and there are Climate “Scientists”. The latter are like Stokes, AlanJ et al, completely unable to grasp the difference between Enthalpy (an extensive property) and Temperature (an intensive property), and clueless about Metrology.
The classical logical fallacy of Appeal to Authority. You are really in the ditch of nonsense. I don’t think Roy Spencer is a great climatologist. Neither do you. But you invoke him when it seems to get you a result.
” NASA, NOAA and HADCRUT.”
An admission you are deliberately using junk surface data that even you must know is totally unfit for any indication of global temperature change.
Well done.
NOT SCIENCE.
Clive Best admits he is using “GHCN corrected land data “.
ie, manufactured and mal-manipulated junk data.
And how many priests, bishops, cardinals, and a pope told Galileo he was doing it wrong? How many told Einstein he was wrong?
You are leaning on consensus and science simply doesn’t work that way.
Clive Best is a very capable mathematician, so it’s no surprise that when he applies spherical triangulation methods to the same data-tampered products of ‘NASA, NOAA and HadCRUT’ you favor, he comes up with GAT results similar to yours.
More importantly, however, is that he is also a very capable physicist who, while he may be in the CO2 causes warming camp, is much more inclined towards adaptation than alarmism. And by the last point, I believe he strongly favors a shift towards nuclear-sourced energy, which will be needed because of the eventual depletion of fossil fuels, and disfavors wind and solar due to intermittency.
And exactly what was used to guarantee that the calculation has any meaning whatsoever. Calculating properly has many connotations. Especially when it is decided by those who are convinced they are doing it correctly!
It is circular logic personified. It is calculated correctly because I decided what is correct. What a joke.
Including the error bars?
“It” what genius?
1… Certainly no-one in their right mind would still use GISS or any of its stablemates.
2… Sea surface levels were significantly higher during the Holocene optimum, and there was far less sea ice than now… Did the world stop turning ??
3… Ocean is warmed by the SUN and probably some volcanic activity. CO2 has zero effect.
4… What evidence apart from high dubious urban surface measurements is there that Finland has warmed much at all.. “everywhere warms faster than everywhere else” according to your psycho anti-science AGW comrades… And raw data shows the whole of the Arctic was a similar temperature in the 1940s anyway..
5…. Humans have not change the geological era one tiny bit.. we are still at the cold end of the Holocene .. Yes, the anthropogenic global warming conjecture is just silly, stupid and ignorant… we all agree.
6… Yes, it is highly likely that Washington is cooler now than in the 1930s/40s… everywhere in the USA is cooler than the 1930s, 40s..
If there is a “strong” hurricane season… that is WEATHER , not climate.
Strong seasons have happened many times in the past.
….without any human causation.
Anomalies are worthless unless you use a common base for all of them, i.e., the temperature you think the globe should be at. Anomalies are a ΔT, that is, a rate of change.
Spatial weighting is also worthless when it is based on an intensive quantity that changes based on local and regional weather.
Grid cells based on latitude and longitude carry no special relationship to either temperature or weather.
I have never found a paper about spatial weighting that examined measured temperatures that were averaged and how much error was generated when validated against a station actually at the center of the two that were averaged. Perhaps you have some you can provide. To validate the procedure this weighting should provide a consistent and reliable result that matches with measured temperatures. I have never seen the physical validation done.
That is your opinion. I see no you have nothing scientific to show your opinion is legitimate.
It appears to me to generate a logical metric of absolute temperatures from over the globe.
You should explain why the divide by √n for anomalies provides an accurate standard error of the mean while dividing by √35,000 doesn’t do the same for this global temperature average. Include measurement uncertainty for both calculations while you are at it.
Opinion? Well, there has to be some speculation, because they won’t tell us anything of their methods. But they seem to update after every station that comes in. The last one, as I write, was Biak in Indonesia. Now that will put the average up. It doesn’t matter whether Biak was warmer or colder than usual; it is sure to be higher than 57F, so the average will go up. If something came in from Iceland, the temperature would go down, even if Iceland was unusually warm. That is how running averages work.
So all the index reflects is what kind of places are being sampled. And they just take what comes in.
If you average temperatures, then you get a statistical result. There is nothing in thermodynamics that allows you to average temperatures. So a statistical result involving averaging temperatures is not a physical quantity known as temperature. You’re playing math/statistical games. It has nothing to do with actual physics.
Isn’t that what a global temperature is all about?
If all the temperatures on the globe are rising because of a well mixed CO2, the global average will rise.
If all the temperature on the globe are falling, the global average will fall.
If some are rising and some are falling the global average may stay the same.
You’re going to need to put up a better description of why this isn’t meaningful than what you’ve done so far.
But you don’t measure all the temperatures on the globe. You only have a sample. You can try to sample to be representative – very hard, and no sign they are doing that. Or you can take anomalies, which removes a lot of variation that you are not interested in. But even then you have to do spatial weighting. Otherwise you just end up with average US temperature, not global, since it is so densely sampled.
That is what YOU want, to eliminate the variation. Have you EVER entertained the thought that variation might be significant in analyzing what is occurring?
I question anomalies because they don’t supply an accurate view of what is actually occurring. You have posted animations that show hot spots moving around. Why does that occur? If CO2 is causing heating in a location due to radiation, why does it not remain hot at that location as CO2 concentration continues to rise? Why can you not explain that.
If you want to debunk a global average of absolute temperatures, you will need to explain why the science behind it is faulty. If it is a 12 month rolling average, weather should not an issue since weather occurs everywhere and should be included in an average. Explain why calculating a GAT that is not an actual temperature, removes the ability to generate an actual global average absolute temperature by reversing the calculations.
And I suppose the temperatures used to calculate the GAT are designed to give better samples? Come on, you are reaching for straws made of air. Sampling is a joke both with the existing coverage and the uncertainty in measurements. Why have you not moved onto actually integrating the temperature data that is available from the last 40 odd years. HVAC engineers are beginning to do that, why can climate science not do it too? That would give you a metric that could provide a much better picture as to what the global temperature actually is.
Why not just find local and regional average temps and then average those? You want to know the real reason. This site has shown you the evidence. When you remove UHI, nowhere has the growth you need to continue demonizing CO2 as the culprit.
Why is spatial weighting needed for a global average if you are averaging temperatures from all over the globe? Spatial weighting was originally designed for use in geological research where things didn’t move around by the second. Oil deposits don’t move into different states overnight. River channels are stationary for decades and don’t change every night. Mineral deposits don’t move around every minute or mining would be impossible.
Atmospheric temperatures do have a high rate of change, literally by the second. Spatially weighting the twice a day temperature average just introduces more and more uncertainty to the real values.
Remember when that “no-name” guy published a paper on general relativity? Why, over a hundred settled scientists all signed a letter in protest stating it was wrong.
It doesn’t matter how many of a REAL (rather than a manufactured) consensus say the one guy was wrong if he got it right. (Or closer than before.)
The general relativity paper was published by Albert Einstein, professor of Physics at the Humboldt University, Berlin, and Director of the Kaiser Wilhelm Institute for Physics, and a member of the Prussian Academy of Sciences.
He gave his name and he described his methods.
In 1905, while working as a clerk in a Swiss patent office, Albert Einstein published his paper On the Electrodynamics of Moving Bodies, in which he postulated his theory of special relativity.
https://commonplaces.davidson.edu/vol6/a-brief-history-of-special-relativity/
A slight inaccuracy: Einstein was working as a Patent Examiner in Berne when he wrote his name famous paper.
“In contrast, the real-time surface station temperature measurements from Temperature.global report that temperature remained cooler than at the height of the prior El Niño during 2015-2016.”
It’s almost as if UAH satellite data is more accurate than an undocumented process published on an anonymous web site.
Note, according to temperature.com, 2016 was 0.27°C below normal. In fact every year since their records began have been below normal, although 2020 was only 0.00°C below normal. Which implies 2020 was some 0.27°C warmer than 2016. In fact 5 years, including the last three were warmer than 2016, assuming you put any faith in their mysterious method.
I do badly need one of those thermometers that shows 0.27C.
Last Tuesday at 6.06.23am I checked my balcony thermometer and it was stuck just above the 0c marker.
I could FEEL that it should have been 0.53C, so I felt very undecided about what to wear to take the dog out for a walk.
NOAA specifies ASOS stations as ±1.8°F and CRN as ±0.3°C (±0.54°F). Funny how you never see that mentioned when averages are quoted.
Those don’t even begin to addreß LIG thermometer measurement uncertainty.
“Schmidt acknowledges that emissions-based climate models don’t explain the apparent ongoing warming that started in July 2023.”
So it still hasn’t even been a year yet. Less than a year! That should be the only clue you need to know that this isn’t”emissions based”. El Niño and Tonga doing the tango in tandem is more like it…
We just happen to be near the tail-end of a very solid El Nino energy release, that started earlier in the year than usual, heated the atmosphere very quickly, and has lasted a lot longer than previous El Nino releases.
Absolutely no evidence of any human causation. !
“El Niño and Tonga doing…”
I suspect there will be evidence that whole region around HT has been more active than usual.
Add in the increase in absorbed solar radiation in the tropics and that’s a lot of energy that has to go somewhere.
The Hunga-Tonga eruption was a very unusual event.
The only very unusual event to take place before this current warming occurred.
That doesn’t mean it is connected to a temperature increase, but it doesn’t mean it isn’t, either.
I think we will know eventually, one way or the other.
story tip
The Epoch Times
Biggest Corporate Welfare Scam of All Time
More than enough to build out conventional generation. What a waste.
…and yet we are constantly told that Oil and Gas companies are being subsidized.
Citing temperature.global is just throwing spaghetti at the wall to see what sticks.
It is no more so than the GAT. GAT isn’t even a temperature, it is a ΔT, that is, a (change/time).
Here is a question about the anomalies used to calculate the GAT. Why does an area warm for a while then the warming moves on to another area? Don’t say weather because it is supposed to be climate. Watch any animation and watch the land. With well mixed CO2, once a area warms it should stay stationary but it doesn’t. Something else is going on,
Uncertainty.
Global warming affecting time?
The length of day has increased by an unprecedented 2 milliseconds since 1830. 🫣
2 milliseconds? Since 1830? I’ve seen estimates of 2 milliseconds per century. It may be 2 milliseconds since 1830, or it may be more. It’s obvious that the Earth’s rotation is slowing due to tidal effects; and not due to climate change.
Earth rotates once in about 24 hours with respect to the Sun, but once every 23 hours, 56 minutes and 4 seconds with respect to other distant stars (see below). Earth’s rotation is slowing slightly with time; thus, a day was shorter in the past. This is due to the tidal effects the Moon has on Earth’s rotation. Atomic clocks show that the modern day is longer by about 1.7 milliseconds than a century ago,[1] slowly increasing the rate at which UTCis adjusted by leap seconds. Analysis of historical astronomical records shows a slowing trend; the length of a day increased by about 2.3 milliseconds per century since the 8th century BCE.[2]
Scientists reported that in 2020 Earth had started spinning faster, after consistently spinning slower than 86,400 seconds per day in the decades before. On June 29, 2022, Earth’s spin was completed in 1.59 milliseconds under 24 hours, setting a new record.[3] Because of that trend, engineers worldwide are discussing a ‘negative leap second’ and other possible timekeeping measures.[4]
This increase in speed is thought to be due to various factors, including the complex motion of its molten core, oceans, and atmosphere, the effect of celestial bodies such as the Moon, and possibly climate change, which is causing the ice at Earth’s poles to melt. The masses of ice account for the Earth’s shape being that of an oblate spheroid, bulging around the equator. When these masses are reduced, the poles rebound from the loss of weight, and Earth becomes more spherical, which has the effect of bringing mass closer to its centre of gravity. Conservation of angular momentum dictates that a mass distributed more closely around its centre of gravity spins faster.[5]
Emphasis mine. From https://en.wikipedia.org/wiki/Earth's_rotation
So the Earth’s oblate spherical shape is due to climate change. That’s a good one. Jupiter must be undergoing enormous climate change.
I’m intrigued by the growing support for this year potentially being a record Hurricane year.
I seem to recall that was what was said last year around this time? Last year was not a record hurricane year.
The thing is, about the constant threat of a record hurricane year. If you say it every year, then one year you will definitely be right….
“I seem to recall that was what was said last year around this time?”
Only by some climate scare-scammers
Joe Bastardi said it would be a near normal year… he was spot on !
Someone perhaps to take notice of.
If there is a “strong” hurricane season… that is WEATHER , not climate.
Strong seasons have happened many times in the past.
….without any human causation.
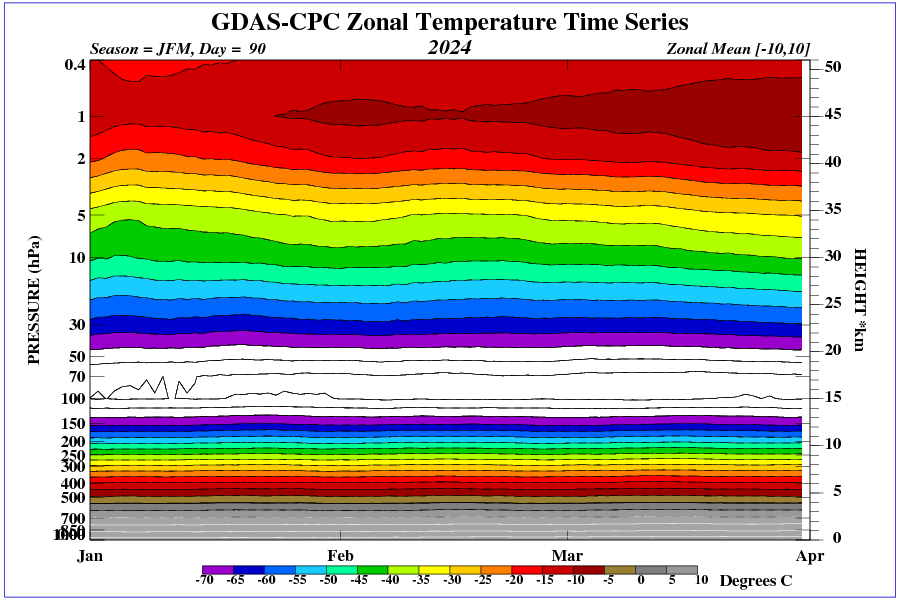
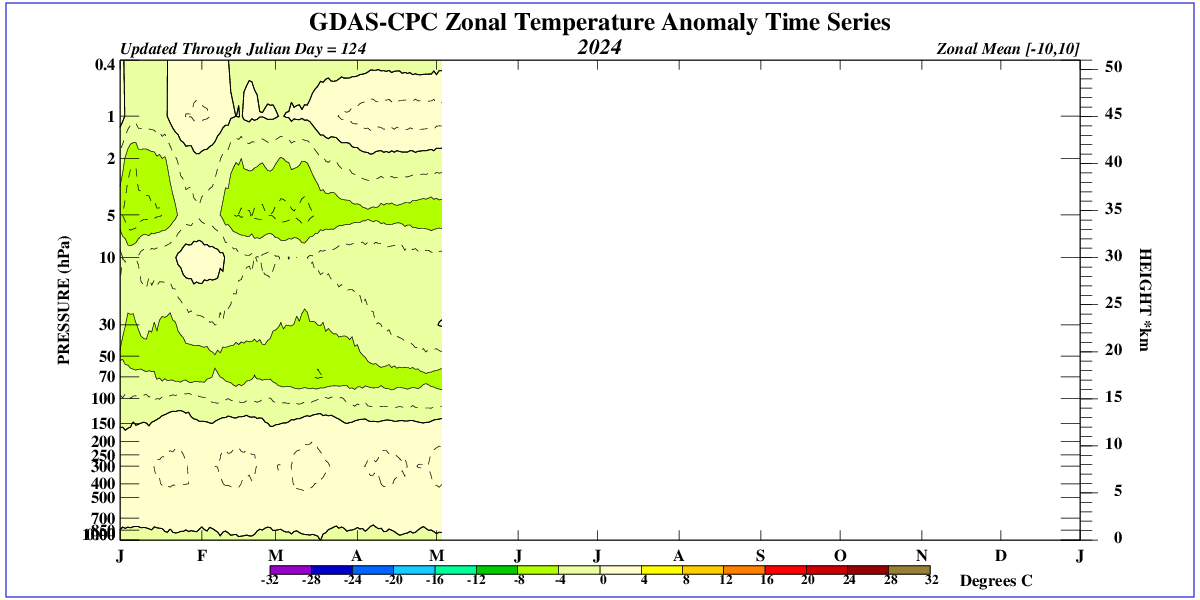
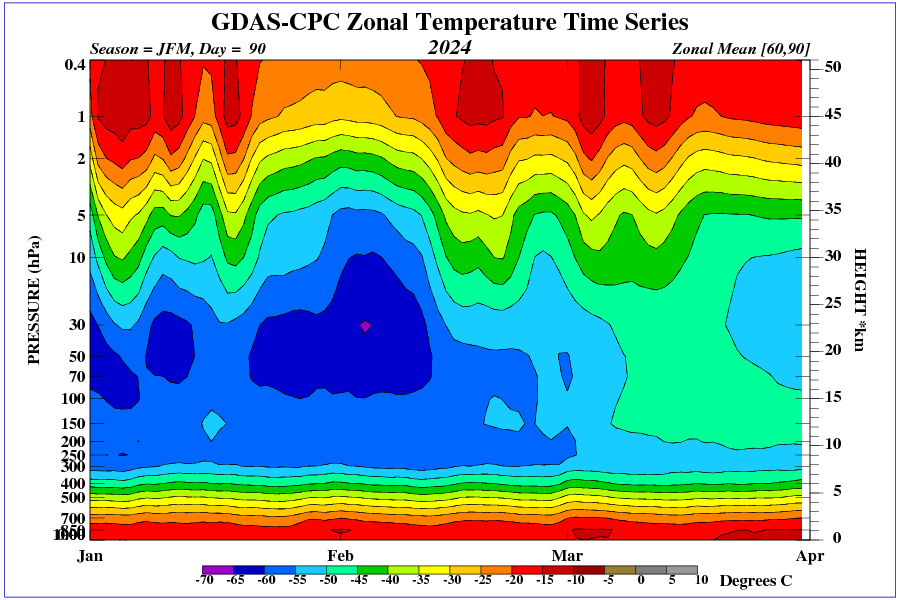
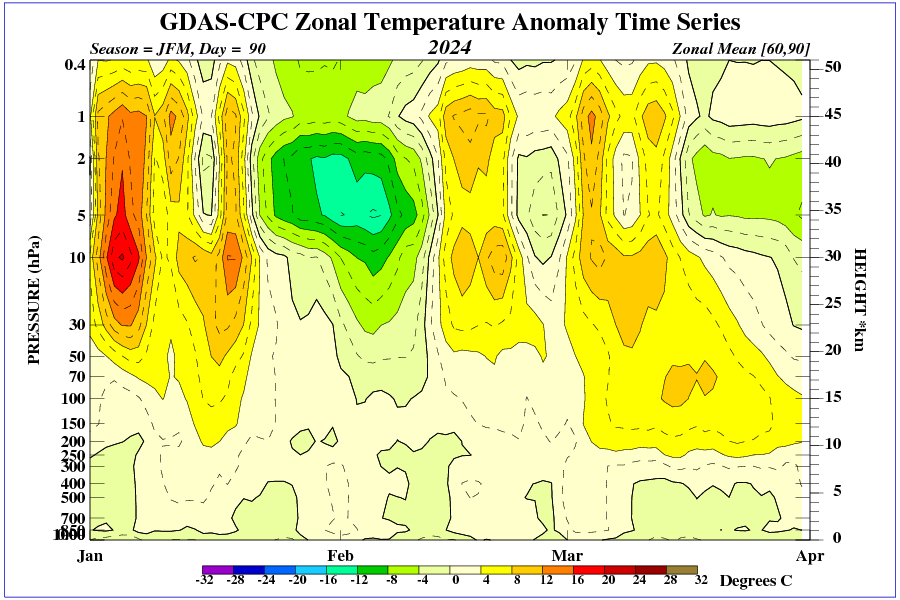
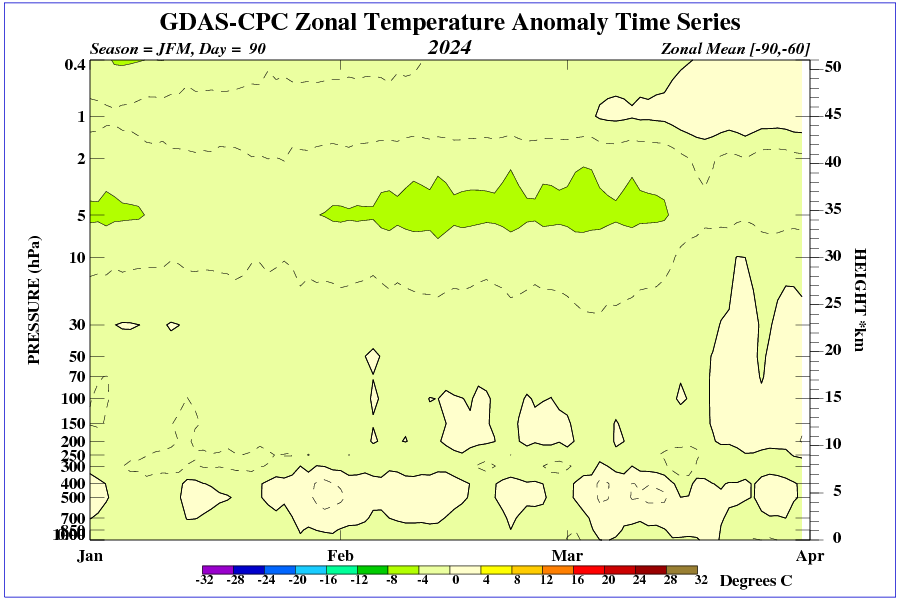
What the satellites show.
At least one of those stories about slowing earth rotation noted that we are likely to need a “negative” leap second, which has not been done before, and computers are not programmed to handle this. But wait…this is due to poorly understood changes in the earth’s molten core that are causing speeding up rather than slowing down! Going the other way, and adding an occasional positive leap second, has already happened several times and is not much of a problem, and this is due to unrelated processes like tidal friction (and maaaaybe melting of ice caps.) But you know what the headline has to be: GLOBAL WARMING IS MESSING UP OUR CLOCKS!
There are so many factors to consider about this. I always think of orbital stuff. Look at this animation and think about the sun pulling us, planets, asteroids, comets, etc. along and all the small things that could modify stuff on earth.
https://youtube.com/shorts/iBzwzDDkZLo?si=Hp755z7jE01IeqLi
Seems like NASA Satellite jumped on the climate bandwagon. Anyway to check the data coming from the satellite and the calibration of the sensors. The question is: ‘is this bad science or fraud science’?
And check it’s orbit and time frame measurement and how many measurements. With Algorithms these day it would be easy to fudge.. .and skew the measurements
When GOCE and GRACE programs did prove their climate-sea ice hypothesis they ended those programs. It’s much cheaper to fudge.
The problem, say experts, is that an increasing number of USHCN’s stations don’t exist anymore.
“They are physically gone—but still report data—like magic,” said Lt. Col. John Shewchuk, a certified consulting meteorologist.
“NOAA fabricates temperature data for more than 30 percent of the 1,218 USHCN reporting stations that no longer exist.”
He calls them “ghost” stations.
Mr. Shewchuck said USHCN stations reached a maximum of 1,218 stations in 1957, but after 1990 the number of active stations began declining due to aging equipment and personnel retirements.
NOAA still records data from these ghost stations by taking the temperature readings from surrounding stations, and recording their average for the ghost station, followed by an “E,” for estimate.
Authored by Katie Spence via The Epoch Times
Makes you wonder what the measurement uncertainty is for all those “estimates” and how it affects the average.
Basically, a very significant proportion of surface data is just MADE-UP-JUNK, using other JUNK data as a guide to their fabrications.
This is not remotely science.. it is deliberate FAKERY !!
Not just junk, but junk that is ‘coincidentally’ highly correlated with the increase in CO2.
It is important to be aware that the temperature of the troposphere and the temperature near the surface are not closely related. In the troposphere can radiate aerosol, water vapor, clouds, micro volcanic dust, etc. Satellite sensors pick up the wavelength of radiation and convert it to temperature. For example, at the top of the stratosphere, sensors pick up a high temperature, and the lowest temperature is always in the tropopause at level about 100 hPa.
70 percent of the Earth’s surface is covered by oceans. Due to the fairly constant density of the troposphere and the constant average global pressure, the ocean surface temperature in the tropics does not exceed 31 degrees C. During El Niño, the surface area of the warm ocean in the tropics increases significantly, but the temperature is always below 31 C.