The BBC More or Less radio programme recently ‘fact checked’ the Daily Sceptic’s report that sea ice in the Arctic had soared to its highest level for 21 years on January 8th this year. Alas, the report was confirmed to be true so the Beeb went down the ‘cherry pick’ line of attack. Curiously missing from the programme was any mention that the article dealt mainly with long term trends in Arctic sea ice and concentrated on scientific evidence that showed at least a decade-long slow recovery. The ‘fact check’ did little more than confirm the widely held suspicion that many BBC programmes are now infected with a need to crowbar a climate catastrophe narrative into broadcast messages.
Being accused of “cherry picking” by an organisation that routinely catastrophises bad weather events is of course risible. Taking lessons from a state-reliant operation that can publish a recent story from a “science correspondent” that starts, “Climate change threatens to ‘call time’ on the great British pint”, is also laughable. The 21-year high on January 8th was clearly identified as part of a number of short and long term trends, and in the third paragraph of the article it was noted that ”we must be careful not to follow alarmists down their chosen political path of cherry-picking and warning of climate collapse on the basis of individual events”.
It is evident that the BBC did little investigative work on the matter despite More or Less priding itself on checking statistics and data. Instead it relied on the usual ‘scientists say’, in this case Professor Julienne Stroeve. The UCL “Earth Scientist” attempted to muddy the Arctic sea ice waters by suggesting the ice extent is thinner, but presenter Tom Colls had to admit, “the data is not available yet”.
If you pick a particular day, you might just be talking about the weather, states Colls. There is no correlation between winter sea ice extent and how much the ice will melt in the summer, added Stroeve. What you see since 1979, continued Stroeve, is that the trend in Arctic sea ice is downwards for four decades. The overall decline in long term Arctic sea ice is very easy to see, adds Colls.
If you ‘cherry pick’ the date 1979, probably the high point for Arctic sea ice for almost a century, and draw a line to the present day, the cyclical trend is undoubtedly down. There was more ice around at the high point in 1979 than there is now, nobody disputes that. If you are just after a simple political message of climate collapse to promote the Net Zero fantasy, further examination of the data will be unwelcome. But a more detailed review of the statistics gives a more realistic interpretation. According to recent work published by the Arctic scientist Allan Astrup Jensen, the summer ice plateaued from 1979-97, fell for 10 years and then resumed a minimal downward trend from 2007. Jensen observes that either side of the 10 year fall after 1997, there have been minimal losses.
In fact using a four-year moving average, the trend has been slightly upwards over the last few years. The graph below is compiled by the investigative science writer Tony Heller and shows the recent stability of Arctic summer sea ice around the minimum recorded every September. A slight recovery from about 2012 can be clearly seen.

As we can see, More or Less has produced little more than a narrative-driven attempt to keep the Arctic sea ice poster scare going for as long as possible. Since the drop in the early part of the century, alarmists have been forecasting ice free summers in the Arctic in the near future. Sir David Attenborough told BBC viewers in 2022 that the Arctic could be ice free by 2035. Professor Stroeve claims to have briefed former U.S. Vice President Al Gore, a man who has never lived down reporting that the ice could all be gone by 2014. In fact what has clearly been happening is noted by Tony Heller. They bury the old data going back to the 1950s, “and pretend they don’t notice sea ice is increasing again”. Nevertheless activists are starting to learn lessons about putting short timelines on their fanciful forecasts. For her part, Stroeve suggests ice free summers in the Arctic by the next 50 years.
Meanwhile, after the ‘hottest year ever’, the maximum winter sea ice for 2024 was recorded on March 14th at 15.01 million sq kms. Polar bear scientist Susan Crockford noted that the ‘U.S. headline writers’ at the National Snow and Ice Data Centre said it was below the average for 1981-2010. Indeed it was, although this year’s total was within two standard deviations, states Crockford. But why compare the a 30-year average to 2010 when another decade of data to 2020 is available? Cynics might note that taking out the higher totals of 40 years ago and replacing them with the lower recent figures would produce – more or less – an above average maximum in 2024.
Chris Morrison is the Daily Sceptic’s Environment Editor.
Ice thickness can be estimated but not directly measured.
“Ice thickness can be estimated but not directly measured”.
Meanwhile BBC personnel thickness can be measured and is always underestimated …
Actually ice thickness CAN be measured, using an aerial EM device, typically deployed from a helicopter. Of course, it’s not practical to try and cover the entire ice cap with helicopters, but representative measurements can be collected and averaged.
It’s measured by satellites (ICESat, CryoSat-2 and ICESat-2), and far from being stable the volume of sea ice has declined significantly over the last 20 years.
Volume, like extent, has gone sideways to up in this century.
Very funny actually.
Phil posts a graph that actually supports that fact that sea ice extent and volume, have bother levelled off.
Thanks Phil. !! 🙂
Now shoot yourself in the other foot. !
Unlike you I provide complete data and don’t truncate it where it suits. What I pointed out is that it has not been ‘remarkably stable’ over the last twenty years as you claimed.
Take the blinkers off your eyes, muppet
From 2010 it is a bout zero trend.. and is upwards in the last several years.
You have started at the extreme anomalous high of 1979. that drove Arctic sea life out of the Arctic.
Still ignoring the fact that current levels are FAR ABOVE most of the last 10,000 years.
Really, can’t read a graph Milo? This century starts in 2001, at that point volume anomaly was about +3000 km^3 currently it’s ~-5000 km^3. No way is that ‘sideways’ or ‘up’!
It’s a shame that the ice hasn’t completely melted away for the sake of Arctic wildlife that has been extremely hurt by the ravages of the ice ages over last few million years – it’s not the norm: for hundreds of millions of years both poles teemed with life and were ice free.
I didn’t say for the whole century. The trend starts in 2007.
You said: “Volume, like extent, has gone sideways to up in this century.”
Your description doesn’t match with the reality of a decline from 3000 to -5000.
To properly chart a trend on oscillating data, you have to go from trough to trough or from peak to peak.
As we don’t know the peak yet for this year, I have graphed Piomas data from the trough of 2011, to the trough of 2023.
Notice anything !
Thanks for bring to notice the FACT that even the Arctic ice volume has been zero trend for the last 12 years.
Well done Phil. 🙂
But you said ‘remarkably stable for the last 20 years’ not the last 12, as I pointed out that is not the case.
The extent has been…. Get over it, FAIL !!
Note. the near zero-trend in the volume since 2010 and a definite +ve trend over the last several years
The RECOVERY from the extreme high of 1979 has stopped… more’s the pity.
But at least some sea creatures have been able to return, and the Arctic food source has become viable again.
Don’t hate Arctic sea creatures so much that you think having the Arctic choked with sea ice all year is a good thing… It isn’t.
Fact is, current levels are still anomalously HIGH compared to most of the last 10,000 years.
There is still ONE HECK OF A LOT of sea ice up there. !
Your chart suggests that since 2018, the ice volume has been trending up.
Well bouncing around after all the old multiyear ice ran out.
You mean the anomalously high amount of ice that drove Arctic sea life away.?
What sort of despicable anti-sea-life cretin are you. !!
Not a cretin like you who thinks that accurately reporting data about sea ice somehow renders one ‘anti-sea-life’!
Still HATING Arctic sea life.. Still thinking that having the Arctic choked by sea ice all year is a good thing.
Tell us that you think the recovery from the extreme extent of 1979 is good for Arctic sea life..
Let me see you make the statement that the drop in sea ice extent is highly beneficial.
You know you are still trying to push some wacko AGW nonsense.
That make you a cretin.
I certainly don’t “hate Arctic sea life” and have never said so, I’ve just commented on the sea ice data. It’s not clear where the balance will be regarding the effect of a drop in sea ice, some species might benefit and others might not.
See for example: https://alaskabeacon.com/briefs/the-bottom-of-the-bering-and-chukchi-seas-could-become-too-warm-for-some-important-species/
please, if the graph of naturally variable data is plotted with a brilliantly straight line superimposed, just dont use it anywhere except at childrens parties.
But then having said that why not use it anyway, people will see it and it will re-inforce their opinion that the compiler is not one of the thinking types of people.
Satellites can measure extent, not volume. EM sensors have a difficult time penetrating through thick ice.
I thought they had developed radar that could measure sea ice thickness.
Satellites measure height of sea ice with radar altimeters.
True, but that does not necessarily measure thickness. It can measure the height of the surface of the ice above the surface of the ocean, but it can’t detect cavities, bubbles, or other variations on the water side of the ice floe.
Such occurrences will change the density so the measured volume will not be effected.
Arctic sea ice extent yesterday was not only far above its 2011-20 average for that date, but even higher than for 2001-10.
So far this decade’s average winter maximum and summer minima beat last decade’s.
https://nsidc.org/arcticseaicenews/charctic-interactive-sea-ice-graph/
When this alarmist meme goes to meme heaven, what will be Warmunistas’ lame excuse?
Not only that, if you click on ALL the years on the NSIDC graph, you’ll see that only 1/4 million sq. Km. more sea ice and we would be right on the average since 1979….
It’s surprising that even today’s extent is almost a half million sq km greater than 1974’s maximum reported by Parkinson 1989.
They won’t bother with a lame excuse. They will just move on to the next scare.
Yup, the old Arctic Ice Death Spiral graph hasn’t been issued for a long time….here it is for posterity….
This is how I usually saw it:
https://svs.gsfc.nasa.gov/5028/
Prince Albert made such a big deal about Arctic sea ice that it will be hard for Climastrologists simply to ignore its trend reversal, proving realists again right. It’s the cycles!
They won’t need no steenking excuse! They’ll just cease to mention, and if anyone asks about it they’ll claim the opposite. We’ve seen it happen before!
Your chart is not working !!
But yes, Arctic sea ice has been remarkably stable for the last 20 years
STILL working the faux y range to hide the decline. Here is the part of the actual decline range for your average data.
Trend Probability of >/=
-0.04 8%
-0.035 19%
-0.03 37%
-0.027 50%
-0.020 78%
-0.015 90%
-0.010 97%
-0.005 99%
0.000 100%
Is the ice still there, Bob?
Did it go away? No.
Probability you’ll get this right? Vanishingly small.
“Is the ice still there, Bob?”
Yes
“Did it go away?”
No
Looks like you got distracted and forgot the last question.
“Is it going away?”
Yup. Even during the statistically insignificant period cherried by bnice2000. And over longer, physically and statistically significant time periods w.r.t. modern anthropogenic climactic forcings, relatively fast.
Nope.
You tie yourself up – is that a recognised form of masochism? – in your silly game of cherry picked statistical beach volleyball.
Get back to me when the ice really does go.
Digging even deeper. Folks, innumeracy abounds here. Your charge is pure projection – at bnice2000.
FYI, using a proper evaluative range, 1979-2023, the one sigma trend is for -0.052 +/-0.003
Here is the probability range. Why is it so much tighter than bnice’s? Because there’s more, tighter, data…
Value Prob </=
-0.06 0.08%
-0.0595 0.15%
-0.059 0.28%
-0.0585 0.49%
-0.058 0.84%
-0.0575 1.39%
-0.057 2.23%
-0.0565 3.46%
-0.056 5.19%
-0.0555 7.55%
-0.055 10.65%
-0.0545 14.58%
-0.054 19.38%
-0.0535 25.04%
-0.053 31.47%
-0.0525 38.52%
-0.052 45.97%
-0.051734783 50.00%
-0.0515 53.57%
-0.051 61.04%
-0.0505 68.12%
-0.05 74.59%
-0.0495 80.30%
-0.049 85.16%
-0.0485 89.14%
-0.048 92.29%
-0.0475 94.69%
-0.047 96.45%
-0.0465 97.71%
-0.046 98.56%
-0.0455 99.13%
-0.045 99.49%
-0.0445 99.71%
-0.044 99.84%
-0.0435 99.92%
-0.043 99.96%
Hey, sig dig Cliffie Claviners. Since the one sigma standard error has it’s first mention at 3 sig figs, I agree that all of the trends should be so rounded. Suggested penitence?
That’s enough internet for the day.
True. Here in superterranea, there’s lots else worth doin’. So, with the predictable deflections, instead of data based rebuts, I’m oota here..
your outa ya mind. !! in absolute DESPERATION. !
“there’s lots else worth doin”
Maybe you could go clean out your grease-trap… needs doing.
And will have more effect than your desperately feeble attempts to DENY the stability of Arctic sea ice over that last 20 years.
greasy-blob’s handlers need to step in… before he makes even more of a fool of himself.
What a complete and utter FAILURE.
Your innumeracy does abound.
We are talking 20 years.. why start at 1979.
You really are a mathematical moron.
Ice has been remarkably stable for 20 years.
GET OVER IT !!
The greasy blob thinks it linear.
DUMB and becoming DUMBER with each post he makes.
And over a longer period……
Arctic sea ice extent is in the top 5% or so of the Holocene..
Unfortunately, the RECOVERY from the extreme high of 1979 has levelled off way above the Holocene norm…
… but it has recovered enough to allow sea creatures not in evidence since before the LIA to return.
There is still one heck of a lot of sea ice up there.
And speaking of cherry picking, here comes Bob with his world class examples.
Sea ice extent is lot greater today than it was during the medieval, roman, Egyptian and Minoan warm periods. Summer sea ice actually did disappear during the Holocene optimum.
But the only time period Bob wants to talk about is either the high stand of the an70’s, or the extent that existed during the little ice age.
“ anthropogenic climactic forcings”
Only proven anthropogenic forcings are population/urban/airport warming and data maladjustment…
Neither of these effect Arctic Sea Ice.
“>/=” s/b “</=”
bigoilbob regrets the error…
blob is one total error….
Arctic sea ice has been remarkably stable for 20 years.
Get over it. !!
Poor blob.
I use the real numbers , starting at zero on the y axis.
Sorry if reality is hard for you to grasp.
Here is MASIE since 2006…
..remarkably stable.. 🙂
Here is OSI (Norway) since 2005
.. remarkably stable.
Sea ice extent, or loss of glaciers as well, is a red herring. Sea ice loss does not prove their climate change theory. This is simply what happens in interglacial periods. It’s normal, and part of a long term trend before industrialization. Don’t get roped into their false arguments. Sea ice could disappaer and it doesn’t mean it’s because of man or CO2.
It is impossible for CO2 to be the driver of warmer temperatures, despite their habit of just repeating it ad nauseum until they assume it’s true. It is well known and accepted that temperature increases result in higher CO2 through ocean outgassing. If CO2 drives temperature which drives CO2 (which would then drive higher temps, which would then drive higher CO2, and on and on), we would see nothing but runaway warming in the temperature record until some other limit is reached. We don’t see that. No alarmist can reconcile this simple fact.
Obviously the atmosphere within entire arctic is below freezing most of the year (October through April), but what is more variable and much more determinative of sea ice extent is oceanic temperatures due to variances in oceanic currents. We know that oceanic currents vary quite a bit due to the knowledge of the currents that flow out and in from the Atlantic (a much larger impact than Pacific currents that are constrained to flow through the narrow Bering Strait). These currents enter the Arctic Ocean and significantly affect the extent and thickness of sea ice.
Hear hear. Take a look at the Keeling curve for the years when doom pixie Greta Thunberg’s dream came true – the COVID deindustrialisation. Did the idiosyncratic shape of the magnified sawtooth change one whit? Of course not. It’s natural
More or Less is another BBC joke, supposedly busting bad statistics whilst maintaining the narrative in question.
its April fools day…
Prince Harry and Meghan Markle to change titles to Duke and Duchess of Hollywoodhttps://www.express.co.uk/news/royal/1882363/prince-harry-meghan-markle-duke-duchess-hollywood-title-change
Even the real jokes are lame
Not so funny…
BBC admits its weather app highlights the worst of the forecastBroadcaster says its smartphone service deliberately chooses the gloomiest weather each day for its ‘headline symbol’
https://www.telegraph.co.uk/news/2024/03/31/bbc-weather-app-chooses-gloomiest-forecast-each-day/
The BBC don’t do April Fool spoofs any more, as no one can tell the difference between their daily news output and made up nonsense….
The BBC takes us for fools
Story Tip
Australian PM & Energy Minister take two separate private jets, fly to Hunter Valley N.S.W. to spruik solar panels.
Hypocrisy’: Sky News host slams Bowen’s ‘renewables zealotry’ after private jet controversy
yeah both their fat heads wouldnt fit in the same plane?
Since the beginning of March, the extent of ice in the Barents Sea has increased by 300,000 square kilometers.
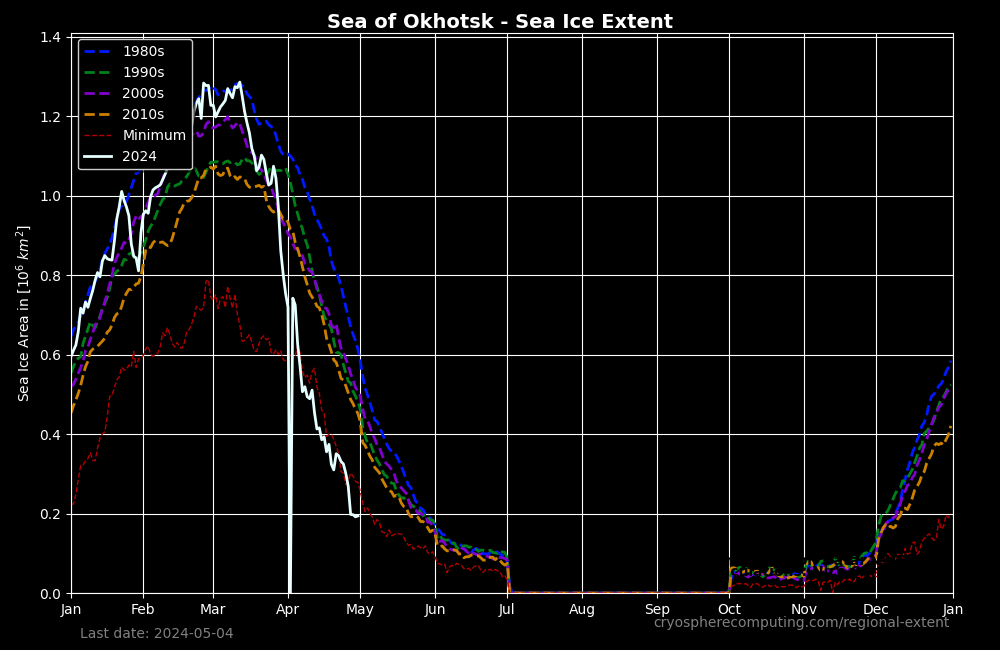
And since the middle of March the sea of Okhotsk has dropped by a similar amount.
SO WHAT !!!
While as pointed out one peripheral sea increased in area another decreased by a similar margin.
By the way the Okhotsk area is currently below the 2010s average and the 2000s average.
Current area ~600,000.
Just plain WRONG.. or deliberately LYING.. which is it. ! FAIL !!!
MASIE give the area in Okhotsk as 862938.8 km2
(looks like you need to click the image to see it properly)
Okhotsk actually peaked very high (near maximum in MASIE data)… thick red line in chart below….
… and is still well above the 2006-2023 average.
We will have to change your name to FAIL instead of Phil. !!!
Ireneusz’ chart also says Okhotsk is about 900,000 km²
I wonder where “fail” pulled his 600,000 value from…… we can all guess !!!
I said sea ice area not extent:
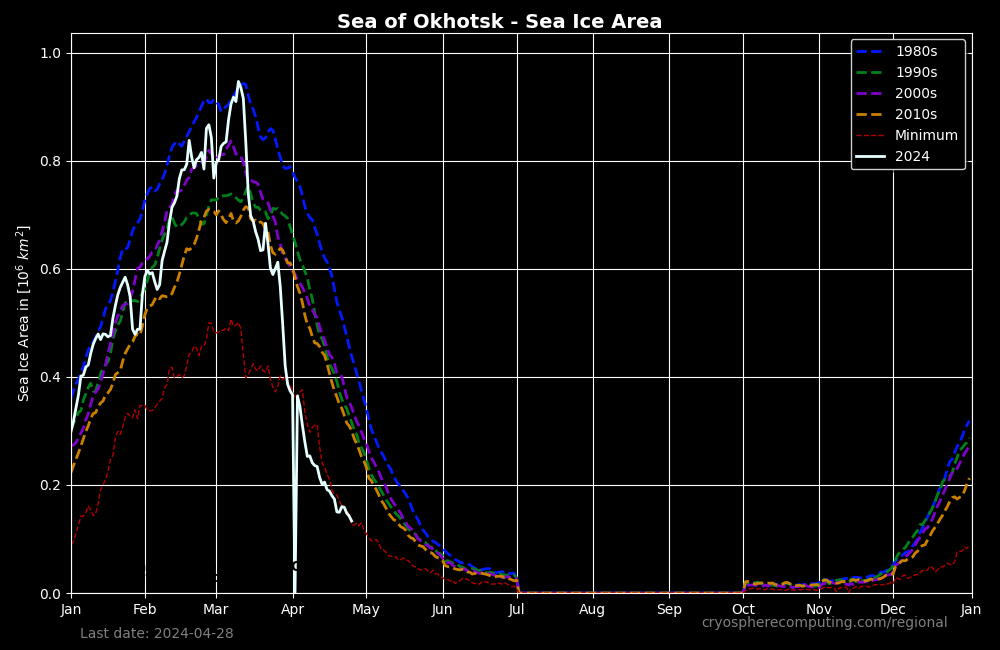
Ireneusz showed about 800,000 km² extent and it’s currently ~700,000 km²
The satellite lost some signal today, hence the sudden drop on the graph
Tony Heller’s latest video is relevant.
Hiding And Rewriting History
Current Arctic temperatures near the surface.


BBC obviously didn’t check with Dr. Roy.
Could Arctic Sea Ice Decline be Caused by the Arctic Oscillation? « Roy Spencer, PhD (drroyspencer.com)
This chart shows normalised sea ice anomaly vs AMO (note reverse right axis)
WSO solar magnetic field observations for March 20, 2024.
http://wso.stanford.edu/gifs/Polar.gif
http://wso.stanford.edu/gifs/north.gif
http://wso.stanford.edu/gifs/south.gif
Any time period that fails to support the CAGW narrative, is by definition “cherry picked”.
Just like any person who disagrees with the CAGW narrative,m is by definition, “not a scientist”.
“not a scientist” is part of it, but DENIER is the rest.
I am a climate realist.
The circulation over the North Pole has reversed, and the ice in the Greenland Sea is growing again.

Wake me up when their is a fire sale of beachfront mansions.
Bingo.