In Climate: The Movie, William Happer, the former physics professor at Princeton, describes the Central England Temperature (CET) record as a “world treasure” since it provides continuous recordings from 1659 – over 350 years. It shows a rise just over 1°C from the depths of the Little Ice Age to the present day. These days, the CET is under the control of the politicised Met Office, keen to catastrophise weather and climate in the interest of promoting Net Zero. Recent revisions have retrospectively cooled the near past and boosted readings from the last 20 years. In addition, the Daily Sceptic can reveal that two of the three measuring stations currently used to add to this scientific treasure are taken from near-junk class 4 sites that come with official ‘uncertainties’ of up to 2°C.
Class 4 site Pershore College was added in 2006 and joined Stonyhurst, also class 4. The other site Rothamsted is a pristine class 1 site and is deemed to provide an accurate reading of the surrounding air temperature away from natural and artificial heat corruptions. Classification and ‘uncertainties’ by class are set by the World Meteorological Organisation (WMO). Quite why the Met Office can’t find three class 1 sites in the whole central England area is a bit of a mystery, although a clue might be provided by the recent freedom of information request the Daily Sceptic made to the organisation. We discovered that nearly eight out of 10 Met Office measuring stations across the United Kingdom were sited in near-junk class 4 and junk class 5. The latter class comes with WMO prescribed ‘uncertainties’ up to 5°C. Class 1 sites number just 24 and make up only 6.3% of the total.
At the very least, given the scientific importance of the CET, the Met Office could at least move the stations to more suitable nearby locations away from the disqualifying heat corruptions.
But if adding near-junk figures to the collection is not bad enough, the investigative science writer Paul Homewood last year discovered considerable tampering in 2022 with the recent CET record. He initially found that in version one, the summer of 1995 had been 0.1°C warmer than 2018. In version 2, the two years swapped places with 1995 cooled by 0.07°C and 2018 warmed by 0.13°C. Alerted to these changes, Homewood then analysed the full record from version 1 to 2, and the graph below shows what he found.

As can be seen, the adjustments up to 1970 are small with ups and downs offsetting each other. Homewood then found that the years from 1970 to 2003 had been cooled markedly, followed by significant rises to 2022. Homewood concludes that “unfortunately it is part of a much wider tampering with temperature globally – and the tampering is always one way, cooling the past and heating the present”. Given that we now know that the Met Office has been using class 4 statistics for two thirds of its database since 2006, the recent higher adjustments would seem to call for clarifying explanations from the state-funded Met Office.
But explanations from the Met Office are thin on the ground. It continues to promote a 60 second spike to 40.3°C at RAF Coningsby at 3.12pm on July 19 in 2022 as a U.K. temperature record, despite the known presence of three typhoon jets attempting to land around the same time. The record has become a national joke, even more so after the Daily Sceptic revealed that Coningsby is a class 3 site with an ‘uncertainty’ of 1°C. All that can be said is that at least Coningsby replaced the previous class 5 record set at Cambridge Botanic Gardens in 2019.
Last month, the Daily Sceptic analysed all the heat records declared by the Met Office since 2000 and found that all bar two should be disqualified. Many of them had been set in junk class 5 and most of the rest were in class 4. Using its highly compromised data with massive ‘uncertainties’ rife throughout the database, the Met Office publicises precision down to one hundredth of a degree, declaring, for instance, that last year was only 0.06°C cooler than the ‘record’ year of 2022. Paul Homewood suggests that if the Met Office wants to continue using its existing station measurements, it should show a warning that the margin of error is so great, “that they have no statistical significance at all”.
The Met Office refuses to return all calls from the Daily Sceptic. We would be more than happy to report any explanations it might have, and discuss its work, if required, in public. Alas, to date, communication has been brief and, frankly, a bit childish. Last December, we reported on a Met Office proposal to ditch a 30-year temperature trend in favour of a Net Zero-supporting merger of 10 years’ past data with 10 years’ future model predictions. Thus, it would be easier to spot when the 1.5°C threshold was crossed, it was argued. Noting that we had taken three weeks to report the plan, Professor Richard Betts, lead author and head of climate impacts, tweeted: “I suppose our paper does use big words like ‘temperature’ so maybe they had to get a grown-up to help”.
Chris Morrison is the Daily Sceptic’s Environment Editor.
The last line shows that not only rides the met office roughshod over the data it also has utter contempt for the people it is supposed to serve.
Betts never deserved the high level of respect that has been afforded to him at this site. He has and always will put his ego and economic well being ahead of the truth.
We all know about Climategate. They lay it out in the emails. Suppressing inconvenient papers – “Kevin [Trenberth] and I will keep them out somehow, even if we have to redefine what the peer-review literature is!” —Dr. Phil Jones, Director of the Climatic Research Unit. And many, many more.
“Why should I make the data available to you, when your aim is to try to find something wrong with it…” —Dr. Phil Jones
“I’m getting hassled by a couple of people to release the CRU station temperature data. Don’t any of you three tell anybody that the UK has a Freedom of Information Act.” —Dr. Phil Jones
There’s even a little magic in it; “I’ve just completed Mike’s [Mann] Nature trick” Dr. Phil Jones.
We all know what went on, but Auntie was determined to set us straight.
“‘This is a story that needs to be told’
Jones faces a repeat of that grim onslaught when the BBC One film, The Trick, is screened on 18 October. It will tell the story, sympathetically, of his tribulations at the hands of climate change deniers.
…
Now, ahead of the Cop26 climate talks in Glasgow in early November, the story is to be resurrected. “It is a cautionary tale, as well as a love story and a bit of a thriller,” said director Pip Broughton. “This is a film for everyone to enjoy, so it does condense some complexities. But it enables anyone to see this man has suffered a great injustice.
https://www.theguardian.com/environment/2021/oct/10/this-is-a-story-that-needs-to-be-told-bbc-film-tackles-climategate-scandal
The alarmists don’t do ‘I was wrong’, nor do they do contrition. What they can do in spades is hubris and arrogance.
Climategate was whitewashed – much as was expected. The BBC followed up in time and did as spectacular job of making a rather haughty doctrinal scientist into a poor vulnerable visionary attacked by the Mannian mob simply for doing his work.
You can request as many FOIs as you like. You will only ever read about them on sites such as WUWT. Right now the government is waiting on various groups – e.g. post office sub postmasters, tainted blood products – to die off before it will pay out.
That’s how the UK works.
““Why should I make the data available to you, when your aim is to try to find something wrong with it…” —Dr. Phil Jones”
I think Phil Jones is the problem, even more so than Michael Mann.
Jones is the one who bastardized the global instrument-era temperature record and refused to show how he reached his conclusions. All the other bastardized databases depend on the bastardization of the records by Jones. That’s why they all look alike, with a similar “hotter and hotter and hotter” temperature profile. for the period after the end of the Little Ice Age, in the middle 1800’s.
Jones added in ficticious sea surface temperatures to the global record (he had no actual data, with a few exceptions) as a means of cooling the past, to make the present look like it is getting hotter and hotter and hotter, as a means of promoting the bogus Catastrophic Anthropogenic Global Warming (CAGW) scam.
The true global temperature profile shows it was just as warm in the Early Twentieth Century as it is today and was just as warm in the 1880’s as it is today, but Jones erased all that with his bogus adjustments to the temperature record.
If it was just as warm in the recent past as it is today, and CO2 has increased all during this time yet it is no warmer today than in the past, then that means that CO2 has had little effect on temperatures, and that’s what Phil Jones wanted to erase from the minds of the public. And his lies have been very successful. Al Gore featured these lies in his climate alarmist movie, as one example.
So we can thank Phil Jones for the BIG LIE. The biggest lie of the human-caused climate change era. The lie that caused all our current problems with deranged climate alarmists who point to this temperature profile lie as proof that CO2 is causing us harm.
Could you provide the True Global Temperature Profile™?
“Why should I make the data available to you when your aim is to try to find something wrong with it?”
It cuts both ways.
I’ll look forward greatly to you pointing out exactly where I’ve ever said anything remotely like that. Thanks.
Just demonstrated how thick you really are.
Two short planks comes to mind.
“Somebody else once made a comment to another person about a different subject so I’m going to use that as a get out of jail free card so I never have to substantiate the claims I make.” Did I summarize that about right or is there something I’m missing?
AJ… Condoning statistical fakery…. always.
Just goes to show that you really do have the same sense of humour failure as every other lefty climate alarmist. Now scuttle off back under your rock.
4″ x 2″
Since global temperature records over the last 150 years are sparse, it’s impossible to provide a truly global temperature, so we don’t know how warm or cold it was nor how much warmer or colder it is now.
Just guesswork and adjustments to get the “right” answer.
Your compatriot above claims there is a True Global Temperature Profile – would you like to raise your disagreement with them instead of me?
He also mentioned you and your comrades……
“deranged climate alarmists”
“Since global temperature records over the last 150 years are sparse, it’s impossible to provide a truly global temperature”
It wouldn’t matter how many records you had. You can’t average disparate temperature readings and come up with anything meaningful.
From the article: “In Climate: The Movie, William Happer, the former physics professor at Princeton, describes the Central England Temperature (CET) record as a “world treasure” since it provides continuous recordings from 1659 – over 350 years. It shows a rise just over 1°C from the depths of the Little Ice Age to the present day.”
It’s disappointing that Happer didn’t point out the fallacy of this averaged nonsense.
Could you provide the True Global Temperature Profile™?
That is a fair question. Surprised at the downvotes.
AlanJ can’t provide a Global Temperature profile, either.
Global temperatures were not being monitored until the satellite era began in 1979.
Before 1979, what we had were regional surface temperature charts. All the regional surface temperature charts show it was just as warm in the Early Twentieth Century as it is today. None of them look like a Hockey Stick “hotter and hotter” temperature profile. See the “600 charts” link above for regional charts.
Scary Hockey Stick charts were created in a computer and do not represent the actual historic temperature profiles as represented by the written, regional temperature records. The Hockey Stick profile was created to scare people and promote the human-caused climate change narrative.
The Hockey Stick temperature profile is the BIG LIE of alarmist climate science.
Any competent scientist should be able to discern this discrepancy in the temperature records. The regional charts are available for viewing and the comparison couldn’t be more different with the Hockey Stick charts, so a competent scientist would ask themselves “why the discrepancy between the written temperature record and the computer-generated temperature record”?
And it they have any deductive skills they would see that there is monkey business going on with the computer-generated temperature profile.
Of course, True Believers don’t question authority.
So show me the actual global temperature profile as represented by the written regional temperature charts, please and thanks.
First off, there is no global temperature profile. There is a so-called global temperature anomaly which is a rate of temperature change as compared to a “baseline”. There is no guarantee that the “baseline” temperature is the best one to be compared against.
To be truly representative a common global baseline temperature should be used. This would tell everyone how far from the best temperature for the earth we currently are.
This would force climate science to do a proper cost/benefit analysis for determining what global temperature should be. This would remove the common refrain that any change is bad.
As it stands now, following this claim would make the depths of the Little Ice Age the best temperature for the globe. LOL
Here’s the true global temperature profile. The one that shows it was just as warm in the Early Twentieth Century as it is today.
This particular chart is the U.S. regional chart, Hansen 1999, and all the unmodified, regional charts from around the world show the same temperature profile as the U.S. chart.
Here’s a link to about 600 regional charts from around the world that show a similar temperature profile to the U.S. profile. None of them have the “hotter and hotter and hotter” temperature profile of the bogus, bastardized Hockey Stick chart.
https://notrickszone.com/600-non-warming-graphs-1/
So how did the Temperature Data Charlatans get a Hockey Stick “hotter and hotter” temperature profile out of the regional temperature chart data, which don’t have a “hotter and hotter” profile? And the regional chart data is all the Temperature Data Mannipulators had to work with. So they put all that data along with a secret mix and turned a benign temperature profile into a scary “hotter and hotter and hotter” temperature profile. How did they do that? The only way they could do that is to bastardized and/or make up the data. That’s the only way.
You go on believing in the Hockey Stick. Keep fooling yourself.
Tom,
As you know, later global reconstructions like PAGES2K continue to mathematically combine dozens of temperature proxies of ordinary appearance, to arrive at a hockey stick finale.
There should be a punishment for deliberate misuse of science to push cult ideas. The blog Climate Audit let’s you see the individual proxies before the magic of the combination.
Geoff S
No, that’s the contiguous US. And it’s missing a quarter century of data.
So if you combine those 600 charts, and if what you’re saying is true, they should unequivocally show a global mean higher than today. I’ll look forward to you presenting the result of that analysis.
Geologist Warwick Hughes received that horrible email from Jones in the early 1990s. I was a corporate rep helping fund the Tasman Institute think tank, to which Warwick had brought some Jones data, requesting Tasman to form a project to find out why it was so bad. Warwick went on to run a successful blog about global warming. I wrote a long article about that email for the Jo Nova blog, easily found by search. (I’m away from PC and links).
I find it helpful to read the Climategate material now and then, to remind myself how much damage it did to the general reputation of scientists everywhere. It was NOT, as appointees doing blinders tried to sell by their enquiries, just boys being boys with chat talk. There was ample evidence of unlawful actions for which I and others called for police to inquire. Dreadful stuff. Geoff S
” the recent higher adjustments would seem to call for clarifying explanations from the state-funded Met Office.
But explanations from the Met Office are thin on the ground.”
It doesn’t seem to have occurred to either Paul or Chris to look at the detailed release notes for that explanation. They give, among other things, tables which set out the small changes:
Faith really must be a wonderful thing, Nick. Faith in the Met Office is little short of miraculous.
“The Met Office often uses official statistics dating back to 1910”
Officially, it was 1910 when we started doing widespread observations with Stevenson Screens
https://inews.co.uk/news/environment/weather-records-when-begin-data-climate-change-1910-temperature-325504
But then
“Why do weather records only begin in 1914?
Actually, they didn’t. While the Met Office seems keen on saying “since records began in 1914” to describe any kind of record-busting weather…
https://www.theguardian.com/world/2007/sep/03/weather.features11
It depends on the message to be sent… Here’s an example:
The BBC has admitted that its weather app is designed to give gloomy forecasts.
https://www.msn.com/en-gb/news/uknews/bbc-admits-its-weather-app-is-designed-to-give-gloomy-forecasts/ar-BB1kSsHy
As usual, discussing facts here is hopeless. People just respond with their canned rants. This post, and my response, are about the CET (which goes way further back than 1910)
Meanwhile, what are your thoughts about the Climategate emails? You excuse them?
When the Met Office can get its story straight I’ll entertain your supplication….
“Second driest spring since 1910, says Met Office”
https://www.theguardian.com/uk/2011/jun/02/more-sun-june-met-office
And the record buster
UK records hottest day ever, but when did weather records begin?
The Met Office is known for keeping a record of temperatures across the UK, but it didn’t officially accept responsibility for the custodianship of public weather records until April 1914.
https://www.itv.com/news/2022-07-19/uk-records-hottest-day-ever-but-when-did-weather-records-begin
The FACT is that a large proportion of surface sites are totally unfit for climate purposes.
Do you want to discuss that FACT, Nick ?
It looks like CET is no different.
Nick probably believes in GISS and BoM data as well.
All part of the BIG CON !!
And I suspect Nick is totally aware of it… aren’t you Nick !!
All pre-1885 LiG thermometers, and very many post, were manufactured from soft glass or lead glass. They all suffered from Joule-drift. The entire early air temperature record is unreliable.
The people composing the air temperature record are, at best, mathematically adept scientific dilettantes. Never getting to the bottom of the craft; fully engaged in their silk-purse from pig’s ear program.
They believe that when glomming together a whole bunch of data from different instruments, systematic uncertainties magically change over to random, then cancel. Stokes and his acolytes have repeated this fairy tale many times.
Which is partly why I maintain that a “global average temperature” is abject nonsense.
Exactly right.
RMS is not the proper method to analyze the data for the purposes stated.
What purpose is that?
They give the mean, which tells the effect of the adjustments. And they give the RMS, which is a measure of the magnitude.
The do not provide the mean. They provide the average of min and max, which is not the same.
It should be root sum square (RSS).
They give min and max separately, and then the average of both. But “mean” here is just the mean difference of those numbvers between versions over the period.
You still haven’t answered how they calculated values with 4 decimal places from measurements that had uncertainties in the integer range.
That is what I was going to address also. RMS between random variables only means they are close. Ok, that may be. However, to propose they are as close as shown in Nick’s tables is a complete joke. At best, and I emphasize best, I might believe that records could be within 0.1 degree as far back as the 1600’s.
The RMS does not address the uncertainty of the readings themselves. It only addresses how close they are. It is simply an excuse claiming that “look we didn’t change anything”!
As I said in an earlier post, it is a bunch of statisticians trying to show how well they can manipulate numbers. Measurements, we don’t need no stinking measurements!
Thank you.
Those aren’t explanations for temperature adjustments they are merely excuses for ex post facto tampering.
Nick, I agree that ad hominin attacks and insults is not a proper response in any discussion.
I go with, “I may not agree with what he says, but I will defend to the death his right to say it.” (paraphrased from Patrick Henry and Voltaire).
There is much about climate we do not know and for which we do not have the science worked out. Therefore all points of view must be considered.
The lack of an analysis of alternatives is one of the biggest mistakes being made.
‘There is much about climate we do not know and for which we do not have the science worked out.’
A true but incomplete statement. The main point that needs to be repeatedly stressed is that the Alarmists have provided no compelling evidence that our emissions of CO2 have had any impact on climate.
‘Therefore all points of view must be considered.’
All points of view would include the Alarmists’ preferred viewpoints on governance and energy generation. We shouldn’t consider any of these absent compelling evidence that our emissions of CO2 have had any impact on climate. In fact, even if such evidence exists and can be produced, that would only move us to the Alarmists’ next hurdle, which would be compelling evidence of harm.
All true.
My point was we, in this forum, should not stoop down to the alarmist level of insults, ad hominem attacks, silencing opposing voices, etc.
Too often I have seen responses that are frankly immature. I was posting to that.
Here’s a fact — all those tabled adjustments are below instrumental resolution. They’re physically meaningless.
Thank you Pat. That is what I tried to say using many more words. Your ability to be short and sweet is appreciated.
That’s what I tried to say in different words.
Nick, Are you saying that the use of sub-optimal sites is not an issue?
Yep, Nick condones BAD DATA. It is part of his past work profile.
They are just numbers to be manipulated to one heart’s content. Why should statisticians worry about accuracy and uncertainty? All their classes used numbers with not a single ± to be seen.
Nick believes that bad data can be fixed by the use or proper statistical techniques.
Funny how proper statistical techniques always result in the data being adjusted towards what he already believes.
No it’s worse than that, Nick believes bad data can always be fixed by averaging it all together.
Bernie
In fact, I’m not a fan of CET. But many at WUWT are, because whatever it measures, it goes a long way back. They do that by combining very long record posts. You can’t have everything.
But as often, the focus here is on the wrong thing. The point of CET is that it goes back to 1659, and we sure don’t have Class values for the first two or three centuries, which is the part that matters. Modern values help to interpret that past, but aren’t of interest in themselves.
Modern values don’t help anything if they are corrupted… except propaganda.
Why does Nick always hang everything on data he must know is corrupted and unfit for purpose ???
I do not believe that is what Nick is doing.
I think he is making points for us to consider.
But he must know the data is corrupted…
… so any point he makes is utterly pointless, and is purely agenda driven.
The very last thing one should take any notice of is a Met Office explanation. !
They are a major part of the scam.
These tabular release notes confirm what Homewood concluded.
It’s the other way around. They posted the notes with the changes. Then Morrison says “” the recent higher adjustments would seem to call for clarifying explanations from the state-funded Met Office.”
without bothering to look at the explanation that was provided, in the usual and proper place.
The explanations/excuses from a bunch charlatans and scammer are absolutely worthless…
That might be your worthless opinion, which you are entitled to. The fact remains that the rationale for the adjustments was plainly laid out in the proper scientific literature.
The fact that the guy who wrote this article totally failed to notice this is telling and highly typical.
There is no rationality or practicality in averaging dodgy temperature reconstructions down to thousands of one degree C, and then adjusting them one way or another.
You guys are all arguing about how many angels can dance on the head of a pin.
Which is another one of those debates where everyone including the audience (including me) is rendered a bit dumber from having followed it.
But at least I can get a chuckle out of it.
And you really believe that readings in the 1600’s can be manipulated to the one ten-thousandths of a degree? If so, you have no room to criticize anyone! These tables were put together by calculator jockeys.
Again proving you are totally accepting of junk data and fake adjustments…
.. all in a cause to bring down western society… that you live in.
“Climate science” literature is proven to be mostly nonsense.
Non-science driven by a fake cause…
… which is why people like you cite it.
Just curious – how was the mean difference established between 1659 and 1973?
By subtraction.
To four decimal places using measurements that are probably ±1°C at best?
You can surely give a better answer than that.
A better answer? I think Nick nailed it. That reflects on the incompetencies of the analyst.
So you are saying that the temperature in 1695 is sufficiently well know to justify the result. I think not.
That is an argument against CET generally. It’s quite popular here. But this post is just about how much difference came in changing from one version to another. You get that, as Paul did, by subtraction.
Do you even look at what you post? If you do, you have absolutely no idea about how physical measurements should be treated.
First thing I see is Table 4. -0.002 degrees of Mean Difference? Really! Readings in 1659 had enough Significant Digits in the decimals to allow a one-ten thousandths of a degree difference?
Same for Tabl 6 and 7. At least the Mean Differences are only to the one-thousandths place.
And the Root Mean Square Differences are no better. How were the differences calculated to the one-hundredths?
This whole thing is a joke and your using it as evidence is no better. CRN stations in the U.S. have a ±0.3°C uncertainty interval. And, you and the MET expects us to believe that station in the 1600 had the resolution and uncertainty to allow differences out to 4 decimal places. The only thing I can think of is that statisticians are looking for a reputation like lawyers.
Someone mentioned torturing the data. Witch trials were very much in vogue until the early 1700’s. Apparently, it’s much easier to make the data confess today.
“Do you even look at what you post?”
Do you ever look at anything else? This Morrison/Homewood post is about version differences. They give a chart of differences in hundredths of a degree, back to 1659. Then they complained about the MO not explaining the difference. I posted the release notes, which have a lot of detail about the difference. The numbers I posted are from the MO, not me. They correspond exactly to what this WUWT post is about.
You posted the numbers to refute a comment, you are responsible for the correctness of the information you post.
Don’t try to weasel out of the information being wrong.
If you had any appreciation of measurements you would have recognized that numbers shown to 2 or 3! decimal places as far back as the 1600’s were a joke.
Torturing data aside, it is an unsolved mystery for me to understand why the MET/Britain/NW Europe cares a whit about a temperature rise when the average temperature that appears to be about 10.5 deg C.
Spot on.
Not since “the consensus had settled the science” has the Met Office had any interest in integrity, honesty or service to the public who pay for it. At root the WMO appears not to give a damn about all the criticisms that can be laid at meteorology’s professional doors because they believe themselves to be political important as pilots guiding all the rest of us to the promised land of net zero.
Like Mann, Gore, Kerry etc many meteorologists appear full of themselves and don’t give a damn about anybody else’s scientific truth no matter what the longer term costs are because humanity has been forced to choose the wrong path and options in a huge political faux pas.
WHO and other UN agencies blame it all on White Supremist Capitalist Industrialists….
Since they nailed that, anything they say is the science is biblical to Saint Greta and company.
The differences in the figure you cite are tiny – what, if any, impact do they have on the long term trend for this series?
They are trendologists – it maintains the upwards warming trend despite evidence of present and past fluctuations that would destroy their pretty little straight-line graphs.
Strange that the monthly mean temperatures from1659 to 2005 have all been reduced whilst those from 2006 have increased even if all the changes are small.
It doesn’t seem strange to me, but I’m not a paranoid conspiracy theorist. Why do you think well-documented changes that have no perceptible impact on the result are strange?
Nope, you are a paranoid AGW-cultist.
Why do you think they made the changes that “just happen” to increase recent warming.
You have fallen for a big con… and are still totally oblivious to that fact.
Well I am not a “paranoid conspiracy theorist ” either. Just seems odd that they have adjusted temperatures back to the mid 17th century. How would they know?
They don’t.
They are unable to comprehend that error (and true values) of measurements is unknowable. But they do it for their political agendas.
It doesn’t seem odd at all, since the changes are clearly described in the release notes Nick linked above:
So they replaced two stations in the series, which produces changes for those time periods, and then they re-ran an automated homogenization computer program, which produced ever so slightly different results in periods outside of those directly affected by the station swaps (thus you get these insignificant little differences this post is crying foul about).
This post highlights a persistent issue with content on this site. Someone finds a difference between versions of a temperature series used in climate research, they allege fraud without ever bothering to check if the difference is documented and makes sense, then all the commentors uncritically pick up the chant, and it has now become sitewide doctrine that fraud occurred. But nobody can precisely say what the fraud was, or what it was supposed to achieve, because they can’t point to what impact it had because none of them bothered to do any actual analysis.
You do realize that homogenization adds measurement uncertainty, right? Is that measurement uncertainty propagated along with the reproducibility uncertainty of a monthly average?
If this uncertainty is just thrown away and not included when the next average is done, then the next average has an understated uncertainty.
How do you claim that is scientific treatment of data?
Homogenization does not operate on individual observations, but across an entire series, or segments of it. It can impact the uncertainty associated with the observations, but overall improves how representative the series is of climatic changes over time, which is the thing we care about. This has been shown to be unequivocally true in the research literature (see, e.g., Menne et al, 2009).
Nice dance but meaningless because you didn’t address the point.
If the uncertainty of observations is impacted, that means the measurement uncertainty is increased. How is that increased uncertainty propagated into resulting calculations?
It sounds very much like the entire measurement uncertainty is just tossed in the waste can. That is typical of statisticians who are only conditioned to deal with 100% accurate numbers.
Tell us what the homogenization spits out for an evaluation of measurement uncertainty!
Those are deltas in that plot. The underlying signature waveform is not included.
Therefore the only long term trend that can be derived is for “adjustments” made to the data.
The deliberate changing of data, bad as it is, to make the appearance of more recent warming.
It is a CON… and people like AJ just don’t care that they are being conned and lied to.
In fact, it is obvious that they condone it, and have come to expect it.
Not a single ‘skeptic’ has answered your simple and relevant question.
The answer is effectively zero impact on the long term trend.
Long term…. but it does increase recent warming….
… which is exactly what the con-artists want to do.
Virtually every adjustment, every change, every lie, is designed to support a worse case scenario with no mention of any benefits whatsoever.
Contrary to the common refrain around these parts, the net sum of the adjustments to the temperature data actually reduces the historic warming trend:
If scientists are trying to defraud us into thinking warming is worse than it is, they’ve accidentally gone the wrong way.
That blatant NONSENSE yet again.
The so-called RAW data is massively adjusted before it even gets to Schmidt et al.
The s-called raw data is just another FAKE fabrication… made up from data that just DOES NOT EXIST.
Show us the really really super raw unfabricated data then and prove the data above isn’t actually raw, money where your mouth is and all that.
They have little impact by design. Why don’t you answer how they got 4 decimal digit Mean Differences for data recorded in the 1600’s probably to ±1°C?
So the scientists doing the adjustments designed them to have no effect on the trend? How does that shake out with your conspiracy theory?
Except the adjustments shown in the main post DO have an effect on the recent trend.
Makes it steeper.
That is exactly why they do it.
Just a point of curiosity, how those pre-1800 temperature measurements were made
.
Thermometers moved to glass bulb mercury in the mid 1800s. Water based and water barometric thermometers (glass tube in a dish of water) preceded those.
Dario Camuffo is perhaps the world expert on early thermometers. See his, “The earliest temperature observations in the world: the Medici Network (1654–1670),” for example.
Pre-1750 glass thermometers were filled with various liquids. Sometimes spirit — even wine, sometimes a vegetable oil. The work was carefully done, but the technical craft was not up to the desired task.
James Six invented the min-max thermometer around 1782, containing ethanol in one side and mercury in the other.
Thank you. Not having read it, yet, I have to wonder how accurate it was and how it was calibrated. Back then temperature and pressure effects on water freezing and boiling temps was unknown.
Ask Dario. He welcomed my request for information when I was working on LiG Met.
His email is public, so I’ve no qualms posting it, d_dot_camuffo_AT_isac_dot_cnr_dot_it.
Genuine scientists always welcome interest. Typically, they’re flattered someone outside the field noticed. 🙂
This farce never seems to go away. The UK Government should immediately block the Met Office just as did the BBC.
British citizens should immediately block the UK Government.
Also using statistical malfeaces in their rain reporting
Record Rainfall? Met Office Accused Of Hiding The Inconvenient Truth | NOT A LOT OF PEOPLE KNOW THAT (wordpress.com)
The monthly satellite temperature anomaly from UAH over Australia is updated here.
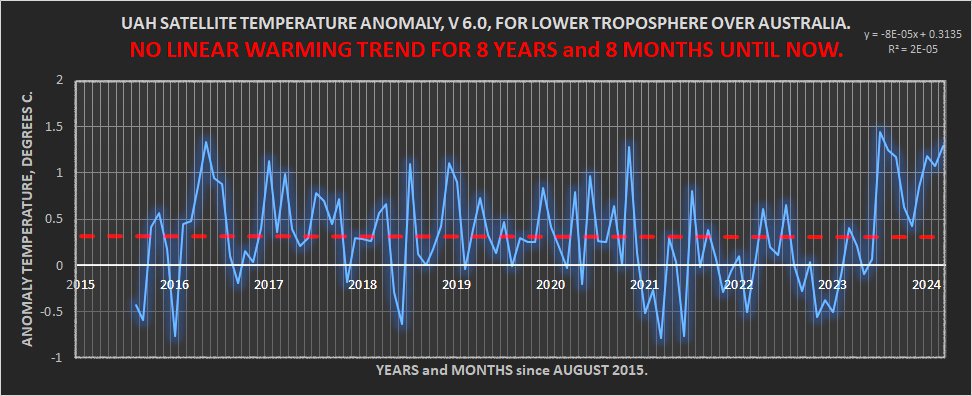
The rather high recent temperatures have reduced the “pause” from 12+ years a year ago, down to 8 yr 8 months. It is a strange poeak before us now, in terms of differences from past peaks. There is little scientific explanation that I can find. You are more likely to find people pushing their favourite explanation from a short list of 4 including
. regulated drop in use of high sulphur fuels for international shipping, so less SO2.
. a usual El Nino event.
. an abnormal response to the Hunga Tongs volcano pumping water into the stratosphere
. whatever one can invent
Geoff S
There’re more problems. There are no less than 17 station changes in the record, making it far less than useful for long-term comparisons.
w.
Yes. If you want to go back to 1659, that is what you have to do. You use the data available. There isn’t any other.
I think it is a curiosity, and I’m glad Manley and Parker did it so conscientiously. But I would take it with a grain of salt.
This article at WUWT that we are discussing thinks otherwise, though. It starts:
“In Climate: The Movie, William Happer, the former physics professor at Princeton, describes the Central England Temperature (CET) record as a “world treasure” since it provides continuous recordings from 1659 – over 350 years. It shows a rise just over 1°C from the depths of the Little Ice Age to the present day.”