By P Gosselin
What follows are excerpts from EIKE
Unexpected snow in Saudi Arabia
In the desert of Afif, west of Riyadh, it snowed unexpectedly, both citizens and tourists were shocked.
The significant drop in temperatures was expected with strong north-westerly winds making it even colder. Last year (2023), parts of Saudi Arabia saw its first snowfall in 100 years.
Bolstered by the increasing snowfall in recent years (and despite the “devastating effects of climate change”), Saudi Arabia is working to improve its mountain tourism with its own ski resort to be built by 2026.
Freezing Australia
This past week, the Australian continent saw temperature anomalies of up to 28°C below the multi-decadal norm, affecting large regions:

GFS-2m temperature anomalies (°C) March 20 – 26, 2024 [tropicaltidbits.com]
–57,9°C in Greenland
Temperatures in Greenland have fallen sharply as the thermometer in Summit showed -55.1 °C on Saturday.
On Monday it got even colder, falling to -57.9 °C, That’s about 15 °C below the seasonal norm.

Link: https://electroverse.substack.com/
The exceptional cold in the far north has contributed to Arctic sea ice extent to be above the average for the period 2011-2020, and is rapidly approaching the average for the period 2001-2010.

Chart: https://electroverse.substack.com/
Obviously the Arctic is surprising the experts, who warned that sea ice there was supposedly in rapid decline.
Unusual, record-breaking cold in India
Intense cold persists in Indian cities like Bhubaneswar, Cuttack, Puri, Chandbali, Paradeep and Baripada, which are experiencing record-breaking low temperatures. On Wednesday, many places in the eastern state of Odisha experienced the coldest March days ever. In Bhubaneswar, a maximum temperature of only 19.2 °C was recorded yesterday, breaking the previous record of 24.3 °C by a whopping 5°C!
In northern India, snow from the north is bringing down temperatures in the lower latitudes in central and southern India. In many cities, including the eastern metropolitan cities of Bhubaneswar, Cuttack, Puri, Chandbali, Paradeep and Baripada, record low March temperatures were recorded, beating benchmarks from the 1970s and beyond.
Record low in New Zealand
In the southern hemisphere, where summer has come to an end, the temperature in Whanganui, New Zealand dropped to 4°C on Wednesday morning, the second lowest March temperature in the town’s history. The lowest March low of all time was recorded on March 28, 1985 (solar minimum of the 21st cycle) at 2.5 °C.
New lows recorded in Australia
A severe cold snap has hit southeastern Australia. In the mountains of New South Wales, there was frost in the Perisher Valley with temperatures as low as -5.7°C. This is only 1.4°C above the national record for the month of March. Thredbo recorded -4.4°C. Cooma also recorded an impressive -1.9°C.
In Mt. Hotham, Victoria, the national record was missed by just 1.2°C, at -3.1°C. Monthly records also fell in Omeo, Victoria: on Thursday morning, the temperature of -0.7°C was a whole 1°C below the previous record (2021).
And in Cleve, South Australia, the temperature of 6.8 °C also exceeded the old record by 1 °C (yet to be confirmed).
Temperature in Antarctica plummets to near -68°C
On March 21, the seasonal minimum at Concordia dropped to -67.7°C, from -67.4°C on March 20.
Antarctica is cooling, the data is clear…
Full report (in German) at EIKE here:
Compiled by Christian Freuer
AH! But the cold is caused by climate change don’t you know! We do not call it global warming any more because we want everything, all weather all the time, to be climate change.
I hope this cold weather helps break down the alarmists, make them back pedal.
If it’s warming its climate change
If it’s cooling it’s
just weatherclimate changeIf its anything other than blasé It’s climate change
If it’s blasé it’s still climate change
I hope it gives alarmists mental break downs!
Now that the World Meteorological Organization has redefined “climate” to be only 30 years of weather, it is always changing.
It’s weather. But nice to have someone point out the lower extremes that never find their way to the mainstream media
This year’s arctic ice extent max was 600,000 km2 greater than that in 1974. Will be interesting to see what happens in September.
Yes but currently that seaice is mostly a year old and only 3% of it is more than 4 years old, back in the 80s over 30% of the ice was over 4 years old. It’s quite different ice now, much thinner.
If you look at the volume of the seaice back in 1979 the minimum was ~15,000 km^2, now it’s about 5,000.
https://forum.arctic-sea-ice.net/index.php?action=dlattach;topic=119.0;attach=389346;image
I wonder how much of this “cold” will show up in UAH for March !
Both average minimum and maximum of Arctic sea ice extent are liable to be higher in the current decade than in 2011-20.
What will alarmists say in that case? Or if even high or low average be above last decade’s?
Climate is 30 years, don’t ya know!!
That is what they will say.
Personally, unless you can redefine “climate” to 100 years or more, you might as well play their game and do 30 years, just don’t let them use 30 years from 1981 to 2010, which is what the frauds at NSIDC are doing to this very day.
Except when it comes to warm weather when that is immediately climate change.
The definition of “climate” as 30 years is, in light of the discover of the AMO/PDO, absurd. It makes “climate” effectively half a wavelength of a significant climatic cycle, effectively ensuring that the “climate” will either be warming or cooling at an alarming rate every 30 years or so.
The definition of “climate” should be at least twice the wavelength of any substantial climatic cycles, though that could extend the required period out to an impractical period (e.g. if you took into account the Eddy cycle ~1000 year period). What you don’t want to do though, is define “climate” as a fraction of a significant cycle. Perhaps you could get away with a period that is close to one full cycle, maybe 50 or 60 years. But that then comes into the problem of having enough observational data of high enough quality.
Truer words have not been spoken…( written ).
What exactly is fraudulent with a long range mean over 1981-2010?
Here are Arctic sea ice extent’s first 180 days in absolute form for the most recent years, the mean for 2019-2023 and… 2012:
And here are the same superposed years in anomaly form wrt the mean of 1981-2010:
2024 is very near to the long range mean, surpassed since 2010 only by 2010 and… 2012:
2010 03 24 15.179 (Mkm²)
2012 03 24 15.157
2024 03 24 14.974
2013 03 24 14.866
2014 03 24 14.700
2021 03 24 14.528
2011 03 24 14.483
2023 03 24 14.477
2019 03 24 14.451
2016 03 24 14.444
*
Anti-alarmism – to always look at the most recent data, typical for the TricksZone – is exactly as ridiculous and fraudulent as is alarmism .
They’ll say it’s because of “Climate Change” and that it’s an emergency and worse than ever and unprecedented and that the only way we can combat it is to pay more taxes and destroy Western Civilization. (I wish I was joking).
“In this editorial I will demonstrate with newly discovered solar activity proxy magnetic field that the Sun has entered into the modern Grand Solar Minimum (2020-2053) that will lead to a significant reduction of solar magnetic field and activity like during the Maunder Minimum, leading to noticeable reduction of terrestrial temperature.”
-from Modern Grand Solar Minimum will lead to terrestrial cooling; Zharkova; Temperature, 2020 7(3): 217-222
Just a kindly suggestion. I dug into Zharkova’s papers and do not think highly of her work. Sketchy at best.
lets wait n see if shes close or right?
If you have a better explanation of the sunspot cycles than her double dynamo theory we would all love to hear it.
Go to the Beyond Landscheidt web site. LOTS of information there, all ignored by “Solar Scientists”. The Sun is NOT self regulating.
Another 20 years or so will tell. Tidal forces from almost EVERY planet from the gas giants in to Mercury DO have effects on the Sun. Jupiter, Uranus and Saturn due to their size, have the most. I mean the Earth’s CRUST rises and falls with the Moon’s motions, not just the WATER!!
Take a look, it will open your eyes. We MAY be in the beginning of the Landscheidt Grand Minimum, although he may have been off by half a cycle (=-11 years is HALF a cycle).
https://www.landscheidt.info/
Never mind. Don’t let reality spoil a good yarn.
A yarn? Yes. Good? No.
Good as in “useful”, Rud.
Global colding! Just as was feared by ‘climate scientists’ in the 1970’s.
Of course when that didn’t happen, they switched to global warming. Got more legs, since the globe has demonstrably been warming since the end of the LIA. Last Thames ice fair was 1818. Mostly not anthropogenic.
Problem is, UNFCCC and IPCC overcooked their explicitly chartered anthropogenic global warming alarms. And now are stuck with much officially predicted ‘climate science’ stuff that just didn’t happen. Which puts the lie to their vaunted ‘climate science’ now forty years in.
A favorite very simple ‘climate science’ example. Sea level rise was supposed to accelerate (a lot) with warming. Hansen was certain—Pacific Islands and Miami Beach were gonna disappear, and Manhatten’s East Side Parkway would be under water.
Hansen was just wrong. SLR hasn’t accelerated at all—Miami Beach is hosting spring break, and the Parkway is as congested as usual. EXCEPT very slightly when measured by NASA satellites with an intrinsic accuracy of ~3.5cm while ~3mm is reported versus ~2.2mm/year tide gauge reality. ‘Sciency’? Yes—gosh, NASA satellites. Scientific? No.
“Last Thames ice fair in 1818”
The “old” London Bridge was demolished in 1831. It had been there since 1209. It had very narrow arches that mostly kept the brackish estuary water on the downstream side, so the upstream side had almost fresh water, and a much smaller range of tidal rise and fall. Hence it froze more frequently and with thicker ice than it otherwise would. Ice fairs wouldn’t be possible with the “new” London Bridge that was built in 1831 (and moved to Lake Havasu in 1967) or the “newer” London Bridge that’s in place now.
I knew this because I grew up in London, giving me a rare chance to correct our own resident polymath, who knows almost everything about almost everything, but (very occasionally!) gets his facts slightly wrong or (in this case) didn’t give the whole story.
SR, All true—but the last Thames Ice Fair date didn’t change to 1831.
Do try harder
That is the nonsense ‘explanation’ put in a ‘Nature’ paper some decade ago. It was nonsense because when the Thames did not anymore freeze over, neither did the rivers and canal in the Low Countries. That bridge must have been a powerful medicine to have such a long distance effect.
According to ….. https://en.wikipedia.org/wiki/Elfstedentocht
The Dutch ice-skating event, the “Elfstedentocht“ has been held on 15 occasions since the Old London Bridge was demolished.
The Thames did not freeze over in these years.
No, not “powerful medicine” just natural meteorological dynamics, which the Old London Bridge gamed in favour of ice formation upstream the bridge in severe English winters.
Rud,
I believe that Hsnsen’s prediction was that the West Site Highway was threatened by SLR. Last time I visited Manhattan, the sea had a very long way to rise to put the West Side Highway under water.
The highway referred to by Hansen was demolished and rebuilt quite a while ago so what you saw recently was not relevant.
The weather is appropriate for International CO2 Celebration Day…..show Pride and fly your CO2 Flag. A parade is in order too. CELEBRATE!
Maybe I’ll burn it to keep warm instead?
(A bit less work for my gas furnace.)
For my little spot on the Globe, Spring has been off to a slow start.
(Due to Global Warming, I’m sure.)
My daughter and her family just got snowed in again by another foot+, after she and her husband spent a day digging out from the previous 2+ feet. They have a longish (~300’) driveway to their house adjacent outdoor car park, so this was NOT trivial even with a big snowblower. Evergreen CO up above Denver on the Front Range, just south of I70. Gonna be a lot of Front Range soil moisture if the late spring melt is slow. On the plus side, They need the groundwater there.
At my sister’s big cattle ranch in extreme north eastern Washington State, the snow is above normal also. She is also hoping for a slow spring melt. Her deepest ranch stock well is over 700 feet, redrilled deeper in the last ‘drought’. By comparison, my Wisconsin dairy farm deepest of three wells is 120 feet, to tap into the lower second but water purer aquifer. Serves the milking barn and the house.
Colorado’s communist masters want to outlaw sales of all gasoline-powered outdoor equipment, which would include snowblowers.
Makes sense?
Just out of curiosity, do you know if your 120 foot well is recharged by one of the Great Lakes or is it another aquifer?
It’s like January here in Wokeachusetts.
When the MSM supports your narrative you can just have facts ignored or call it anything you want. Think about how much power it takes to control the media worldwide. It’s not like Pravda was pre Soviet breakup where you had only one source for the Russian peoples’ news. The question is how much longer can they maintain the lies in the face of reality?
Snow on Mount Wrightson, AZ last night and continuing today. Usually gone by February. Lakes Mead and Powell continue to fill, moderating the mythical permanent drought. Hardly any spring melt in the rest of the Colorado river basin.
All in all, precipitation over this last couple seasons may stave off, for a little while, the 6x water charge increases many local mayors have programmed in by accepting federal conservation grants. If we can keep our remaining coal plants on line just a little longer, we can maybe postpone the electrical service upcharges that will be required to support widespread rooftop solar installations.. .
Also need to get rid of CCP stooge Biden, under orders from his Commie masters to increase US reliance on slave labor-produced Chinese solar panels.
Trump is best pals with Putin.
I hope it’s not true. Cold is bad.
Look out India – Those temperatures are are in the Moderately Cold range.
Here, we quantify heat and cold effects on mortality in India using a nationally representative study of the causes of death and daily temperature data for 2001–2013.
We calculated the attributable risk fractions by mortality cause for extremely cold (0.4 to 13.8°C), moderately cold (13.8°C to cause-specific minimum mortality temperatures)
In 2015, 197,000 (121,000 to 259,000) deaths from stroke, IHD, and respiratory diseases at ages 30–69 years were attributable to moderately cold temperature, which was 12- and 42-fold higher than totals from extremely cold and extremely hot temperature, respectively. The main limitation of this study was the coarse spatial resolution of the temperature data, which may mask microclimate effects.
https://www.ncbi.nlm.nih.gov/pmc/articles/PMC6057641/
“Bring out your Dead” – to quote Monty Python And The Holy Grail
Did have a couple of rather cold mornings here in the Hunter last few days… scrambling to find blankets.
Nice pleasant and totally normal 27C at midday, today.
I think that apart from what seems like a somewhat wetter summer than usual.. .
… the whole weather around here would have to be classed as TOTALLY NORMAL.
I don’t know if this is really good news but considering it gives the CAGW crowd a black eye I like it.
Sorry to say this. I think the chart showing the Arctic Sea Ice Extent is misleading and appears to have been removed from the Electroverse Substack.
JMHO
As per my comment above, the chart you posted is misleading since it is using the OLD “climate” 30 year period ending in 2010 instead of the CURRENT 30 year climate period of 1991 to 2020.
A corrected chart would show the current sea ice level OVER the 30 year median.
The frauds are attempting to continue the narrative by cheating on the base period. They will continue to do so if allowed. If you use their charts, please always clarify that they have failed to be professional and have not updated their chart’s period used for comparison.
What does the infamous ‘Mark Freeze’ (actually Mark Serreze) of NSIDC say about all this? IIRC he was quite the ‘global warmer’ at one time …
https://nsidc.org/home
Better start burning more coal to warm up the planet- it’s an emergency! /sarc
I keep emphasizing the very low troposphere in winter in high latitudes and the influence of wind in the stratosphere on weather from autumn to spring. Here, the amount and distribution of ozone in the lower stratosphere depends on UVC radiation, as well as the QBO cycle, which is extremely constant.
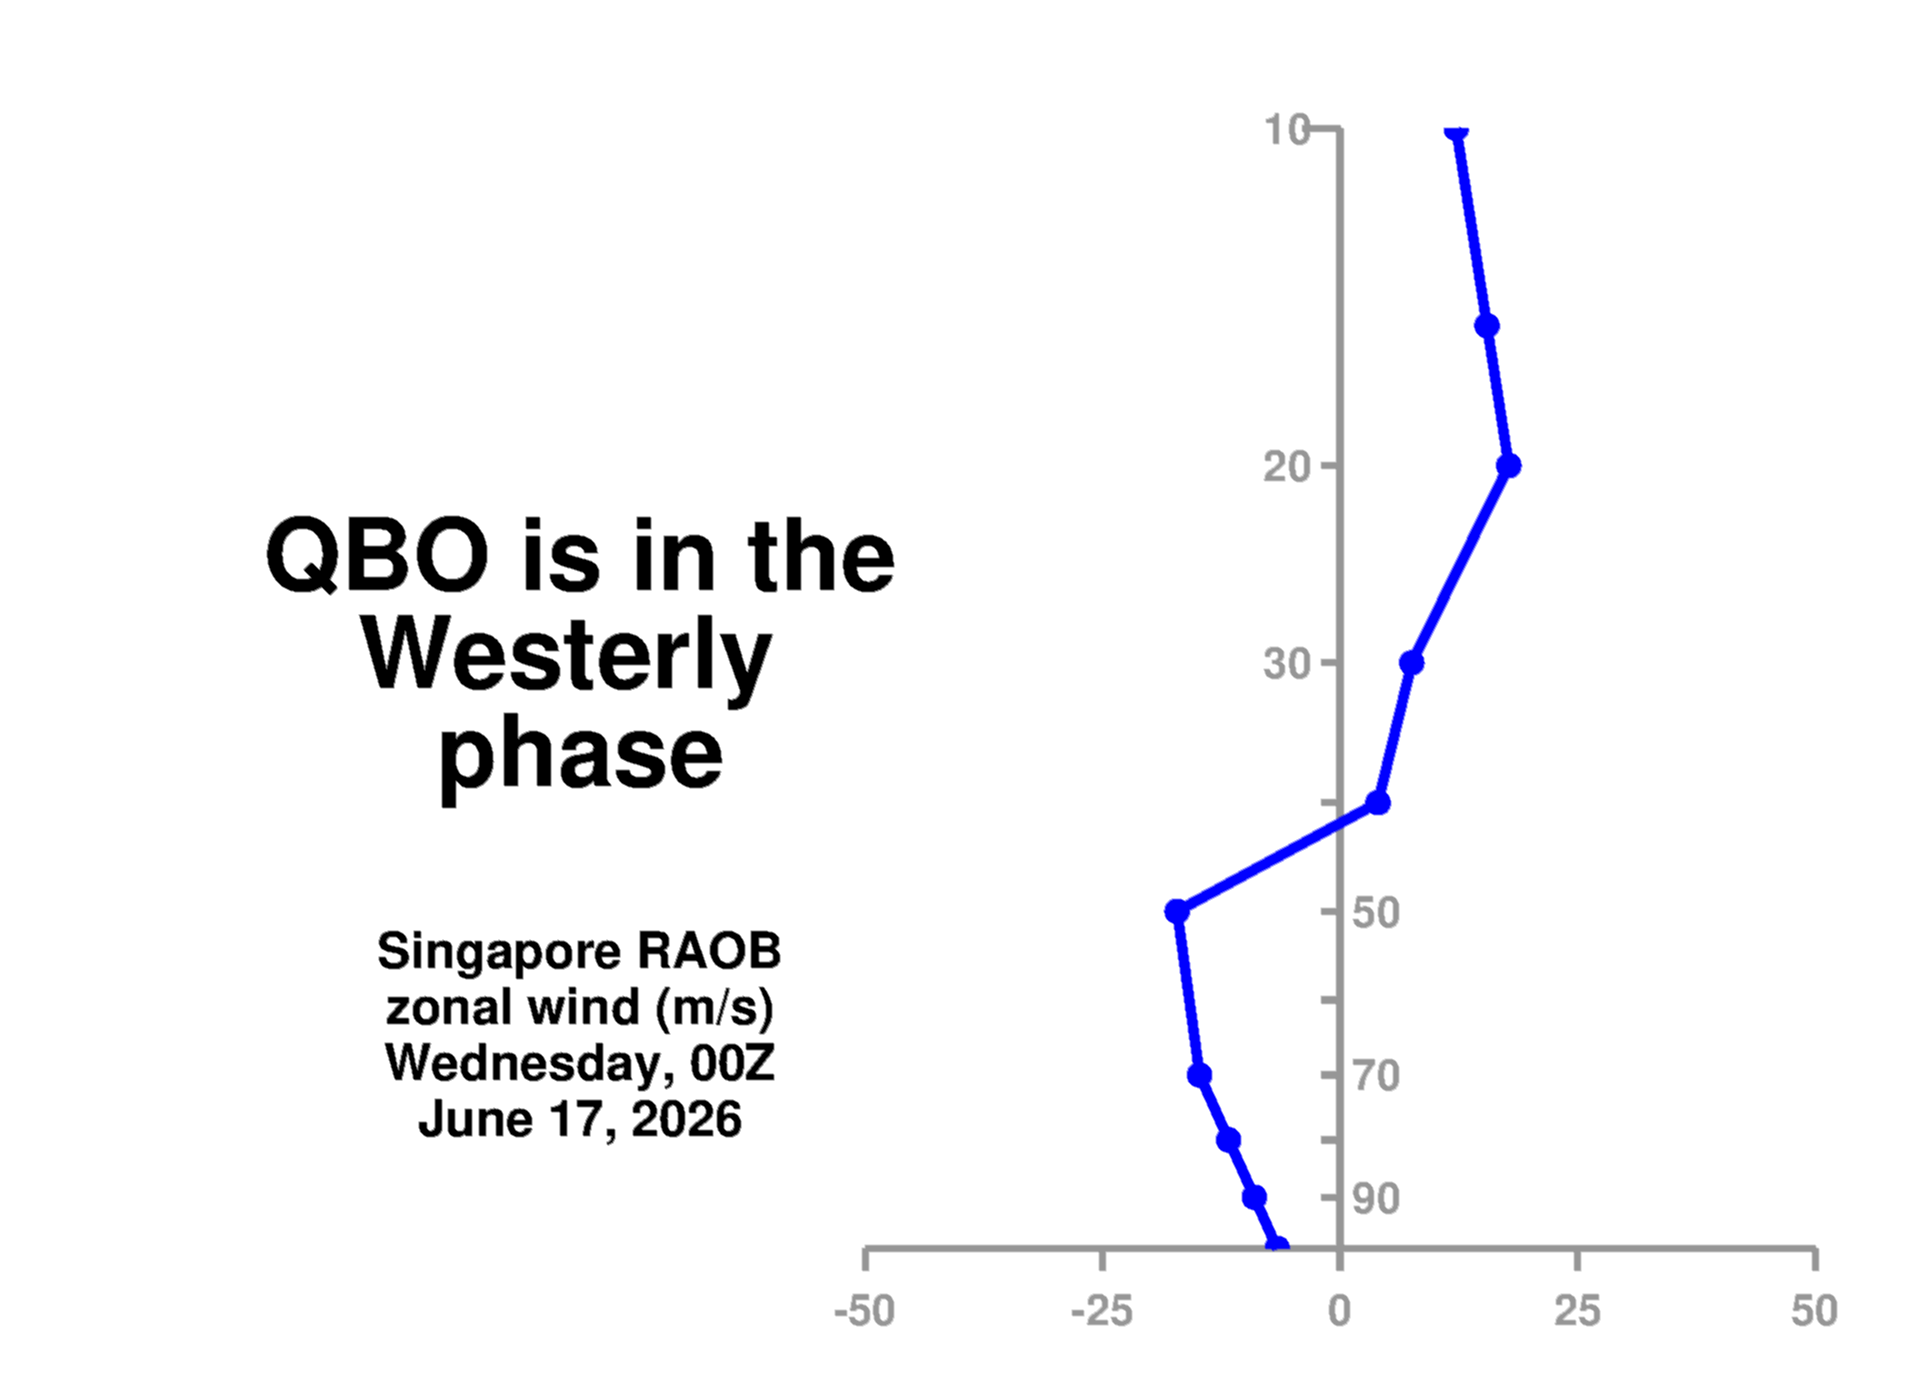
“The Quasi-biennial Oscillation (QBO) is a tropical, lower stratospheric, downward propagating zonal wind variation, with an average period of ~28 months. The importance of the QBO is that it dominates the variability of the tropical lower stratospheric meteorology [Wallace, 1973]. The QBO is also important for seasonal forecasting, and the QBO controls stratospheric ozone and water variability that can modulate surface ultra-violet (UV) and infrared (IR) radiation.”
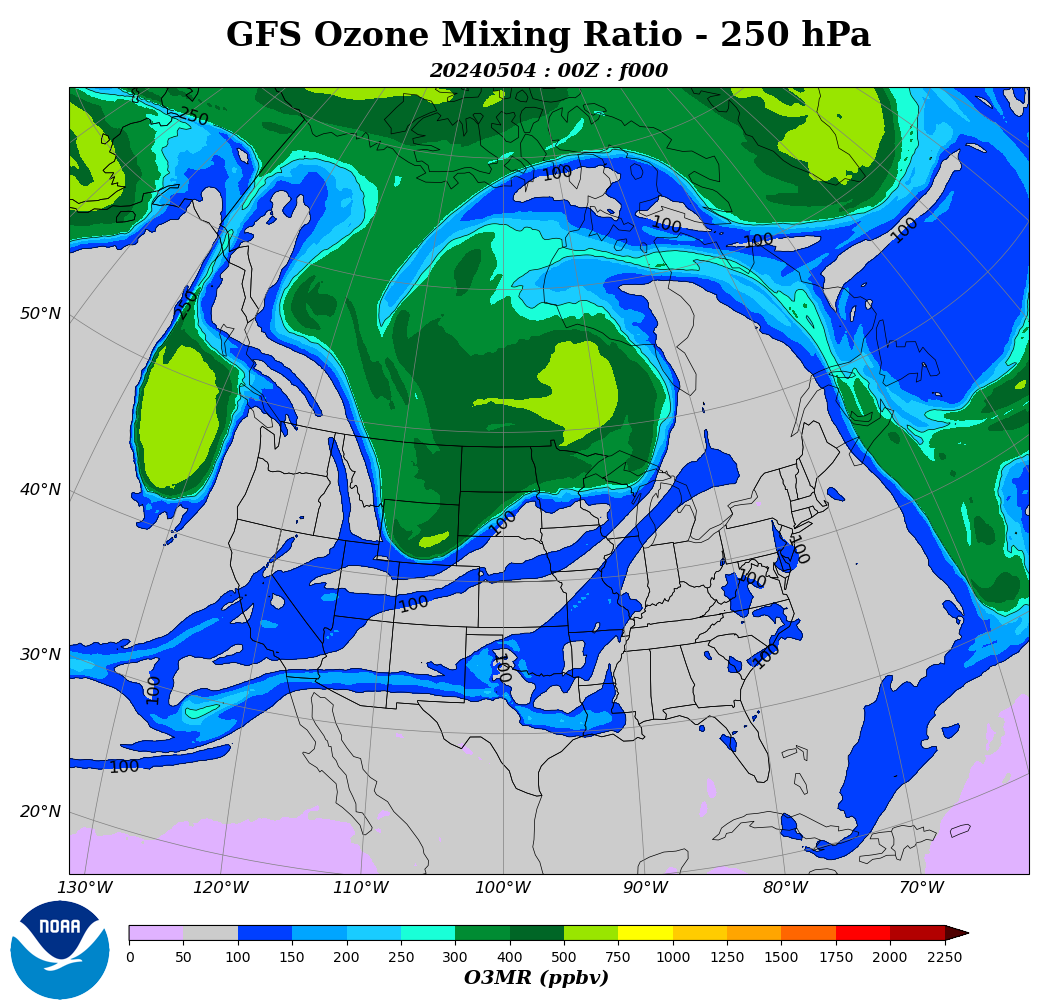
The graphic above shows that ozone waves from the stratosphere displace water vapor from the upper troposphere.
http://tropic.ssec.wisc.edu/real-time/mtpw2/webAnims/tpw_nrl_colors/namer/mimictpw_namer_latest.gif
It is worth noting that the stratospheric boundary on the QBO chart is defined continuously at 100 hPa, indicating that the pressure (air density) determines the height of the tropopause.
We can hope that these unusually cold areas are not the beginning of our entry into another glacial age. You really don’t want that.
Probably not, at least no more than the ‘global cooling’ idea of the 70’s.
HT Water Vapor is 30 KM now, and concentrated in the Northern Hemisphere, the Northern Hemisphere is probably missing some incoming from the lensing effect.
Graphics produced by IDL (nasa.gov)
Cold North and South? Perhaps we should refer to the Milankovick cycles. After all this has been a quite long Ice Age Warm Period. Maybe it’s about time for the start of the long decent?
We have been in a descent towards the next glaciation since the Holocene Climactic Optimum, I think we probably have a while to go yet. However, it does bring up an interesting point – at which point does a glaciation period start and stop, exactly? We’ve looked back at the geological record and, with some authority, declared this point or that point as the start point or end point of a glacial period but where is it exactly, what’s the definition of such a point? And, more importantly, are there grey areas to either side where we may not be in the official glacial period but the temperatures feel like we should be?
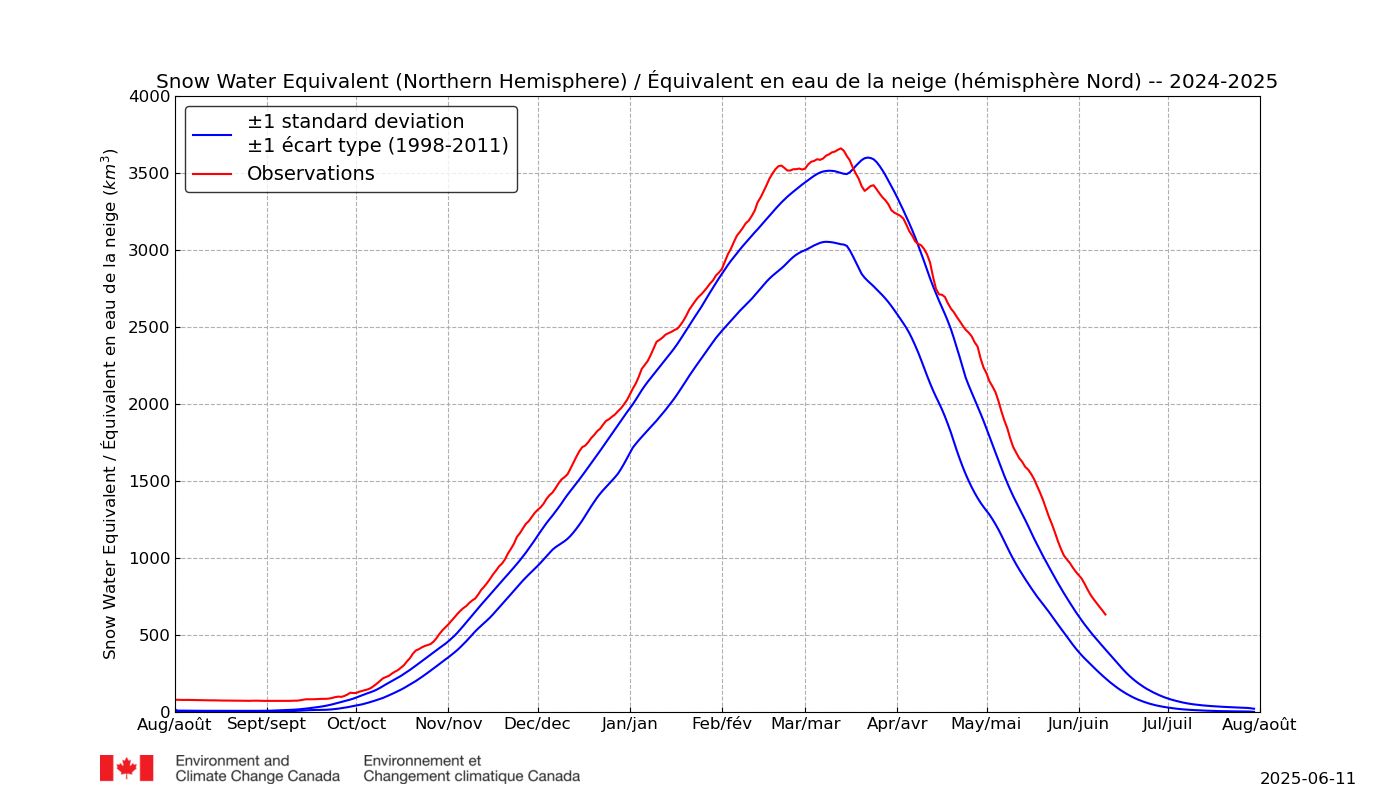
Increasing snowfall in the north is a signal. On the continents, snow cover will gradually increase and albedo will rise. Warm oceans will give up energy in the form of snow.
I read a bit of research a while back.
Solar magnetic field shifts causing increase in volcanic activity when couple with solar minimum results is a mini ice age.
Hmmm…. Volcanoes all over the planet, shifting solar magnetic field, approaching grand solar minimum….
Does this toll the death of catastrophic anthropogenic global warming?
The tilt angle of the Earth’s axis is currently in mid-decline. It will reach a minimum in about 8,000 years. However, the decline in solar activity will result in greater energy losses during the winter season.
The recent increase in solar wind strength may push the ozone wave further south. It could descend as far south as Mexico and Morocco.
Colorado snowpack was at 109% of 30-year average as of 3 days ago and we just got another huge dump last night. We got 5 inches last night about 4 miles north of Parlin, CO at 8,300,’ and there’s more on the way.
The snowstorm is moving into Kansas and northern Texas.
Another snowstorm is now in the Dakotas and Minnesota.
Ice extent in the Barents Sea has been increasing since early March.

It could be a part of a cooling trend. Here on the Manawatu Plains, west coast, lower North Island, New Zealand, we had our 3rd earliest frost in the past 44 years, from my own records. That frost on March 20th is one of only four recorded before April in that period. The earliest one was on Feb 25th 2019. There have been 14 first frosts in April over the same period, but the majority of 1st frosts occur between mid-May and mid-June. Notorious NIWA CAGW alarmist Dr Jim Renwick claimed several years ago the frosts would become a thing of the past on the high, central plateau of the North Island, where frosts are numerous and severe. I live 10 miles from the coast at 45ft/15m a.s.l. My records show a mean of 17 actual, ice on the ground, frosts per year. The trend showed a dip in the 1990’s, but a steady rise since then.