Guest Post by Willis Eschenbach
I see that the usual gloomy hype about arctic sea ice continues unabated. This has been going on for a while. Here’s the dean of failed serial doomcasting, James Hansen, pontificating on the subject back in 2008.
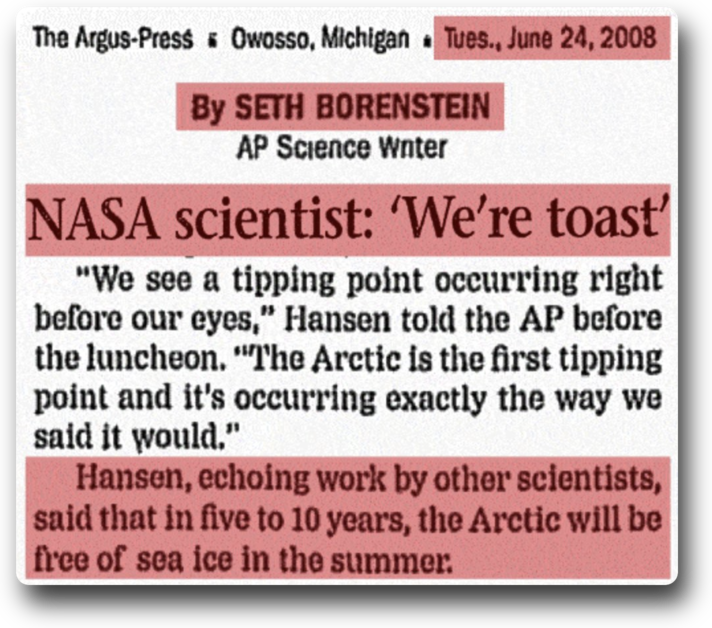
Figure 1. James Hansen’s 2008 crashed and burned prediction of an arctic ice-free summer by 2018.
The latest entry in the prediction sweepstakes is described in the climate alarmists’ favorite newspaper, the Guardian, with the obligatory tear-jerking polar bear photo:
Ice-free summers in Arctic possible within next decade, scientists say
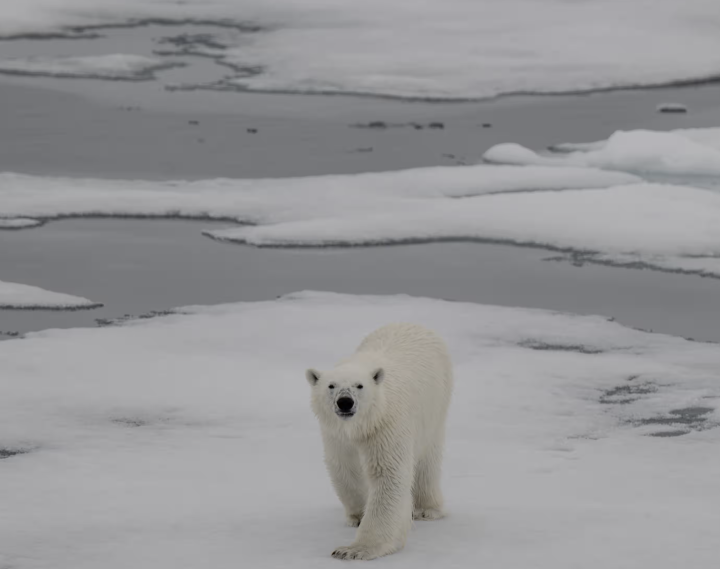
Home of polar bears, seals and walruses could be mostly water for months as early as 2035 due to fossil fuel emissions
The Guardian hype refers to an un-paywalled study entitled Projections of an ice-free Arctic Ocean in Nature Magazine.
Now, you’ve got to be careful to watch the pea under the walnut shell. Well down in the scientific study they say:
The definition of an ‘ice-free Arctic’ has varied over time. Early on, it referred to the nearly complete disappearance of all sea ice, or zero SIE [sea ice extent]. However, as thick sea ice remains north of Greenland and the Canadian Arctic Archipelago more than a decade after the rest of the Arctic Ocean becomes ice free in September a SIE threshold of 1 million km2 [386,000 square miles] became commonplace.
So we’re not really talking about zero sea ice extent. We’re talking about getting down to a million square kilometers of ice, more than a third of a million square miles. That’s a very different question.
Next, they say:
Statistical methods have also been used to provide predictions of an ice-free Arctic. Most of these predictions are based on observed linear relationships between global or Arctic temperature and sea ice cover.
I saw that claim of a linear relationship between temperature and Arctic sea ice extent and said “Hmmm” … let’s start with what’s actually happened to sea ice since the start of the satellite era in 1979. First, the changes up until 2012.
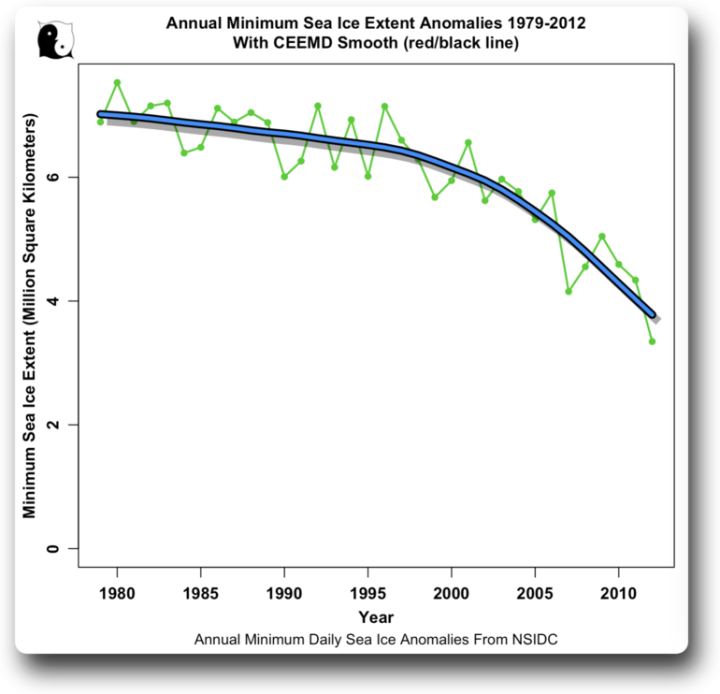
Figure 2. Annual minimum Arctic summer sea ice extent, 1979 to 2012. Yikes! Dropping fast.
Now, this is curious. Minimum Arctic sea ice extent decreased slowly from the start of the satellite record up to the year 2000. From there it started dropping faster and faster, up to 2012.
And that’s why the scientific cognoscenti were so sure it was going to crash. I mean, in 2012, any sane person could see the inevitable. After dropping from 6 million to 4 million square kilometers since the turn of the century, 1 million square kilometers (AKA “ice free”) was obviously just around the corner. That’s why even back in 2008 James Hansen was so sure of an ice-free Arctic in the near future.
However, a funny thing happened on the way to Thermageddon™. Here’s the rest of the Arctic ice extent record.
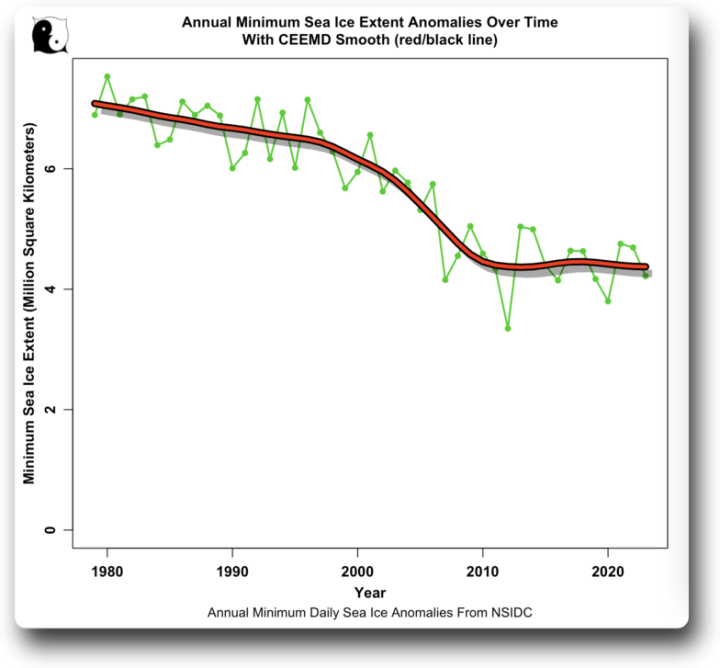
Figure 3. Annual minimum Arctic summer sea ice extent, 1979 to 2023
Arctic sea ice extent went flat in 2012 and has stayed relatively stable since. I’m sure this made Jim Hansen tear his hair out. And it’s an excellent example of the limitations of climate models.
As far as I know, not one climate model and not one climate scientist predicted that around 2012, the strong downward trend of Arctic ice extent would go flat, and stay that way for a decade. It’s a problem with iterative climate models of chaotic systems. It’s also a problem with humans. Both humans and models tend to calculate that a trend will continue. Neither humans nor models are very good at predicting U-turns or regime shifts in chaotic systems.
So which way will it go from here? Unknown. For example, one of the oddities is that a warmer world is a wetter world, and a wetter world means more snow. Snow on top of ice insulates the ice, making it last longer. It’s a fine example of what I modestly call Willis’s First Law of Climate, which says:
In the chaotic giant heat engine we call the climate, everything is connected to everything else, which in turn is connected to everything else …
…
… except when it isn’t.
It’s true. The climate has six main subsystems—atmosphere, hydrosphere, lithosphere, biosphere, cryosphere, and electrosphere. Each of these subsystems is constantly exchanging matter and/or energy with all the other subsystems. Each subsystem contains relevant phenomena at all time scales from nanoseconds to millions of years, and at all spatial scales from nanometers to planetwide.
In addition, each of these subsystems has its own chaotic internal resonances, cycles, and regime shifts, which in turn affect all of the other subsystems. Climate is a system of almost unimaginable complexity that we’re only beginning to understand. As a result, claiming that we can model it with current computers is … well … let me call it hubris of the highest order.
But I digress. I started to test one of their central claims, that Arctic ice extent has a “linear relationship” with temperature. So I took the Arctic ice extent data shown in Figure 4 and compared it to a variety of temperature records. To show things clearly, I used just the smoothed versions of each dataset, and set them all to the same range from maximum to minimum.
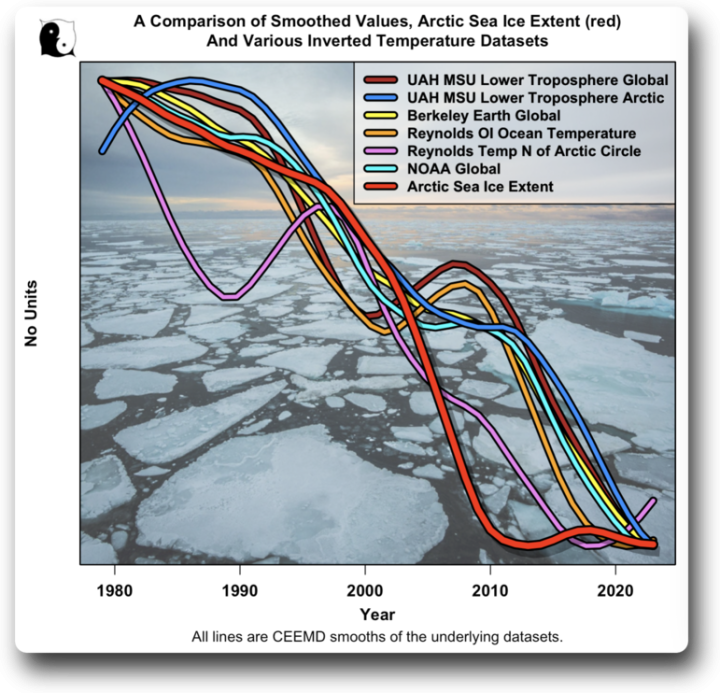
Figure 4. A view of what the paper erroneously describes as “observed linear relationships between global or Arctic temperature and sea ice cover”. Temperature datasets are inverted because greater temperatures should yield less Arctic ice.
Not only is there no “linear relationship” between Arctic ice extent and temperature, there is very little relationship at all. Yes, in very general terms, warmer temperatures are correlated with less Arctic sea ice extent.
But none of the temperature datasets show the recent leveling out of the Arctic sea ice extent. The closest, as you might expect, is the Reynolds OI sea surface temperature north of the Arctic Circle … but even that one diverges wildly in the early part of the record and matches poorly in the recent part.
So I’m gonna say that their claim of “observed linear relationships between global or Arctic temperature and sea ice cover” is simply not true.
Finally, to return to the topic of the study, the “projections” of the year when we’ll see the first ice-free Arctic are pretty hilarious. They are so broad that if ice-free Arctic conditions were to occur at any time between now and 2150, someone’s model could claim credit for it. Below I show the nine different models and model averages reported in the study.
The first thing to notice is that contrary to the claims of an imminent ice-free summer, in fact we’re already past the claimed earliest ice-free date of five of the nine models.
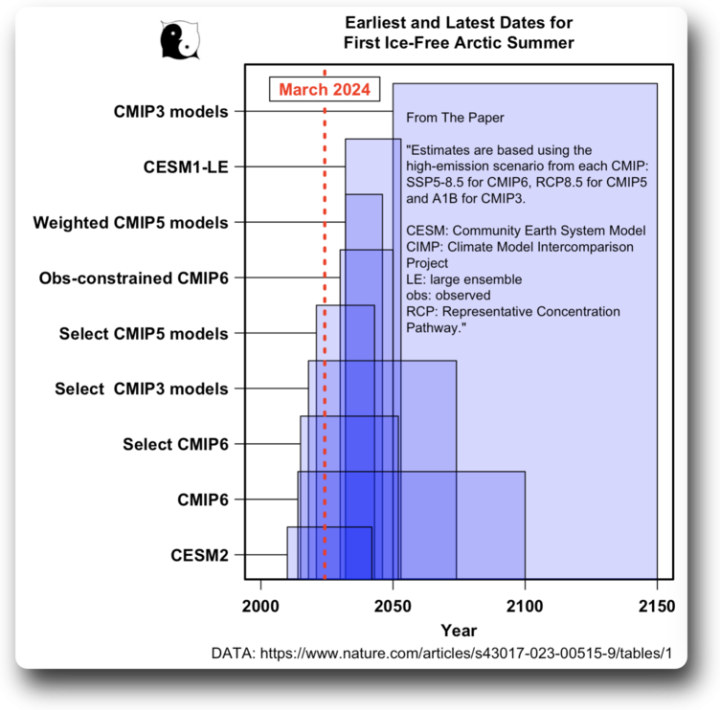
Figure 5. Earliest and latest ice-free dates of the nine models and model groups. Horizontal lines connect the names of each model with the boxes whose left and right edges show the earliest and latest ice-free dates according to that model.
The dark blue region around 2035 to 2045 shows what the models say is the most likely time when we’ll see an ice-free Arctic. However, given their accuracy to date, that should be taken, not with a grain of sale, but with a kilo of salt …
Finally, the authors have used only the most extreme climate scenarios. The current general agreement among mainstream climate scientists is that these extreme scenarios (SSP5-8.5, RCP8.5, and A1B) are all highly improbable, and are not recommended for use because they lead to very unlikely projections. Despite that, the authors have selected them, presumable because it jacks up the fear and anxiety in the public … which of course will guarantee that these authors continue to receive funding in the future.
CONCLUSIONS
• There is no simple linear relationship between either global or Arctic temperature and Arctic sea ice extent.
• Models are just a reification of the understandings and misunderstandings of the programmers.
• They are supposed to be “physics based”, but if they truly were, there wouldn’t be such huge disagreements between models.
• The use of the most extreme scenarios is clear evidence of the alarmist views of the authors of this study.
And a final thought. The world of climate science would be well served to declare a moratorium on these endless failed serial doomcasts, and study the climate of the past instead. The models are a joke in that regard. Consider that the models give climate sensitivities that range from about 1.5° C to 6.5° C per doubling of CO2. Despite that, they all do a reasonable job of emulating the historical temperature record … and if they are “physics-based” as the modelers claim, that’s physically not possible. I discuss this in my post Dr. Kiehl’s Paradox That is clear evidence that they are merely tuned to match the past, and thus they have no credibility in predicting the future.
Here, it’s nighttime. I walk outside, and the redwood forest surrounding our house is perfectly silent, not a breath of wind. The constellation Orion burns low in the western sky, and Leo is right overhead. The crisp night air is redolent of springtime, of life bursting forth on all sides.
Ah, dear friends, what a wonderfully mysterious universe, with far more questions than we will ever have answers.
My best to you and yours,
w.
Willis, Arctic sea ice extent does not necessarily correlate with Arctic temperatures.
Most of that apparent warming found in recent years tends to be in winter – whether it is 30 below, or 40 below, the sea is still going to freeze!
In contrast we see that summer Arctic temperatures have been around average in recent years, according to DMI.
The main determinant of sea ice extent is the balance between the influx of warm Atlantic currents and its opposition by colder polar waters, driven by fresh water from north flowing Canadian and Siberian rivers.
These natural ocean cycles have been repeating throughout the 20thC, as proper Arctic experts have known about for a long time. Indeed Arctic temperatures FOLLOW these cycles, rather than dictating them.
“Summer Arctic temperatures have been around average in recent years“.
Of course they have Paul! In the high Arctic at least.
The well known “ice in your cocktail” phenomenon.
Only atmospheric warming in the Arctic was a spike from the 2015 El Nino.. all but gone until the 2023 El Nino.
Even with the expansion of Arctic towns causing urban heat effects, 1940 was a similar temperature to now.
The underlying data for your UAH graph starts in late 1978. Why do you suppose that is BNice?
Evidently you are unaware that Iceland isn’t in the “High Arctic”, that the “lower troposphere” isn’t 2 meters above the sea ice, and that the MSU/AMSU data suffers from a significant “pole hole”.
No doubt there are numerous other such facts that you are unaware of?
While there is a “pole hole”, it’s not very significant—it only misses 0.4% of the northern hemisphere, or 4.6% of the area above the Arctic Circle.
w.
Which works out to be what percentage of the “High Arctic” so beloved of numerous commentators, including your “summer Arctic temperatures… according to DMI” and Ulric’s “Mid summer 80-90N mean temperatures“?
Mornin’ Willis (UTC),
Sorry, I “misspoke” yesterday at the end of a long hard day here in my winter residence in soggy South West England.
I should have typed “So beloved of numerous commentators, including Paul Homewood’s…“.
Is there any chance we can stop Gish galloping around after foul mouthed trolls trying to change the subject and stick to the point raised in your OP?
Here’s “Tamino’s” 3 segment version of your graph, from a couple of years ago:
Start at the extreme high.. and show the RECOVERY back very slightly towards the Holocene mean.
What an increedibly stupid piece of propaganda.
It’s based on the same data that Willis used BNice, but “smoothed” in a different way.
It starts where he started his graph, so take that up with him if you disagree with his starting point.
Close. I’m showing minimum daily ice, which is what the claims of an “earliest ice-free Arctic” are all about. He’s showing the Sept-Oct average, a very different thing.
w.
The annual minimum is subject to lots of “internal variability”. As “Tamino” put it:
“The annual averages show much less fluctuation than the annual minima, so we can estimate things like rates of change with greater precision. I find that there is statistical evidence that the rate changed over time. One model of such changes uses three straight-line segments with their changes chosen to best-fit the data.”
That’s also why the Sea Ice Prediction Network goes after the September monthly average, and not the daily minimum.
However if you insist on the daily minimum, and given that there is both statistical and physical evidence for it, have you tried the “three straight-line segment” approach?
Thanks, Snow. I don’t use “three straight lines” because, as the head post shows, nature rarely moves in straight lines.
And Tamino is a witless coward who banned me from his site over a decade ago for telling excessive truth. Believe him at your own peril.
w.
If you called him names like that it’s hardly surprising Tamino banned you Willis! Can you recall the nature of the alleged “excessive truth” at this distance?
I do my own due diligence, and I’m a cynical old so and so about both sides of the alleged “debate”.
Getting back to the matter in hand, now that I’ve shown you a learned paper from 2004 explaining the shape of your smoothed graph, are you going to modify the bit in your OP about “not one climate scientist predicted that around 2012, the strong downward trend of Arctic ice extent would go flat“?.
Snow, your ugly speculation that I called Tamino names like that before he banned me is just the voices in your head. Ignore them. They’re not your friends.
Next, I got banned for saying that CO2 didn’t really start rising until the 1940s. Tamino didn’t like that. I never did figure out why, or why it was a bannable offense.
Finally, I have no clue what “learned paper from 2004 explaining the shape of [my] smoothed graph” you are talking about, and I’m not willing to go on a snipe hunt. Please post a link to it, and we can see if it said “around 2012 the strong downward trend of Arctic ice extent would go flat”.
w.
Evenin’ Willis (UTC),
Thanks for the info.
I already posted a link to an in depth explanation of the paper from 2014, including a link to the paper itself:
https://wattsupwiththat.com/2024/03/08/arctic-sea-icecapades/#comment-3879928
However if you insist it’s to be found here:
http://www.atmos.washington.edu/~bitz/Bitz_and_Roe_2004.pdf
It was written in 2004, so of course it didn’t include the phrase you specify. It did however provide a physical explanation for a future “negative feedback”.
Nighty night.
Thanks, Snow. However, I found NOTHING in that paper that explains the shape of my graph, with Arctic sea ice extent dropping slowly to 2000, then accelerating loss to 2012, and finally going level after that. In fact, the paper doesn’t mention sea ice extent at all. Not once.
Perhaps you could quote the section that explains my graph.
Next, the paper is curious. It claims that three climate models show what the data shows.
HOWEVER, the data (a mere 29 data points, but we use what we have) shows that ice thicker than ~1.5 m got thinner … but ice thinner than 1.5 m got thicker.
However, since not one of the climate models reproduced that pattern, I have no clue why they think the models do well.
w.
Good evening Willis (UTC),
Don’t be distracted by the equations and the “models”. Stick to the basic physics. See also the graph that so impressed BNice:
https://wattsupwiththat.com/2024/03/08/arctic-sea-icecapades/#comment-3880322
In 2004 nobody was predicting the events of 2007 and 2012. The surprises were all to the downside. Once most of the thick old ice had been cleared out of the Arctic Ocean the negative feedback described by Bitz and Roe became apparent.
To we sad souls that have followed the temperature distribution within freezing and melting ice floes for over a decade at least.
What does your smoothing method suggest if you remove the outliers of 2007 and 2012 from your dataset?
Snow, I have no idea what your underlying claim is here, or where you think I’m wrong.
I’d said that no scientist and no model predicted that the Arctic sea ice extent would go level around 2012.
In response you’ve made a claim that models could reproduce the overall general pattern of ice loss … but I pointed out they couldn’t do so. In response you say “Don’t be distracted by … the models”.
And more to the point, that said nothing about 2012.
Now you’re on about some graph and some other graph … neither of which shows a scientist or a model predicting the 2012 leveling out of the ice extent data.
Finally, you ask:
Well, it would suggest that I would be engaged in cherry-picking of the highest order by arbitrarily deleting valid accurate data to obtain a predetermined result.
w.
Morning Willis (UTC),
Where did I “claim that models could reproduce the overall general pattern of ice loss”?
I do recall saying “stick to the basic physics” though.
I also pointed out that it’s absurd to suggest that given the vast amount of noise in your “cherry picked” metric any “scientist or model” would or could have “predicted” what subsequently occurred in 2007 and 2012.
You have constructed a straw person of great stature!
Well it misses everything above 85ºN which is a significant part of the Arctic Ocean.
WRONG as always..
As Willis stated, it only misses 4% of the Arctic circle. !
Don’t you understand English BNice?
This thread started with Paul Homewood’s comment about “summer Arctic temperatures [which] have been around average in recent years, according to DMI.”
By which I assume he meant the familiar graph below, and he has yet to disabuse me of that notion.
Surely even you must be aware that the “Arctic Ocean” is a very different kettle of fish to “everything inside the Arctic Circle”?
FAILURE to make any rational point.. yet again
Current levels of Arctic sea ice are WAY above the Holocene norm.
Why are you such a COWARD that you can’t admit that fact ?
Are you blind BNice?
Willis’s graph in his original post starts in the late 1970s, not the early Holocene.
As already discussed ad nauseam.
Everyone knows the satellite data starts at the coldest point in the last 100 or so years.
Why make such a fatuous and stupid non-post, JimH
UAH only misses 2,84% of the area above 60N… the coldest part
You are a mathematical idiot, JimH, if you think that is going to make any difference.
which is why on their global chart they don’t include the polar regions
202401_Map.png
Tony M you promised!
The first red-black line is black and blue.
Mid summer 80-90N mean temperatures have been mostly below the average since 2000, because there has been an increase in cloud cover over the Arctic Ocean.
https://ocean.dmi.dk/arctic/meant80n.uk.php
That is clear evidence that they are merely tuned to match the past, and thus they have no credibility in predicting the future.
As they say about investments, “Past performance is no guide to the future.”
Hi Willis,
Long time no see!
Would it surprise you to learn that something we dubbed the “slow transition” has been discussed on the (world famous?) Arctic Sea Ice Forum since shortly after that estimable online resource started way back in 2013?
Hi, Snow. I’ve been here all along. Where have you been?
As to the “slow transition”, never heard of either that or the “Arctic Sea Ice Forum”. Hang on … OK, found it, but a search for “slow transition” on the ASIF home page yields … well … nothing.
In any case, welcome back!
w.
Two threads on that forum:
https://forum.arctic-sea-ice.net/index.php/topic,933.0.html
https://forum.arctic-sea-ice.net/index.php/topic,2348.msg391438.html#msg391438
ROFLMAO from one of those comments
“Because in some ~20 years tops, we’ll see ice free Arctic” (written in 2014)
Oh dearie me, how did that work out for them.. Wadhams would be so pleased. 😉
This the sort of total AGW crud JimH pushes.
Bnice – you’re obviously not thinking like them there climate enthusiasts. They’re frustrated that the Arctic isn’t co-operating so they’ll do what they always do – move the goalposts. ‘Ice Free Arctic’ now means something different to what it did about 10-20 years ago, pretty soon it’ll mean a reduction of about 50% then if that doesn’t work they’ll keep redefining what an ‘Ice Free Arctic’ means in the small print until they get something that fits. People won’t read the small print they’ll just see the headline – it’s just a small part of the big con.
So 10 years to see if they were right.
Going to be funny to wtch them as the AMO starts to turn downwards some time in the next few years 😉
Seems they still think 1 million km² ( = 1 Wadham ) is “ice-free”
Bizarre concept. !
Is that an AGW-Junkie site… or what !! 🙂
I think “physics” is the word you’re looking for BNice?
Ok… JUNK Physics.
See in particular a highly relevant reference:
https://forum.arctic-sea-ice.net/index.php/topic,933.msg32318.html#msg32318
From Bitz & Roe (2004)
“When perturbed, sea ice returns to its equilibrium thickness by adjusting its growth rate. The growth–thickness relationship is stabilizing and hence can be reckoned as a negative feedback.”
Physics BNice!
Oh dearie me, JimH citing JUNK physics from a JUNK Arctic site.
How’s that zero (meaning 1 Wadham) sea ice myth working out, JimH. !
As for the linked comment… as soon as you see Neven’s name you know it is totally propaganda pap.
And come off it JimH.. you are clueless about physics. !
Not as “clueless” as you by the sound of it BNice.
In actual fact I cited an academic journal article by a renowned Arctic sea ice expert from 2004 explaining Willis’s graph for him.
Poor Jim.. A “renowned AGW-cultist” , did you mean ??
It is based on CHIMP models using CO2.. You have got to be joking !!
Confirming it is JUNK physics.
Some quotes…
Very different sea ice physics from the others?? Now that is funny !! 🙂 🙂
Yep, it really is AGW-based JUNK physics.. thanks for pointing that out.
How about the bit I quoted above?
“No answer!” is your stern reply?
FYI: https://www.poetrysoup.com/poems_poets/best/15591/frances_king
YAWN.. meaningless waffle, pertaining to nought.
From a provably JUNK physics paper.
Please feel free to prove that this is JUNK:PHYSICS!
“During the winter, growth rates under 3-m perennial ice are nearly 2 orders of magnitude smaller than those in a refreezing lead“
Amazing JUST HOW MUCH SEA ICE there still is up in the Arctic, isn’t it Jimmy the clown.
It’s not in the least amazing BNice.
Which would be clear to you if you understood that simple graph.
Evidently you do not..
Poor Jim the clown.
You really don’t have anything but your idiotic ice-mania to offer, do you.
One heck of a lot of sea ice in the Arctic.
Far more than for most of the last 10,000 years.
At the risk of repeating myself:
(“No!”)³
Quoting gibberish children’s poetry.. ?
Same level of science as your other link.
Art BNice! Not science.
Poor JimH.. reduced to nothing but a child’s poem in a puerile attempt to make some mindless point.
As you say.. none of what you have posted is science.
I started chuckling, then laughing at post after post talking about ice melting in the Arctic, all at subzero temperatures. I still haven’t got an explanation from the climate enthusiasts as to how masses of ice just melt away in temperatures around -20°C or below.
Thanks for your kind words Willis.
Another point. You suggest in your article that “James Hansen, pontificating on the subject back in 2008” said words to the effect that he “predict[ed] an arctic ice-free summer by 2018“.
Do you have any evidence for that assertion, apart from the obligatory ancient newspaper clipping?
Still trying to make excuses for the UTTER FAILURE of Arctic sea ice forecasts to be anywhere near even 1 Wadham.
Next you will be DENYING that these FOOL mates of yours never made such stupidly wrong predictions. !.. Oh wait.. that’s what you are doing now. !
DENIAL.. just part of AGW-cultism.
If Hansen didn’t actually mean what he said to the press..
Why did he say it. !?
You aren’t accusing Hansen of perpetuating something he knew was pure fantasy, just for the press…. are you ?
I’ve seen videos of Hansen, and read transcripts of his presentations, from 2008. He mentioned “tipping points” and said “the Arctic soon will be ice-free in the summer”, but I haven’t seen any evidence that he quantified “soon”, to “the press” or otherwise..
Have you?
Then why did he say what he did to the newspapers…
Seems you ARE accusing Hansen of perpetuating something he knew was pure fantasy, just for the press….
We are very confident you are correct on this point.!!
“ “the Arctic soon will be ice-free in the summer””
So he was WRONG…….
Thanks for pointing that out.
Now shoot yourself in the other foot, once you get it out of your gob !
Mornin’ BNice (UTC),
I’ll take that as a “No!” then shall I?
So you are saying Hansen allowed the paper to print something he never said, without complaint or correcting them.
You really think Hansen is a lying, conniving POS, don’t you!
I’ll take that as a (No!)² then shall I?
The conclusion seems to be that James Hansen never publicly said the “5 to 10 years” words often attributed to him in certain circles, and since they’re not within quotes he didn’t even say them in private to Seth Borenstein?
And he never countered it in the press either.
He just let the LIES and MISINFORMATION ride..
Thanks for the admission.
Now change feet… again. !!
“estimable online resource”
You spelt that wrong… should be “execrable online resource”
Does it admit that Arctic sea ice is currently in the top 5-10% of the last 10,000 years?
Does it state that 1979 was an extreme high in sea ice extent
Or is it just cherry-picked AGW-alarmist propaganda ??
1979 was an extreme high, not dissimilar to the extreme extent of the LIA.. and it forced Arctic marine life out.
The beneficial drop in Arctic sea ice very slightly towards more normal Holocene levels has allowed many Arctic sea creatures to return to the region.
Creatures not seen or in evidence since the end of the MWP are now starting to return.
Narwals, Bowhead whales, and many other sea creatures all able to return because the slightly more open Arctic seas are again producing copious amounts of their food.
Also, great for the people living up there, as the routes around the edge of the Arctic Ocean are open for a slightly longer period each year.
There is absolutely no down side to the drop in sea ice from the ocean throttling extremes of the LIA and around 1979.
Seems JimH agrees it is an “execrable” junk site.
Noted the refusal to answer the questions… want to try again , dwarf-mind ??
Does it admit that Arctic sea ice is currently in the top 5-10% of the last 10,000 years?
Does it state that 1979 was an extreme high in sea ice extent ?
Or is it a twisted propaganda site, devoid of statements of reality.
Nice post, WE.
I went and spedread the Nature Arctic sea ice review. It is part apologia for past ice alarm failures, and part waffles about when in the future the Arctic might become summer ‘ice free’. According to Nature, it now all depends on this, that, and the other—which definitions, which models, which scenarios, where. Waffles stacked on waffles. Fortunately, useless for Arctic summer sea ice climate alarm.
If ‘ice free’ was remotely plausible any time soonish, the Russians would not be building nuclear ice breakers.
I like that. Waffles all the way down instead of turtles.
I’m not sure of that – I think it’s turtles on turtles all the way down but waffles stacked on waffles going upwards. It’s a directional thing – you want to build upwards, you need waffle, downwards you need a few turtles!
Just so long as they don’t forget the maple syrup !!
I’m not sure it’d go with turtle but ok.
They can have the maple syrup that drips through all the waffle…
… as maple syrup tends to do.
Lots of fake models to hold up.. they need the sustenance. 🙂
Good choice of the lede photo. It shows clearly that the glint off open water appears brighter than the snow-covered ice.
https://wattsupwiththat.com/2016/09/12/why-albedo-is-the-wrong-measure-of-reflectivity-for-modeling-climate/
Tony Heller has reporting of earlier satellite and ship reports of arctic ice coverage, and it appears to be possibly cyclical, with 1979 near a peak. A possible artifact of evidence collection methods?
TH, in essay Northwest Passage in ebook Blowing Smoke I presented two different lines of qualitative evidence that Arctic summer sea ice is cyclical, with a full cycle running about 70 years. Larsen’s two NWP transits in the early forties suggest near nadir. That would place a peak in the mid to late 1970’s, just before satellite coverage began. Of course, that is qualitative not quantitative as WE plotted out using the satellite coverage. But if correct, means the next 20 years should see Arctic summer sea ice recover.
We do have anecdotal evidence of large fluctuations in Arctic sea ice going back a hundred years or so – much better than Antarctic observations. If we can plot some of those then it might give us a tentative look at a full cycle or more.
Pretty sure no-one has yet been able to pass through the Arctic using the St Roch route of 1944.. Too much sea ice in the way.
The St Roch was a heavy wooden-hulled boat with an underpowered engine, and very limited navigation aids,
… unlike todays high-powered, purpose-built lightweights, with drones and satellites available for scouting ahead for passage through the ice etc.
“A peak in the mid to late 1970s”
Yet by 1984 the luxury cruise ship Lindbad Explorer was able to complete the 4790 mile journey from St John’s Newfoundland to Point Barrow, Alaska in just 23 days with guests paying $16,000 – $23,000 each.
Seems Arctic ice can vary quite a lot within a few years.
‘Northwest Passage’ E. Struzick and M Beedell, Blandford 1991
Larsen’s first transit took three years, last year 18 yachts made the trip, that would suggest to me that the 40s were hardly a nadir.
Not along the Larsen route, They all snuck along the southern route. Guided by satellite maps of the sea ice.
They didn’t sneak along it there was hardly any ice.
They did not follow the St Roch route. They would not have got through.
They did sneak around the southern route, because satellites showed it was passable.
The Canadian Seaice site disagrees with you. The southern routes were open didn’t need satellite.
Here’s a look at the St Roch route in August:
nh_SIC-LEADS_2023081600_081612.jpg
OMG, you are so thick !!.
Yes.. exactly as I said.. the southern route was shown to be open, by satellites.
They DID NOT use the St Roch route
Great-big-CON is one of the worst sites on the internet for twisted and biased AGW Arctic propaganda.
That they didn’t use it doesn’t mean that “they wouldn’t have got through”. Here’s the narrowest part that most sailed through, Bellot Strait, no need for satellite guidance there:
sept-5-bellott-nunavut-valberg-img_5786-copy.jpg
Queen Maud gulf
090823-nwp_3.jpg
Cape Bathurst
091123-nwp_3.jpg
Prudhoe Bay
091423-nwp_2.jpg
And finally some ice in the Beaufort
091523-nwp_3.jpg
Not much ice in the passage in September was there?
All pictures along the southern route
You really haven’t got anything in between your ears, have you, poor gormless twit. !.
They did NOT pass via the St Roch route…
Even the map you posted shows the route was blocked.
Sorry you are too incredibly DUMB to see that.
“Even the map you posted shows the route was blocked.”
No it does not, apparently it’s you who is the dumb one.
McClure Strait is shown to be ice free, however Larsen could go that route because it was blocked with ice and had to work his way through Prince of Wales Sound instead (also clear on the map I showed).
“At the end of August they experienced lots of heavy, tightly-packed floes and were prevented from landing due to the ice conditions. A lot of the journey consisted of following up leads and anchoring where they could. They found the heaviest ice of the voyage at the entrance to McClure Strait, where they had to moor themselves to the ice floes, and it was only at the beginning of September that the conditions were noticeably different – so much so that it was noted : “It was really the only fine day we had during the entire passage…” (2). After that, it was back to the heavy, tightly-packed ice-fields and the bad weather, with hurricane-force winds almost capsizing the boat before they were able to find shelter. In fact, the “…season was the worst in years.” (1) (2)”
Quite a contrast to last year.
You still haven’t addressed the FACT that they didn’t use the St Roch route.
You need to show the ice conditions at each point in their journey…
… then you will understand why they HAD to take the southern route.
You are so thick that you think a single day satellite image shows anything….. especially when that one image does show a blockage along the St Roch route.
Why are you so incredibly DUMB ???
“You still haven’t addressed the FACT that they didn’t use the St Roch route.”
Probably because they wanted to go the more popular way? The point is they could have if they wanted to, contrary to your baseless assertions that it was blocked! I was addressing Rud’s initial comment that the 40’s represented a nadir in the ice coverage by pointing out that there was much more ice then than last year.
Then we get all your nonsense about the St Roch route, which of course Larsen was forced to take because of thick ice in McClure. He went the northern route because he thought that ultimately would be the most likely commercial route due to its deeper channels.
The Canadian Seaice report indicates that those channels were navigable last year.
“In McClure Strait, very open to open drift thick first-year ice including a trace of old ice conditions continued for the month of August.
Further east, near McClintock channel, Larsen Sound, and the rest of Parry channel, close to very close pack thick first-year including a trace of old ice melted throughout the month of August. By the third week of August, the ice pack was reduced to open drift thick first-year ice including a trace of old ice. By the end of the month, these regions were reduced to predominantly open water.
Peel Sound started with generally open drift thick first-year ice at the beginning of August, with very close pack thick first-year ice in the northern end. This ice rapidly melted by the second week of August roughly 2 weeks ahead of normal. By the end of the month, the region was ice free.
In the western Beaufort Sea, the area of open drift thick first-year and old ice north of Point Barrow expanded as ice continued to melt during the month of August. By the third week of August, the area was mostly open water with some very open drift old and thick first-year ice. Further east, most of the very close pack old ice began to melt at the beginning of the month. By the second week of August, the ice pack was reduced to open drift to close pack old ice. By the end of the month, the northwestern Beaufort Sea experienced a significant loss of old ice and was reduced to very open drift old ice.”
As you’ve shown on multiple occasions you don’t have a clue what you’re talking about (which is probably why you make assertions with no data to back them up)!
You poor muppet.
A TOTAL FAILURE to counter the fact that the St Roch route has not been passable since 1944.
You need to show the ice conditions at each point in their journey…
… then you will understand why they HAD to skulk around through the southern route.
“A TOTAL FAILURE to counter the fact that the St Roch route has not been passable since 1944.”
Really, according to the records it has been crossed 17 times since then, plus 4 times crossing the original route which Larsen was unable to cross because of the thick ice in 44.
Consider it countered!
You saying so… is the very opposite of evidence.
Well we should apply the same rule to you who has never supplied any evidence to back up your false assertion that “the St Roch route has not been passable since 1944.”
Of course you ignore the fact that the St Roch took the southern route in its first transit and took 28 months because of the ice.
One of the recent crossings of the northern (1944) route was by the Coriolis 14 captained by Richard Merigeaux in 2012 as part of his ‘World expedition route’.
NWP_ROUTE.jpg
That same year David Cowper became the first man to sail through the McClure channel (Larsen’s planned route but he was unable to make it because it was blocked with ice). Cowper has crossed the NW Passage at least 7 times.
http://northwestpassage2012.blogspot.com/2012/09/world-record-by-david-scott-cowper.html
“At 15.33Z on 29 August 2012, David Scott Cowper and Jane Maufe (four-times great niece of Arctic explorer Rear-Admiral Sir John Franklin) aboard motor yacht Polar Bound, became the first yacht to navigate west of Cape Prince Alfred on the original Northwest Passage through McClure Strait discovered by Captain Robert McClure aboard HMS Investigator in 1851.[4] Polar Bound departed Portrush, Northern Ireland on Thursday 2 August 2012 at 1030 UTC and arrived at the port of Nome Alaska on Friday 7 September 2012 at 1800 UTC completing an official Northwest Passage by crossing both the Atlantic Arctic Circle 17 August at approximately 1000 UTC @ur momisugly 66.31 N 54.20 W and crossed the Pacific Arctic Circle Thursday 6 September at approximately 0640 UTC at 66.31 M 167.59 W. This northwest passage was just under 20 days transit.”
Jeez,
BNice has changed the subject yet again, in this case to one of my specialist subjects. And with a mouth still as foul as ever.
At the risk of repeating Phil:
“As you’ve shown on multiple occasions you don’t have a clue what you’re talking about”
Hear, hear!
It’s blissfully quiet in here now.
Here’s an official Canadian Ice Service sea ice chart from last summer.
The Prince of Wales Strait is completely free of sea ice. An adventurous mariner of the calibre of David Scott Cowper could have easily taken the M’Clure/McClure Strait by storm too.
Here you go:BNice:
From: https://GreatWhiteCon.info/2023/06/the-northwest-passage-in-2023/
“The clouds above the McClure Strait cleared today, to reveal:“
The historical arctic ice archive is known ?
More details
Over the Menu – resources – historical ice chart archive you find more, enjoy !
Covering , basically the Little Ice Age
Somewhere is a limit in historical reviews, but 1550 as starting point is reasonable, isn’t it ?
If that’s where they go back to…
… just pointing out it encompasses the coldest period, and presumably, the most extreme sea ice extents, in the last 10,000 years.
Satellite data goes back to 1974.
Photo didn’t take first time.
FYI: https://en.wikipedia.org/wiki/Nimbus_7
“Nimbus 7 was launched on October 24, 1978, by a Delta rocket from Vandenberg Air Force Base, California, United States…
The Nimbus 7 research and development satellite served as a stabilized, Earth-oriented platform for the testing of advanced systems for sensing and collecting data in the pollution, oceanographic, and meteorological disciplines…
Is it your claim that the data before 1979 doesn’t exist?
So absolutely ZERO counter to the facts.
You still haven’t answered if your propaganda Arctic site admits that current levels are in the top 5-10% of the Holocene, or that 1979 extent was an extreme anomalous peak.. (as shown in the chart above from mkelly)
Misleading since earlier Nimbus satellite started in 1973.
That is JimH’s MO…. misinformation.. deliberate or through wanton ignorance..
I’ll leave that up to you. ! 😉
That seems to be the MO of you and Tommy BNice..
FYI:
https://en.wikipedia.org/wiki/Scanning_multichannel_microwave_radiometer
“The Scanning Multichannel Microwave Radiometer (SMMR) [pronounced simmer] was a five-frequency microwave radiometer flown on the Seasat and Nimbus 7 satellites. Both were launched in 1978, with the Seasat mission lasting less than six months until failure of the primary bus.
The Nimbus 7 SMMR lasted from 25 October 1978 until 20 August 1987. It measured dual-polarized microwave radiances, at 6.63, 10.69, 18.0, 21.0, and 37.0 GHz, from the Earth’s atmosphere and surface.
Its primary legacy has been the creation of areal sea-ice climatologies for the Arctic and Antarctic.”
Hint is in the number after “Nimbus”, dumbass. !
Or do you think counting starts at “7”
Other data from DOD also exists showing a large drop in Arctic Ocean sea ice through the period 1930-1965, then dropping again to 1975.
Funnily enough, this matches recorded temperature around the Arctic rather well.
Wash your mouth out with soap BNice. That’s no way to talk to a lady!
See also Phil’s elucidatory comment to Tommy.
As I already pointed out to you, Nimbus 1-6 didn’t carry the SMMR instrument.
You ain’t no lady….. which dwarf were you with last night ?
You poor inconsequential twat !!
Satellite data goes back to 1974.. or are you DENYING what the IPCC published.
Evenin’ BNice (UTC),
Sadly your assertion is lacking the key word “consistent”.
FYI: https://nsidc.org/data/seaice_index.
Sadly, your comment is just another inconsequential yawn.
That word after inconsequential, I’m extremely surprised you got away with using it here and I don’t think it means what you think it means.
I use it in the UK way.. .
Having seen the other definition.. I will avoid using it in future.
From NASA:
“Over the Nimbus Project’s thirty-year history, the satellites increased the scientific community’s knowledge of the Earth’s atmosphere, land surface and ecosystems, weather, and oceanography. When Nimbus 1 launched in 1964, it gave meteorologists their first global images of clouds and large weather systems. By the time the second Nimbus mission went into orbit in 1966, the sensors onboard were sophisticated enough to measure the temperature of the ocean. Nimbus 3 in 1969 added atmospheric temperature observations and the ability to measure solar radiation above the atmosphere. In 1970, Nimbus 4 began collecting our first global observations of the ozone layer, and by 1972, scientists and engineers had incorporated into Nimbus 5 the capability to measure rainfall over the world’s oceans and to map and monitor sea ice. Taking the atmosphere’s temperature became more sophisticated with Nimbus 6 in 1975, which gave scientists the first satellite-based measurements of atmospheric temperature at different altitudes. The final mission, Nimbus 7, which was launched in 1978, collected data on ozone, the stratosphere, ocean conditions, and global weather until 1994.”
I know about the earlier Nimbus satellites I should have been more specific in pointing out the CONTINOUS sea ice coverage that began in the early 1970’s.
Yeah, not full coverage though, there are holes in the data.
Please explain. How big are the holes etc.
As far as I can make out, all of the early Nimbus missions from 1964 onwards used a visual still camera and a long reel of actual film to take pictures – which seriously limited the number of pictures taken and the quality. For example, because the camera needed a light source, no photographs taken during Polar winter are useable, which eliminates a huge part of the cycle. Also any photographs taken during periods with cloud cover are similarly unuseable. From what I understand the project to recover some of the data, at least, is doing well with the Polar summer photographs that they have.
Those obstacles don’t invalidate measurements of extent or area. There are perfectly valid reconstructions going back to 1953. E.g. this one
Nueva serie de extensión del hielo marino ártico en septiembre entre 1935 y 2014, Cea-Pirón och Cana-Pasalodos, 2016, Revista de Climatología (ISSN 1578-8768). Data här: https://doi.org/10.5281/zenodo.44758
See the graph.
Another similar reconstruction is from
Re-calibration of Arctic sea ice extent datasets using Arctic surface air temperature records, R. Connolly, M. Connolly och W. Soon, 2017, https://doi.org/10.1080/02626667.2017.1324974
Like I said, there are holes in the data. It doesn’t mean the whole lot is unuseable but the ‘satellite only’ approach needs modifying to include other references to fill in the gaps – a multisystem approach. Given the errors and uncertainties with satellite measurements I’m surprised that anyone uses the ‘satellite only’ approach without referencing other data to back it up.
And another
“…models are just a reification…..”
This is the key point in the whole climate debate. Climate models are just a putting of theories into numerical form so that they may be tested against real world and found to be confirmed or denied.
The results of models are not facts, findings, or evidence. The results are numerical projections of theory, and no more.
Any scientist or journalist or scientist who claims to have found out something real by running a model through a computer is a fraud, when you get down to it.
Science is about setting real measurements against a healthy skepticism.
Very nice Willis.
We must put our foot down and stop letting these CAGW crackpots define the language we use. Ice free means zero ice.
“The definition of an ‘ice-free Arctic’ has varied over time. Early on, it referred to the nearly complete disappearance of all sea ice, or zero SIE [sea ice extent]. However, as thick sea ice remains north of Greenland and the Canadian Arctic Archipelago more than a decade after the rest of the Arctic Ocean becomes ice free in September a SIE threshold of 1 million km2 [386,000 square miles] became commonplace.”
If these rascals are warning us about the danger of a million square kilometers or less then that is exactly the language they must use.. I am sick and tired of their fudging, lying and cheating.
Don’t worry, Wadham got mocked endlessly for back-tracking and saying he meant 1 million km².
Even got the unit of sea ice extent, 1 Wadham = 1 million km² , named after him. 🙂
When Wadham predicted the Arctic would be summer ice free by about 2014 he did NOT mean one Wadham (1 million km^2) would remain. Excellent point, WE.
Wouldn’t be surprised if the so-called ‘linear relationship’ is down to one of the most basic statistical errors of all, which is that all of the variables are heading in the same overall direction. It’s difficult to see how it could be down to anything else because there’s no other way those variables are linearly related.
What climate science really needs is statisticians, not climate ‘scientists’.
What “climate science” needs is SCIENCE. What they’re doing these days has little resemblance to actual science.
Willis,
Some Australian financial investment companies are lately ending their advertising with words like these – “Past performance is not a reliable indicator of future performance.”. Geoff S
Ha ha. I’ve noticed that too Geoff.
They go on for about five minutes telling you how great past performance is and how you should invest because of that, then at the end of the ad tell you that everything they just said should not be taken seriously by using the quote above. (in a very fast voice) Reminds me of a Simpsons episode where at the end of a news TV story, the disclaimer was….”these events may not have happened”.
That’s like the disclaimer “based on true events”.
Meaning: not everything we say is entirely true, we may have exaggerated a bit.
That disclaimer has been in every prospectus I have read since I started investing many years ago.
Hello Willis
I don’t know how your CEEMD smoother processes original data.
I downloaded data from
NSIDC Arctic sea ice extent monthly (aka NOAA G02135);UAH 6.0 LT Arctic Ocean;HadISST1 ICE;HadISST1 SST.
From the HadISST1 1 degree data I generated monthly anomaly time series.
All series are anomalies wrt the mean of 1991-2020, and run from Jan 1979 till Dec 2023.
Since these four time series have different value ranges, I preferred to convert them all to percentages of their respective maxima, inverted the ocean temperature series and finally obtained for them a third order polynomial:
As you can see, UAH’s ocean data very well reproduces the recent uptick visible in the NSIDC data; and HadISST1 SST shows at its end a deceleration similar to that visible in HadISST1 ICE.
Best regards from Germoney,
J.-P.
Since UAH warming in the Arctic is totally natural, with no evidence of any enhanced CO2 effect….
… seems that Arctic Sea Ice cycles are also totally natural.
1979 was certain an extreme extent, and pushed out a lot of Arctic sea life.
Thankfully, a lot of that is now returning.
Nice data.
You’re welcome.
Almost looks like it might be part of a 70 odd year CYCLE, doesn’t it ! 😉
OMG… I’d be quite happy if this all-time-everything-better-knower could finally refrain from posting his eternal superficial egomaniacal blah blah.
No hope so far as it seems.
You’re replying to your own post, complaining bitterly about you posting ‘egomaniacal blah blah’. Couldn’t you have had that entire conversation in your own head without dragging the rest of us into your internal monologue?
Mr Page
Instead of showing how well you misunderstood me, please try to understand that some of us can get really tired of bnice2000’s irrelevant and often enough very impolite ‘comment’s.
Did your mummy not change your nappy this morning ???
Where was I rude to you in the posts above where you went on your petty whimpering?
Why are you DENYING the existence of a well know 60-80 year cycle ??
I didn’t misunderstand you in the slightest but might I suggest that a reply directed at bnice rather than yourself might have been the way to go?
Poor bin-liner…. only egotistical twat around here seems to be you. !
More “blah, blah” every time you post.
Thanks, Bindidon. Their claim was that global or arctic air temperature data tracked well with Arctic sea ice extent. They don’t. You are using ocean only arctic MSU data, which is a different beast.
Next, you are looking at sea ice area, which again is a different beast from sea ice extent, which is what they are discussing.
Finally, a polynomial is a very poor choice of smoother because it is incapable of recording quick changes and turns as exist in the Arctic sea ice extent dataset. Better choices would be a LOWESS, Gaussian, or CEEMD smooth. I use CEEMD because it gives better answers at the beginning and end of the dataset, and because the smoothed lines are actual components of the underlying cycles rather than being merely local averages of some kind as in LOWESS or Gaussian smoothing.
My best regards to you as well,
w.
Thank you too Willis for the convenient reply.
(1) It was not my aim to show what they did wrong; rather, I reminded Roy Spencer having written somewhere that sea ice extent is highly influenced by ocean temperatures in its near, and that this is visible even in the lower troposphere.
I just wanted to show how sea ice extent and inverted ocean temperatures compare.
I think moreover that the main difference between our graphs is that you use September data showing extent minimum, whereas I use the complete monthly time series.
*
(2) “ Next, you are looking at sea ice area, which again is a different beast from sea ice extent… ”
No I don’t, please have a look at a comparison of area to extent:
and this is how the graph above would have looked like (purple lines):
*
(3) I agree: neither polynomials let alone simple running means are ideal, but I’m a layman and for me, polynomials and SRMs explain enough.
I have also a Savitzky-Golay filter but it doesn’t work everywhere. And a CEEMD software for my Leap Linux variant isn’t available 🙁
Starting in 1979…. the COLDEST year in 100 or more years, and a year of extreme high sea ice that drove Arctic sea creatures out of the Arctic.
With the slight drop, back partly towards more normal Holocene levels, some of that sea life is starting to return.
Critters not seen or in evidence since the latter part of the MWP are returning as the sea ice recovers from those extreme highs.
Travel around the perimeter of the Arctic is now possible for a slightly longer time each year.
Let’s hope the upward part of the cycle you have shown us, doesn’t increase sea ice too much, and drive those Arctic sea creature back out of the Arctic, and make sea travel impossible again.
Negative North Atlantic Oscillation conditions drive Arctic warming, and not and just in winter NAO, deeply negative NAO summers 2007 and 2012 had the lowest sea ice extent. 2019 also had a deeply negative NAO summer.
All the global circulation models say that rising CO2 forcing will cause increasingly positive NAO conditions. As with the Met Office UK climate projections for drier warmer summers and milder wetter winters. Which is a positive NAO bias. So to blame the Arctic warming since 1995 on rising CO2 forcing is scientific double-think of the highest order.
10.3.5.6 Annular Modes and Mid-Latitude Circulation Changes:https://archive.ipcc.ch/publications_and_data/ar4/wg1/en/ch10s10-3-5-6.html
The Arctic sea ice extent declined with the negative NAO regimes 1995-1999 and 2005-2012, due to generally weaker solar wind states, and then slightly recovered through the more positive NAO conditions since 2013.
Hi Willis, my concern about the use of the area/extent as a measure is that it leaves out the thickness of the ice. Currently the sea ice volume is ~3rd lowest, given that the area is about 10th lowest that suggests that the ice is rather thin.
index.php
One indicator of this is that in 1987 about 40% of the ice was older than 4 years old (and therefore thick), now it’s less than 10% of the total.
DFOru6SVwAA9W0O
All this suggests to me that while the area has stabilized that the ice is potentially more vulnerable and a storm such as the one in 2012 would have an even more severe effect.
I certainly expect that the CAA might clear fairly quickly this year since was very slow freezing this winter.
There are storms every year that break up Arctic sea ice – January to early March is usually storm season in the Arctic but it can happen earlier or later on occasion. The problem with the estimates of Arctic sea ice is that they have never been very accurate – satellite observations were off by about 25% or more and airborne systems are easily confused by surface water or salty ice. I really would treat all Arctic ice thickness estimates with a healthy dose of scepticism – definitely not as exact, accurate measurements.
The reason I referred to the 2012 storm was that it is usually regarded as the reason for the record minimum that year. Given the current state of the ice a similar August storm could result in a new record low.
I’m sorry, I probably wasn’t making my point as clearly as I might have done. The storms every year are what creates the sea ice minimum – a strong storm season means low sea ice that year and a weak one means much higher sea ice. Low temperatures may encourage faster sea ice formation and higher temperatures may cause slower (by comparison) sea ice formation but this is secondary to the main mechanism of storms breaking up the sea ice and driving it away.
Why concerned.? That’s just stupid.
Lower amounts of Arctic sea ice make it much more liveable for Arctic sea creatures.
Current levels are still well above what they have been for nearly all the Holocene.
So stop you brain-washed panic, and face reality.
All that is true, Phil, but I was analyzing their claims, which used sea ice extent.
w.
No problem, that was my point, I wasn’t criticising your analysis. I just think that their focus on area/extent can be misleading for the reasons I stated.
Well done, Willis. Trendology fails again.
Representative Concentration Pathway 8.5 (RCP 8.5) was called the “business as usual” scenario when, in fact, it was known to be wrong from the get-go. It has been shown to be improbable and likely impossible.
One of the first thing one does when doing and writing research is to start with a review of literature. I think I learned this by Christmas of 1965.
Using other people’s money (OPM) for this research is fraud.
“In the chaotic giant heat engine we call the climate, everything is connected to everything else, which in turn is connected to everything else …
…… except when it isn’t.”
I just loved this, Willis
Bravo y unabrazo
Abrazos a tî tambien, bonita.
w.
No, the media reporting / journalists have focussed on a “sexed up” version of the most extreme scenarios.
See a copy of Figure 4 from the paper attached below.
NB : My eyesight is getting worse. Is it just me or are the lightest, blue-grey, rectangles limited to the bottom two graphs, SSP2-4.5 and SSP5-8.5 ???
Earliest August “ice-free” probability > 10% (= “Unlikely” …)
SSP1-1.9 : 2018
SSP1-2.6 : 2036
SSP2-4.5 : 2031 [ “Very unlikely”, 1-10%, in 2029 … ]
SSP5-8.5 : 2029 [ “Very unlikely”, 1-10%, in 2026 … ]
Earliest “As likely as not”, 33-66% probability, ice-free Septembers
SSP1-1.9 : 2027
SSP1–2.6 : 2037
SSP2-4.5 : 2029
SSP5-8.5 : 2033
When it comes to the “earliest ice-free Arctic” climate model runs, the “most extreme” emissions pathway, according to Jahn et al at least, is SSP1-1.9, not SSP5-8.5.
Sorry for my lack of clarity, Mark. What I meant was that in “Table 1 Predictions of an ice-free Arctic from the literature”, which is the data I used to create Figure 5 above, only the most extreme scenarios were used.
w.
Russia has ~40 icebreaker ships, which is roughly double what the USA has. Both countries plan to build more. Seems foolish to be building ice breaker ships if we are to accept the climate catastrophe howler monkey’s claims that the Arctic will be ice free. The climate catastrophe howler monkeys are probably just gaslighting or lying for undisclosed reasons.
Do you remember some years ago a Russian submarine planting a flag on the seafloor near to the North Pole (they weren’t able to get exactly on top of the spot iirc). That was the Russians buying into the ice-free Arctic, along with reactivating several Arctic military bases and the resumption of Russian Navy patrols through the Arctic waters. The Russians bought into the idea of the ice-free Arctic as much as anyone else and, if they’ve started building more icebreakers, that’s just them being more realistic than others now. The climate enthusiasts are just wandering around banging a broken drum about the Arctic now – it looks like the ice is levelling off and, who knows, it might even take an upturn.
Didn’t Roger Pielke say something to the effect that say ever since RCP 8.5 was shown to be nonsense it has been used in 28,000 climate papers.
I guess this is now 28,001
Willis says “There is no simple linear relationship between either global or Arctic temperature and Arctic sea ice extent“.
Jahn et al. (2024) say in their review paper that:
“Although observed sea ice loss has a roughly linear relationship with global mean surface temperature and with the cumulative carbon dioxide emissions, these relationships might not hold for the future given changes in the mix of external forcings that contribute to forced changes in regional Arctic warming and Arctic sea ice loss.”
and conclude that:
“Uncertainties in observed relationships occur because of short time series and/or uncertainty in whether historical relationships will continue in the future. For instance, extrapolating a short 12-year (1996–2007) observed linear relationship into the future led to prediction of the earliest possible ice-free Arctic in 2016 ± 3 years. This prediction was not realized because the observed rate of sea ice decline is not constant in time, illustrating why linear extrapolation, especially of short time series, is not a reliable prediction method.”
Discuss!
“Discuss!”
When some crystal ball gazer says something like..
“these relationships might not hold for the future”
It becomes pure anti-science speculation… not worth the time on discussion..
Leave you plenty of time to go back and play with your dwarves..
Here’s another strange thing BNice.
Willis says that “The authors have used only the most extreme climate scenarios“, but the paper in question includes the following diagram.
Nighty night.
Hmmm. It seems WUWT doesn’t like .WEBP?
Try this instead:
Meaningless model-based conjecture…
Thanks for proving crystal balls are their only source.
And admitting it is pure anti-science speculation… not worth the time on discussion.
After you make a prediction about the future, is the future free to change? Or does the prediction lock the future in place?
If the future is free to change post prediction, then how can the future be reliably predicted?
If prediction locks the future in place, then how can Climate Change?
Great analysis. And if we think logically about the possibility of an ice free summer in the arctic we might not see it as a disaster. First when the ice is gone the arctic will radiate more of the heat it inherits from the tropics into the atmosphere and then to space – i.e. it will promote cooling. Second, as honest polar bear researchers have told us and geologic history supports polar bears do fine with ice free summers as their feeding on ice is mainly in the spring, not summer. Thirdly ice free arctic waters absorb more UV light and are therefore more productive as the bottom of the food change expands and thereafter all life forms above the bottom also thrive. How is that a catastrophe?
We know we live in an interglacial period of an ice age, but in geologic history this is an exception. For most of Earth’s history there were no polar ice caps and life thrived. Only paranoia could cause people to fear something that is natural and not unprecedented over the long span of time.
Perhaps what we should do in the near term, is figure out how human society will manage when our current and probably expiring interglacial period finally throws in the towel.
We know exactly what will happen once the Arctic Ocean melts – nothing at all. The Arctic was almost certainly ice-free in Summer during the early Holocene, with no catastrophic consequences whatever.
.https://www.nature.com/articles/s43247-023-00720-w
Agreed.
I think the most telling and most ridiculous part of climate modelling is that in most averaging out the outliers are generally removed. That would be RCP8.5 I believe but what to use at the other side of the average. In virtually all the retrospective modelling the lesser outlier is the recorded actual data – doesnt that show up the entire bias that is climate modelling?