Why “Renewables” cannot save but cost Billions
Over the last 150 years, abundant electricity from coal and gas led to an unprecedented reduction in poverty, as well as an increase in longevity and health. Currently, these low cost, reliable power sources generate approximately 60% of electricity and 50% of primary energy worldwide. Primarily due to climate change concerns, coal and gas fuels are now slowly replaced by ‘renewables’, such as wind and solar based energy. But this comes with a cost.
Bloomberg issued their latest global Levelized Cost of Electricity (1) (LCOE) analysis in 2023, comparing the historical LCOE of various ‘renewables’ with the cost of coal, gas, and nuclear, drawing a misleading conclusion of wind and solar being most cost-effective (Figure 1). LCOE based reports and analyses also by other organizations such as IEA, IRENA, IEEFA, IMF, Agora, form the basis for many governments to mistakenly conclude that the transition from a coal and gas based power system to wind and solar will save billions, if not trillions at global scale.
Political decision makers know the three pillars of a successful energy policy (a) reliability, (b) affordability, and (c) environmental sustainability. But when taking a closer look, it becomes apparent that, power ministries are struggling to find a balance within this ‘Energy Trilemma’ and moreover, that the three pillars follow a specific priority:
As a prime concern, access to reliable energy is needed, before considering the affordability thereof. Once the balance between reliable and affordable energy is achieved, only then environmental sustainability can be tackled in a meaningful way.
Claiming “renewable” energy from wind and solar is cheap and comes without environmental consequences, is a crucial and detrimental energy economic misunderstanding.
The unpopular truth, which is undisputed even by top energy economic institutions such as OECD and IEA, is that (a) wind and solar at grid scale are always more expensive than coal and gas, even nuclear, and (b) the total costs to an economy rises exponentially with higher wind and solar share in the power system. The result is that the proposed “energy transition” would cost over 7 – 10% of the global GDP, amounting to trillions of dollars, and as per IPCC data would supersedes the cost of a warming climate.

Figure 1: Bloomberg LCOE analysis (source Bloomberg New Energy Finance BNEF)
Why is it wrong to use LCOE when evaluating the cost of power to a country?
LCOE, levelized cost of electricity, is s a “micro economic” instead of total system view, excluding seven cost categories (listed below), and therefore, will never be an accurate indicator for governments to base energy policy decision on.
LCOE is misleading because it does not consider nor account for intermittency, low natural capacity factors, correlating wind and solar ‘availability’ across continents, and the locational disparity of demand and supply.
Obvious costs omitted from LCOE:
- Backup or long duration energy storage (LDES): Wind and solar require at least 100% backup or storage for every installed MW. (2)
- Network integration, including costs for transmission, distribution, balancing, and conditioning.
Not so obvious costs omitted from LCOE at grid scale include:
- Efficiency losses – more wind and solar means less asset utilization (3) of backup or grid systems.
- ‘Room’ costs Space requirements? driven by low energy density (per m²) of wind and solar. There is an economic and environmental cost to “utilizing” thousands of km² to capture the diffuse energy from the sun and wind.
- Recycling costs, driven by low energy density (per kg) and short lifetime of wind and solar.
- Environmental costs – i.e. damage to plant and animal life, negative effects on climate systems, including from warming, wind extraction, and atmospheric changes.
- Raw material and net energy inefficiency (eROI) – of production, processing, transportation, upgrading, manufacturing, and recycling of the entire system, including its environmental impacts.
Only an estimate of the Full Cost of Electricity FCOE will include all costs and should be used (Figure 2) to evaluate the total cost to a country or system.

What is the impact on humanity, when grid scale wind and solar technologies increase energy costs and reduce energy reliability? The Economist estimated that, in the UK during the winter of 2022/23 alone, high energy prices resulted in over 65.000 excess deaths, more than those caused by Covid19. High energy costs cause increased suffering for the poor and slow industrial development not only in developing nations.
Not every solar panel or windmill is undesirable, there are applications and locations where they make sense. However, logically, if wind and solar are a substandard grid-scale power solution, so is hydrogen, produced from wind and solar. Remember, H2 for storage “loses” 65-80% of input energy for production, storage, transportation, and repowering. Hydrogen is hazardous to store and transport, highly explosive and so “thin” that it penetrates and embrittles steel. When leaked it’s “warming impact” would be 12 times that of CO2.
In conclusion, we can agree that we must endeavour to reduce the environmental externalities of all our energy systems. However, the ‘transition’ to wind, solar and hydrogen leads to an increase in the cost of energy and reduction in reliability, as well as serious impacts on ecosystems which is counterproductive and results in undesired consequences for humanity.
Poverty, peace, health, education, and the environment should have our highest attention and are short of funds. We should divert investment from wind, solar and hydrogen and/or batteries to where the money will make a genuine positive impact to our environment and economies. For a truly long-term sustainable,
energy dense future, in addition to more R&D and fission/fusion, we should invest in building/upgrading to newest high efficiency thermal power plants and installing up-to-date filter systems, globally.
We urgently need investments in power plants, fuels, and refineries to avoid a prolonged global energy crisis with all its consequences to lives, health, and wealth, especially for the impoverished.
The first precursors to this energy crisis appeared in 2021 prior to the Ukraine war.
For a more in-depth explanation on these issues touched upon in this article, please refer to our recent book. “The Unpopular Truth… about Electricity and the Future of Energy”, at Amazon and www.unpopular-truth.com.
A selected list of references supporting that LCOE cannot be used to compare wind and solar with dispatchable thermal power generation at grid scale can be found here https://unpopular-truth.com/lcoe-links-htm/ .
Notes:
- LCOE measures only the cost of building, operating, and providing fuel (usually inc CO2 taxation) for generating electricity. It does not include other costs, such as but not limited to network integration, backup/storage, recycling, etc. See Figure 2
- I say at least because of energy losses of backup/storage systems, and short and long-duration energy storage maybe two systems.
- Asset utilization can be explained with a car. Compare the total cost of a car such as purchase, maintenance, insurance, and fuel per km when you (a) drive it once every week for 5 min vs. (b) when you drive it every day for 2 hours straight without interruption.
The total system is what is being paid for, not individual elements. So the required backup for weather dependent sources should be accounted for as a cost of wind and solar.
Speaking of accounting for costs, does the IPCC account for any benefits of increased CO2?” Or is it all bad?
“The result is that the proposed “energy transition” would cost over 7 – 10% of the global GDP, amounting to trillions of dollars, and as per IPCC data would supersedes the cost of a warming climate.”
The IPCC and most climate alarmists do not recognize the existence of any positive externalities for CO2.
The Green Blob does not believe in real cost/benefit analysis, but in moral judgements. Capitalism, fossil fuels, and any warming are Evil, and must be opposed.
I can remember articles on all the bad plants that would have longer growing seasons and be a danger to us humans. Poison Ivy, Water plants plugging channels, Kudzu, etc. with no mention of the good plants that would also have longer growing seasons.
Like food grains, for example.
I’d say more specifically, the benefits of using fossil fuels need to be considered, which are tremendous since it is their use that enables the very existence of modern civilization.
To which the more limited scope of benefits of more CO2 itself can then be ADDED (higher crop yields, faster tree growth, etc.).
So currently they:
The telling part to the thinking mind is that you can’t even build the worse-than-useless windmills and solar panels without all the energy inputs into their material acquisition, manufacture, transport, erection on site, maintenance during their (short) operating life, demolition and disposal being from fossil fuels.
The Climatrons declare that whilst there are benefits, these are short term and will be reversed after a few years as we descend into Climagheddon, therefore are not to be considered.
Lol.
Short term? So adequate food, running and clean water, electricity, transportation, heat when it’s cold, air conditioning when its hot, tv, internet, cell phones, etc. ad nauseum are SHORT TERM BENEFITS?!
I still want to see my idea for an actually entertaining (unlike most of them) “reality show” where climate snowflake “contestants” are assigned a personal “climate Nazi” who proceeds to take away everything that is derived or produced with the use of fossil fuels.
And let the sweet music of their whimpering begin!
The IPCC follows Political Science, which is the science of manipulating the masses & can be effected by consensus (as was done in the cases of Galileo & Ignaz Semmelweis), instead of following Scientific Method. They support political agendas, not science that is dedicated to expanding accurate knowledge.They believe in might instead of right & have hijacked many science journals & use the methods exposed by the Climate Gate leaks.
“‘Room’ costs Space requirements? driven by low energy density (per m²) of wind and solar. There is an economic and environmental cost to “utilizing” thousands of km² to capture the diffuse energy from the sun and wind.
Environmental costs – i.e. damage to plant and animal life, negative effects on climate systems, including from warming, wind extraction, and atmospheric changes.
”
Nothing made quantitative in this article. But the comparison is not all one way. Here is a picture of the 175 MW coal power station at Collinsville, lQld, with a 42 MW sollar array. It’s true that the coal mine also exports coal. But fossil fuels have their non-LCOE costs too.
Fossil fuels work 24/7. Wind and solar do not.
You can rely on fossil fuel energy to be there when you need it. Wind and solar cannot do any such thing.
Also, if you replaced that footprint of the Coal Mine with just solar panels you would only produce about half the energy as the Coal Generation does and only from 10am till 2pm local time.
You would also require huge storage batteries as the power produced during those hours might not be needed then but may be required later in the day, after the sun has become ineffective
It’s never Just Solar but always Solar PLUS Battery and should also be Wind PLUS Battery
as both facilities require massive over building to work during lull times
While the wind may always be blowing somewhere it won’t be possible to generate electricity there and deliver it where the wind isn’t blowing everywhere else. Instead of Hectares per turbine you would need tens of wind turbines per hectare in that somewhere to provide power everywhere else
Gosh Nick, I wonder if coal powered stations work at night?
There was a reason the IEA said back in 2020
“the system value of variable renewables such as wind and solar decreases as their share in the power supply increases”
IEA ‘Projected Costs of Generating Electricity’ (2020 p13)
High shares of intermittent energy lead to instability and potential collapse of electricity grids. Mitigating this requires significant investments in backup, firming of the grid and storage solutions such as batteries and hydrogen. These costs are all disregarded when unreliables are touted as the least cost option for electricity generation.
Two things, After the coal has been removed the land is restored. The cost of that restoration is built into the cost of coal. So this cost is already internalized.
This mine is temporary, wind and solar fields are permanent.
Nick is still trying to muddy the waters with his patented distractions and untruths.
“After the coal has been removed the land is restored.”
By elves? Hazelwood was closed in March 2017. Here is a snap of the mine, five years later:
“This mine is temporary, wind and solar fields are permanent.”
Well, yes. When one runs out, you have to dig a new one. Which they do much more enthusiastically than rehabilitating the old one.
Look at all the green starting to come back.
Would make a great venue for rally car races, Dirt bike races etc etc.
You could even tar a good motor racing circuit to match Mt Panorama.
And why would you cover up a mine you know you are going to need at some time in the not too distant future…
… once all the anti-CO2 nonsense gets assigned to the dustbin of history.
It took far longer than 5 years to remove the overburden and lower coal bed. It will take longer than 5 years to restore the land
Best use for a played out open pit mine is Pumped Hydro storage
Pumped hydro is a perpetual motion scam. It takes more energy to pump than can ever be produced.
Not if it has relatively low losses. It can be a cheaper way of smoothing power supply than having additional generation standing by unutilised waiting to be turned on when live power generation sources drop out.
I don’t think people who know even the basics of hydro think you avoid losses.
Really depends on the material mined there and is exposed in the void walls or pit floor.
Brown coal is very susceptible to spontaneous combustion when exposed to oxygen sources. The change in water level might make controlling this extremely difficult.
The same mechanism makes changing water levels in voids with sources of acid forming material (PAF) a bad idea.
Environmentally, the end result of a coal mine is that all the coal has been removed. It is the same as cleaning the earth of toxins and returning it to its pristine natural state which all green thinking people agree with. Where there was once infestation of toxins now are pristine again. Whats not to like?
I’m currently involved in working up closure costs for a couple of mines.
It typically takes 15 years to 2 decades to get shaping completed and good growth of trees and vegetation. If there are tailings dams then that can be up to 3 decades depending upon the arrangement and the ability to keep the tailings consolidating.
Your comments display a complete lack of knowledge of modern mining practises. Closure is an integral part of the planning and operational cycle. Or maybe your comments are what you wished happened.
“Your comments display a complete lack of knowledge of modern mining practises.”
As so often at WUWT, you are addressing the wrong person. It was MarkW who blithely said
“After the coal has been removed the land is restored.”
I simply pointed to a mine near here where nothing seems to have happened, seven years after the power station was dismantled.
But the basic issue here is that people want to look at non-LCOE factors for renewables, but not for fossil fuels. “It typically takes 15 years to 2 decades to get shaping completed and good growth of trees and vegetation” is not a plus for coal.
Try the day side of the moon, it’s always sunny there….
And it requires energy and fuel to clean up the mess from things like mining for copper lithium etc etc too. No free lunches either way. But we must have reliability at the base.
Nick, at what point do you reckon it could be a face-saving move to admit that wind & solar will only ever amount to a supplemental grid-scale electricity supply?
And by the time that conclusion is admitted, it would be obvious that there isn’t any point in building wind & solar at all – they’re just garnish.
Nick won’t admit that until he’s paid to.
well Nick, which part of the picture is the actual coal burning power plant? If you want to include the coal mine, then you need to include the mines for all the materials in the coal plant and the solar panels, the factories that build the parts and the waste dumps where the non-recycled materials are stored after their useful life.
It’s good that you accept the other points and can only find (tenuous) fault with 2 of the points.
By my back of envelope calculation, you’ll need another 14 solar farms and a massive battery farm to match the delivered output of the coal plant. Collocating a coal mine and power plant eliminates fuel transportation costs, but is certainly not necessary.
I looked up the solar farm, which produced 91.4GWh over the past year. An average of 10.43MW. I reckon it would take over 15 solar farms to produce the same as the coal station. That looks like this, with white being duplicate solar farms and black being the coal station including cooling:
So then the question is whether you prefer fields of solar panels neatly arrayed with grass between, on which sheep may safely graze, or a dirty big hole in the ground, with belching chimneys beside.
belching chimneys?
Oh. Nick still thinks the steam is CO2 or pollution…… or something.
That hole will later become a beautiful lake.
The wind turbine bases will pollute the environment for ever, as will the blades.
Last thing sheep need is the toxic debris and leaching from solar panels.
So, can we have a picture of this idyll, with grass and sheep in situ?
1) The hole will only be there for a few years.
2) Are you really stupid enough to believe that there will be grass between the rows of solar panels and that sheep will be grazing that grass?
Grass doesn’t grow in the shade. The panels are packed as close to each other as possible. The only gaps between the panels are for the use of utility vehicles and as such will be either paved or gravel covered.
3) Belching chimneys? Not since the early 70’s.
“The hole will only be there for a few years”
Well, it will run out of coal. Then they dig a new one. Hardly a plus point.
Especially as the now unused hole remains for a very long time.
So what? We dig holes all over the place for homes, offices and the materials that construct them. We dig holes to quarry all kinds of materials, like cobalt, copper, silver, gold, aluminum, iron, etc. Digging holes has always been better than living in mud huts and bison skins.
And digging holes to extract minerals is far safer than tunneling underground for the same purpose.
Solar panels require Quartz and Coal to make the silicon wafers for PV.
Coal and Quartz are both mined Open Pit
Wind Turbines require Structural Steel, Copper and lightweight materials
Wind Turbine Mast Steel needs Iron and Coal … Open pit mining
Copper (generator) is also mined … open pits
Turbine blades require petrochemicals … drilling, extraction and processing of Oil and Gas
Neodymium and other rare earth’s … Open pit mining
That Coal pit would still exist just being used for producing something far less useful and far lower density energy than burning it directly for energy
Complaining about the “Pit” is pointless
Nick actually believes that he’s found a bullet proof argument against coal.
Well, it will run out of coal. Then they dig a new one.
Happens with every mine. Where do they get the materials to build the panels?
Nick thinks that stuff just magically appears. He doesn’t realise that everything in his life is totally dependent on some evil miner somewhere digging out the minerals he needs to survive.
And they’ll STILL be digging it to keep the lights on, along with all the additional holes dug to mine material for worse-than-useless wind and solar. That herd of elephants will never leave the room.
How is that different to the holes used to provide the materials for renewables?
That hole will be gone long before either the solar plants or wind turbine pylons.
At least the mine operators were forced to put a bond to cover clean up. WInd and solar just abandon the sites and let someone else pay for cleanup.
Nope. Renewable and non renewable sites are fundamentally different. The value of the renewable site will last until the fuel – the sun or the wind – fails for it. The nonrenewable site is only valuable as a resource until that resource is depleted.
So, yes, renewable facilities will continue to be changed and upgraded. I.e., for millennia. And also yes, the site owners who thrive from the rentals (unlike extractive surface owners only get damages) should hold their feet to the fire and make them keep up with their lease obligations.
But US extractive asset retirement costs have a proud, century old tradition of being first shirked, and then communized upon the rest of us. Gold, copper, coal, all well documented. Oil and gas, however, will eclipse them all. Between the modern drilling and completion of tens of thousands of long, flat, hard to re-enter. often poorly cemented, multilaterals, each with dozens of perforated intervals requiring hydraulic isolation from each other, to the hundreds of thousands of legacy wells in YUGE, old fields, we are already closing in on 12 $ figures worth of such costs. These are now bonded/lockboxed for pennies on the $, with many of the big players not aksed for any more surety save for their bigness. So, we’re set for the same outcome, different extractive resource. Trickle up economics at work….
The value of the renewable site will last until the fuel – the sun or the wind – fails for it.
Are you actually suggesting that a renewable installation doesn’t have a maximum lifetime?
It will last until IT fails, then it has to be rebuilt. Yes, the same is true for fossil fuels.
It seems to me that the best way to determine overall cost of energy from a specific generating source is to take the FULL cost of construction, maintenance, and fuel for the entire lifetime of the plant and compare that against the total MWH of output over the entire lifetime of the plant.
Has that ever even been attempted?
“Are you actually suggesting that a renewable installation doesn’t have a maximum lifetime?”
No. The wind and solar might wane. A better use for the site might occur. We might finally get SMT technology AND a final resting place for nuc waste under our belts, and have nuc replace renewables. But until then…
“It will last until IT fails, then it has to be rebuilt.”
Wind and solar facilities will be continuously “rebuilt”. Tech progress is such that they are out of date quickly.
“Yes, the same is true for fossil fuels.”
No, because these are, by definition, depleting. Yes, the tightest oil and gas industry in the world can extend it’s life by years, even decades. But time’z up here, for about a half dozen boring old – non 46 – geological and petroleum engineering/economic reasons. AGAIN, in our juiciest play – the Permian – year over year, oil and oil associated gas, proved, on, SEC reserves will be falling, pretty much every year, from now on. And so it will be for US production in toto.
I agree with the rest of your post. I would be happy to see such an evaluation, all in. I.e., with proper treatment of variable and fixed OpEx, CapEx, and asset retirement costs, grid build out (FYI, ALL forms of power will require it), and adequate ES&H costs. I’ll even leave out CAGW costs…
Oooo, Oooo, Oooo…Belching Chimneys! They guarantee power at night without the expensive and explosive Mega Pack Batteries
Nick,
It doesn’t matter what you, or anyone, prefer.
If you have (what you perceive as) neat, ordered, pleasant, grass lined panels with adjacent livestock, you still need a back-up.
You will always need a consistent back-up. What you perceive as a stinky hole is necessary.
It is also necessary to have that same sort of stinky hole to get the **(materials that are needed to build the pretty, shinny panels).
It is also necessary to have another big stinky hole to get the materials, that allow for the production of the equipment, that is necessary to get the **.
You know this. Why do you lie?
Lake, Nick. It’s only part-way through the rehabilitation process but that ‘dirty big hole in the ground’ will soon become a nice big lake. Enjoy.
fields of solar panels neatly arrayed with grass between, on which sheep may safely graze
I’ve seen several solar fields. I’ve never seen anything resembling this.
I also very clearly remember the trees that were there before the solar fields were built. I prefer the trees.
No it isn’t, because you’re still ignoring the Inconvenient Reality which is you STILL HAVE TO HAVE THE COAL PLANT to keep the lights on when the wind isn’t blowing at the “right”spedds and/or the Sun isn’t shining.
You are conveniently forgetting all the dirty big holes which provide your solar panels.
Sure it is; with wind and solar you have to KEEP the coal plant and the mine, so there’s something to keep the lights on when the wind doesn’t blow at the right speed and/or the Sun isn’t shining.
The coal plant and mine don’t require the fields of worse-than-useless windmills and solar panels, it can keep things running 24/7 on its own.
“The result is that the proposed “energy transition” would cost over 7 – 10% of the global GDP…” That will sound very acceptable to all of the indoctrinated, willingly led and those who profit* in power and money.
*They profit not from just the 7-10%, but gain the whole pie.
It is a nonsense figure. The transition cannot happen with current technology because materials constraint it. Mining has to quadruple in the next decade to satisfy the demand for materials.
The current trend is to export manufacturing to China and India where they burn more coal to make the metals and other materials needed for the transition in the west. The west has an illusion that is supported by China and India.
We should divert investment from wind, solar and hydrogen and/or batteries to where the money will make a genuine positive impact to our environment and economies.
Investment in research on those intermittent energy sources is a particular waste of funds in that knowledge of their capabilities is already developed. Academic research has become an illiberal art rather than a science, producing variations on a theme, as might be the case with music, art and literature. The technological and economic details of grid options are well known. Ignoring them in favor of wishful thinking is destructive and wrong in a most basic sense.
‘We should..’
There are several ‘we’s in the article. If they refer to individuals or voluntary associations of individuals, that’s great. If they refer to governments or other coercive arrangements, that’s not so great.
In the case of monopoly utilities it’s going to be the coercive arrangement, even at a smaller scale. Some level of government decides rates and service. This often applies to other things, waste collection, for instance.
I’m not that fussed by the utilities, since many of them don’t own generation and most of the bad stuff they do, like demand side management (DSM) and purchasing renewable energy, is forced on them by their regulators. The seriously bad central planning type stuff is foisted upon us by the Federal bureaucracies.
haha:”economic misunderstanding”
No it’s not, it’s Fraud
The folks making such claims should be in the same meat-grinder as you know who is right now
I’ve finally come up with the fully recyclable family SUV that costs absolutely nothing to run for 10 years or 200000 kms. It’s a million bucks and nothing more to spend so what more could the market want?
All energy production comes at a cost but the methods that have served us well – coal, gas, hydro and nuclear all deliver reliably and at a realistic cost. The fact that the UK is paying many times more for many times less reliable (or even secure) energy after having spent billions on wind and solar is a lesson that needs to be explained by the Mann’s and Stokes’s of the world who should know better what the real reckless cost of our folly has been since it is their untruths that have effectively led to politicians crippling us while doing absolutely nothing to stop the rise in CO2..
Let us start with proof that CO2 is the control knob – where is that proof? How can it be proven in a laboratory? Gore’s ‘Boy’s Own’ laboratory test claims are a fail and so where is that proof?
Let us have some honesty from the alarmists. There isn’t any proof about CO2. Not in Washington DC. Not in the USA. Not in the EU. Not in China. Not in India. Nowhere. Wind and solar are a fail.
And so in the meantime let’s all resort to common sense and continue to look at things we know for certain do work and do not unduly harm our environment and wild life as wind and solar clearly do.
Please can we have some much needed nuclear development too before it really is too late to save billions of people because our global political leaders are inept.
CO2 control knob? Are these nut-zero folks nuts?
CO2 IS A TRACE GAS
El Niños and the Hunga Tonga Sub-Surface Volcanic Eruption
https://www.windtaskforce.org/profiles/blogs/hunga-tonga-volcanic-eruption
EXCERPT:
WV, worldwide: WV is highly variable between locations, from 10 ppm in the coldest air, such as the Antarctic to 50,000 ppm (5%), such as in the hot, humid areas of the Tropics.
WV in atmosphere, worldwide average, weight basis, is about 1.29 x 10¹⁶ kg, or 7.1667 x 10^14 moles
Atmosphere weight, dry, is about 5.148 x 10^18 kg, or 1.7752 x 10^17 moles
WV percent, weight basis, is about 1.29 x 10^16 / 5.148 x 10^18 = 0.002506, or 0.2506%
WV fraction, mole basis, is about 7.1667 x 10^14 / 1.7752 x 10^17 = 0.004037, or 0.4037%, or 4037 ppm
WV molecules, worldwide average, are about 4037/423 = 9.54 times more prevalent than CO2 molecules
.
WV, temperate zones, north and south of the equator, where most of the world’s population lives, is more prevalent, than the worldwide average of 4037 ppm.
WV is about 9022 ppm, at 16 C and 50% humidity. See Note
WV molecules are about 9022/423 = 21.33 times more prevalent than CO2 molecules.
.
WV, Tropics, is about 24811 ppm, at 27 C and 70% humidity
WV molecules are about 24811/423 = 58.66 times more prevalent than CO2 molecules
.
WV much Better Than CO2: Whereas CO2 absorbs energy (gets warmer), transports that energy (convection) and distributes it by collision (conduction) and radiation, WV does all that so much more effectively by incorporating phase change, liquid-to-vapor (constant temperature), transport, collision and radiation, but then adds in condensation (constant temperature) to rain/snow/ice.
.
It’s not merely the molecule-count of WV vs CO2 that makes WV the dominant global warming gas.
WV is much more efficient in absorbing, transporting and distributing energy than CO2, and it is far more abundant than CO2, especially in the Major League Tropics compared to the Minor League temperate zones.
.
NOTE: At 16 C and 50% humidity, WV in air is 0.0056 lb H2O/ lb dry air, or 2.5424 g H2O/ 454 g dry air. After converting to moles, 0.009022 mole H2O/mole dry air, or 9022 ppm.
A mole of WV is 18 g, a mole dry air is 29 g
https://www.engineeringtoolbox.com/water-vapor-air-d_854.html
.
The very first graph shows gross errors regarding offshore wind at 7.4 c/kWh and battery storage at 15.5 c/kWh
OFFSHORE WIND
In New York State, offshore wind developers, who had bid in 2023 for contracts at about $90-100/MWh (i.e., 9 – 10 cents per kWh), decided a few months later, to renege on signed contracts and demanded prices in the range of $150-160/MWh, or 15-16 cents per kWh.
What is almost always never mentioned, at higher wind penetration, say 30%, as in Germany, the UK, etc., regarding offshore wind,
.
1) Add 2 c/kWh for grid buildouts
2) Add 2 c/kWh for curtailments
3) Add 2 c/kWh for counteracting the ups and downs of wind.
.
These numbers are based on UK experience.
Why do you think German, UK, etc., electric rates have gone through the roof?
.
BATTERY SYSTEMS
BATTERY SYSTEM CAPITAL COSTS, OPERATING COSTS, ENERGY LOSSES, AND AGING
https://www.windtaskforce.org/profiles/blogs/battery-system-capital-costs-losses-and-aging/edit
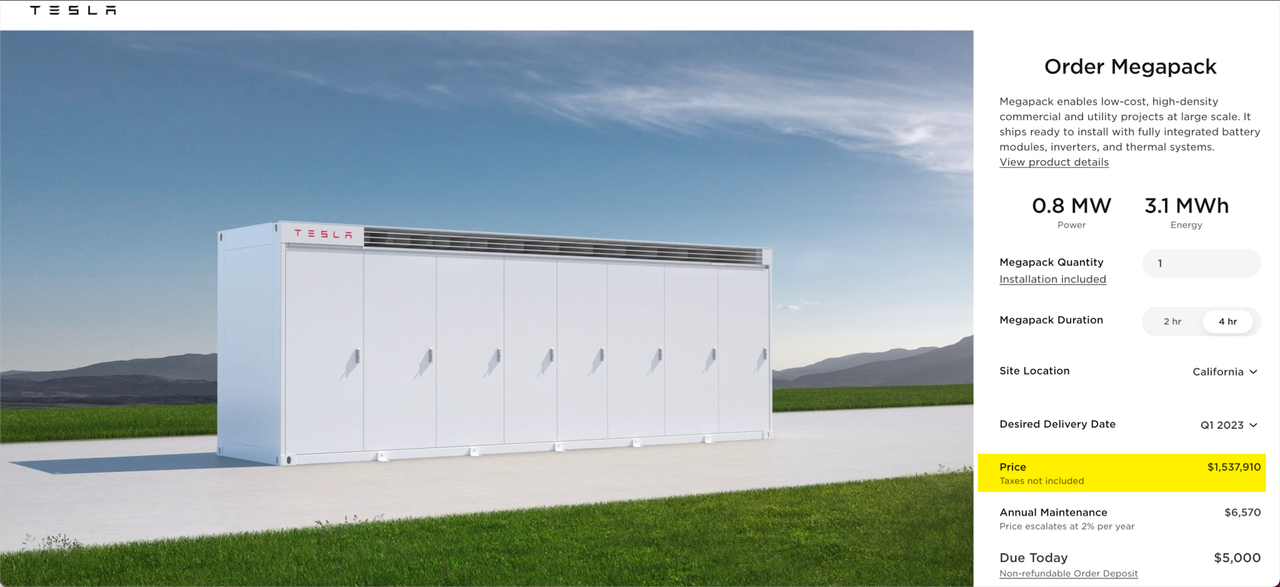
Example of Turnkey Cost of Large-Scale, Megapack Battery System, 2023 pricing
 ?itok=lxTa2SlF
The system consists of 50 Megapack 2, rated 45.3 MW/181.9 MWh, 4-h energy delivery
Power = 50 Megapacks x 0.979 MW x 0.926, Tesla design factor = 45.3 MW
Energy = 50 Megapacks x 3.916 MWh x 0.929, Tesla design factor = 181.9 MWh
Estimate of supply by Tesla, $90 million, or $495/kWh. See URL
Estimate of supply by Others, $14.5 million, or $80/kWh
All-in, turnkey cost about $575/kWh; 2023 pricing
https://www.tesla.com/megapack/design
https://www.zerohedge.com/commodities/tesla-hikes-megapack-prices-commodity-inflation-soars
.
Annual Cost of Megapack Battery Systems; 2023 pricing
Assume a system rated 45.3 MW/181.9 MWh, and an all-in turnkey cost of $104.5 million, per Example 2
Amortize bank loan for 50% of $104.5 million at 6.5%/y for 15 years, $5.484 million/y
Pay Owner return of 50% of $104.5 million at 10%/y for 15 years, $6.765 million/y (10% due to high inflation)
Lifetime (Bank + Owner) payments 15 x (5.484 + 6.765) = $183.7 million
Assume battery daily usage for 15 years at 10%, and loss factor = 1/(0.9 *0.9)
Battery lifetime output = 15 y x 365 d/y x 181.9 MWh x 0.1, usage x 1000 kWh/MWh = 99,590,250 kWh to HV grid; 122,950,926 kWh from HV grid; 233,606,676 kWh loss
(Bank + Owner) payments, $183.7 million / 99,590,250 kWh = 184.5 c/kWh
Less 50% subsidies (ITC, depreciation in 5 years, deduction of interest on borrowed funds) is 92.3c/kWh
.
At 10% usage, (Bank + Owner) cost, 92.3 c/kWh
At 40% usage, (Bank + Owner) cost, 23.1 c/kWh
.
Excluded costs/kWh: 1) O&M; 2) system aging, 1.5%/y, 3) 19% HV grid-to-HV grid loss, 3) grid extension/reinforcement to connect battery systems, 5) downtime of parts of the system, 6) decommissioning in year 15, i.e., disassembly, reprocessing and storing at hazardous waste sites.
NOTE: These excluded costs would add at least 10 c/kWh
NOTE: The 40% throughput is close to Tesla’s recommendation of 60% maximum throughput, i.e., not charging above 80% full and not discharging below 20% full, to achieve a 15-y life, with normal aging
NOTE: Tesla’s recommendation was not heeded by the owners of the Hornsdale Power Reserve in Australia. They added Megapacks to offset rapid aging of the original system, and added more Megapacks to increase the rating of the expanded system. See URL
http://www.windtaskforce.org/profiles/blogs/the-hornsdale-power-reserve-largest-battery-system-in-australia
COMMENTS ON CALCULATION
.
Regarding any project, the bank and the owner have to be paid, no matter what.
Therefore, I amortized the bank loan and the owner’s investment
If you divide the total of the payments over 15 years by the throughput during 15 years, you get the cost per kWh, as shown.
According to EIA annual reports, almost all battery systems have throughputs less than 10%. I chose 10% for calculations.
A few battery systems have higher throughputs, if they are used to absorb midday solar and discharge it during peak hour periods of late-afternoon/early-evening.
They may reach up to 40% throughput. I chose 40% for calculations
Remember, you have to draw about 50 units from the HV grid to deliver about 40 units to the HV grid, because of a-to-z system losses. That gets worse with aging.
A lot of lay people do not like these c/kWh numbers, because they have been brain-washed by self-serving folks, low-cost battery Nirvana is just around the corner, which is a load of crap.
.
NOTE 1: Aerial photos of large-scale battery systems with many Megapacks, show many items of equipment, other than the Tesla supply, such as step-down/step-up transformers, switchgear, connections to the grid, land, access roads, fencing, security, site lighting, i.e., the cost of the Tesla supply is only one part of the battery system cost at a site.
NOTE 2: Battery system turnkey capital costs and electricity storage costs likely will be much higher in 2023 and future years, than in 2021 and earlier years, due to:
1) Increased inflation rates,
2) Increased interest rates,
3) Supply chain disruptions, which delay projects and increase costs,
4) Increased energy prices, such as of oil, gas, coal, electricity, etc.,
5) Increased materials prices, such as of tungsten, cobalt, lithium, copper, manganese, etc.,
6) Increased labor rates.
NOTE 3: If a 24-h battery system is desired, each parallel train would have 10 units x 4 h/unit x 0.6, Tesla limit = 24 hours
Ten, 4-h Megapacks, in series, would be required for a 24-h system
Above example would have 50 x 6 = 300 Megapacks.
Tesla design factors would apply. See article
NOTE 4: World cobalt production was 142,000 and 170,000 metric ton, in 2020 and 2021, respectively, of which the Democratic Republic of the Congo was 120,000 metric ton in 2021
https://www.kitco.com/news/2022-02-02/Global-cobalt-production-hits-record-in-2021-as-mined-cobalt-output-in-DR-Congo-jumps-22-4.html
We have a commentator telling you the truth about the CO2 control knob 😀
“There isn’t any
proofevidence about CO2″A point which has been established many, many times.!
Assuming there was some truth/evidence about CO2:
Based on IPCC published science, it is arithmetically certain* that mankind’s annual CO2 emissions influence the climate.
The same arithmetic informs us that it will take 11,570 years to elevate global temperatures by 2ºC from preindustrial levels. It also informs us that eliminating 100% of mankind’s CO2 emissions today would alleviate warming by 0.0045ºC in 2050.
*Assumption: doubling preindustrial atmospheric CO2 will induce warming of 2ºC.
Assuming anthropogenic CO2 is responsible for 100% of warming, how long will it take to reach 2ºC of warming?
It’s straightforward arithmetic.
1850 – total atmospheric CO2: 280ppm (parts per million) (Vostok Ice Core).
2024 – total atmospheric CO2: 420ppm. (Mauna Loa observatory).
420ppm – 280ppm = 140ppm. Divide by the intervening 174 years = total annual average increase of 0.81ppm CO2 to date.
Mankind is responsible for 3% of total annual CO2 emissions. 0.81ppm x 3% = 0.024ppm.
Therefore, time required for mankind’s emission to double preindustrial CO2
280ppm ÷ 0.024ppm = 11,570 years.
If we eliminating 100% of mankind’s CO2 emissions today – in the 26 years to 2050 we would alleviate warming by 0.0045ºC. (2ºC ÷ 11,570 x 26 = 0.0045ºC).
Chat GPT AI calculates man is responsible for 5.33% (not 3%) of emissions which is 0.043ppm. On that basis 280ppm ÷ 0.043ppm = 6,511 years before we reach 2ºC.
Run for your lives folks, we only have between 6,511 years and 11,570 years left to live!
Even if we assume that every single extra CO2 molecule in the atmosphere since 1850 was man made it’s 280ppm ÷ 0.81 = 345 years. But we need to deduct the elapsed time since 1850 = 174 years – the time to global armageddon at 2ºC is 171 years. Not 26 years until 2050.
Nucking Futs.
2C of warming would have basically no effect on anywhere that actually needs it.
Might open up a bit of land in the NH,
…. but would need to be quite a bit more before trees can grow again, where now there are glaciers.
And for permafrost peatbogs to come back to life.
And to lower Arctic sea ice extent to levels seen during most of the Holocene.
Entirely agree, but we are told it would be Armageddon. All I’m pointing out is, maybe it will be Armageddon, but it will take between 6,000 and 11,000 years to happen if mankind is the problem.
Even calculating it with 100% rather than 3% gives us hundreds of years.
“It also informs us that eliminating 100% of mankind’s CO2 emissions today would alleviate warming by 0.0045ºC in 2050.”
and
“Mankind is responsible for 3% of total annual CO2 emissions. 0.81ppm x 3% = 0.024ppm.”
No alarmist thinks this data is correct. So you’re wasting effort trying to demonstrate the fact.
IPCC data, not mine. Alarmist’s can’t deny it.
Alarmist’s can’t deny it.
I don’t think they deny it, they simply ignore it.
When they call you a denier, then you tell them you can prove climate change is real with four numbers (280ppm, 560ppm, 3% and 174 years – all indisputable facts recognised by the IPCC), whilst smiling, and then go through that with them, it sure confuses them. If you get them to do the calculation on their phone/calculator the can’t deny it.
I do it occasionally, they cough and splutter a lot but it sure makes them think.
You are telling them you believe the climate is changing, which we all do, but judging by facts it can’t be mans fault.
HotSpot, your It’s straightforward arithmetic.
1850 – total atmospheric CO2: 280ppm (parts per million) (Vostok Ice Core).
2024 – total atmospheric CO2: 420ppm. (Mauna Loa observatory).
Missing one point.

Shows Hawaii at the blue-green line of 388 ppm & Antarctica at 316 ppm, at the same time. So that difference, due to temperature & plant life, would cut further into the growth.
My numbers come from the IPCC, as I pointed out, if you have a beef, speak to them about it.
However, if you think 72ppm will make a material difference to 11,000 years, be my guest, do the calculation and allow for it.
Show your arithmetic though please.
You might also want to specify the precise dates between 2004 and 2013 the 388 and 316 measurement were taken, and by whom. If there is no precise date for the measurements, perhaps they were averages, and we are talking in general terms here.
As you have provided no attribution for your graphs you could just have made them up for all I know. Before we discuss anything further kindly provide details.
And do please try to think of something more original than “Hotspot”. Richard Greene was the last one to be that puerile some time ago.
“The UK emitted 440 million tonnes (Mt) [485 million Tons Imperial] carbon dioxide equivalent (CO2e) in 2019, a 0.9 % share of global greenhouse gas (GHG) emissions. The UK’s GHG emissions stood at 755 Mt CO2e in 1991, and have fallen steadily as the country shifted to cleaner energy sources and a service economy. Between 2005 and 2019, when the UK was still an EU Member State, the country’s GHG emissions fell by 35 %, much faster than the EU average. Land use, land-use change and forestry (LULUCF) has been a modest but constant carbon sink, absorbing around 11 Mt CO2 per year since 2016 (2.5 % of the UK’s 2019 GHG emissions), bringing the UK’s net emissions to 429 Mt CO2e in 2019.” (European Parliamentary Research Service)
The Scripps Institute of Oceanography, UC San Diego derives information on the progress of atmospheric CO2 in the atmosphere from the Mauna Loa observatory.
There is not a flicker of recognition of the UK’s 35% CO2 reduction efforts between 2005 and 2019. In fairness the UK produces only 0.9% of global CO2 emissions, perhaps too small to register. However, one of the larger CO2 emitters, the United States of America emitted some 6 billion Tons of CO2 in 2000 falling to 5 billion tons in 2022. Almost a 20% reduction, yet still not a flicker of recognition on the Keeling curve.
It can be plausibly argued that whilst western emissions are falling, China’s emissions are rising however, the covid pandemic provided a global baseline of comparison. A study published in ‘nature climate change’ “Temporary reduction in daily global CO2 emissions during the COVID-19 forced confinement” found global man-made CO2 fell on average across the globe by 17%. Still not a flicker on the Keeling curve.
Just how much CO2 emissions reduction does mankind need to achieve before it registers on the Keeling Curve?
There is a clue. Were mankind’s CO2 emissions so prolific and destructive, why are they not plotted separately on the Keeling curve? The answer is obvious. For all practical purposes they are undetectable. That’s why we have wasted 36 years in pursuit of a phantom.
A 17% drop for just a month or two would not be visible on such a graph.
If a seasonal variance can be detected then a 17% drop, which went on for about a year, not just a month, would be visible.
And where’s the separate plot for man made CO2?
I’ll tell you because I have plotted it. It bumps along the bottom of the graph, barely visible. They don’t plot it because it would look as ridiculous as it really is.
The 17% drop, was of the amount of CO2 that man was creating. At present that only accounts for about 2ppm increase in levels per year.
A 17% drop in that would be a decrease of only about 0.34ppm. That would not be visible on the chart that you are showing.
“The first precursors to this energy crisis appeared in 2021 prior to the Ukraine war.”
Indeed! The war was a welcome scape goat and diversion for an already failing wind and solar debacle in Europe. I recall in that year eight renewables manufacturers in UK alone went bankrupt.
At the same time, spent “farms” in EU (47MW ) were awaiting decommissioning since 20l9 and Germany was already bulldozing part(? or all?) of a windfarm for a major expansion of a coal mine after a disastrous winter and runaway natural gas prices, a fallout, of a massive “Policy-Caused” war on every front against the fossil fuels’ industry (locked up resource lands, punishing regulations, financing cut-off …). A kicker: Investors were running away from renewables in droves.
.
Your Windmills and solar in the EU peaked in 2017 text looks so strange today 🙂
Or did you finally find out they didn’t?
When did they peak?
Also, with the bankruptcies, end of life windfarms and energy crisis mentioned, there was a statement that “peak renewables” had occurred in EU in 2017. This seems to have gone down the rabbit hole. I mention this peak from time to time and don’t get panned for it. They keep a cumulative tally of installations but these include ones that have been decommissioned (or idled?) They’ve clammed up on the subject, so likely the peak is still 2017 in the EU.
Thanks, I was really missing it 🥰
Correct – energy costs, driven by gas prices, were already rising before the war was started as countries were coming back to life after the Covid insanity increased their demand from an industry that had reduced output.
“”Political decision makers””
Not exactly how I would describe them.
I was thinking this was a good article that clearly explained reasons LCOE was really the leftist’s Liars Cost of Electricity.
NOTE: I rarely read about hydrogen because natural gas is very cheap (lowest spot price adjusted for inflation, in a century) and does everything better than hydrogen. Which is just a green dream (fiction).
Then I read this sentence:
“When (hydrogen is (leaked it’s “warming impact” would be 12 times that of CO2.”
I started reading the referenced study and saw it was a 100 year prediction based on models. So is CAGW. That’s strike 1 from my point of view.
I never got to strike 2
There was a lot of claims of global warming from hydrogen leaks published in 2022 and 2023. Surprisingly the articles and studies seemed to be by leftists who support the use of hydrogen, which seems to be a contradiction.
I studied this new (for me) subject for an hour. My opinion is the global warming effects of leaked hydrogen have been grossly overestimated by the Climate Howlers people you’d expect to cover up the problem. This reminds me of the grossly overestimated warming effects of methane, by testing methane in a lab using artificially dried air.
Leaked hydrogen does affect the atmosphere and tends to leak more (H2 is a tiny molecule) than methane leaks. I doubt if the effect is anywhere close to 12x more global warming (which would actually be close to 12x times next to nothing for methane, anyway).
(1) Hydrogen’s reacts with atmospheric hydroxyl (OH), an element which also reacts with methane and helps remove this greenhouse gas from the atmosphere. The more hydrogen that leaks into the atmosphere, the less hydroxyl will be available to neutralize the warming effects of methane. This can;t be very important because the absorption effects of water vapor overlap the absorption effects of methane, so methane can barely affect the climate.
(2) Hydrogen in involvement, near ground level, in a chemical chain reaction that produces ozone, another potent greenhouse gas.
ONE SOURCE:
Hydrogen Leaks Could Make Climate Change Worse, Scientists Warn (theenergymix.com)
The Honest Climate Science and Energy Blog
This entire green energy myth/ bubble is coming to a rapid end and the end will be accelerated by some very serious economic correction coming very soon. We are at the end of government ability to stimulate pull back a little then repeat the same con. That along with change in worldwide demographics loss of jobs and industries means people will have no tolerance for inefficiency that result in higher consumer cost ultimately.
Green energy will go back to being a niche for preppers, RVs boat off grid and a little supplemental as people try to hang in through some bad economic times.
Trouble is, we somehow need to re-build, re-establish, the amount of solid reliable dispatchable electricity producers.
This will take time, especially with irrational “environmentalists” still controlling the political scene in many places.
From the above article:
“Claiming ‘renewable’ energy from wind and solar is cheap and comes without environmental consequences, is a crucial and detrimental energy economic misunderstanding.”
Well, for the most prominent parties involved with “green, renewable” energy it is not an economic misunderstanding at all . . . instead it qualifies for intentional misdirection, propaganda or outright lies to support a not-so-hidden agenda.
As nice and sound an accounting of the total costs of the various methods of producing energy as I have ever seen. Thank you for this. It will be widely shared.
Not only is hydrogen very explosive when oxygen is available, the flame is also invisible to the human eye so you need IR goggles to see it.
A cheap easy solution would be to buy every household in the world an air conditioner.
An air conditioner at that volume would probably cost around $US200.
There are about 2 billion households in the world so that would cost around $400 billion dollers.
Wind and solar could be built where there is no grid for say $100 billion making the total cost around $500 billion.
Bloomberg estimates $200 trillion to stop warming.
Buying air conditioners for everyone and providing electricity with wind and solar where no grid is available would cost aould 0.25 percent of what it would cost to stop warming.
Most people probably spend around 95% of the day indoors or in cars or other transportation anyway.
Uhhhhh . . . one thing you completely overlooked is the cost per kWh of electricity to run the 2 billion or so household air conditioners. Where does the money for THAT come from?
Also, conservatively assuming every wind or solar farm in your scenario costs “only” $10 million each, your $100 billion estimate for such distributed infrastructure amounts to about 10,000 such new energy farms. In turn, that would me each farm needs to power an average of 2 billion air conditioners/10,000 = 200,000 air conditioners. Not a chance in hell of that happening “where there is no grid”.
ROTFL.
Very nice. Fire up all fossil fuel and nuclear generators, build new fossil fuel and nuclear generators and remove all wind and solar from the grid.
I can hardly wait. Unfortunately, the current idiots in power will never do it.
I assume the POTUS has read this article and nodded his head. 🙂
Seriously, how can the axiom of CO2 – AGW be dislodged from the minds of “western” elites? They have internalized this “truth” — facts and reasoning are left at the station while the elites are on a speeding south-bound train.
Cost = LCOE / CF
Cost = LCOE / CF.
Dividing by the capacity factor takes into account the cost of backup for intermittent power.
The formula assumes the cost of 1kwh of backup is equal to 1kwh of intermittent power.
But it isn’t. The intermittent power is worth MUCH LESS.
Because there is extra cost in managing the inconsistent frequency of generation, and because the supply does not match demand, as can the “backup.”
Cost = LCOE / CF.
This formula says that intermittent power actually costs 3x as much with a 33% CF, 4X as much with a 25% CF and 8x as much with a 12% CF.
Those are the CF for offshore wind, onshore wind, and solar.
LCOE was designed to make comparisons at a time when continuous output generation powered the grid, ie: coal, gas, nuclear. A valid calculation can then be made as to which continuous output source will be the least expensive to INCREASE generating capacity taking into account cost of construction, operation, consumables and lifetime use.
It was not designed to compare replacement costs, ie replacing coal with gas for example, nor to compare (as the article points out) intermittent sources.