Paul Dorian

This forecast map by the North American Multi-Model Ensemble (NMME) of sea surface temperature anomalies for the August/September/October 3-month time period features colder-than-normal conditions (La Nina) across the equatorial Pacific Ocean. Map courtesy NOAA
Overview
Above-normal sea surface temperatures continue this month across most of the equatorial part of the Pacific Ocean, but there are signs that this El Nino episode which began about a year ago will flip to La Nina conditions (colder-than-normal) by the early part of the 2024 summer season. A flip from El Nino to La Nino across the equatorial Pacific Ocean can have big implications on the upcoming 2024 Atlantic Basin tropical season. In fact, this expected dramatic change in sea surface temperatures across the Pacific Ocean may be a major contributor to a very active tropical season in the Atlantic Basin as atmospheric conditions are typically more favorable (lower wind shear) during La Nina episodes for the development and intensification of tropical storms. A second favorable factor for a very active tropical season in the Atlantic Basin is the likely continuation there of widespread warmer-than-normal sea surface temperatures. Finally, as oceanic cycles play a critical role in global temperatures, a flip from El Nino to La Nina in the world’s largest ocean could mean a return to closer-to-normal levels following a spike during the past year or so.

The Multivariate ENSO Index (MEI), which combines both oceanic and atmospheric variables, facilitates in a single index an assessment of ENSO. It especially gives real-time indications of ENSO intensity, and through historical analysis – provides a context for meaningful comparative study of evolving conditions. The MEI is said to capture a more holistic representation of the atmospheric and oceanic anomalies that occur during ENSO events than do single-variables timeseries like the “NinoSST” indices. Plot courtesy NOAA/PSL
Details
A transition from El Nino to ENSO-neutral is likely by spring 2024 and odds are increasing for a full-blown La Nina by the time we get to the early summer which coincides with the beginning of the Atlantic Basin (includes Atlantic Ocean, Caribbean Sea, Gulf of Mexico) tropical season. This El Nino event began about a year ago following back-to-back-to-back years in which La Nina dominated the scene in the equatorial Pacific Ocean. For the past several years, most El Nino events have been rather short-lived lasting on average about 12-18 months whereas La Nina occurrences have usually lasted for a considerably longer periods of time.

Sub-surface temperatures: depth-longitude section of equatorial Pacific upper-ocean (0-300m) temperature anomalies (°C) centered on 28 January 2024. Colder-than-normal water is lurking just beneath the surface across much of the tropical Pacific and increases the chance for a return to La Nina. Map courtesy NOAA/CPC, International Research Institute
While sea surface temperatures are currently at above-normal levels in the tropical Pacific Ocean, there are changes lurking just beneath the surface…literally. Water temperatures in the 100 meters or so beneath the surface have averaged near normal in recent weeks, but below-average temperatures were widespread at greater depths. Also, in recent weeks, low-level winds were near average over the equatorial Pacific while upper-level wind anomalies were generally easterly over the east-central Pacific. Convection (i.e., thunderstorm activity) remained slightly enhanced in the central Pacific and close to average in areas to the west of there. Collectively, the coupled ocean-atmosphere system reflects an El Nino in an overall weakening phase.

Forecasts of sea surface temperature (SST) anomalies for the “Nino 3.4” region (5 °N-5°S, 120°W-170°W) by a collection of computer forecast models. Courtesy NOAA, ECMWF, Canadian Met Centre, International Research Institute (IRI)
In addition to oceanic and atmospheric observational reasons to support the idea of a change in the near-term, numerous computer forecast models indicate a transition to “ENSO-neutral” during the spring 2024 and then to La Nina during summer 2024. Specifically, temperatures in the “El Nino 3.4” region (central part of the equatorial Pacific Ocean) are predicted to drop in most computer forecast models from the current 1.5-2.0°C higher-than-normal levels to near neutral during the spring season, and then down to 1.0 °C or so below-normal by the early part of the summer season.

Sea surface temperature anomalies centered for the week centered on 31 January 2024 reflect El Nino conditions with warmer-than-normal water in the equatorial Pacific Ocean. This is likely to change dramatically in coming weeks so that La Nina conditions (colder-than-normal) will dominate the scene by the summer (tropical) season in the Atlantic Basin. Map courtesy NOAA/CPC, International Research Institute
In terms of impact on weather, El Nino has indeed contributed to a stormy winter season across California with numerous powerful ocean storms moving from the Pacific Ocean into the western part of the US and this unsettled pattern is likely to continue at least for the next few weeks. This enhanced storm activity in California is rather typical of an El Nino winter season with plenty of rain in low-lying sections and snow in the higher elevations. (By the way, what was not typical was the La Nina winter season of 2022-2023 in which California was pounded by numerous storms resulting in high rainfall amounts in low-lying sections and record snowfall in the higher elevations of the Sierra Nevada Mountains).

The El Nino region of the Pacific Ocean is sub-divided by meteorologists into sub-sections as outlined on this map with “Nino 3.4” in the central part of the equatorial Pacific Ocean and “Nino 1+2” positioned near the west coast of South America.
In terms of an impact on the upcoming 2024 Atlantic Basin tropical season, La Nina conditions in the Pacific Ocean can be a critical contributing factor to what I fear could be a very active year in the Atlantic Ocean, Caribbean Sea, and Gulf of Mexico. In general, La Nina summer seasons feature lower wind shear levels across the breeding grounds of the Atlantic Ocean and this reduction is more favorable for the development and intensification of tropical storms (shear defined as change of wind speed and direction with height).

The likelihood of La Nina conditions this summer (tropical) season in the equatorial Pacific Ocean is a “red flag” for enhanced tropical activity in the Atlantic Basin. A second favorable factor for a very active season is the likelihood for continued warmer-than-normal sea surface temperatures in the breeding grounds of the tropical Atlantic. Map courtesy NOAA, tropicaltidbits.com
In addition to the favorable aspect for tropical activity helped along by La Nina conditions in the Pacific, the breeding grounds of the tropical Atlantic Ocean are currently featuring much warmer-than-normal sea surface temperatures and this pattern is likely to continue right into the summer (tropical) season. Warmer-than-normal sea surface temperatures in the Atlantic Basin is favorable for tropical storm development and intensification. One final note on the potential impact of La Nina, oceanic cycles are critical in terms of global temperature patterns; especially, when dealing with the world’s largest (Pacific) ocean. There has been a spike in global temperatures since the formation of this latest El Nino about a year ago and, if indeed, La Nina forms and is sustained – as is likely – then global temperatures are likely to return to much closer-to-normal levels.
Meteorologist Paul Dorian
Arcfield
arcfieldweather.com
Follow us on Facebook, Twitter, YouTube
There is a better chance for a Neutral year for the 2024-25 winter season than a Niña year.
Also, the MEI index supports that this is not a strong Niño, it is just the temperature of the global ocean that is very high since the 2023 late spring that makes it appear as a strong Niño when we only look to the temperature.
Indeed, it was a moderate El Niño. Even so, moderate is all we need now to set new monthly and annual warmest global temperature records.
As if that really means anything other than weather.
If it was just weather then moderate El Niños wouldn’t be setting new record high monthly and annual global temperature records, would they?
In a balanced system, a moderate El Niño would raise temperatures to slightly above average.
It’s not just ‘weather’.
It obviously isn’t a balances system at the moment.
The amount of energy discharged by this El Nino event has been quite large.
And it obviously is not like a pendulum.
And yes, a series of strong El Ninos DOES lead to warmer conditions.
There is no need to insinuate / invent some other baseless scientifically unsupportable reason.
Yes. El Ninos ARE just part of weather systems.
The baseline trend may be climate, but the new records may well just be weather. Get back to me in about 10 or 20 years.
Good, more the better if so
No record temperatures around here.
We are supposed to hit 76 degreesF here. That’s warm, but the record for the day is 84 degreesF. Same for the month, and for the year. No record warmth.
That applies to the United States, too. See the sidebar.
No record high temperatures in the USA since the year 2000. Couple of ties.
So the longest, most dense temperature recording system in the world says its not getting hotter, just a couple of “Just as Hot as Before”
https://www.ncei.noaa.gov/access/monitoring/scec/records
Right, it’s bad station siting, modification of historical data to make it colder in the past and “infilling” of data (making up data).
We’ve had some brutal winters here in MN when we’ve had neutral years.
The ENSO MEI chart is an interesting way to display El Niño and La Niña information. It shows, despite the reported gradual increase in temperatures from 1980 of 0.89° the El Niño events are gradually decreasing in strength (showing 1983 as the strongest and the “Super El Niño” of 2016 was relatively mild) while conversely indicating a gradual increase in La Niña strength
The chart is MEI version 2 which uses an increasing baseline. This makes El Nino events look weaker and La Nina events look stronger.
That’s correct. This MEI version is not properly detrended, so its values show a decrease over time. They’ll have to correct it for v3. It is easy to correct with Excel.
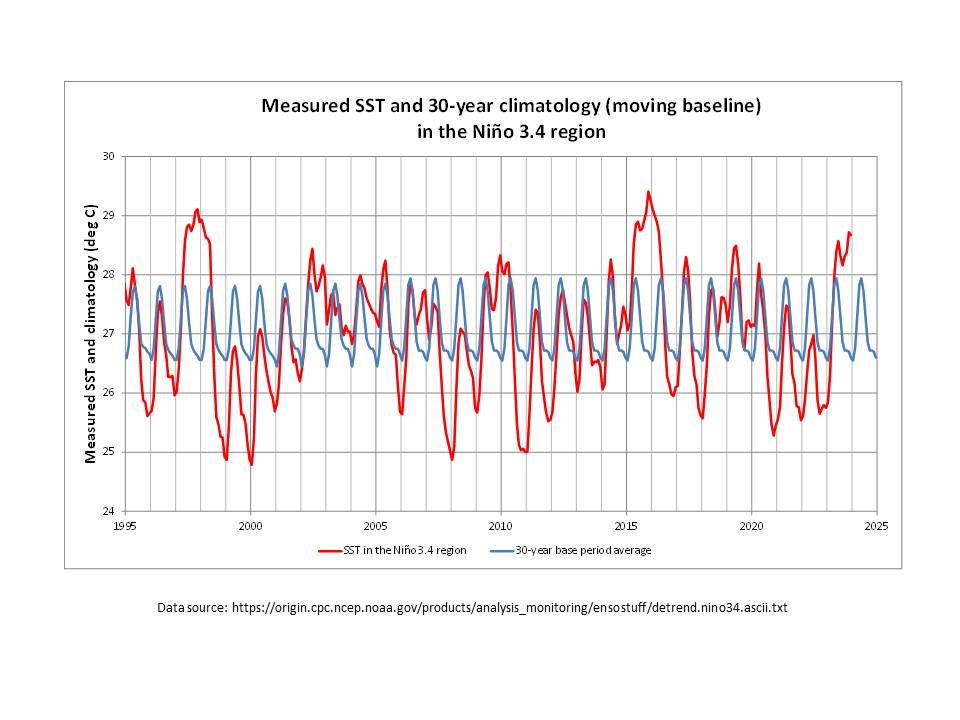
The Oceanic Niño Index (ONI) values, which are based solely on SST values in the Niño-3.4 region of the equatorial Pacific Ocean, are also de-trended. In this case, a moving 30-year average is applied by NOAA to successive 5-year periods. Based on the following SST plot (which has not been de-trended) it is evident that, since 1950, both minimum (La Niña) and maximum (El Niño) SST values have increased.
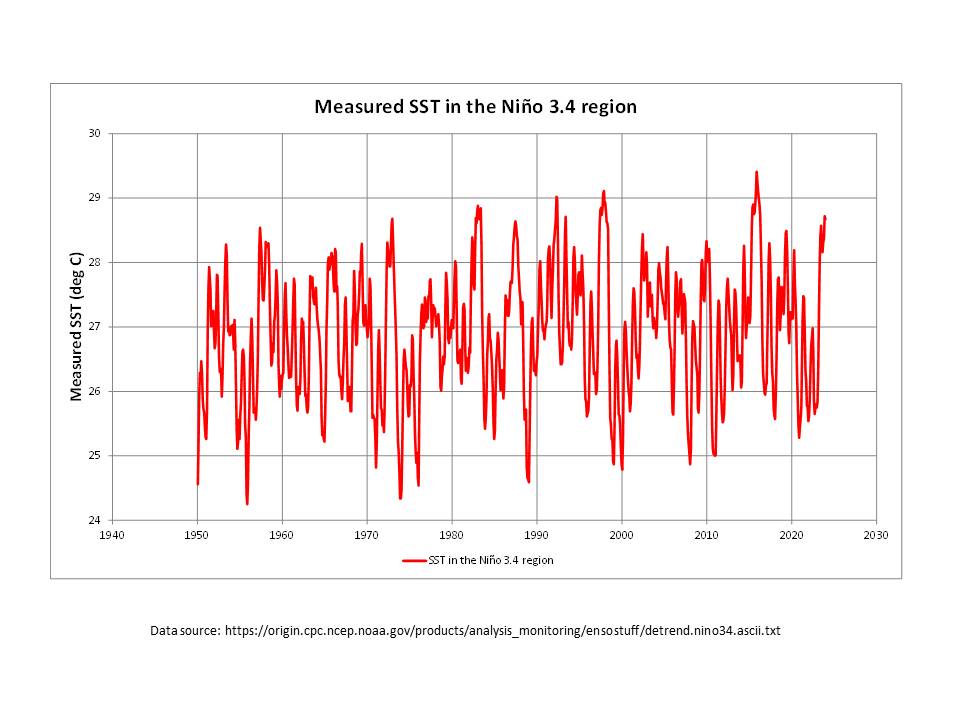
The second plot highlights the consistency in SST timing behaviour in recent years. The primary characteristic that is clearly shown is the lack of any significant cooling event during the two very strong El Niño events (1997-1998, 2015-2016), with the SST values being somewhat ‘flat-topped’ over the whole event (May to May, as highlighted by the average SST data). Even the moderate event (2009-2010) looks similar, though significantly less warm of course, while the current ‘strong’ El Niño fits in between from an SST perspective (so far).
In contrast, the SST data show that La Niña events are largely, but not entirely: delimited to lie within a single, annual (May to May), cooler period identified by the 30-year average; have a distinctive but relatively short-lived ‘negative spike’ for the minimum SST around the end of the year; and, are invariably bounded on each side to a degree by some effect of warming (which does not necessarily reach neutral anomaly values).
The data source reference states that it has been detrended.
I am probably wasting my time, but …
The ‘measured’ SST data have not been de-trended. The rolling 30-year average SST data incorporate the increasing temperature trend. The difference – i.e. the anomaly values – are hence de-trended. The ONI values are the rolling three-month average of the anomaly values and are therefore also de-trended.
The relative ONI shows the 2016 and 1983 events as nearly equal in peak strength.
“The relative Niño3.4 index is now included in ENSO monitoring, which is defined as the conventional Niño3.4 index minus the SSTA averaged in the whole tropics (0°-360°, 20°S-20°N), in order to remove the global warming signal. Also, to have the same variability as the conventional Niño3.4 index, the relative Niño3.4 index is renormalized (van Oldenborgh et al. 2021: ERL. 10.1088/1748-9326/abe9ed: L’Heureux, et al. 2024: J. Climate. 10.1175/JCLI-D-23-0406.1).” -CPC ENSO advisory
Personally, I am predicting mostly positive RONI for the duration of this solar maximum period until 2027 ±1 yr, as was the case during the similar cycle periods in the late 70s/early 80s. the early to mid 90s, and the early 2000s, due to high solar activity, which was not the case for SC24 as it was weaker.
Bryan A:
“The Super El Nino of 2016 was relatively mild”
You NEED to read the Wikipedia article “The 2014-2016 El Nino” which lists the climate related disasters that occurred because of the El Nino
Or weather?
Did the “disasters” last 30 years? Since “climate” = 30 years, then to be “climate related disasters” they MUST last 30 years.
Just sayin.
Thanks Paul D., {Very nice summary.}
Can WUWT schedule a reprint of this post about Tuesday, November 5th.?
That’s after the hurricane season — and something else is happening, but what escapes me at the moment.
Hope for leftist heads exploding.
Nah. Nothing important happening that day.
Guy Fawkes Night.
Red Hair Day
The collapse of the El Nino?
I don’t understand the use of the word “collapse”, which defines a rapid event, often believed to be bad news.
The change to La Nina is more likely to be gradual and there is no bad news at all. “Collapse is click bait.
The El Nino event is the collapse.
It is the release of built-up energy causing a sharp transient in atmospheric temperature.
Even though this is an interesting report, there is nothing funny about the Good Boy El Niño changing into the Bad Girl La Niña. I will have to plan how much wine to buy and store, just in case.
WOW!!! We’re an hour and twenty minutes into an ENSO thread and the troll who shall not be named has not appeared yet. I hope.
Regards,
Bob
Bob,
Here’s the latest CMIP3 multi-model mean versus GISS; both 3-month centred running-average, baselined to 1991-2020.
Over the ‘forecast’ period (since 2000), GISS is warming faster than the multi-model mean forecast.
Do your own calculations agree? We don’t hear much from you about this these days.
Firstly, Giss is known to be highly adjusted heavily smeared urban surface data.
IT IS JUNK and in no way representative of actual global temperatures.
Secondly.. the 3 chimps have been augmented to 6 chimps.
and that hasn’t improved anything.
Not only that, but the “multi-model mean” is also totally meaningless.
So you have essentially shown a graph of two totally meaningless fabrications against each other.
Well done. 🙂
Late note: The multi-model mean from the IPCC and NASA was for 0.4 degrees C warming per decade. The warming is not just far below the mean, but below the 95% confidence interval range of .25 to .65 degrees per decade. This chart is solid evidence against the hypothesis that human CO2 is the primary cause of warming.
Story Tip
New Study: Climate Models Get Water Vapor Wildly Wrong – A ‘Major Gap In Our Understanding’
Here, we have demonstrated a major discrepancy between observation-based and climate model-based historical trends in near-surface atmospheric water vapor in arid and semi-ari regions.” – Simpson et al., 2024
Is there anything climate models get right ?
grant funding?
This is the problem I have been referencing for a long time. Nice to see another paper highlighting the problem.
Wow! Neither “AI” nor “artificial” appears in a forecast of climate and weather. Back to basics.
Joe Bastardi was saying the coming season could be the “hurricane season from hell” clear back in November.
Unlike the the last several years, it is looking likely the MDR could generate longer track storms that have the potential to grow larger and stronger than the shorter lived storms that have been developing closer in.
Says pattern is likely to be like 2005, 2007, and 2020.
No problem! We just implement more Communism and gift the kleptoligarchs even more money and power and … the weather will still be bad because we will be told by climate models that it is bad.
I hope not. Then we would have to put up with the hyperbole from the Climate Alarmists claiming CO2 is the cause.
I agree. But we really have had a good run of weak seasons as long as one knows the history and ignores the manufactured hype about named storms.
The article has a static temperature cross-section for one day in January. Does anyone know of a link to an E-W temperature cross-section animation that shows a few months of El Nino activity? I’ve looked online a couple of times and haven’t found what I’m looking for.
It’d take time to get the last eighteen months of these animations and put them together to see it all.
Thank you very much, Bob. That was what I was looking for. The top animation shows what appears to be a plume of warm water rising up from below 450m depth at around 160W to 180 deg longitude. What is the source of the data? How does warm water originate and move upward at such depth?
You’re welcome Clyde, I owed you one. Source of the data @ur momisugly depth = Argo.
How is it warmed? By sunshine absorbed at depth. Due to islands, the western Pacific warm pool is less open to circulation, is often shallower, so it gets warmer faster first. There is some unknown geothermal heat emitted from seamounts & hydro vents too.
I have a problem with your answer. As shown in your illustration, all the red and violet light is essentially absorbed by about 75m; the remaining blue and green are absorbed at a little over 200m. There isn’t anything left to warm the water at 400m! I suspect that Argo has provided evidence for deep episodic geothermal heating.
I don’t see where the problem was since I covered both cases, sunshine and the possibility of geothermal.
Paul,
A polite ask, please, if you can avoid terms of winter and summer, because they change by half a year across the Equator. You already show data in 3-month lots like JFM, that do not need mental conversion, so merely use them everywhere.
Apart from that, informative article, thank you. Geoff S
Unfortunately, no one on this thread appears to have any idea as to what causes an El Nino. They are ALWAYS caused by a decrease in the amount of dimming SO2 aerosols in the atmosphere, which increases the intensity of the solar radiation striking the Earth’s surface, and are primarily volcanic-induced.
Likewise, a La Nina is caused by an increase in SO2 aerosol levels, again primarily due to VEI4 or higher volcanic eruptions.
There have recently been 3 VEI4 eruptions reported, so it is not surprising that the current El Nino is weakening: Manam, on Dec 5, 2023, Semeru, on Dec 14, and Shiveluch, on Dec 15. The first 2 are strato-volcanoes while Shiveluch is on the list of shield volcanoes, so it should not have much climatic effect.
See: The definitive cause of La Nina and El Nino Events
https://doi.org/10.30574/wjarr.2023.17.1.0124
Can I suggest an alternative cause of La Nina and El Nino.
It is a natural oscillation between two unstable conditions.
In both cases, the warming phase and the cooling phase, the temperatures overshoot thermal equilibrium, because of the thermal momentum of the system. It takes a long time to wind up and wind down the process in a system the size of the central Pacific.
The typical periodicity of 3.5 = 4 years is a result of the system dynamics, i.e. the size of the system.
dh-mtl:
A well thought out explanation, but the correlations with increasing or decreasing SO2 aerosols is 100%.
Have you ruled out the possibility of SO2 being a spurious correlation?
Clyde Spencer.
There are several different reasons for decreased global atmospheric SO2 aerosol levels, and in each instance, temperatures rise.
SO2 is simply an atmospheric pollutant, and if the amount of the pollution is decreased, the intensity of the solar radiation striking the Earth’s surface is increased.
BurlHenry:
One does not exclude the other.
You are describing a mechanism for variations in the flux of the solar energy into the tropical oceans. I am describing a mechanism for variations in the flux of energy out of the tropical oceans, via evaporative cooling.
There are also, I believe, other sources of variations of energy flux into the tropical oceans, in addition to increasing or decreasing SO2 aerosols, in particular:
However, no matter how much excess energy is transferred into the tropical Pacific by any or all of the above mechanisms, the exponential increase in evaporative cooling (that is the result of the effect of rising temperatures on water vapor pressure and subsequently wind and wave action) puts a hard upper limit on tropical ocean temperatures. And once this cooling mechanism gets into high gear, because of system inertia, it will always over-react and end up cooling the ocean well beyond its equilibrium temperature. Of course if evaporative cooling increases exponentially with increasing temperature, it also decreases exponentially with decreasing temperature. So once the water is cold, there is no longer sufficient cooling to offset the energy inputs, and the water will warm up.
In conclusion, I do not doubt that there are correlations between ENSO and factors that affect heat input into the tropical Pacific. But that does not contradict the fact that evaporative cooling provides a very strong negative feed-back mechanism for variations in ENSO temperatures that limits both the up-side and down-side temperatures.
I have some doubts about La Niña. We are past the peak of solar activity and the solar wind will slowly weaken. The jet stream will become more meridional, which will result in weaker winds in the tropics. La Niña needs strong and steady easterly winds. Therefore, I think we will continue to have high surface temperatures in the tropical Pacific.

The cold subsurface wave in the equatorial Pacific is weak. The surface remains warm.
http://www.bom.gov.au/archive/oceanography/ocean_anals/IDYOC007/IDYOC007.202402.gif