By Kenneth Richard on 6. November 2023
Significant 21st century cooling in the Central Pacific, Eastern Pacific, and nearly all of Antarctica “implies substantial uncertainties in future temperature projections of CMIP6 models.” – Zhang et al., 2023
New research indicates West Antarctica’s mean annual surface temperatures cooled by more than -1.8°C (-0.93°C per decade) from 1999-2018. In spring, the West Antarctic Ice Sheet (WAIS) cooling rate reached -1.84°C per decade.
Not only has the WAIS undergone significant cooling in the last two decades, most of the continent also cooled by more than 1°C. See, for example, the ~1°C per decade cooling trend for East Antarctica (2000 to 2018) shown in Fig. ES1.
Of 28 CMIP6 models, none captured a cooling trend – especially of this amplitude – for this region. This modeling failure “implies substantial uncertainties in future temperature projections of CMIP6 models.”

Image Source: Zhang et al., 2023
The post-1999 cooling trend has not just been confined to Antarctica. Sea surface temperatures (SSTs) in the Eastern and Central Pacific (south of 25°N) also cooled from 1999-2018 relative to 1979-1997. This cooling encompasses nearly half of the Southern Hemisphere’s SSTs.

Image Source: Zhang et al., 2023
The 1999-2018 mean annual surface temperature cooling of the Antarctic continent and nearly half of the Southern Hemisphere’s SSTs do not support the claims that surface warming is driven by human emissions of greenhouse gases (GHGs). After all, if the widespread cooling cannot be explained by the increase in GHG forcing, why would the same concentrations of GHGs explain the areas with warming temperatures?
HT/David H, bnice2000
Some climatologists think that certain environments, such as Antarctica, are cooled by more plant food in the air.
Another is the hottest areas of the moist tropics, above 30 degrees C.
CO2 doesn’t cool the tropics, and I don’t know of any scientists who say that CO2 would cool the tropics. What they do say is that because of all the H2O in the air, there is nothing left for CO2 to absorb.
I do know scientists who say that CO2’s displacing water molecules in that environment reduces the “GHE”.
This Antarctic Cooling brought to you by GLOBAL WARMING™. Global Warming where even cooling is a problem that can be solved if we could just spend more other peoples money on energy that can’t be delivered when its needed
At prices those people cannot afford.
The Good Lord had our best interest at heart, when he stored all these fossil fuels
However, some heathen members of the human race, aka, woke net zero folks, want to undo God’s will, by “Leaving it in the Ground” mantras.
Just use the wind, they say, and store the excess electricity in batteries, and all will be fine.
However, all of us will be broke.
We won’t own anything
We would be told, over and over again, to love it, while looking from our tree nests and caves.
Mining of the resources needed to build even a small fraction of the necessary battery capacity would cause environmental damage >> the impact of using fossil fuels and ICE vehicles.
And we won’t be “leaving [fossil fuels] in the ground” if we continue to allow them to run civilization off a cliff, because none of their sun and wind collectors or batteries can be built without all their energy inputs coming from…fossil fuels.
There’s no free lunch.
These articles will be of interest to curious minds
GLOBAL WARMING IN VERMONT
https://www.windtaskforce.org/profiles/blogs/global-warming-in-vermont
BATTERY SYSTEM CAPITAL COSTS, OPERATING COSTS, ENERGY LOSSES, AND AGING
https://www.windtaskforce.org/profiles/blogs/battery-system-capital-costs-losses-and-aging
US/UK 66,000 MW OF OFFSHORE WIND BY 2030; AN EXPENSIVE FANTASY
https://www.windtaskforce.org/profiles/blogs/biden-30-000-mw-of-offshore-wind-systems-by-2030-a-total-fantasy
When the windmill government subsidy checks end, the 17th century invention will have a tough time surviving profitability. The benefit I see to them is that when the wind is blowing, the natural gas turbines can spin down, and the conventional power plants run les and the natural resource is preserved while the wind is blowing. At least that is the way the Texas grid is going. Renewables cannot feed the grid without a baseline fossil fuel generation portfolio with enough accumulated wattage to supply the entire grid at peak demand, without that, a devastating cascading wave of shortages that can cause destruction to any transformer bank (massive things as big as houses) down the line that are under a load.
“After all, if the widespread cooling cannot be explained by the increase in GHG forcing, why would the same concentrations of GHGs explain the areas with warming temperatures?”
My guess is that they’ll roll out the ozone depletion theory again. And as for the tropical Pacific, La Niña has been more common recently. I’m sure that’s “due to GHGs” as well.🙄
A very short Google search on, “Has Antarctica cooled?” Turns up this statement:
Antarctic satellite temperatures show no warming for 37 years.
The Southern Ocean around Antarctica has cooled markedly
since 2006. Sea ice has increased substantially, especially
since 2012.
A click on Google’s [News] finds this headline from Scientific American:
Why Is the South Pole Warming So Quickly? It’s Complicated
There is no reason for anyone to read Scientific American.
The Google statement is true up to a point, there has been no significant net warming in the Antarctic in the full 65 years of data however according to the National Snow and Ice Data Centre (NSIDC) there has been a net reduction in Antarctic sea ice area since 2015.
Yet there was pronounced gain in Antarctic sea ice from 1979 to 2014, all the while CO2 was increasing and Arctic sea ice was falling, at least from 1979 to 2012. Hence, there is no correlation at all between sea ice and CO2.
To summarize:
Plant food in the air grew from 1979 to 2023.
Arctic sea ice fell from 1979 to 2012, but has grown from 2012 to 2023.
Antarctic sea ice grew (dramatically) from 1979 to 2014, but has fallen from 2014 to 2023.
Hence, CO2 has no demonstrable effect upon global sea ice extent.
It’s just data that does’t suggest anything one way or another.
Really?
Arctic sea ice decline from 1979 to 2012, followed by growth from 2012 to 2023, means nothing? Then why was so much made by alarmists over sea ice decline from 1979 to 2012?
Alarmists ignored Antarctic sea ice growth from 1979 to 2014, but now tout decline from 2014, yet both mean nothing?
Do you really not re3call all the hoopla by Prince Albert and his peanut gallery over Arctic sea ice extent decline early in this century, and late in the last? Did you then say it meant nothing?
Sounds like the Sage Chris has just indicated that global sea ice change (+/-) is meaningless as far as global warming proof is concerned…
Unless the climate prognosticators and pervaricators should happen deem it necessary to prove their cause😎
It’s true that correlation does NOT demonstrate causation. However, LACK of correlation can certainly demonstrate LACK of causation, particularly over time.
Ha ha! Seven years isn’t a long term trend. It’s a burp. Even the most zealous believers in global warming, er “climate change”, among climate researchers tell us it takes around 30 years to establish meaningful trends . . . but only when it’s trending the “wrong” way and refutes their claims. When one year is warmer than the previous one —the proper trend in their worldview—they run around like agitated hens squawking about imminent doom.
Unscientific Unamerican
An expensive way, I gather, to mitigate a toilet-paper shortage.
Auto
“There is no reason for anyone to read Scientific American.”
Not unless you are a glutton for climate change propagada. That’s all you will get out of Scientific American. Scientific American is part of the problem.
The Antarctic cooling will spread from 70 degrees south to 30 degrees south in future decades
That means cooling is coming to the southern tip of South America and of Africa
The “roaring 40s” will become “the roaring freezing 40s”
I used to subscribe to Scientific American and they pointed out that CO2 was a trailing indicator of global warming back in the early 80s, and they had ample evidence of this fact. When they went stupid I canceled my subscription and haven read a single article of that Marxist propaganda rag since. 🙁
The temperatures at Mawson and Casey bases both reveal cooling trends.
BoM mean temps
Mawson
1955-1964 : -11.1C
1965-1974 : -11.2C
1975-1984 : -11.5C
1985-1994 : -11.3C
1995-2004 : -11.4C
2005-2014 : -11.1C
2015-2022 : -11.0C
Casey
1989-1998 : -9.2C
1999-2008 : -9.1C
2009-2018 : -9.4C
2019-2022 : -9.1C
If accurate and continues this does not bode well. Could mean a cooling period that will not go well for humanity.
But the Northern Hemisphere is warming, while the Southern Hemisphere is cooling. And predictions are that Northern Hemisphere warming will continue.
This cooling Southern Hemisphere shows that CO2 is not the control knob of the Earth’s climate, unless it can be shown that CO2 can warm one Hemisphere, while simultaneously cooling the other Hemisphere.
Do any CO2 Climate Alarmists have an explanation for why one Hemisphere is warming while the other cools? Would love to hear it.
Not an alarmist, but UHI comes to mind!
Hmmm . . . no reason whatsoever to be alarmed . . . doesn’t everybody know that hot air rises?
Not to worry. A drop of a few more degrees C across the N. hemisphere will persuade most people that maybe building a few thousand SMRs is a really good idea.
Only one way to resolve the disputed claims of Antarctic warming vs cooling –
get Chris Turney to take a ship of
foolsamateur scientists there to report what they experience.Oh wait . . .
If CO2 causes warming then a deep cooling trend (Milankovitch Cycle Cooling) could be great news. FF demand would grow to try and counter the 100,000 year cold by increasing GHG load
The Grand Solar Minimum has just started
Modern Grand Solar Minimum will lead to terrestrial coolinghttps://www.ncbi.nlm.nih.gov/pmc/articles/PMC7575229/
“ship of
fools”,Hopefully, they might be Erasured. Wonder if they know “that one and one are two Two and two are four”?If the data was there, we would see that it has been cooling for much longer than 20 years. The summer solstice sunlight at 50S peaked 1800 years ago at 519.8W/m^2. It is now down 3W/m^2 from that peak.
http://vo.imcce.fr/webservices/miriade/proxy.php?file=http://145.238.217.35//tmp/insola/insolaout45QvdS&format=text
There is no doubt considerable thermal inertia in the oceans and ice on land but one would expect a solid cooling trend by now, which is evident where measurements are available.
This single headline invalidates ALL climate models. None are able to have a sustained cooling trend anywhere while CO2 is going up. Attached shows the CSIRO -ACCESS model prediction for south of 50S – clearly no cooling trend there!!
Just to nail the point, attached shows Hadley and GISS prognostications with the CSIRO-ACCESS. All going up where there has been cooling. If only they had more tuning parameters!
None of these climate scaremongers ever look at measured data. If it does not come out of a computer model then it is not real. None of them has the guts to stand alone and condemn the BS they produce. There are voters still voting for the people who give away our wealth to these gutless scoundrels.
The subjective models show increasing temperatures
The measured data show decreasing temperatures
We should position graphs side by side to blow the fakers off the ice floe
1) 1800 years ago they could measure solar radiance at Earth’s surface to a precision of 519.8 W/m^2? Surely you jest!
Even if you meant to say in the year 1800 they could measure solar radiance at Earth’s surface to a precision of 519.8 W/m^2, that would be unbelievable since the actinometer (an instrument that can measure the heating power of radiation) was invented by John Herschel in 1825.
Ref: https://en.wikipedia.org/wiki/Actinometer
Moreover, the first pyranometer (a type of actinometer used for measuring solar irradiance on a planar surface and designed to measure the solar radiation flux density, in W/m2, from the hemisphere above within a wavelength range 0.3 μm to 3 μm) wasn’t invented until much later, in the year 1893 by physicist Anders Ångström and physicist/meteorologist Anders Knutsson.
Ref: https://www.elprocus.com/what-is-pyranometer-construction-types-applications/
2) Interesting that the MODEL PREDICTION graph you posted has it’s red oscillating values only beginning a warming trend around 2025 . . . that is, about a year from now.
I don’t think any further comment is necessary.
I meant what I wrote – 1800 years ago, during the Roman Empire. The oceans have very long time constants. Abyssal flows from Antarctica are up to 2000 years from submergence to re-emergence.
The orbit has been doing what it has been doing for some 4Ga since Earth was hit by the obsject that spawned the moon. So solar intensity is highly predictable anywhere at the top of the atmosphere based on a solar constant that varies little combined with a little geometry. Even allowing for the small variation in solar constant, the relative change over the 1800 years of 3W/m^2 is highly accurate.
This is simply a function of the tuning data used for the model. CMIP6 was tuned with measured data to 2016. The SH south of 50S has been cooling for a long time so this region was tuned with downward trend but the models are incapable of maintaining a downward trend so they tend to start flat. Post 2016 it starts to increase. CMIP3 was tuned to data to 2000 so it is instructive to compare the two predictions per attached.
The earlier model starts warming earlier but does not increase quite as fast.
Wow! . . . those Romans (or their contemporaries) were way more scientifically advanced than they are given credit for!
I’m curious if you can cite a peer-review paper or article from ca. 223 AD that states where, when and how they measured 519.8 W/m^2 surface radiation.
Waiting . . .
The Romans did not need to measure it. And it is top of atmosphere not surface.
If you do not understand geometry then the calculations is beyond you but you can get the calculated data from this link:
http://vo.imcce.fr/webservices/miriade/proxy.php?file=http://145.238.217.35//tmp/insola/insolaoutF9Abs0&format=text
Earth’s orbit is highly predictable. It has been moving around the sun for a long time under gravitational influences. The solar constant – well is close to constant.
Excellent rebuttal.
Except for the known fact that TSI (even measured at top-of-atmosphere) is dependent on more variables that just Earth’s distance from the Sun as determined by its orbit. Just a few examples: the Sun’s ~11-year sunspot cycle, and changes in the intrinsic brightness of the Sun beyond that just due to the sunspot cycle.
(Ref: https://en.wikipedia.org/wiki/Solar_irradiance )
“The Sun is a Variable Star That’s right, I said it, and I’m not the only one. Officials at NASA are saying it too . . . More dramatic than the sunspot variations are the sudden and violent eruptions the Sun can produce on any given day.”
(Ref: http://simostronomy.blogspot.com/2010/02/sun-is-variable-star.html )
But apparently neither you or RickWill know these things.
BTW, the latest scientific measurements of TSI at TOA is 1360.9±0.5 W/m^2, so if one divides by 4 to get an assumed spherical surface-averaged, time-averaged TSI for Earth, the value is 340.2±0.1 W/m^2.
This is considerably different the value of 519.8 W/m^2 posted by RickWill above.
So, RickWill is self-contradictory in his assertions “it is top of atmosphere not surface” and “The solar constant – well is close to constant”.
I am quite surprised that you find such to be “excellent”. Oh well.
Nowhere on Earth gets the average value day after day. The sun constantly changes its orientation to any location on Earth. The value of 519.8 will be the highest daily average at 50S in the past 10,000 years and has been declining for 1800 years. Orientation of Earth to sun is far more important than minute variations in the solar constant.
The value of 519.8 is based on the IMCCE preset solar constant of 1368W/m^2. If the constant is taken as 1360 then the peak summer solstice at 50S reduces to 516.7. However, such a small change in the constant does not alter the difference. It will still be 3W/m^2 down over the past 1800 years and will result in a corresponding cooling trend, which is being observed now.
The situation in the NH has the opposite trend. 50N bottomed 400 years ago at 481.6W/m^2 and has increased by 0.1W/m^2 since.
The temperature range at any location on Earth is highly correlated to the top of atmosphere solar intensity allowing for the inherent thermal lag on the timescale of interest. You may have even observed that it is usually cooler at night when there is no sun compared to day when there is sunlight.
The global average land temperature ranges from 6C to 22C and is highest in July just after orbit aphelion -least sunlight. Ocean surface average presently ranges from around 18.2C to 18.7 with peak usually in August. Using an average solar intensity of 340W/m^2 across the globe is not going to give you any understanding of why the temperature changes and why the climate is changing. But understanding how the solar intensity at any location is constantly changing enables forecasting the trends. Expect the SH to cool and the NH to warm until the snow starts to accumulate again and the sea level falls.
Hmmm . . . my calculator says that cosine(50°)*1360 W/m^2 = 874.9 W/m^2, NOT 516.7 W/m^2. I have triple-checked that calculation.
Maybe you need to replace the batteries in your calculator?
Ooops . . . accidental typo (dropped first digit to right of decimal point): should read “my calculator says that cosine(50°)*1360 W/m^2 = 874.19 W/m^2″.
Why I bother in this case, I don’t know.
Dividing by 4 is simply a high school calculation to find an average. The real scientist would use a cosine function to determine the distribution across the globe.
That cosine distribution converted to T⁴ is not an average. Do you understand why a cosine applies?
Sure, I understand your comment as far as its reference to a cosine law/ distribution, but no further; the cosine law/distribution is explained in mathematical detail at the https://en.wikipedia.org/wiki/Solar_irradiance reference that I previously provided, but I guess you didn’t bother to look at that.
My above comments were not specific to TOA TSI at any give latitude on earth or any given time-of-year, but to the computed area-averaged TSI value (i.e., 340.2 W/m^2) used by scientists when discussing Earth’s total “steady-state energy balance”. I guess you missed that.
BTW, please explain the exact mathematical process by which one converts a “cosine distribution” to T⁴ (your words) . . . and why there is even a need to propose do such an impossible thing when discussing solar irradiance, which is in units of W/m^2.
Suggest you look up the definition of the word “obfuscation”.
It is not obfuscation. Let’s toss in the sine function also. There is no such thing as a “steady-state energy balance” on the earth. It is a way for math challenged climate scientists to use simple high school averages to calculate a complex interaction with a constantly changing phenomena.
I do think Rick Will meant the insolation at 50S during the northern hemisphere summer. Remember, you must add the latitude of the sun onto the latitude of the earth. At the summer solstice in the NH, the sun is at ~23° N. That must be added to the 50°S. 1368*cosine of 73° = 400.
T⁴ is important since the earth is heated differently depending on the latitude you pick and the time of day. There are so many things going on, averages just don’t work.
Imprecise terminology leads to miscommunication . . . and I’m as guilty as anyone in this regard.
So, first, to clarify the series of above posts, I assumed this statement in RickWill’s OP of November 7, 2023 8:09 pm :
“The summer solstice sunlight at 50S peaked 1800 years ago at 519.8W/m^2.”
referred to 50° south of the plane of the ecliptic, not 50° South latitude, in order to get anything approaching his stated low value of 519.8 W/m^2 . . . i.e., cosine(50°)*1360 W/m^2 = 874.2 W/m^2.
If instead, it was meant to apply to 50° south latitude, then yes the geometry for peak solar irradiance at summer solstice in the southern hemisphere must be modified to cosine(50° – 23.2°)*1360 W/m^2 = 1,213.9 W/m^2, where 23.2° represents Earth’s obliquity 1800 years ago. But this number is even higher than the stated 519.8 W/m^2.
As you calculated, if RickWill really meant to state sunlight at 50S reached minimum value when there was peak sunlight (i.e. summer solstice) in the northern hemisphere—and IMHO that’s a tremendous stretch of interpretation—then, yes, cosine(50° + 23.2°)*1360 W/m^2 = 393.1 W/m^2, but that’s still very different from his stated value of 519.8 W/m^2.
Finally there is this bit of humor: why in the world is there specific mention to TOA solar irradiance being “measured” at “50S” (latitude) 1800 years ago? Could it possibly be referring to a little-known southern hemisphere equivalent of Stonehenge, or perhaps it has more to do with “readout” of the Nazca Lines?
“The Nazca Lines . . . a group of geoglyphs made in the soil of the Nazca Desert in southern Peru . . .created between 500 BC and 500 AD.”
(ref: https://en.wikipedia.org/wiki/Nazca_Lines )
That range of date would be consist with RickWill’s stated and repeated, “1800 years ago”, but this geological feature is only at about 15° S latitude.
Strange . . .
It’s just a model. It can be made to show anything. It is meaningless.
Significant 21st century cooling in the Central Pacific, Eastern Pacific, and nearly all of Antarctica “implies substantial uncertainties in future temperature projections of CMIP6 models.” – Zhang et al., 2023
Typical trick from the NTZ. What Zhang et al actually said was
“which implies substantial uncertainties in the future temperature projections of CMIP6 models on the WAIS“
And continued:
“It is easy to understand that, despite the relatively high reliability of the models for the global-scale temperature changes, their representations of climatological interdecadal transitions over Antarctica are generally less accurate, probably due to their coarse resolution and sparseness of polar-special physical schemes.”
Yeah Nick, we all know that career orientated climate scientists have to phrase any criticisms very, very carefully.
No doubt Zhang really would have liked to state it as directly as did NTZ.
But if they had, they never would have been published
Found a hidden message in the Zhang et al. abstract:
Isn’t it incredible the secrets we uncover when we realize we can ignore the things people actually say and instead impart whatever thoughts and motivations we want onto them?
Antarctic has been cooling for a very long time.
Only the Grand Solar Maximum during the latter half of last century changed that.
Now it appears it may be COOLING again.
Alala’s post is NOT credible.
Ice cores also show no warming since 1800
What Zhang is doing is parroting AGW mantra, without looking at the evidence. (does he show evidence of what he says?)
This is not an uncommon necessity to get a paper passed “climate” pal-review.
But I suspect you are well aware of that fact.
red thumb.. still can’t cope with actual data and facts.
So sadly pathetic. 🙂
This is just bunkum to avoid offending the climate scaremongers and have some hope of getting the work published.
The truth is that CO2 does nothing and the models are tripe founded on BS.. We can only hope that voters stop voting in governments that support institutions peddling unphysical claptrap.
That deserves repeating !
Should add.. CO2 does nothing “climate-wise”.
It certainly enhances the biosphere. !
Which explains why the greenies HATE it so much !
“relatively high reliability of the models for the global-scale temperature changes”
Which of course is utter balderdash !
But just the sort of thing Nick-witless would choose to “believe”.
Model ‘projections’: unrelenting warming trend
Reality: strong cooling trend
Yes, I suppose you could describe that as being ‘less accurate’. But equally, we might ask who is it that believes that the models otherwise have ‘high reliability’? That the models manage a warming trend in the global metric at a time when the global metric is warming should not be a surprise, but we know the spread of ‘projections’ from different models is wide so to claim “relatively high reliability of the models for the global-scale temperature changes” is nonsense. Many of these models are way out.
Funny how you used a typical trick of yours to dismiss “Significant 21st century cooling in the Central Pacific, Eastern Pacific, …”. It isn’t just Antarctica that is missed.
“generally less accurate” seems to pretty much indicate high uncertainty regardless of the reason. You have not refuted the conclusion of the essay. You have only given an poor excuse as to why the models are not accurately portraying the climate. Inaccuracy is inaccuracy however you cut it. Why not simply admit that the models have problems showing an accurate view of global climate?
“despite the relatively high reliability of the models for the global-scale temperature changes,”
That’s funny, right there!
Nick what is the purpose of this comment?
The Antarctic Ice Sheet mass has been ticking up since 2020. For some reason NASA seem really slow to update their inconvenient data the past 12 months. No updates since June this year, so they are only six months behind.
https://climate.nasa.gov/vital-signs/ice-sheets/
They must be awaiting final Karlization of the data
More Southern Hemisphere cooling indications. This for the lower troposphere over Australia.
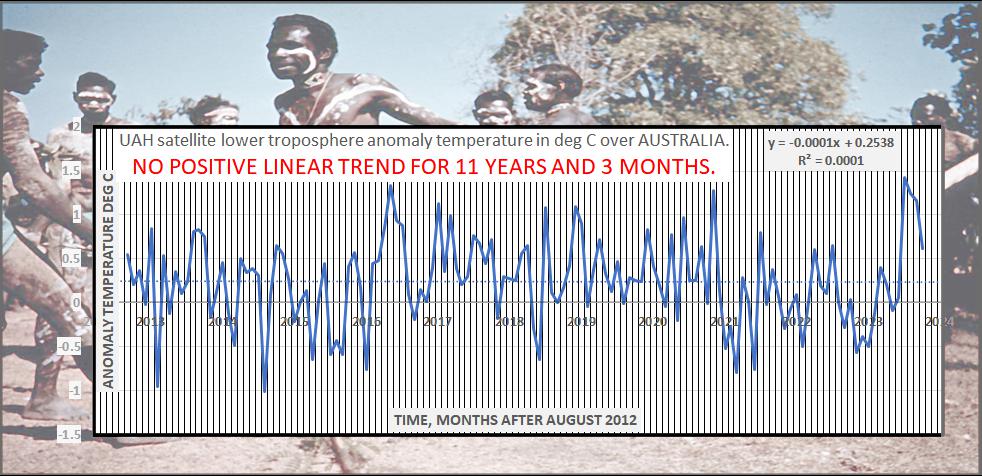
Geoff S
Are we using satellite data for Antarctic temperatures too? Because according to UAH, land areas in Antarctica have warmed at a rate of +0.10C per decade since 1999, apparently contrary to the surface observations mentioned in this article.
Or do we just use the tried and tested WUWT method of selecting the data source based on which one gives the lowest trend for any given region/period?
“+0.10C per decade”
OH NOooooo !!!!!!!
LOL.. and the flaming nit-wit goes into PANIC mode yet again!
As you keep reminding everyone. UAH is an atmospheric temperature, not a surface temperature.
Not much chance of URBAN warming at the South Pole , is there, fungal toenail. !
And NO, the trend in UAH SoPOL land is 0.05C/ decade.
Your R² value is wrong too.
I believe that the coverage of the poles are limited due to satellite orbits. Your assertion is probably in error when considering the entire Antarctic.
It’s not my assertion; it’s data published by UAH (see the link).
Misleading since Satellites doesn’t directly cover the top and bottom polar regions of the world.
0.10°C is a mathematically derives estimate of probability. It is too small to be read by any thermometer ever produced and it’s error range is likely to swamp it at around +/- 1.5°C. In short you have produced a table of noise with a red dotted line drawn through the middle of it at apparent random.
With the stated R^2 value of .0049 for the linear regression curve fit overlaid on the graph of UAH Antarctica temperature anomaly data that you posted, the slope could easily be viewed as 0.0C per decade since 1999.
Also, I’m certain that UAH derivation of temperatures “over land” actually refer to the LTT (lower troposphere temperature) temperatures as derived from satellite microwave sounding instruments (MSUs), and they are not meant to be taken literally as temperatures of the actual surface.
It is well-known that there can be substantial differences between actual ground and adjacent air boundary layer temperatures, especially over snow and ice.
But maybe you didn’t know these things.
R² is actually 0.0014
FN just doesn’t understand even remotely what he is talking about…. ever. !
TFN was responding to Geoff S, who provided satellite temperatures over Australia as another “southern hemisphere cooling indication.” So the person you should direct this comment to is Geoff.
Irrelevant as always.
TFN hasn’t got a clue what he is talking about.
Surely even someone as naive as you are, has figured that out by now.
An optimistic hope, clearly unfulfilled.
Your comment is very funny because it is so idiotic: it was TFN that posted to the plot of UAH Antarctica temperature anomaly data that I commented on above . . . why in the world would I want to to reply to Geoff S (under the pen name “sherro01” who, as your yourself state, posted UAH LTT data for Australia?
Reading comprehension 101.
Sometimes I think I might be talking to toddlers on this site. Are you being intentionally obtuse? Or are you genuinely this confused?
It seems that, in your mind, it’s ok to use LTT as an indicator of cooling over Australia, but it’s not ok to use LTT as an indication of warming over Antarctica. Does that sum up your take on this?
It is you that cant read with understanding. UAH is not accurate over the poles. The coverage only goes to about ±85°.
Actually they go from 85°N down to 80°S
So they miss about 3% of the Arctic area (above 60°N), and about 11% of the Antarctic area. (below 60°S)
No.
Sometimes.. no make that ALWAYS, I think your comments are those of a mental midget.
You have zero understanding of basically everything.
You are the said mental “toddler”, and your mind is too underdeveloped and childish to understand anything above that level.
What’s that saying… everything you think you know .. is WRONG !
All the paleo temperatures for the past million years show that when CO2vpeaked, temperatures dropped suddenly. When CO2 levels were low, temperatures rose slowly.
The opposite of what the models project, because there is no evidence any human or machine has ever predicted the future better than chance
“All the paleo temperatures for the past millions years” also show a steep rise in temps (and the laggard CO2) just prior to the rapid descent of temps back into a period of glaciation!
This is most likely the reason for the shrillness and hysteria of the Climatocracy at present. They aren’t sure of what’s really happening, but they fear a rapid cooling trend is imminent, and the peasants can be hard to control when their lords and masters are shown to be incompetent morons! Worldwide Marxist goverment MUST be instituted post haste, before the plebs awaken to the scam and throw their sorry arses out of power! Or worse!
Only the ruling elites, with their sycophants, servants and slaves, will be allowed to survive. They don’t give a toss about the rest of humanity, even their avid supporters like Nick-wit and FungaltoeNail!
Yabut, Greenland ice is melting, losing an amount that would fill over 6,000 Empire State buildings, which would be the equivalent of a bazillion kiddie pools, give or take. But wait, there’s more. There are melt ponds on the ice! And these are creating rogue moulins, which are sometimes known as a “Moulin Rogue”, and these are bringing water to the bottom of the glaciers, greasing the skids so to speak, allowing them to advance more rapidly towards the ocean. We’re doomed.
Hey, it’s just one of the side effects of global warming.
A 20-year cooling trend in Antarctica should drive the last nail into the coffin of fears about sea level rise due to “global warming”.
Some people have observed melting around the edges of Greenland (particularly in summer), which is much more accessible than Antarctica, and tried to extrapolate this melting into a catastrophic future sea level rise, particularly by “assuming” that inaccessible, seldom-observed Antarctica will follow the same trends as Greenland.
However, the volume of the Greenland ice sheet (2.85 million km3) is dwarfed by the volume of the Antarctic ice sheet (26.5 million km3, or 9.3 times larger). A long-term cooling of Antarctica, and further growth of the Antarctic ice sheet, can easily overwhelm any melting of the Greenland ice sheet.
Any changes in sea ice cover do not affect overall sea level, since sea ice already displaces its weight in liquid water, whether it is solid or melted into the sea. Sea level is only affected by growth or shrinkage of ice caps on land, of which over 90% is in the cooling Antarctic.
Be quick to download before the paper is retracted.
Didn’t Mike Jones write about this a few years ago?
https://wattsupwiththat.com/2019/04/10/the-curious-case-of-the-southern-ocean-and-the-peer-reviewed-journal/
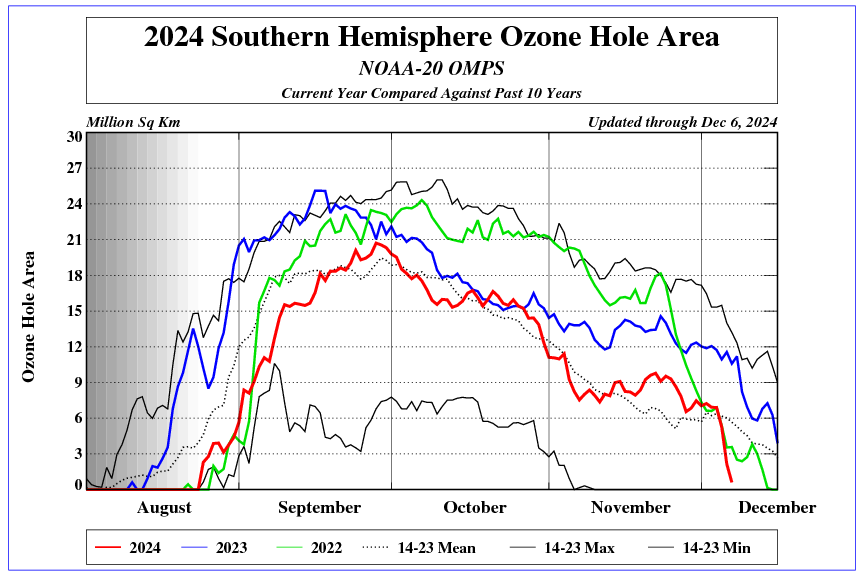
The ozone hole in the Southern Hemisphere continues to exceed the 2013-2022 average.
I wonder what caused that cooling…
Wood for Trees: Interactive Graphs