Guest Post by Willis Eschenbach
Yesterday, Anthony Watts posted a most interesting discussion of the Hunga-Tonga volcano, entitled “Record Global Temperatures Driven by Hunga-Tonga Volcanic Water Vapor – Visualized“. I found some curiosities worth discussing in the post.
First was the delay between “cause” and “effect”. Here’s Ryan Maue’s graph showing the conundrum:
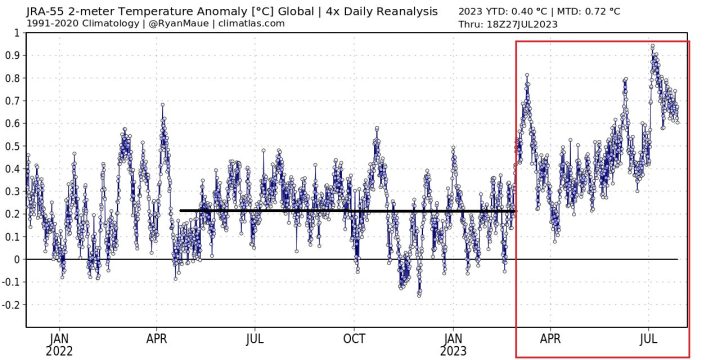
Figure 1. Output of a climate reanalysis model of the 2-meter surface temperature. This shows a big jump in mid-March.
Now, the Hunga-Tonga volcano erupted on 14 January 2022. My questions are … why is there a ~ 14-month delay before the mid-March 2023 temperature jump shown in the red square in Figure 1?
And why does the eruption have no visible immediate effects?
I mean, we’re talking about changes in radiation due to water vapor, and they are instantaneous—as soon as the water vapor concentration changes, the radiation changes.
And why is there nearly as much warming from November 2022 to the mid-March date of the purported “jump” as there is after the date of the “jump”?
Some folks have said that it’s because it takes time for the water vapor to spread around the stratosphere. In his post, Anthony quoted from a study entitled “Global perturbation of stratospheric water and aerosol burden by Hunga eruption” regarding the huge quantity of water vapor injected into the stratosphere. But here’s another quote from that same paper:
Owing to the extreme injection altitude, the volcanic plume has circumnavigated the Earth in only one week and dispersed nearly pole-to-pole in three months.
So we should have seen some kind of change within a few months of the eruption … but there’s no sign of that in the data above.
Now, Ryan Maue’s graph doesn’t show observed temperatures. Instead, it’s the output of a climate “reanalysis” model. So I thought that in addition, I’d look at, you know … actual observations. I was going to start with the Berkeley Earth temperatures. But they only extend to March 2023, so they wouldn’t show the purported jump in temperatures.
So instead, I looked at the UAH MSU satellite atmospheric temperatures. Let me start with the temperature of the lower stratosphere because it’s there that the water vapor was injected, so it’s there that we should see the main effect.
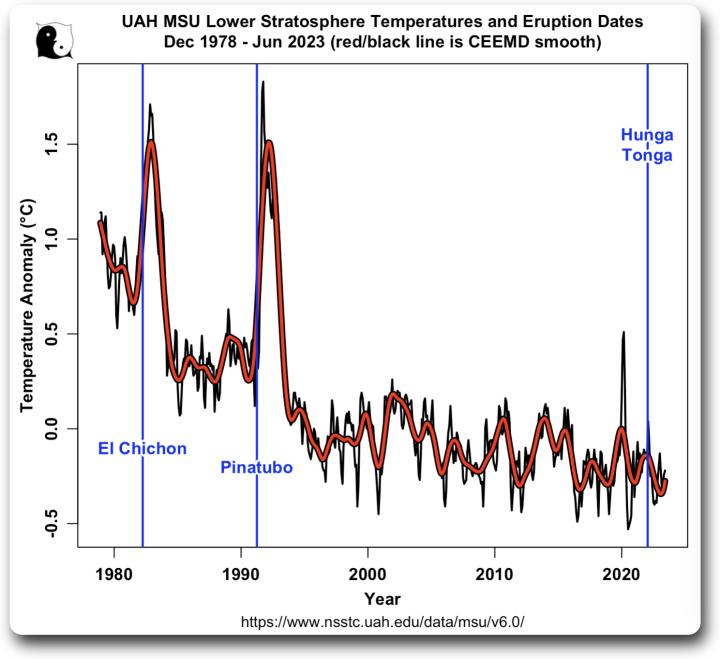
Figure 2. UAH MSU lower stratosphere temperatures.
You can see the effect on the stratosphere of the large eruptions of the late 20th century, Pinatubo and El Chichon. The temperature peak just before the Hunga-Tonga eruption is likely a combination of the White Island and Taal eruptions in December 2019 and January 2020.
But there’s no sign at all of the Hunga-Tonga eruption. Nor is there any sign of the purported jump in temperatures in mid-March 2023.
Moving down in altitude, here’s the temperature of the tropopause, which is the altitude where the stratosphere meets the troposphere.
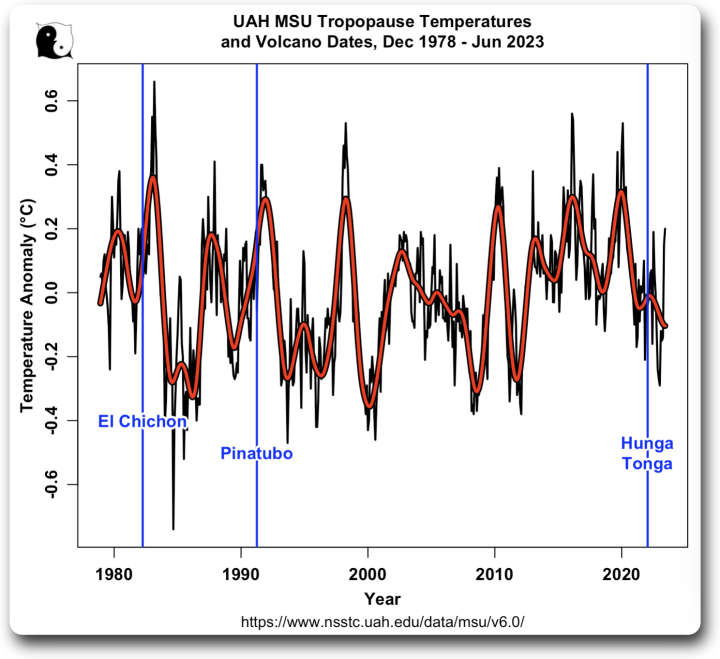
Figure 3. UAH MSU tropopause temperatures.
The signals of the earlier eruptions are less distinct at this lower altitude … and again, no sign of any effect from Hunga-Tonga.
Moving lower still, here’re the mid-troposphere temperatures.
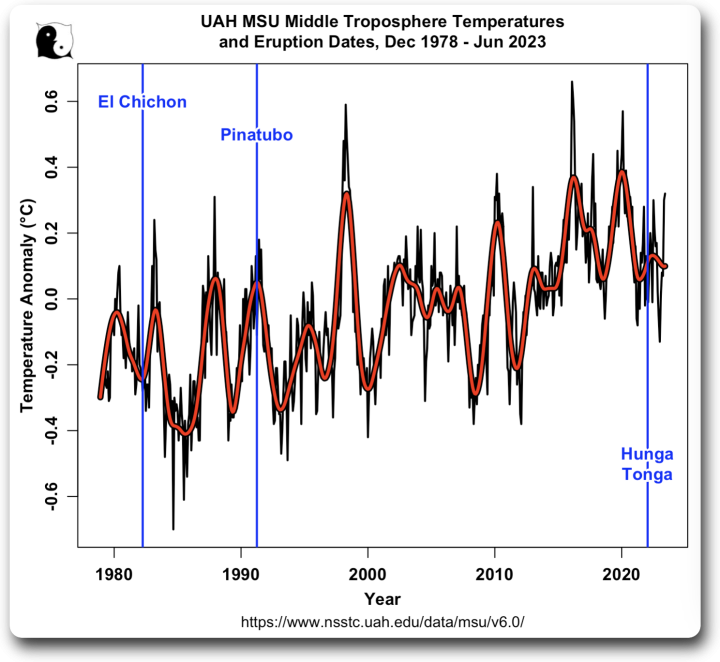
Figure 4. UAH MSU middle troposphere temperatures.
The signs of the big eruptions are pretty much lost in the noise … and still no sign of Hunga-Tonga.
Finally, here are the UAH MSU lower troposphere temperatures:
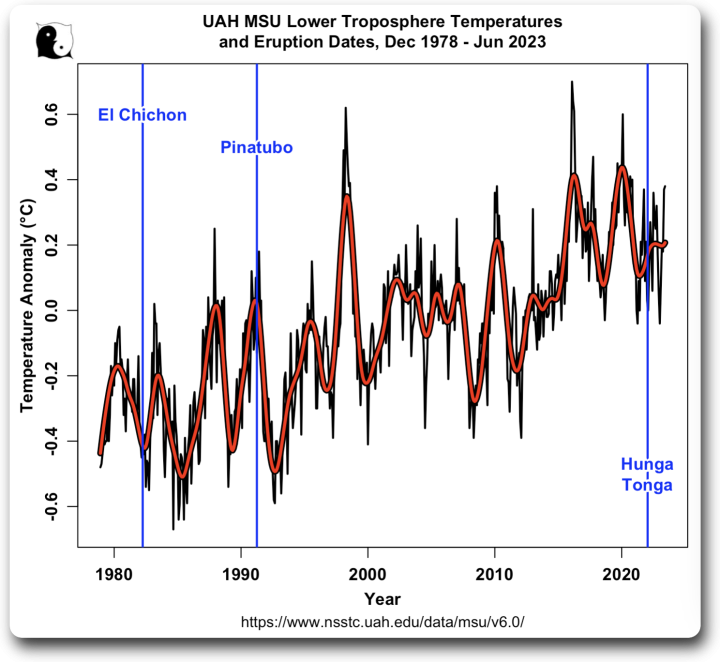
Figure 5. UAH MSU lower troposphere temperatures.
Same story. No sign of any effect of Hunga-Tonga.
So I figured I might be looking in the wrong place. Where would we expect to see the changes from a volcano in Tonga?
Well, in Tonga, maybe? … unfortunately, there’s no daily temperature data from Tonga. However, here’s data from some of the nearby islands.
We’ll start with Fiji, a lovely place where I lived for nine years. Hey, those waves aren’t gonna surf themselves …
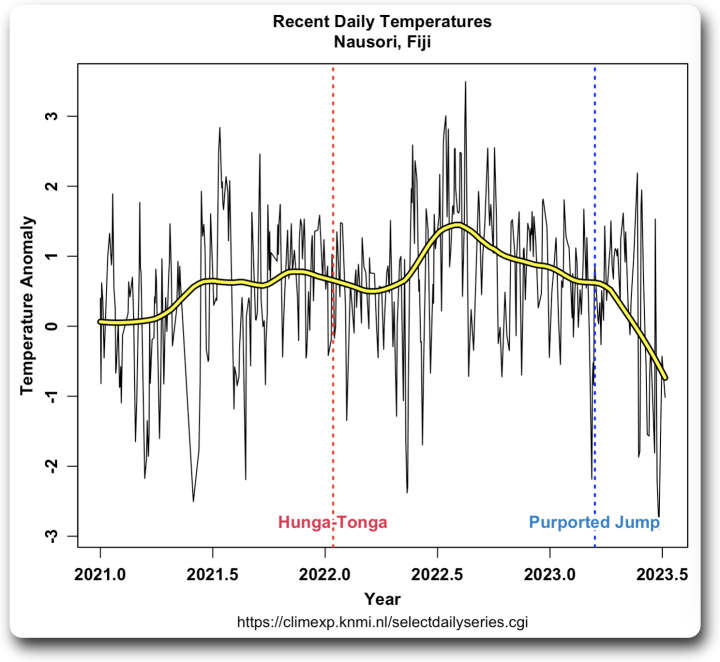
No immediate effect from the eruption, nor is there any sign of the purported jump in temperatures in mid-March. Next, here’s Tahiti:
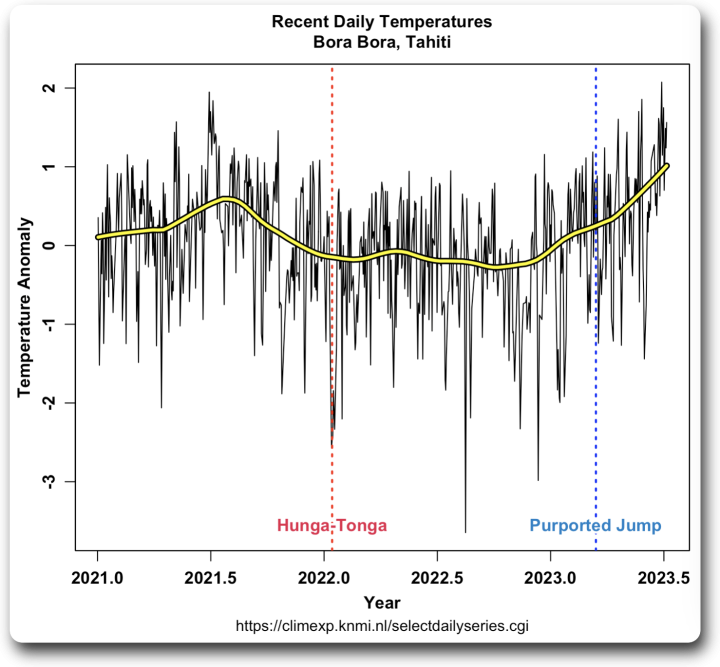
Again, no sign of the eruption, nor of any sudden jump. It rose after the “jump” date, but it rose before that date by about the same amount.
Next, Pago Pago in American Samoa.
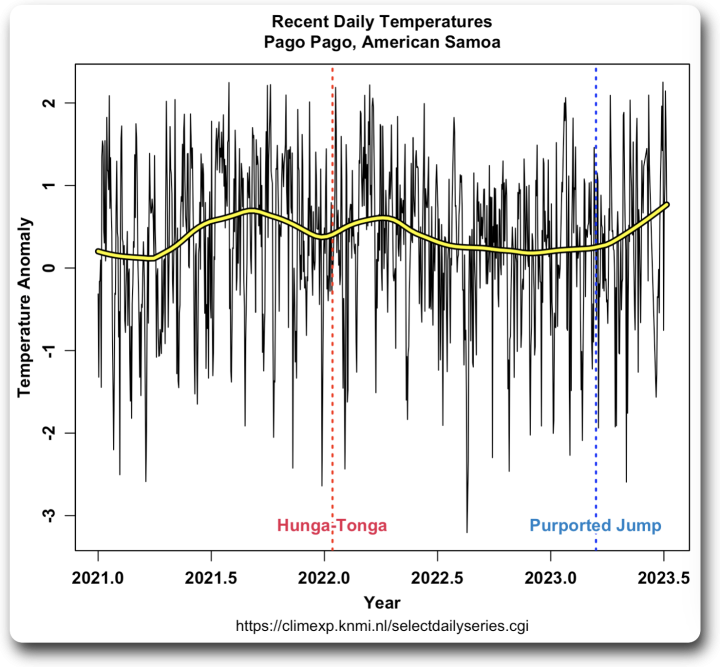
Looks like Tahiti, a whole lot of nothing going on. Next, here’s Auckland in New Zealand.
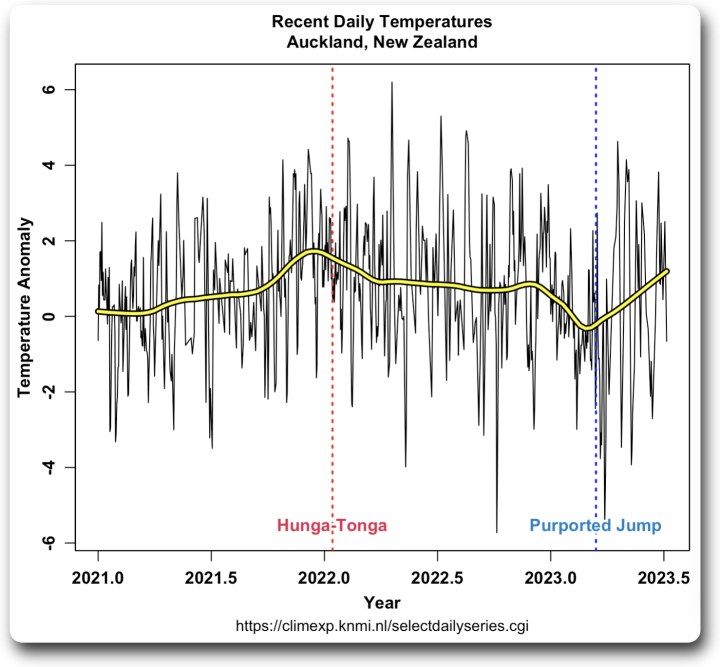
No immediate reaction to the eruption. And if Hunga-Tonga caused the warming in 2023 … did it also cause the preceding cooling starting at the end of 2022?
Moving on, here’s Honiara, my old hometown in the wonderful Solomon Islands where I lived for eight years.
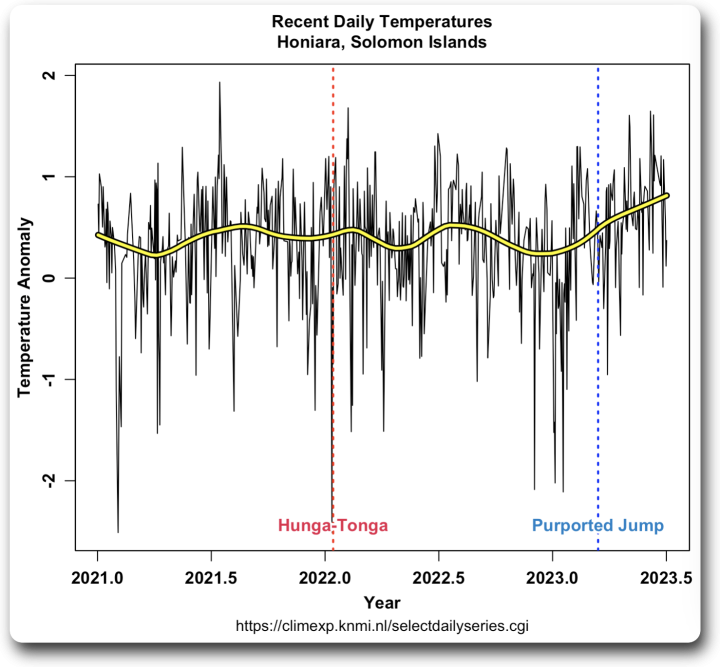
Same lotta nothing going on there, temperatures rising both before and after the mid-March “jump” … finally, here’s Lord Howe Island off of the east coast of Australia.
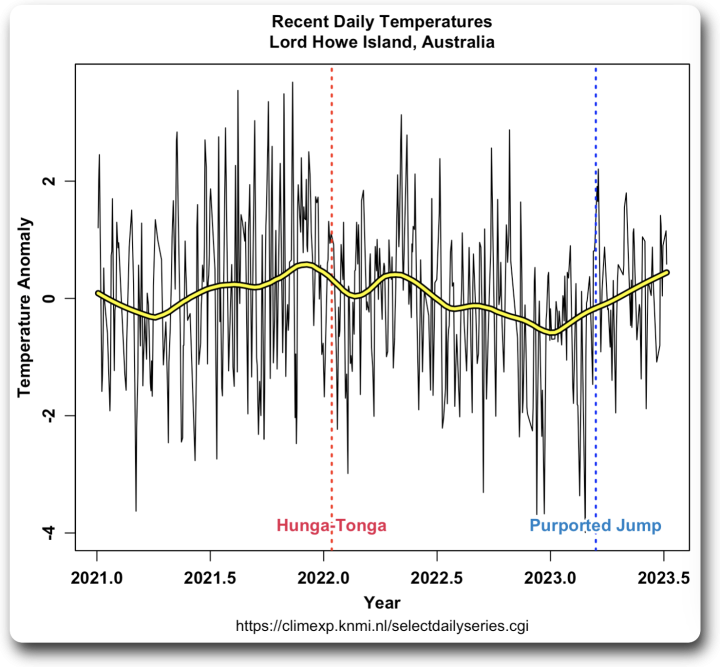
A year of cooling after Hunga-Tonga, then warming … say what?
Next, to look at a larger area, here’s the North Atlantic Oscillation over the same period.
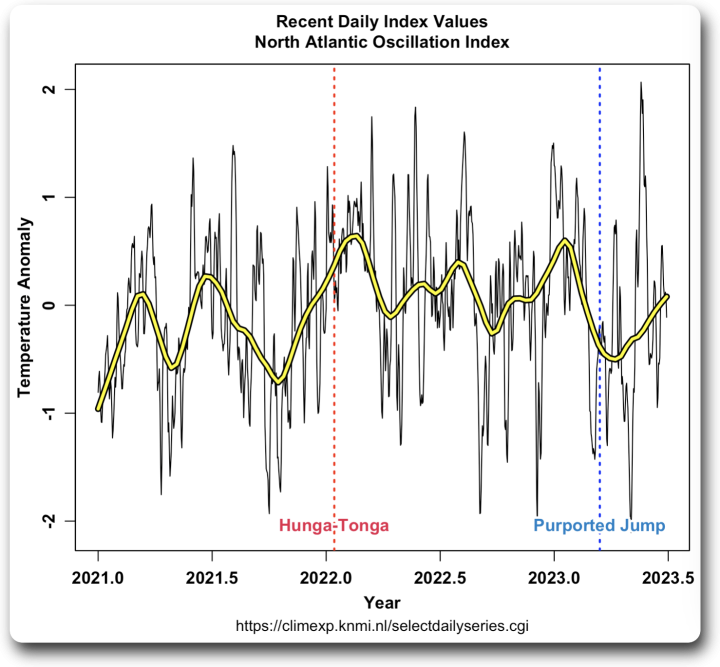
Still not seeing it. There is a rise starting around mid-March, but it’s indistinguishable from the previous rise and is much smaller than the rise pre-Hunga-Tonga.
Finally, here’s a different computer reanalysis model of the global temperature. To give a better view of the overall situation, I started the data in 2016 rather than 2022 as in Ryan Maue’s graphic above.

As with Ryan Maue’s graph, there’s warming both before and after the “jump”. However, it’s much smaller in total than the warming just before the eruption.
To close out, here are three different looks at the same post-2016 time span—ERA5, HadCRUT, and UAH MSU results.
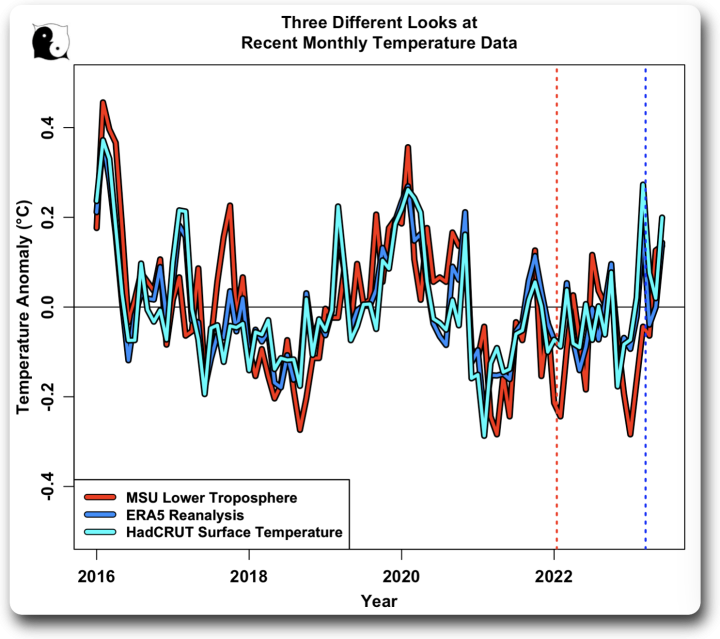
Sorry, but I’m still not seeing any effect from the Hunga-Tonga eruption, nor any big jump in temperatures in mid-March 2023.
What do I conclude from this?
My guess, and it’s nothing but a guess, is as follows:
None of the above graphs, including Ryan Maue’s, show any immediate effects from the eruption. I suggest this is because estimates of the global effect of the injected water focus almost exclusively on the warming effects of the increase in downwelling longwave radiation from increased stratospheric water vapor.
But they seem to disregard the cooling effects of the decrease in downwelling shortwave (sunshine). This is likely to be significant, since stratospheric water is going to contain a lot of ice, and ice is a good reflector of sunlight.
In addition to reflecting sunlight, a second large issue is that water vapor, ice, and water droplets all absorb sunlight, which also cools the earth by reducing downwelling shortwave at the surface.
Also, I’m just not buying that an injection of water into the stratosphere that has “circumnavigated the Earth in only one week and dispersed nearly pole-to-pole in three months” would a) have zero immediate cooling or warming effects, zero six-month effects, and zero one-year effects … but b) would still cause an upwards step-change in temperature fourteen months later. I may be missing something, but I see no feasible physical process that would cause that.
w.
PS—As folks who regularly read WUWT likely know, I’m happy to defend my own words and I’m willing to admit when they’re wrong. I cannot do the same for your interpretation of my words. So when commenting, please QUOTE THE EXACT WORDS you’re discussing. Saves lots of problems.
PPS—For those who enjoy such things, here’s my story of one of my adventures in Tonga, entitled “Old Bill Rises From The Dead“.
Antarctic sea ice set a record low last summer, and is on it’s way to setting a new one.
And there is a jump in South Atlantic Sea Surface, I think there will be some trouble untangling the rebounding from the effects of a prior eruption as well as the Australian brush fires.
Story tip: solar gamma ray record unsettles science
https://www.space.com/sun-blasts-highest-energy-radiation-ever-recorded-raising-questions-solar-physics
Ah, gamma rays. The latest excuse for the obvious warming formulates.
What are you gibbering about now Rusty? Who said anything about gamma rays relating to warming?
It’s pretty clear that FN hasn’t got the vaguest clue what he is talking about.. ever. !
This event was on October 8th or 9th, 2022.
At least that seems to be the case.
Willis,
If much of the reported warming from GHGs is appearing more as milder nights. Is there an effect from the water vapor release that enhances nighttime temperatures?
Perhaps as you hypothesized, incoming solar is reflected by ice crystals, but the latent heat from the day is reflected back to the surface overnight.
The reflection of thermal radiation emitted from a warm ocean open-water surface back to the adjacent land surface by cirrus clouds is one explanation for the fast change from surface nighttime frost to sudden thaw observed and reported in WUWT comments for coastal localities in winter (e.g. Florida).
IIRC, there was a WUWT article on the fact that SW overwhelms LW in its impacts on temperatures. But what do I know?
Could it be that there is a natural self-regulation of which we know nothing? And that the AGW hypothesis is wrong?
Is been suggested that the”nuclear winter” hypothesis was undone when observations showed that the smoke from the fires of Kuwait rained out in a couple of weeks.
“It ain’t what you don’t know that gets you into trouble. It’s what you know for sure that just ain’t so.”
Temperature rises with height in the stratosphere. Its upper levels can reach above the sea level freezing point.
And ice is also an excellent emitter of thermal radiation. This is because being a solid substance ice is able to transmit shear waves within the body of the crystal. It is surface shear wave flexure of the solid crystal that provides the coupling link between particle motion and the emission of electromagnetic waves.
Optical properties of ice and snow
Just seems that “Climate Science” requires a whole lot of SWAG followed by a deafening silence where there should be, at the very least, a carefully staged Friday afternoon “Never Mind”
SWAG at its very core appears to be the difference between Science and “The Science.” and triggers a whole lot of Media hyperventilation to scare the school kids. Amirite Greta?
It seems an interesting coincidence that in the lower stratosphere chart the el Chichon and Pinatubo eruptions occurred on an already increasing slope.
Is it (temp) inductive delay, or (eruption) capacitive breakdown?
Mmmm…’lectrix…
Those eruptions aren’t comparable to Tonga. They were land eruptions ejecting much solid material and SO2. Tonga was submarine, ejecting mostly water.
Not just ordinary water, but seawater. This blindingly obvious fact is being ignored. Sheesh.
Yes, the dissolved salts feature in the hypothesis.
One comment I read that may reflect on this is the scrubbing of SO2.
I saw a study recently from the University of Hawaii on past eruptions of Kama’ehuakanaloa, an underwater volcano that seems to have erupted at least 5 times in the last 150 years.
https://www.hawaii.edu/news/2023/08/06/kamaehuakanaloa-eruption/
Obviously not the size of Hunga Tonga but are we overstating the effects of underwater eruptions if they are more common than we thought?
Thanks to Willis for articulating a thought that had started to germinate in my mind – why the delay?
Another thought that’s struggling to take shape in my still covid-addled brain (3½ years and counting, can’t taste or smell anything either). I’m sure that I’ve read somewhere (authored by someone who knows more about radiative heat transfer than me) that increased CO2 in the stratosphere leads to more heat being radiated to space.
So stratospheric CO2 causes global cooling, but stratospheric H2O vapour causes global warming? Hmm… It sounds a bit contrived, don’t you think?
Zinc Deficiency
Yes same problem here was one of the first to have covid- tried all supplements, so far no success. Eruption- maybe the atmosphere just has more buffering capability than we think.
RIP Hunga-Tonga theory.
well the AGW crowd depends on it being true … so once again an “experiment” disproves the “theory” …
Thanks again Wills for your plausible alternative attributions of weather / climate causes & effects.
The more of these situations that get aired, the more I’m convinced that “climate science” is largely based on notions, projections and conjectures rather than precisely measured & recorded weather effects.
A large part of the murky factoids advanced about weather / climate effects is that the “measurements” being relied upon are just not fit for purpose.
Largely based on mathematics.
“Also, I’m just not buying that an injection of water into the stratosphere that has “circumnavigated the Earth in only one week and dispersed nearly pole-to-pole in three months” would a) have zero immediate cooling or warming effects, zero six-month effects, and zero one-year effects … but b) would still cause an upwards step-change in temperature fourteen months later. I may be missing something, but I see no feasible physical process that would cause that.”
agree with the rest (clouds have short lifecycles), but this falls under the old economics rule “never reason from a price change”
just too many confounding factors to say anything at this scale
Willis thanks for that fascinating analysis, ’tis a mystery indeed. This paper might be able to offer some help insight.
https://agupubs.onlinelibrary.wiley.com/doi/full/10.1029/2022GL099381
Thanks, Anthony. The study you refer to is good. However, it says:
and
Call me crazy, but when a scientific study says something COULD happen, my BS detector starts going off.
More to the point, if that’s the case, we should have seen evidence of it in the months immediately following the eruption … but there’s no evidence of that.
My best to you, and thanks for this marvelous website.
w.
“says something COULD happen”
and gives no quantification
Hhhhhmmm.
So 0 – 99.9% chance of something happening = “could” happen.
While 100% chance of something happening = “will” happen.
So does that mean that the uncertainty factor applicable to “could happen” should be reported as 0 – 99.9%?
(in which case, why bother raising the proposition at all?)
The issue is quantifying the something, not the probability (which is another issue).
Like everything you post, nick.
I think we all need to remember what journal publication peer-review is really all about.
It is not saying the paper is “correct”…
… but that the reviewers deem it ok to submit into the scientific discussion.
So yes, a lot of it will turn out to be BS.
But there is nothing inherently wrong with using the word “could” if you are just submitting an idea for discussion.
It is also why the “climate gatekeepers” have done such a great dis-service to science by blocking alternate views from publication… stifling scientific discussion.
It is why sites like WUWT are so valuable.
Hi Willis, in the study in question there is a quantitiy mentioned, as they state: “Preliminary climate model simulations (see Supporting Information S1 for details) suggest an effective radiative forcing (e.g., Forster et al., 2001; Myhre et al., 2013; Smith et al., 2020; Wang et al., 2017) at the tropopause of +0.15 Wm−2 due to the stratospheric H2O enhancement (Figure S3b in Supporting Information S1). For comparison, the radiative forcing increase due to the CO2 growth from 1996 to 2005 was about +0.26 Wm−2…”
An estimated forcing of 0.15 W/m² gives (with the TCR of 1.5K/2*CO2 and 3.8 W/m² for this temperature increase) a Delta GMST of 0.06 K. This is lost in the noise, so it makes no wonder that you could not find it in the weather related wobbles.
best Frank
Thanks, Frank, I hadn’t caught that detail. But that’s been my argument all along, that the change was so small as to be lost in the noise.
Folks forget that downwelling radiation at the surface (LW + SW) is about half a kilowatt per square meter. Thus, a forcing change of +0.15 W/m2 is a change of about three-hundredths of one measly percent (0.03%) … like I said, lost in the noise.
w.
Hi Willis, yes indeed no dissent. All calculations up to now may result in “Lost in noise”, at least on short timescales of 1…2 years.
best Frank
The estimated forcing is of course a GCM calculation. But they went about it in odd ways. First they use the community model CESM V 1.2.1, which is a 2013 version. They did just two 10 year runs, one control and one with the Hunga addition, using the Feb 2022 distribution and assuming it did not change during the 9 years. The 10 years included just one year spin up (normally decades are used). Then they attributed all the difference between the runs to Hunga.
Hi Nick, thanks for the critical assessment of the ERF-value in this paper. Do you have a different proposal? The estimated forcing is IMO the clue to estimate the actual impact on the global GMST development and the bandwith could be huge…
Well, here is a paper by Zhang et al (2023) and another by Zhu et al. Both said that while the water would have some warming effect, the normal cooling effect of aerosols would outweigh that.
And yes, just one other whopping criticism of the paper you cite. AFAICS, it perturbed water vapor only, ie kept aerosols constant in the comparison.
Thanks Nick for the additional refs. IMO in the end is the summary: dependend on the considered sources the eruption generated a forcing leading to a dGMST in a very tiny scale of a few 1/100 K+- which is lost in the noise.This is bolstered by the observations, described in the post by Willis. The rumble about this issue is more or less a tempest in a teapot. You agree?
This is a poor man’s version of asking what would happen if we doubled CO2 in the atmosphere immediately.
So what can we learn from this?
Perhaps we learn that feedbacks keep the temperature stable rather than ratcheting up the impact as happens in the GCMs.
WE, well done.
If your stratospheric ice opacity increase theory is correct, then we should see it both at TOA SWR outbound and reduced surface insolation. Checked with NASA for the before/after months 12/20 and 2/21. Nothing noticable in either.
Main SWR outbound is albedo. Troposphere overwhelms stratosphere.
Main insolation is a gain albedo, and again troposphere overwhelms stratosphere.
The delay between HunkaTonga eruption and hot Mid 2023 is perhaps best explained by plain old natural variation.
Thanks, Rud. How was it you “Checked with NASA for the before/after months 12/20 and 2/21”? A link would be much appreciated.
Best to you and yours,
w.
My bad.
Insolation: nasa.gov/solar insolation (month option)
SWR outbound: ceres.larc.nasa.gov
Thanks, Rud. nasa.gov/solar goes to 404 …
w.
duck duck go -> https://neo.gsfc.nasa.gov/view.php?datasetId=CERES_INSOL_M
Thanks,
w.
Aside from all of the graphs and analysis presented by Willis, I would just note that the presumed mechanism of a volcanic eruption sending vast plumes of water vapor into the stratosphere thus causing a major change in global temperatures simply does not jive with what is known of the water vapor content in the stratosphere vs. that of the troposphere, and the known physical chemistry of how water vapor performs in earth’s atmosphere.
First of all, with or without volcanos, 99% of all the water vapor in Earth’s atmosphere is contained within the troposphere. That makes perfect sense because the bottom of the stratosphere starts at around 33 thousand feet above mean sea level. At that altitude all water vapor freezes, liquid water cannot exist (typical temperature under standard conditions, 59 deg F at sea level, at 33 thousand ft is minus 58 deg F – even if sea level temperature were far above standard, say at 90 deg F, at 33 thousand feet the temperature would be but minus 28 deg F)
What happens is the standard lapse rate of 4.6 deg F per 1,000 ft causes rising water vapor to chill until it condenses and falls back to the surface as rain or snow. So not only is the stratosphere extremely cold, it is also extremely dry because as water vapor-laden air rises it loses most of its moisture.
Ice at 30 deg-F has a (water) vapor pressure of 0.081 psia, not zero.
Ice at minus 58 deg-F still has a (water) vapor pressure of 0.0006 psia, not zero.
I never wrote that there is zero water vapor in the stratosphere – indeed I wrote that 99% of all water vapor in the atmosphere is contained within the troposphere, below 33 thousand ft MSL.
The reason there is so little water vapor up high is exactly what I wrote, so there is no possibility that the miniscule amount of water vapor injected into the stratosphere by any volcanic eruption could have any more than an undetectable effect on atmospheric temperatures.
What DOES have an effect on atmospheric temperatures is dust and aerosols injected high into the stratosphere by volcanic eruptions … but not water vapor.
Sorry, I interpreted your use of the word “all” to mean 100%.
Willis:
Always glad to see you do these deep dives into actual data.
The problem I saw with the Hunga theory was just the smallness of the gas intrusion in the scheme of things. It was about 150 Mtons of water vapor. That made a difference in the stratosphere, which is normally very dry. But to leave the Earth, IR has to first get through the troposphere, which is a much greater barrier. We emit 38000 Mtons CO2 a year, so by mass, Hunga would be about 2 days emisions. Now you might say that water vapor in the stratosphere is more effective than CO2 in the troposphere, but you’d need a couple of orders of magnitude amplification to make a difference.
And some might say that wv is effective in different wave bands. But the IR has to get through the 1250000 Mtons of wv in the troposphere before it encounters the 200 Mtons added to the stratosphere.
The straight mass for mass comparison is not perfect, because the main warming effect of WV in the stratosphere is not from the gas phase, but from the cirrus clouds. But even that is not large.
Incidentally, here is a plot of various temperature indices, put on a common 1981-2010 base. There was an uptick in March, and some recent warming, but that is still quite a delay.
July surface results are out here. It was up from June, which was already a record warm June. And it was not only the warmest July, but 0.225C warmer than the next July (2019). The average to date is warmer than 2016 or 2020, but they had their warm spell early in the year. So looks like whole year 2023 will end up quite a bit warmer.
Yet another new warmest year in the surface data then. They’re coming thick and fast.
We are warming (slightly and gradually) out of the LIA. Also, similar localized spikes of heat have happened many times in the past. Your statement therefore, has no meaning. Sorry. 🙂
The global rate of warming, as measured by record years, is certainly accelerating. And 2023 will give it a boost
But the rate of warming as measured by global average isn’t.
You can see very clearly from UAH data, that 1987- 1997 it was basically zero trend.
Same from 2001-2014
then again since the last El Nino
There is no “accelerated” warming.. period.
It is purely a facet of agenda-manipulated, really badly tainted surface data.
Massaged raw data. Look at the individual anomoly ranges.
That is based on surface data fabrication, isn’t it.
So you KNOW it is totally unusable for what you are trying to do.
But you do it anyway.
It is based on surface thermometer measurements
“ surface thermometer measurements”
Thanks for confirming it is totally unfit for comparison of temperature over time.
And yet, we’re still talking about fractions of a degree Celsius and no impact on the Earth or humans that could remotely be considered catastrophic or even dangerous. We’re a long, long way from dangerously warm, dangerously rapid sea level rise, or dangerously high CO2 concentrations, according to what we know from paleoclimate proxy data and the proliferation of animal life in past epochs.
The last one was in 2016, thanks to El Niño, as was the previous one 1998.
“Surface data” are made up and “adjusted” unwarrantedly.
Ain’t it grand, Rusty? So much flourishing!
“”They’re coming thick and fast.””
In the surface bad data, of course they are.
Or are you still in total DENIAL of the total unsuitability of surface stations for comparison of temperatures over time?
In DENIAL of urban heating effects.
In DENIAL that jet engines are hot.
In DENIAL that brick walls get hot in summer.
In DENIAL that air-con output is very warm in summer.
In DENIAL of the loss of colder surface sites.
IN DENIAL of the warming adjustments.
All of these things you are in denial of are obvious and provable…
.. yet still you “believe” in some other fantasy that you can’t prove.
The US National Climate Reference data shows no unusual change through July 2023. See Watts’ article https://wattsupwiththat.com/2023/08/08/noaa-u-s-average-temperature-anomaly-data-through-july-2023-wheres-the-crisis/
The US National Climate Reference data thru July 2023: ?ssl=1
In the original post entitled “Record Global Temperatures Driven by Hunga-Tonga Volcanic Water Vapor – Visualized“, chart “A MLSv5 Global stratospheric water vapor mass” shows between 100 and 150 Tg H2O entering the atmosphere in January 2022. The chart unfortunately ends around July 2022 leaving me to wonder if the H2O is still in the atmosphere or perhaps formed the March 2023 atmosphere rivers that deposited much of their H2O on California. Unless I missed it the original article does not tell us where the H2O is in July 2023.
The Hunga Tonga H2O injection is still in the stratosphere. You can view the MLS Aura data at the following link. Notice that the H2O is still running 1+ ppm higher in the upper stratosphere even through July 2023. It is expected remain there for several more years before depleting out.
https://acd-ext.gsfc.nasa.gov/Data_services/met/qbo/qbo.html
Thank you for the information.
just like CO2 the myth of well mixed gasses in our atmosphere are just that … a myth … all the models depend on this myth being true .. all the models are wrong …
CO2 is pretty well mixed. It deviates by no more than a few ppm horizontally, vertically, and seasonally.
Maybe not. CO2 concs at surface are
highly variable.
https://notrickszone.com/2023/03/30/real-world-observation-increasing-co2-by-7000-ppm-has-a-0-3c-temperature-differential/
More Data.
https://meteo.lcd.lu/today_01.html
And the IR effect likely spread as convection and thermalisation dominates at near surface height.
https://m.youtube.com/watch?v=RbNNhLqhWPg
No. We’re also talking about dynamic changes in stratospheric circulation, and the stratosphere is a place where things happen very slowly when tropospheric circulation is involved.
Ask yourself why the effects of the Mt. Tambora eruption, which happened in April 1815, were felt starting in June 1816, producing the Year Without a Summer in 1816.
Javier Vinós August 7, 2023 1:40 pm
Thanks, Javier. First, what does “tropospheric circulation” have to do with it?
Second, no, it didn’t “happen very slowly”. It happened very quickly. As I quoted in the head post:
Finally, you say:
Actually, I’ve been unable to find any actual evidence to back up the claim that there was a “missing summer”. See my posts “Volcanic Disruptions“, “Missing The Missing Summer“, and “Stacked Volcanoes Falsify Models“. Read all three end to end, and if you disagree, quote what you think is wrong and demonstrate why it’s wrong.
In the meanwhile, here’s one of the graphics from one of those posts, showing stacked temperature records from six major volcanoes.
ORIGINAL CAPTION: Stacked records of the six major volcanoes. Individual records show from three years before to five years after each eruption. The anomalies are expressed as variations around the temperature of the month of the eruption. The black heavy line shows the average of the data. Black vertical lines show the standard error of the average.
On average they may (or may not) cause a tenth of a degree cooling immediately after the eruption..
In short, I find very little evidence that eruptions do much at all to the global temperature.
Regards,
w.
Submarine eruptions differ in their effects from subaerial volcanic events.
The Tonga blast sent lots of water but little SO2 and virtually no particulates into the stratosphere.
What is the difference between water and seawater? Hmmm, that’s a toughie.
Let’s face reality, various volcanic eruption have only been SURMISED to affect the weather for some time after the eruption. Pinatubo seemed to result in an SO2 cooling effect. Others may be just random temp fluctuations.
Whole classes of METEO students can’t pick the years in the temp record when volcanic eruptions occurred unless the eruptions are marked on the timeline. This implies to me that the effect is mostly of the placebo variety.
Again we run into Hunga- Tunga that doesn’t follow the supposition, so water vapor is suddenly chosen as the reason.
Take the red line and the eruption dates off this graph and think when you would guess eruptions occurred. Not so obvious.
It’s a typo. I meant stratospheric circulation.
Well, then, you haven’t done a very good job looking for the evidence.
Brohan et al. 2012:
Brohan, P., Allan, R., Freeman, E., Wheeler, D., Wilkinson, C. and Williamson, F., 2012. Constraining the temperature history of the past millennium using early instrumental observations. Climate of the Past, 8(5), pp.1551-1563.
They reconstruct observations from the English East India Company ship logs and compare them with 11 different proxy reconstructions. You can see it in the bottom panel of their figure 9:
https://cp.copernicus.org/articles/8/1551/2012/cp-8-1551-2012.pdf
Brönnimann and Krämer 2016
Brönnimann, S. and Krämer, D., 2016. Tambora and the” Year Without a Summer” of 1816. A perspective on earth and human systems science (Vol. 90). Geographica Bernensia.
This is a fantastic article on many aspects of the Tambora eruption and its climate effects. Their figure 11 shows the temperature records for Geneva, Paris and Boston.
https://boris.unibe.ch/81880/1/tambora_e_A4l.pdf
Thanks, Javier. Per your first link:
So a cooling of “perhaps” half a degree C shows there was a year without a summer?
Say what?
And while I had great hopes for the second link, there’s no information on where they got the temperatures for Geneva, Paris, and Boston.
In my post I showed that in Stockholm, Bologna, Milan, Praha-Klementium, Hohenpeissenberg, Armagh, Manchester, New Haven, and other places, there’s no sign of the Tambora eruption. Some places were hit, some were not.
Regards,
w.
The effect of the 1815 Mt. Tambora eruption on the 1816 Northern Hemisphere climate.
Black is observations, and 11 proxy reconstructions.
Which observations, from where? Also, “observations” (whatever they are) show a whacking great drop of 0.4°C … be still my beating heart.
w.
Read the provided references. They contradict what you say.
Could you possibly be more vague?
QUOTE what I said that you think is wrong, I have no idea what you mean by “what I say”. What I say where and when?
And once you QUOTE it, then cite the exact reference and page that contradicts whatever you are referring to.
I’m not going to do your homework for you, and I don’t go on a snipe hunt for any man.
w.
Hi Willis,
Thank you so much for this article. I’m sure I’m just one of many WUWT readers who were vaguely bothered by the issues you articulated so clearly here.
Regarding the “year without a summer” –
It’s interesting that none of the global datasets you looked at contains an obvious signal of the 1816 “year without a summer” after the April 1815 Tambora eruption.
The arguments that I’ve seen for Tambora as cause of the very cold summer of 1816 focus on anomalous weather in parts of Canada, Europe, etc.
A classic of this genre is:
The Year without a Summer. Henry Stommel and Elizabeth Stommel. Scientific American
Vol. 240, No. 6 (June 1979), pp. 176-187. https://www.jstor.org/stable/24965226 [paywalled, accessible with institutional login]. The authors also published a book of similar name that is available used for a few bucks.
Henry Stommel was one of the founders of physical oceanography (PO) as a discipline, and for many years a scientist in the PO department at Woods Hole Oceanographic Institution (where new grad students were advised to call him Mr Stommel, as there is no way to get a PhD in a field you haven’t invented yet).
Can Tambora have had dramatic impacts only in certain regions, without causing an obvious signal in global averages (as you found in the global records you looked at)?
I think the answer to this particular question is yes.
Selective media climate coverage of the most extreme local or regional conditions as evidence of “climate change” is just this idea in reverse – that local/regional conditions are reliable indicators of global conditions. But this is obviously wrong: Not all local and regional global conditions correlate with their global averages (!).
[The deeper problem, of course, is that the physics driving global-average climate variability (which we don’t understand all that well) and the physics driving regional-scale climate variability (which we understand even less well) are not the same thing. And in our highly nonlinear climate system, thinking about those two kinds of physics as separate, independent entities – while an unavoidable step in trying to understand the system – rests on simplifications that can’t be fully justified and whose implications can’t be fully understand.]
Where does that leave Tambora as a cause or contributor to the “year without a summer” that was observed in certain regions? Like a lot of things for which highly plausible arguments have been made – unproven, and hard to prove or disprove. But science is only rarely about “proof”. Usually scientific aspiration is limited to correcting and expanding the existing arguments.
Thanks again,
Momsahib
Momsahib, I’m looking further into the Tambora issue. As usual, nothing is simple. I’ll report results when I have them.
Best regards,
w.
PS—love your username …
That SciAm article has a photo of monument to the Year without a Summer. It’s engraved, appropriately enough, on a glacial erratic. My father and I were astounded that it was only some 10 miles from his house in Plymouth NH.
I finally hunted it down one day in May for creating a virtual Geocache. The next day morning rain changed to snow as I was cooking breakfast. Very, very freaky.
I wrote a web page that collected various NH stories about that summer, 3 or 4 people posted it to Willis’ first 1816 page, he blasted it for its lack of science (hey, I didn’t offer it, mainly because I didn’t have good temperature data, just snow and ice).
After Dad died and we prepared to sell the house, my sister saved his SciAms, about 1950s – 1990s, but we decided to toss them when she moved to California. We saved the Stommel article though!
The geocache, named Summerless, is at https://www.geocaching.com/geocache/GC7F33
Careful – there’s longterm friction between Willis and me about 1816 in New England, and maybe similar latitudes.
See https://wattsupwiththat.com/2016/06/05/summer-of-1816-in-new-hampshire-a-tale-of-two-freezes/
While that article ignores Willis’ earlier references, he made no reference to New England so it didn’t belong in the article. We did discuss it in the comments.
Only close to the winter pole, as water requires very low temperatures to form ice in the stratosphere.
Huh? That’s not true at all. We see stratospheric ice clouds (SICs) in the tropics all the time. See e.g. Figure 8 here.
ORIGINAL CAPTION: Figure 8 Seasonal occurrence frequency of stratospheric aerosols from CALIPSO during 2007–2019. Black contours are the occurrence frequencies of SICs, as shown in Fig. 1a–d.
w.
Yes Willis, but as it says in that paper those clouds are within 250m of the tropopause which is the lower atmosphere temperature minimum. The main body of the stratosphere is warmer and the H2O vapor pressure is much lower so the temperature required to freeze the H2O vapor is much lower (less than -78ºC). See for example https://en.wikipedia.org/wiki/Polar_stratospheric_cloud
Thanks, Phil. Yes, SICs mostly form in the lowest part of the stratosphere … so what? How does that change what I said?
Also from the link:
The lowest part of the stratosphere is still the stratosphere, no matter how much you want to minimize it.
Best regards,
w.
That’s semantics. Most ozone is in the mid-upper stratosphere and the destruction of ozone due to stratospheric polar clouds takes place during winter at high latitudes because that is when they form, particularly in the southern polar vortex which has lower temperatures. That is why the ozone hole is in the Southern Hemisphere.
That tropical tropopause ice is the result of the process of air freeze-drying that takes place at the tropical tropopause cold spot and is responsible for the extreme dryness of the stratosphere. Most water in the stratosphere comes from methane oxidation which takes place in the upper stratosphere, so water vapor becomes more abundant with altitude in the stratosphere.
There’s a lot you have to learn about the stratosphere before jumping to conclusions.
Not to take the urine…
https://www.forbes.com/sites/startswithabang/2016/12/23/water-in-space-does-it-freeze-or-boil/
Some videos of rapid phase changes…
A popular phase diagram
http://1.bp.blogspot.com/-evF6F_V36QM/VnlXsALcmsI/AAAAAAAAEsI/iDSYQgcfIKk/s1600/Phase_diagram_of_water.svg.png
This is a small issue. The stratosphere contains 1000 times less water than the troposphere, a 13% increase means little in terms of shortwave absorption for the surface.
If it “means little in terms of shortwave absorption for the surface”, it would also “mean little in terms of longwave absorption for the surface”.
Which is kinda my point …
w.
But the important question is what it means in terms of the top of the atmosphere energy imbalance and how that energy imbalance is distributed between the stratosphere, troposphere and surface. I don’t think anybody can answer that and even less you, who knows little about radiative physics and about stratosphere properties and dynamics.
Javier, if you had any real scientific ammunition, you wouldn’t be throwing mud at my abilities and knowledge.
w.
You are the one throwing mud at yourself with your post and comments. Reaching premature conclusions about things one doesn’t understand well does never look good. If the conclusions are opposite to the accumulated knowledge, then it looks even worse.
One week ago I commented..
“A heat wave coming 18 months after the eruption is a bit late. It should be an instant reaction and statistically there was none.”
It gave me 55 dislikes 😉
The actual story here is about something else. First of all there was significant cooling in the upper stratosphere. So yes, the WV has its effect.
Climate science however assumes that whatever way the stratosphere goes, temperature wise, the opposite would happen within the troposphere. I pointed out a while ago this assumption is baseless. The mechanism by which volcanic aerosols heat the stratosphere AND cool the troposphere is specific and has been misinterpreted. Most of all it can not simply be inverted in the case of stratospheric WV injection.
https://greenhousedefect.com/contrails/aerosols-in-climate-science
On top of that there are implications on CO2 related climate sensitivity. A good part of the CO2 forcing would be due to CO2 cooling the stratosphere. Again, this part is most certainly wrong. Rather, as far as CO2 cools the stratosphere, this will have no effect on tropospheric temperatures.
It is not inverted. The effect of changes in stratospheric water vapor on the global surface temperature is calculated using radiative models. Perhaps they are wrong or not. Hunga Tonga should help find out. Changes in the stratosphere are supposed to have a stronger effect.
In any case, a great part of the climatic effect of volcanic eruptions is not due to radiative effects but to chemical and dynamic effects. The dynamic effects are the ones responsible for the delayed effects, as the radiative effects are instantaneous and last only for as long as a great part of the aerosols remain in place.
It may have been more than 55 “-” that were offset by some “+”..
But any scientist knows that voting has nothing to do with science. So putting weight on voting as a test of validity is pointless. Your comment did not appeal to the masses in its context.
Willis has done a a lot of data analysis to arrive at a null result.
I looked at the moisture over Australia prior to the Tongan volcano eruption because the eruption was being blamed for flooding across eastern Australia. The atmospheric water over eastern Australia was already high on 10 Jan, 5 days before the eruption:
https://earth.nullschool.net/#2022/01/09/1800Z/wind/surface/level/overlay=total_precipitable_water/orthographic=-219.67,-26.28,372/loc=144.108,-23.534
The northern hemisphere daily peak solar intensity has been increasing for 500 years. It is beginning to have an observable impact particularly on maximum land temperature in the NH. Right now, the amount of atmospheric moisture over the northwestern Pacific is impressive. That will produce new snow records in coming months across northern Asia. May even set new record high January temperature for the Greenland plateau.
No, but it may have contributed. We are observing a very abnormal Antarctic sea ice this year, and this is the first winter when the stratospheric water vapor from Hunga Tonga has the opportunity to affect the Antarctic polar vortex in force. Stratospheric transport is very slow in the latitudinal and altitudinal directions. Very fast in the longitudinal direction due to the rotation of the planet. It takes several months for a parcel of air to rise 1 km in the stratosphere.
Javier Vinós August 7, 2023 1:57 pm
Javier, I’ve warned you before that you need to do your homework before making claims about something … because I’m damn sure to do my homework,
This is another example of why I’ve warned you. Here’s my homework.
w.
From the graph, it looks to me that it was recovering from the 2015/16 El Nino…
.. then got hit by the effect of the volcano.
Could it be that there a lot of energy released to the southern Pacific Ocean just before the main eruption, causing that drop in Antarctic sea ice just before the eruption,
It certain dropped quickly shortly afterwards.
Willis, What date is that red-dotted line, please?
In December 2021, an eruption began on Hunga Tonga–Hunga Haʻapai, a submarine volcano in the Tongan archipelago in the southern Pacific Ocean.[6]
The eruption reached a very large and powerful climax nearly four weeks later, on 15 January 2022.
I don’t like using Wiki, but the whole sequence seems to be described quite well here
2022 Hunga Tonga–Hunga Haʻapai eruption and tsunami – Wikipedia
There seems to have been considerable activity right through December 2021, spewing all sorts of “stuff” into the lower atmosphere.
The date of the red-dotted line is Jan 15, 2022. Before that, there was no injection of either SO2 or H2O into the stratosphere.
w.
Not as high into the stratosphere as the main eruption, and nowhere near as much.
Also, any idea what sort of effect the massive shockwave might have had on weather systems?
Keep your warnings. I do my research and my only claim in there is that this is the first Austral winter when the eruption has the opportunity to affect the Antarctic polar vortex in force. We might see that in the ozone hole that is forming right now. Last year the ozone hole was not affected.
Your plot does not say the eruption has not affected Antarctic sea ice levels, as Antarctic sea ice levels are unusually low. Your temporal demands about when the effects should take place are just your assumptions on when and how the effect should take place when you actually know very little about it. Taking unsupported assumptions is a big source of error in science.
Javier Vinós August 8, 2023 12:14 am
Antarctic sea ice has been dropping since 2015. It dropped precipitously the year before the HT eruption. Then in the year after the eruption, sea ice increased slightly.
You’re free to believe that that’s from the HT eruption. Me, not so much.
w.
I don’t believe anything, but an effect of the Hunga Tonga eruption on sea ice extent a year and a half later is a distinct possibility that science can investigate.
What that graph shows is that Antarctic sea ice has been incredibly stable since 1978 and last year it set a record low and this year, well there has never been anything observed like this.
It’s not like the 2 years prior to this event were normal.
Australia’s Black Summer bushfires linked to largest stratospheric warming in three decades (cosmosmagazine.com)
Willis,
You’re very good at analyzing CERES data. I’m curious what you’re thoughts are regarding the net TOA flux of +1.97 W/m2 over the last 12m?
Can you process the grids and show the spatial distribution the imbalance over the last 12m?
Like Nick pointed outed I’m just not seeing how Hunga Tonga could have significantly altered the Earth Energy Imbalance by more than may 0.2 W/m2 given that the UWIR must pass through 12,500,000 MtH2O before it encounters the extra 150 MtH2O that HT put up there.
Here is the modeled forcing from Hunga Tonga including its aerosols and water vapor through most of 2022. I suspect the aerosols have now mostly depleted with the purple line being close to +0.2 W/m2 here in mid 2023.
Then you should read:
Solomon, S., Rosenlof, K.H., Portmann, R.W., Daniel, J.S., Davis, S.M., Sanford, T.J. and Plattner, G.K., 2010. Contributions of stratospheric water vapor to decadal changes in the rate of global warming. Science, 327(5970), pp.1219-1223.
https://web-static-aws.seas.harvard.edu/climate/seminars/pdfs/solomon_rosenlof_2010.pdf
They claimed that a 10% decrease in H2Ov in the stratosphere slowed the rate of increase in global surface temperature over 2000–2009 by about 25%. They have been cited 1,230 times, and to my knowledge, nobody has shown them wrong.
A sudden 13% increase could do wonders with the surface temperature if they are right.
Yeah, so that 10% change in H2O resulted in 0.04 C less warming.
Javier, if you think that the number of citations means anything, consider that the hockeystick paper has been cited 2,653 times … more than twice as many as your link.
Next, here is what your cited paper says has been happening with the stratosphere water vapor.
Note that it dropped by 40% from 1998 to 2004 … please point out for us the corresponding change in surface temperatures.
Next, as bdgwx points out, the claimed reduction in warming is 0.004°C/year over the decade 2000-2009, for a total change of four-hundredths of one freakin’ degree. Be still, my beating heart.
Finally, since the water vapor bobs up and down, with a monthly average absolute change of 4.3%, it’s obvious that a 10% change will be lost in the noise.
w.
I thought you’d heard about the 1998-2014 pause in global warming. I’m not saying it was due to that, but it sure coincided.
Seriously? That’s your answer?
w.
Your demands that a change in stratospheric water vapor should have a coincident surface temperature effect or then it has no effect are yours alone. You have the same problem with the solar effect on climate.
It means the article has not been ignored by peers.
If you think an article “not being ignored by peers” means anything, you still haven’t learned the lesson of the hockeystick. Science isn’t decided by vote.
w.
What I think is irrelevant. This piece of research is widely known, and to my knowledge, it is generally accepted and not contradicted. That does not guarantee that it is correct, but what you think of it is also irrelevant.
I’m with Javier on this. The more times it is cited the more times it has been reviewed or replicated. The more times it has been reviewed or replicated the more confidence we have that it does not contain an egregious mistake or that the hypothesis within have cannot be falsified.
bdgwx, it seems that like Javier, you have failed to learn the lesson of the Hockeystick paper.
Among its problems were that it:
And despite that, it was cited 2,634 times, swallowed whole by the IPCC, and defended by a host of useful idiots … apparently including you and Javier.
Nor were Mann’s attempts to resuscitate it any better. Here’s my analysis of one of these attempts, entitled “Kill It With Fire“. Despite being told that the Tiljander series was used upside-down and was corrupted, despite being warned that the stripbark pines were totally unreliable, Mann used both of them again.
Why?
Because if you leave them out … no hockeystick …
You really need to take a hard look at the amount of garbage that’s passing peer-review these days. It’s shocking.
Best regards,
w.
I understand the stripbark pines and upside-down Tiljander sediment series were in different papers.
No, they were both used over and over again. See Steve McIntyre’s various posts on this question.
w.
Fair enough. I thought Yamal and Tiljander came into the picture after “the hockey stick paper” (MBH98)
What did you use to derive this graph Willis? It appears to be based on their Fig 1C but the anomalies there are given in ppm with a range of +/- 1.0ppmv. that implies that you took the average to be ~5ppmv, is that right?
Digitized their figure, took the average, used it to derive my figure.
w.
I’ve wondered why it took until this past May, June time frame for the effects of the Hunga volcanic eruption to show up in the temperatures. But a big temperature spike did show up, particularly above the Southern Ocean near Antartica. You can see that with the high anomaly of 1.43 in the UAH data for AUS.
You mentioned that the moisture spread across the globe pretty quickly but the highest concentrations are still in the southern hemisphere and it took almost 9 months for much higher than normal stratospheric water concentrations to travel to 60 south latitude. This paper from Nature shows the evolution of the stratospheric water vapor plume in the first 9 month or so.
Global perturbation of stratospheric water and aerosol burden by Hunga eruption | Communications Earth & Environment (nature.com) If you look at Figure 7 a), b), and c) you can see how the plume dispersed vertically and between the equator and 60 south latitude in the first 9 months.
It’s well known that arctic temperatures seem to rise much more in the colder months than the warm months due to green house gases and some have speculated that this may be due to water vapor. If the Hunga volcanic eruption had not gotten far enough south to effect long wave radiation in the oceans around Antartica until the April and June of 2023, then the 18 month delay would make sense.
Sean2828 August 7, 2023 2:12 pm
Thanks, Sean. I can’t find any such post-eruption “high anomaly” in either the Lower Troposphere or Lower Stratosphere UAH MSU “AUST” temperatures. There is a spike in the stratosphere temps, but it occurs in October 2021, three months before the eruption.
w.