By Robert Bradley Jr. — July 24, 2023
“Interestingly, none other than Michael Mann disagreed with Hansen’s climate acceleration hypothesis. Is it because Mann et al. know that doomerism is a political loser? Climate science is so political and PR-driven it is hard to know.
Recently in the Guardian, James Hansen unloaded on the complacent public for giving the world the current heat wave. How interesting, coming 35 years after he went alarmist to inspire exaggerated and falsified predictions of future temperature and sea-level-rise. And today, even alarmist scientists are pushing back on Hansen’s dire prediction of heating acceleration.
Here is another data point on the outlier Hansen. In 2006, he gave this ultimatum:
We have at most ten years—not ten years to decide upon action, but ten years to alter fundamentally the trajectory of global greenhouse emissio
This expired seven years ago, which should have shifted the public policy orientation of the author to adaptation rather than governmental/political mitigation.
Hansen’s Latest
“‘We are damned fools’: scientist who sounded climate alarm in 80s warns of worse to come,” Oliver Milman of the Guardian wrote (July 19, 2023). His article begins:
The world is shifting towards a superheated climate not seen in the past 1m years, prior to human existence, because “we are damned fools” for not acting upon warnings over the climate crisis, according to James Hansen, the US scientist who alerted the world to the greenhouse effect in the 1980s.
Hansen is quoted:
There’s a lot more in the pipeline, unless we reduce the greenhouse gas amounts. These superstorms are a taste of the storms of my grandchildren. We are headed wittingly into the new reality – we knew it was coming…. It means we are damned fools. We have to taste it to believe it.
And continuing:
“Things will get worse before they get better. This does not mean that the extreme heat at a particular place this year will recur and grow each year. Weather fluctuations move things around. But the global average temperature will go up and the climate dice will be more and more loaded, including more extreme events.
Interestingly, none other than Michael Mann disagreed with Hansen’s climate acceleration hypothesis. Is it because Mann et al. know that doomerism is a political loser? Climate science is so political and PR-driven it is hard to know.
Hansen at His Best
Hansen’s surety on the physical science of climate change is a red flag. But at least the father of the climate alarm has recognized truths in energy (density as the driver) and the unhinged climate politics. Quotations follow:
- “Suggesting that renewables will let us phase rapidly off fossil fuels in the United States, China, India, or the world as a whole is almost the equivalent of believing in the Easter Bunny and Tooth Fairy.” (here)
- “Most environmental groups lived in fairyland, never working with utility experts — who must keep the lights on — and not understanding that most nations will always give priority to their immediate development and economic well-being over the long-term global warming issue.” (here)
- “Let’s be clear: the frequent comparison of the fossil fuel and tobacco industries is nonsense. Fossil fuels are a valuable energy source that has done yeomen service for humankind.” (here)
- “Fossil fuels provided the energy that today’s developed world employed to reach its current standard of living…. [I]f fossil fuels provide the only realistic available path to development and improved living standards, that path surely will be taken.” (here)
- “[The Paris Agreement is] a fraud really, a fake. It’s just bullshit for them to say: ‘We’ll have a 2C warming target and then try to do a little better every five years.’ It’s just worthless words. There is no action, just promises. As long as fossil fuels appear to be the cheapest fuels out there, they will be continued to be burned.” (here)
- “The bad news: we approach the gas bag season – the next Conference of the Parties (COP26) is scheduled for November 1-12. Gas bag politicians … may have been honestly duped about the science and engineering, but many must be blatant hypocrites.” (here)
Hansen has also let Big Green have it in the mouth:
“Big Green consists of several ‘environmental’ organizations, including Environmental Defense Fund (EDF) and National Resources Defense Council (NRDC), each with $100+M budgets, each springing from high-minded useful beginnings, each with more high-priced lawyers than you can shake a stick at. EDF …was chief architect of the disastrous Kyoto lemon. NRDC proudly claims credit for Obama’s EPA strategy and foolishly allows it to migrate to Paris.”
– James Hansen, “Isolation of 1600 Pennsylvania Avenue: Part I,” November 27, 2015.
“exaggerated and falsified predictions of future temperature”
No, his predictions worked out very well. Here is the graph, comparing his original with GISS land/ocean:
Since future emissions are not scientifically predictable, but depend on human choices, he adopted the custom which has become universal since, if projecting subjecting to scenarios of gas concentrations. We have pretty much followed the middle scenario B.
Allo Nick. Still stoking, I see….
Just showing the truth with evidence.
GISS is not evidence of anything except urban/airport warming and data fabrication.
I am certain you know that, but are choosing to still use it because of some twisted anti-human agenda.
So what data allowed the OP to claim that his predictions were exaggerated?
UAH?
UAH isn’t surface data.
This is not correct as it does measure surface data.
https://www.uah.edu/essc/weather-products/global-temperature-report
“The satellite-based instruments measure the temperature of the atmosphere from the surface up to an altitude of about eight kilometers above sea level.”
Therefore UAH is not just surface data only, there is a difference.
Satellites can measure the surface data of oceans and land much better than what the GISS could ever do.
It is how these below are available.
https://www.ospo.noaa.gov/Products/ocean/sst/contour/index.html
Also GISS is not only surface data either as it has many areas missing with a lot of infilling going on.
All of the area averaged surface temperatures are junk statistics. See my
https://www.cfact.org/2017/05/18/fake-temperatures/
UAH shows no such rapid warming.
UAH is an area averaged temperature, although not of the surface.
The difference between the actual surface and a couple of metres up can be a matter of several degrees. I notice that the actual surface reading made it into the narrative recently. How can you be sure that it did not entre the official record in the past? Why do you continue to hang onto crappy surface data when you have a better good alternative?
“The difference between the actual surface and a couple of metres up can be a matter of several degrees”
Doesn’t sound like a recommendation for using data from 5 km above!
“I notice that the actual surface reading made it into the narrative recently.”
It shouldn’t have. But the data GISS and others use is actual thermometer data, as gathered by GHCN.
How do I know? I do it too. And get the same results.
Of course you get the same results… that is what you want to get.
You do realise the data itself is totally corrupted by urban warming and aircraft etc etc over time, don’t you.
And no, GHCN also does “pre-adjustments”.
But you KNEW that didn’t you. !
More deliberate lies !
….
And please stop citing Mo-Who.
It is run by a dishonest AGW zealot and shill.
Doesn’t sound like a recommendation for using data from 5 km above!
Just the opposite. The higher up the less adulterated the reading.
Any adjustments made are for the whole globe simultaneously. Much more reliable than juggling a thousand different readings from a thousand different localized weather stations by thousand different people with a thousand different agendas.
+100
That doesn’t mean that converting the radiance values into temps is accurate. The anomalies calculated could be off by even one or two orders of magnitude. Even the sign of any change could be wrong because of measurement uncertainties. (at least on a “global” basis).
Each and every land temp measuring station has a different microclimate and therefore a different variance in the data set each produces. Yet you and the CAGW try to jam all this data together with no regard to what that does to the variance of the combined data.
In fact, it makes it totally useless. The final variance will be so high that the uncertainty of the average will swamp any attempt to discern a difference in the average.
The data simply isn’t fit for purpose. It’s like trying to find an “average height for a horse” by jamming the heights of Shetland ponies with the heights of Arabian horses and averaging the combined data set!
Agree; but the average height of a horse at least makes “arithmetic” sense (although I don’t know what purpose it would serve).
However I was taught in grammar school that the average of temperatures has no meaning.
If I’m interested in actual “heat” of two objects what is the meaning of averaging the temperature of the tip of the flame of a lit match with the temperature of a swimming pool?
If you say “but those are two different things”, then you have a hint of why averaging heat intensity on the surface of a desert and heat intensity above an ocean is silly.
You are talking about “enthalpy”. It’s what makes 100F different in Las Vegas than it is in Miami. Climate is *enthalpy* driven, not temperature driven. Temperature is a poor, VERY POOR proxy for enthalpy.
Ah yes, the joy of prestidigitation..
GISS is far from being “global” surface numbers.
It is from sites with massive urban and other warming, then mal-adjusted to whatever the fabricators want to show.
The chance of being even remotely representative of “global” temperature trends is basically zero.
“UAH isn’t surface data.
Neither is GISS.
Its heavily corrupted urban and airport pseudo-data.
It is totally meaningless if you want to know the actual warming of the planet.
UAH trend matches the only pristine surface data.
Again..,Rusty has nothing but empty anti-science.
”UAH trend matches the only pristine surface data.”
Here is an example of pristine (at least up until recently) surface data. Notice how 1958 and 2001reading are much more in line with the radiosonde I posted above? Then compare it to Nick’s GISS. It’s a con. No doubt.
”UAH isn’t surface data.”
Exactly. It is the best representation of the planets true temperature status over the years.
TFN,
In a sense, neither is GISS.
Land temperatures are measured in a screen a metre or more above the air/land surface.
There are no screens a similar height above the air/sea interface.
Can you justify combining land and sea temperatures into an aggregate named global?
I think not.
Geoff S
This is just the beginning. Each land measuring station has a different microclimate – meaning their data also has a different variance. Jamming all this data together with no regard to the variances of the individual data sets is just piss poor statistics. And since anomalies inherit the variances of the components the anomalies can’t be considered to have no variance either.
It’s why you don’t jam the heights of Shetland ponies together with the heights of Arabian horses to find an “average height for horses”. All you wind up with is a multi-nodal distribution where the average is meaningless as a statistical descriptor.
And yet we have an entire branch of science – climate science – that refuses to acknowledge that simple fact.
Mr. Stokes: Another lame try. The quote you used is partial, but it’s also a link. Did you notice that? We can see that you didn’t, because the link says Hanson predicted 3-9 deg. F. rise, but your chart only shows a 1 deg. celsius rise. In other words, you aren’t addressing the prediction in the link, you are inventing a prediction like a straw man. The link didn’t include your chart BUT YOUR CHART ALSO FALSIFIES THE PREDICTION THAT YOU IGNORED BY NOT LOOKING AT THE LINK. Sorry for the yelling, but your chart shows it did not heat up as Hansen predicted, yet you run this comment string as if the author’s point is not made.
Your posts are becoming much less challenging to challenge.
“We can see that you didn’t, because the link says Hanson predicted 3-9 deg. F. rise, but your chart only shows a 1 deg. celsius rise. In other words, you aren’t addressing the prediction in the link”
As always, just not reading that prediction, which was
“If the current pace of the buildup of these gases continues, the effect is likely to be a warming of 3 to 9 degrees Fahrenheit from the year 2025 to 2050″
It’s a bit hard to interpret (it actually comes via a journalist), but it’s clearly nothing that could be falsified in 2023, and no interpretation requires a rise of 9°F (or even 3) before 2050.
I showed his actual, quantitative prediction, the original published graph, which was for 1°C by 2019. And that is what we got.
Why do you keep KNOWINGLY LYING, Nick?
What is in it for you , in supporting the destruction of western civilisation?
What is in it for you in supporting the destruction of modern electricity supplies?
Just how much do you really HATE being human, and how much do you HATE plant life?
Too shrill
“Too shrill”
Too SHILL !
I understand his prediction as a rise from the prediction date of 3deg f by 2025, up til 9 deg f by 2050. Below, you ask for data. How about we use your chart, showing only 1 deg. c since the prediction date with only 17 mos to go. Your data.
So you did change from the prediction in the article?
Again the prediction was
“If the current pace of the buildup of these gases continues, the effect is likely to be a warming of 3 to 9 degrees Fahrenheit from the year 2025 to 2050″
He’s clearly referring to scenario A, which was not what happened. That had a rise of 2.7°F by 2019. But the pace of buildup did not continue, most notably in the banning of CFCs just a few years later (envisaged in Scen C, but not in A or B). Scenario B had a rise of about 1°C, and that is what happened. I have added manually 2018-2020 to the graph in a darker brown.
Again, I read it as a prediction from the date he made it. You evidently read it as a prediction of something that won’t begin to happen until 2025, an absurdity. If my read is correct, his prediction is wrong. If it’s as you read it, it is (as you say) unfalsifiable. If you read it wrong, you can apologize to the author here.
“You evidently read it as a prediction of something that won’t begin to happen until 2025″
No. The journalist makes it sound like that. But I, like you, think it means that it will rise 3°F from 1988 to 2025 and a further 6°F from 2025 to 2050 – if scenario A is what turns out to be followed. The first rise is what is shown on the graph.
Real temperatures are closer to Hansen’s “zero added CO2” model.
No warming by all that extra CO2, Nick !
Mr. Stokes: So we agree that the prediction cited was wrong. Did the cited prediction reference your graph? Or are you infilling quotes now? Completely understandable, you use an infilled GISS product to try to show a spike in temps, temporary but conveniently timed. Even as adjusted, your data show A is (another) wrong Hansen prediction- CO2 went up as he predicted, but temps didn’t follow. Can’t believe you use this to try to buttress Hansen’s predictive misses.
Nick, Always with the REALLY BAD fabricated numbers..
Without it, you have NOTHING !
You are well aware that the data is corrupted and manipulated to try too match the models.
Using them to compare to the models is rank propaganda.
This is nothing resembling science. !
There you go yet again with your sleight of hand, trying to confuse the real issue, which is typical of lying charlatans.
The truth is that the Earth is warming. Everybody knows it. Has been since the end of the last glaciation period about 16 thousand years ago … albeit in fits and starts, not linearly. Big whooping deal that Hansen talks about the chimera of a “global temperature” (as if there is such a thing, or that it is accurately measurable) as if the result proves the cause.
The deal is what is the cause of the warming? If the cause is natural, not CO2 as Hansen claims, then his graphs are worthless, as is the warmunist cause.
The cause of warming most certainly IS natural, since what we are experiencing now is no different than at any other time in human or geological history. Nobody was burning coal, natural gas, or oil or driving SUVs 5 thousand years ago when it was warmer than it is today Or 100 thousand years ago just before the last glaciation began.
The claim here was that Hansen’s predictions were wrong. And they weren’t.
Of course his predictions are wrong. Predictions *INCLUDE* the reasons for the prediction as well as the result. Otherwise the prediction is merely gambling, no different than betting on s roll of the dice.
“The greatest sin in science is to be right for the wrong reason.”
— Spencer
However, that doesn’t mean that I think Hansen was actually right.
His prediction was that CO2 increases would push us into utter extinction years ago, which has not happened. Therefore his predictions were and remain wrong.
“Utter extinction”? Link please? Or just the normal hyperbolic?
“Hansen and coauthors proposed that the global mean temperature was a good tool to diagnose dangerous anthropogenic interference with the climate system. Two elements were identified as particularly important when discussing dangerous anthropogenic interference: sea level rise and the extinction of species. “
“Hansen described the situation with species extinction similarly to that of sea level rise.”
https://en.wikipedia.org/wiki/James_Hansen
My favourite?
“The trains carrying coal to power plants are death trains. Coal-fired power plants are factories of death.” —Dr. James Hansen, The Observer, Feb. 15, 2009
Totally UNhinged.
“Totally UNhinged.”
Yes.
Mr. bob: Why don’t you try the link in the article to see the prediction under discussion? That would put you one step ahead of Mr. Stokes, who didn’t bother.
Hansen predicted that some highway in NYC would be underwater prior to now. For that to happen the temperature needed to rise more than it has to melt glaciers or cause expansion. The highway is not underwater so that means two of his predictions didn’t happen.
No he didn’t the 40 years in the future and the doubling of CO2 which it was predicated on haven’t been reached yet. However the highway in NYC doesn’t exist any more.
So you admit he was wrong on two things. The amount of CO2 and the highway be flooded.
No, actually the interviewer asked the following question: “When I interviewed James Hansen I asked him to speculate on what the view outside his office window could look like in 40 years with doubled CO2.”
So it wasn’t a prediction by Hansen.
Also the West Side Highway was rebuilt by 2001 but that one has been flooded:
images
He was 100% wrong about every single word he said.
Mr. M: Including “is” and “the”. H/t Dorothy Parker.
Hansen said the year 1934, was 0.5C warmer than 1998, in the United States.
“And they weren’t.”
Right. They were physically meaningless.
The predictions in the link were wrong, I don’t know what other predictions you are talking about. Demonstrated above.
You haven’t even read the predictions, conveyed via a journalist. I’ll say them again
“If the current pace of the buildup of these gases continues, the effect is likely to be a warming of 3 to 9 degrees Fahrenheit from the year 2025 to 2050″
So what data do you have that says they are wrong?
So here, you blame the journalist for citing one of many, many alarming, wrong predictions from Hansen, while you switch to his “official” prediction and claim he’s darn close. As noted above, we can use your data to show the prediction cited by the “journalist” (I’m trying to express the sneer you have when you say it) was wrong. Not the prediction you pick, the one cited.
The journalist wasn’t wrong but made it very unclear – can you explain exactly what he’s saying. But it can be worked out. “If the current pace of the buildup of these gases continues” means if scenario A were to be followed. 3°F by 2025 – the graph shows 2.7°F by 2019, on scenario A. And 9°F by 2050? That is moot, because we aren’t following scenario A, and are very unlikely to return to it.
Yes, they WERE WRONG
They require massively tainted and mal-adjusted never-was-data to even come close.
You KNOW that…
… so your comments can only be a DELIBERATE LIE !
Why do you do that… constantly ?
”The claim here was that Hansen’s predictions were wrong. And they weren’t.”
They were, they are and they will continue to be.
Real temperatures appear to be following Scenario C
Now, as atmospheric CO2 continues to be enhanced..
Hansen’s crystal balls “projections” show that CO2 has little or no warming effect.
This aligns with the fact that there is no scientific evidence supporting CO2 warming.
“Just….”
Prodding.
Except that it’s 2023 and your “proof” ends at 2016/2017 El Nino, thus ignoring a roughly .5 C drop since then, while Hansen’s numbers just keep on climbing.
The prediction ended in 2019. They can’t keep on climbing.
Again, the prediction relies solely on the fabricated urban da/airport mal-adjusted never-was-data surface non-measurements.
Again.. you are well aware of that fact , and that GISS et al bear no resemblance to actual real surface temperatures.
So you are deliberately LYING.
Why continue the scam, Nick
What is in it for you ?
The one you used ended in 2019 (a), but there is a 5 year running mean (b) that ends much later depending on the scenarios.
Scenario A = 2060 (4.2c)
Scenario B = ~2027 (~1.3c)
Scenario C = ~2037 (~0.8c)
At 2016 the GISS on your chart showed 1.0c.
I have showed the GISS when extending it to 2019 in the same circumstances is ~0.6c and varies between 0.35c and 0.8c.
I have added to the plot manually the years 2018-2020 in a darker brown. There is no running mean in the GISS, nor, AFAIK, in the predictions.
I appreciate you updating the plot with the darker brown line, but how does it match the 2016 El Nino?
That is impossible on any data set I look at.
https://www.woodfortrees.org/plot/wti/from:2016/to:2019
https://www.woodfortrees.org/plot/gistemp/from:2016/to:2019/plot/hadcrut4gl/from:2016/to:2019/plot/rss/from:2016/to:2019/plot/uah6/from:2016/to:2019
Matt,
Here are the numbers, direct from GISS
GISS is fabricated from tainted and every changing urban sites, and an increasing number of airport sites, mixed with made-up data for oceans and many other parts of the land surface.
The chances of it being even remotely representative of trends in real “global” temperatures is ZERO at best.
A global average doesn’t exist. Consider, winter temps have a different variance from summer temps. Anomalies created from these baseline temps inherit the variance of the baseline temps.
When you combine NH temps with SH temps you are combining data sets, be they absolute temps or anomalies, with different variances. Not only that but the absolute temps don’t even line up – combining them are like combining the heights of Shetland ponies with the heights of Arabian horses to get an “average horse height”. The combined data becomes a bi-modal distribution whose average doesn’t actually describe either set of data let alone the variances of each mode. Using anomalies doesn’t help anything because the variances are still different.
Then when you include sea temps with the land temps you only compound the problem with variances. I am just amazed that no one, ABSOLUTELY NO ONE, has ever taken climate science to task over the misuse of statistical descriptors in this manner.
And this doesn’t even *begin* to address the issue of measurement uncertainty and its propagation.
Climate science seems to have two basic rules:
That’s the only way a “global average temperature” could be meaningful. And both are also a physical impossibility!
I have already used the GISS numbers and the ones you originally used on the chart are much different to the adjustments that have ocurred since.
Therefore you have added adjusted data to a set that ocurred about 7 years ago.
This is wrong because the data during 2016 back in the year 2016 was lower. I had to make an offset of -0.36 to make the future data compatible.
This is what you should be showing on your chart that confirms scenario C.
https://www.woodfortrees.org/plot/gistemp/from:2016/to:2019/plot/gistemp/from:2016/to:2019/trend
This is just one example why the GISS is garbage as none of the older data is compatable as it changes significantly all the time.
With it being obvious the rise during 2016 on your original chart was 1.0c and therefore a off set of -0.36 is needed to match it, showing the temperature change since.
https://www.woodfortrees.org/plot/gistemp/from:2016/to:2019/offset:-0.36/plot/gistemp/from:2016/to:2019/offset:-0.36/trend
This is the correct version of what your chart should look like because you are showing the change after not using some significantly adjusted data that is garbage.
This fits in nicely with scenario C and Hansen’s predictions have been wrong.
“Therefore you have added adjusted data to a set that ocurred about 7 years ago.”
There is very little difference between the data now and that of 7 years ago.
Your chart proves that this is not the case and I have provided examples in my previous post that I have to offset it by -0.36 to match your chart.
But Hansen’s predictions were made based on a 1980s CliSciFi model that used CO2 GHG-enhanced-warming-theory to drive temperature predictions. Since CO2 continued to rise after the end of his 2019 prediction period and temperatures didn’t the method he used is falsified. Additionally, there are no tropospheric hot spots.
You are ignoring decades of evidence, cumulating with the CMIP6 fiasco, that UN IPCC CliSciFi models run way too hot. It does not matter what a crude early model “predicted,” they have all been conclusively proven to be exceedingly inaccurate. The magnitude of their inaccuracies is shown to be directly proportional to their resultant ECSs.
This whole discussion Thread about the validity of a 1980s prediction has been a waste of my time. Everybody is being distracted by a sideshow stoked by Nick Stokes. “Look! Squirrel!”
‘Truth,’ like beauty, is often in the eye of the beholder.
Nick,
How about showing measured temperatures, not anomaly style?
How about doing the hard science effort of adding uncertainty envelopes?
Then see what the cartoon graph looks like?
Geoff S
A claim was made that Hansen’s prediction was falsified. How about asking the originator what data that claim was based on (with uncertainty envelopes?)?
Hansen’s “C” scenario is about right for real global temperature trends.
This effectively shows that enhanced atmospheric CO2 has little to no warming effect.
Actually it’s nearer B, of which Hansen said: “Scenario B is perhaps the most plausible of the three cases”. What it shows is that the effect of the decline in the other trace gases partially cancelled out the effect of the growth in CO2.
Ya notice that stokes crammed the alleged temperature increase since 1850 all into the record since the cold years of 1960?
Fakery in every sentence, graph and nuance.
Still using FAKED surface data, I see Nick !
Why continue to perpetuate what you KNOW is a lie?
So what is the basis for saying that Hansen’s surface temperature predictions are exaggerated if you say there is no surface data to check them against?
C’mon, Stokes, that’s low, even for you!
Equivalent argument:
Unicorns’ preference for chocolates is modulated by phases of the moon.
…and don’t tell me I’m talking nonsense, just because you have no trust in the data on unicorn nutrition!
It’s a real question. Robert Bradley made the claim, and he wasn’t talking about unicorns. So what data could he have based it on?
You’re losing your touch, Nick. Got rooky trolls on them keyboards? I specifically commented on YOUR use of questionable data to “prove” your patently fictitious point, and that got caught out by benice2k, then you pretended his belief system is dependent upon yours.
It’s a generic problem here. Hansen predicted global surface anomalies for 30 years. People here say he got it wrong. How do they know? They reject all surface measurements that could compare. So its just a knee jerk.
Yeees, we reject your surface temperatures, because they are fraudulent, on the whole, and you keep changing parameters in a manner that suspiciously support your narrative, thus making them unsuitable for useful comparison, even as a knee jerk.
Therefor your doomsaying remains in the realm of needy jerks gathered around their electric fire for a team …
ACORN!
You mean like this?
 ?resize=720%2C443&ssl=1
That is not global surface temperature.
But it trend matches UAH and balloon data
There is no “global surface data”
Just a bunch of agenda driven fabrications for surface suites that are totally unfit for measuring temperature over time.
Even you must know that those fabrications could NEVER be considered “data” and do not remotely represent the global surface as a whole.
So why the deliberate lies, Nick ?
And when did he warn that it would get less hot during summer days?
Was that before or after the East Side Highway in Manhattan was going to be under 6 feet of water?
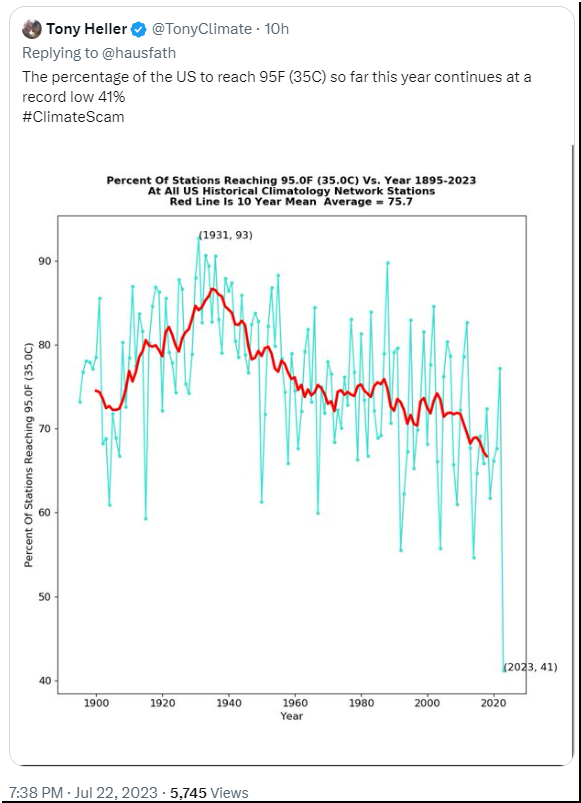
Typical Heller brilliance. He puts the average of winter/spring 2023 on a plot with full data for other years. Plus, of course, using his bastard version of USHCN, which was discontinued 10 years ago.
You do know there has been no warming in the US since 2005, don’t you, Nick the Liar ?
Tony Heller uses real data.. so of course it won’t be anything like GISS or other agenda driven mal-adjusted fabrications.
Tony Heller uses USHCN stations, against which WUWT has been campaigning for years.
But the actual RAW data,,. not the mal-adjusted fabrications.
Sorry that you are so clueless that you don’t understand the difference.
The final USHCN fabrication doesn’t resemble the original data even remotely.
And again… I suspect you are well aware of that.
I use raw data in my global averages. It makes very little difference.
No difference from Tony Heller.
Oh Ok !
And no I don’t follow links to propaganda zealot sites.
The UAH data trend matches the only pristine surface data.
It is validated against REALITY.
You KNOW that GISS is deliberately mal-adjusted urban/airport data..
and that it is a LIE that does not remotely resemble reality.
And we KNOW that you are well aware of that fact.
So we KNOW that you know that are deliberately LYING
And you know that we know you are deliberately LYING
Desperate times for you, Nick !
“future emissions are not scientifically predictable”
and neither are future climate changes even if you knew the future carbon emissions
Exactly! And Nick’s graph has no predictive value.
None is needed. It evaluates a past prediction against data we have now.
You have not shown current data.
You have shown a massively tampered urban/aircraft fabrication
You know that.
So why continue to LIE. !
Shriller and shriller.
Shiller and shiller.
You were caught in a LIE yesterday.
Caught in another LIE today.
You know you are deliberately using fake never-was-data…
… yet shill you persist.
This has followed scenario C so is not correct at all.
The strong El Nino peak at the end doesn’t represent the future mean ahead, as shown below.
There is on average about 0.5c drop using GISS putting it back in the scenario C zone.
https://www.woodfortrees.org/plot/gistemp/from:2016
The graph I showed goes up to the end of Hansen’s prediction. You are now trying to predict his prediction.
In fact the GHG results came out a bit below Scenario B.
Nick, “You are now trying to predict his prediction.” Actually that’s how you verify the veracity of a prediction. Does it stand up outside its time frame.
Amusingly, Hansen’s temperature predictions were tracking the lowerst scenario until the super el Nino hit. But, we don’t admit that do we Nick?
Again, do we just count the warm phase of ENSO and not the cold phase?
The clueless FN makes yet another nonsense comment !
TFN, I assume you DO NOT know that surface temps went down for the past 8 years? https://www.woodfortrees.org/plot/gistemp/from:1960/plot/gistemp/from:1960/trend/plot/gistemp/from:2015/trend While CO2 was rising, and we were mostly in the ENSO cold phase..
Or this period: https://www.woodfortrees.org/plot/hadcrut4gl/plot/hadcrut4gl/from:1850/to:1920/trend/plot/gistemp/from:2015/trend While the world as recovering from the LIA, with rising CO2, and ENSO still continued.
It is only the deluded that believe that CO2 or even GHGs drive ?climate change? which actually means global warming.
If it doesn’t, then it is probably just curve fitting.
So they GISS fabrication needs more “adjustment” if it is to match properly…
is that what you are saying !
But Hansen’s forecast period started in 1988, not 2016!
Nick, that link you have shown was based in 2018 after the strong El Nino had not long ended.
You are taking an Strong El Nino right at the end of the chart to misjudge the outcome.
Scenario C it is.
FinalNail,
2016 is in Hansen’s predicted range and scenario C follows the line once the global temperature has gone back towards normal.
No, it was a 30-year forecast, 1988-2018. You can even see it on the chart Nick posted.
If you don’t believe that, then here’s the original paper with the same chart.
I have seen these papers years ago and you are failing to see what happens to the global temperatures after the strong El Nino. That is still within the timeframe up to the 2019 line shown by Nick and the linked paper you have attached.
The temperatures drop over 0.5c putting them back in scenario C.
https://www.woodfortrees.org/plot/gistemp/from:2016/to:2019/plot/gistemp/from:2016/to:2019/trend
If you take off that amount of global temperature you can easily see that the line drops around to the 0.6c and 0.5c lines. These cover the points where scenario C is placed.
To match the GISS that Nick attached, an offset of -0.36 is required so it starts at the same point.
https://www.woodfortrees.org/plot/gistemp/from:2016/to:2019/offset:-0.36/plot/gistemp/from:2016/to:2019/offset:-0.36/trend
The graph above shows global temeprature around the 0.5c and 0.6c mark up to 2019, which corresponds with the temperatures for scenario C.
Scenario C is zero added CO2 to the atmosphere whereas CO2 levels have been at least scenario B maybe even scenario A.
Real temperatures from pristine surface data, matching UAH, balloons, follow scenario C or below.
Hansen has shown that enhanced CO2 makes absolutely no difference to atmospheric warming.
There is no actual reliable surface data available to compare.
“The graph above shows global temperature around the 0.5c and 0.6c mark up to 2019, which corresponds with the temperatures for scenario C.
Scenario C is zero added CO2 to the atmosphere whereas CO2 levels have been at least scenario B maybe even scenario A.”
So CO2 continues to rise, but the temperatures are following Hansen’s “zero CO2 added” scenario. It appears that Hansen’s prediction is showing CO2 is a minor player, at best, in determining the temperature of the Earth.
Just like we thought all along.
That’s not a correct description of the scenarios:
“These experiments begin in 1958 and include measured or estimated changes in atmospheric CO2, CH4, H2O, chlorofluorocarbons (CFCs) and stratospheric aerosols for the period from 1958 to the present. Scenario A assumes continued exponential trace gas growth, scenario B assumes a reduced linear linear growth of trace gases, and scenario C assumes a rapid curtailment of trace gas emissions such that the net climate forcing ceases to increase after the year 2000.”
Unfortunately, the GHE of CH4 and CFCs don’t seem to have been quantified in an easily found location in either Hansen’s earlier scenarios or the IPCC reports, so it’s difficult to establish the relative impacts of CH4 and CFC11 falling below their scenario trends.
They’re quite clearly shown in the 88 paper.
From Fig 2 by now on CO2 only the scenario A would be +0.5ºC
CO2 + trace gases would be +1.25ºC
A detailed breakdown is given in Appendix B.
Okay, thanks.
Hansen 88 is available on the NASA web site, but it doesn’t include the appendices.
Scenarios B & C explicitly exclude trace gases.
The copy I have of it on my computer has the appendices: pp9359.
Scenarios B & C include trace gases as clearly stated in the paper p9345.
So it does. Thanks.
You’re right, but it’s not especially clesar. The minor trace gases on the following page threw me.
That’s because the goal of the paper was to explore the range of possibilities. So A was designed to follow the extreme growth of the GHGs and included some more speculative trace gases, those were the ones that weren’t included in B & C. C was designed to be an unlikely future trajectory of the GHGs and therefore be the least likely low end of the possibilities. As Hansen said B was the most likely scenario.
In fact methane, NO2, and CFCs tended towards the trajectories outlined in C.
It was N2O rather than NO2, wasn’t it?
I’ve just been going through Appendix B – thanks again for pointing out its location in the paper.
It seems a bit strange that various organisations are jumping on CH4 and N2O when they are more along their Scenario C trajectories.
That appears to be more good luck than good management where CO2 is concerned, with various sinks reducing the atmospheric retention rate.
Yes typo re N2O. Well the net effect of all the gases is what determines the resultant scenario, some good management (Montreal).
Totally agree about the CFCs, even if they were phased out for other reasons.
The statement about good luck was just for the CO2, whether that was from increased photosynthesis or something else.
Real Current temps follow scenario C
Hansen has effectively shown that CO2 does absolutely nothing !
If the GISS data were not cut off, they would end up between B and C. The same with the UAH temperature record. The difference is just, that GISS would be a bit closer to B (with about 0.9K) and UAH closer to C (0.7-0.8K). But actual CO2 emissions grew faster than even scenario A!
I guess a simple “wrong” will do..
Thank you for so succinctly encapsulating several layers of bull into one minty little suppository.
Bend over, Nick, I got a surpriiise for youuu!
GISS might be a bit closer to B, but around 0.6K not 0.9K (0.6K is very close to C)
GISS has an offset of -0.36 to match 1.0K change for the peak El Nino around 2016.
UAH6 has an offset of 0.3 to match GISS for the peak El Nino around 2016.
https://www.woodfortrees.org/plot/gistemp/from:2016/offset:-0.36/plot/uah6/from:2016/offset:0.3/plot/gistemp/from:2016/offset:-0.36/trend
In any definitive analysis of this type, you must use measured temperatures, not anomaly temperatures. For just one small reason, subtraction of a 30 year climatology takes data outside the realm of a data set less than 30 years long. Geoff S
GISS is not “data”.
Data consists of information that is recorded as-is, not information which has been fraudulently altered.
NASA/NOAA US Data Tampering | Real Climate Science
Your graph has nothing to do with GISS, or global temperature.
The claim is that Hansen’s predictions of global surface temperature anomaly were wrong. What data do you think can sustain that claim?
But it IS to do with the exact same data tampering as in GISS.
You KNOW GISS is fake… and not remotely real…
but it is all you have…
You are DELIBERATELY using data that you KNOW is deliberately adjusted.
Shriller and shriller.
“Shriller and shriller.”
From a no-science lying shill.. that’s funny
Why the continued use of never-was-data, that you KNOW is fake, Nick ?
Nick, do you know of any surface data that isn’t from urban airport sites, then massively tampered to introduce even more warming?
GISS does NOT measure “global” temperatures.. period !
That chart is a good example of how the temperature record has been bastardized. The temperature data mannipulators changed a cooling trend into a warming trend to promote their human-caused global warming/climate change narrative.
And the data manniplators have perpetrated this fraud on charts from all over the world. They have been busy liltle beavers, but the fly in their ointment is they are finding it impossible to get rid of the original written records which demonstrate they are lying about the past temperatures.
Without these lies and data mannipulation, the climate alarmists would have *nothing* to show for their efforts.
Actually, Nick, Hansen’s predictions shown in the article do not relate to his now infamous graph, but if we consider reality we see this: https://www.woodfortrees.org/plot/gistemp/from:1960/plot/gistemp/from:1960/trend/plot/gistemp/from:2015/trend
Does anyone remember what occurred in 20215-16, and what has occurred since?
Nick certainly won’t.
Since the 2015/16 El Nino there have been three La Ninas, according to NOAA.
Oh dear.. and I thought we were told CO2 would cause more El Ninos.
Poor FN.. praying for some warming so he can trigger his panic attack.
“Oh dear.. and I thought we were told CO2 would cause more El Ninos.”
I’ve not heard that. Do you have a reference?
Glad you finally realise that the ONLY atmospheric warming in the last 45 years..
… is NOT CAUSED BY CO2
Well Done.. maybe you are not as simple as I thought.
Ok that is just too weird to warrant a reply……
And you still beleive that it CO2 is the control knob/driver of ?climate change? Your really are deluded.
I’m afraid we can’t take Hansen’s or Nick’s white racist masculinist worldviews on fire and brimstone seriously as they’re not qualified to judge-
How gender and racial exclusion are driving Australia’s megafires (msn.com)
The dooming is strictly lefty secret women’s business.
PS: You gotta like this kid kicking in their rotten door-
‘Anti-white hatred’: US student almost expelled for complaining about ‘racist’ class (msn.com)
Add it to the existing field of Feminist Glaciology.
Nick,
The problem with time series is that they don’t show a functional relationship unless you are trying to show that temperature is a function of time. The only thing this graph is useful for is showing what has occured throughout the period. It doesn’t show what occured prior to or after. It doesn’t show what changed during the time.
Its only use is for attempting to make a prediction based on time. But the only prediction you can truly make is continuous growth – FOR EVER!
The conclusion of, “if projecting subjecting to scenarios of gas concentrations.” is not possible from this graph because CO2 concentrations are not part of the graph. To make any conclusions about future emissions controlling temperature, you would need to show CO2 ppm on the x-axis and temperatures on the y-axis.
You have obviously never had to perform experiments where an hypothesis is made and variables defined for measurement in order to determine a relationship.
This graph shows,
“Temp = f(time)”
and not
“Temp = f(CO2)”
Take a good look at the scenarios. None even match the observed exactly. That should be your first clue that there is no functional relationship. The pauses that have occured while CO2 has continued to grow should be ample evidence that a real functional relationship is needed to make future predictions.
Its been done: When coupled UN IPCC CliSciFi climate models use measured SSTs to drive the models without the historically measured atmospheric CO2 concentrations the model hindcasts most reliably track observed temperatures. Another proof that the Enhanced GHG hypothesis has been falsified.
Nic: Note how I said in my post: ” … to inspire exaggerated and falsified predictions of future temperature and sea-level-rise.” If you read the NYT summary of Hansen’s historic testimony, you will see the exaggeration of temperature rise and sea level rise. That was not corrected by the NYT or Hansen, so I stated it as such.
https://www.nytimes.com/1988/06/24/us/global-warming-has-begun-expert-tells-senate.html
Hail to the author, I saw what he saw!!
The prediction you quoted (via the NYT) was
“If the current pace of the buildup of these gases continues, the effect is likely to be a warming of 3 to 9 degrees Fahrenheit from the year 2025 to 2050″
How has that been shown to be exaggerated or falsified? Firstly, there is the “if”. The pace did not continue, especially with CFCs. Secondly, none of those dates has been reached yet.
This is a thin reed to protest. Just imagine any trend line to the prediction date of 2025 (37 years in) and how wrong it would be with the start date just ahead. With log-over-linear forcing, even with Hansen’s in-the-pipeline warming, how could a huge jump in the next decades rescue the trend? ‘Tipping point’ analysis?
There might be another big mystery here. (Hint: it gets to the politics of alarmism.) Might you guess what it is?
You need to say what actual quantitative prediction you think is disproved, and why.
My interpretation of the journalists muddy account is that the “if” part represents following scenario A, and on that scenario there would be a 3°F rise by 2025 and a 9°F rise by 2050. That corresponds to his graph which has a 1.5°C (2.7°F) rise by 2019, on that scenario A. But he calculated scenarios A,B and C, since he can’t know what policies would be followed, and it turned out a bit below B, 1°C. And that is what we got.
As to 9°F rise by 2050, we left that scenario A with the Montreal Protocol in about 1990, so we’ll never know.
I posted the Macquarie Island readings above. If co2 was the cause of the ”warming” as Hansen believes, One good surface reading anywhere in the world should show the co2 warming signal. It does not.
“ One good surface reading anywhere in the world should show the co2 warming signal.”
Of course not. There is clear data showing that the trend varies spatially, and always has. You can always cherry pick places with low trend. Just use this map of trends from 1990 to 2019:
That is from Mo-Who.
A totally unreliable AGW SHILL site that deliberately uses tainted and adjusted never-was-data.
It is meaningless.
Nor does that fake map show any CO2 based warming.
Nick is again trying to distract from the FACT that he can’t provide any evidence.
So you are honestly expecting me to believe an individual station could not show a co2 warming signal over half a century. Is that what you’re saying?
There is no CO2 warming signal in any reliable untainted data (UAH)
Plenty of urban warming signal, which is what the surface data mostly represents.
But it is not “global” in any sense.
Plenty of “agenda” signal in the surface data, as well.
Most stations will. But even at 50 years there is variation, and you can cherry pick. You could find somewhere in the S Atlantic:
So absolutely no evidence of CO2 warming
Ok. !
If a station shows cooling of 1C then in order to get an average increase of +1C there has to be a matching station that has a warming of +3C. (+3-1)/2 = 1
Your map simply doesn’t show that there are enough warming locations to offset those that are stagnant or cooling.
Nick, what pattern of global warming would prove or disprove the Enhanced GHG hypothesis?
“Of course not. There is clear data showing that the trend varies spatially, and always has. You can always cherry pick places with low trend. Just use this map of trends from 1990 to 2019:”
If it varies spatially then it is WEATHER, local weather and not a “global average” climate. Weather is not climate.
If some parts of the globe are warming, some parts are marking time, and some parts are cooling then you can’t use a ‘ONE SIZE FITS ALL” solution to fix the “average”. Yet that is what the CAGW advocates like you want to do.
If part of the globe is cooling and CO2 is the temperature thermostat then you are going to INCREASE THE COOLING at those locations if you lower CO2. Is that *really* the solution that is needed?
Logically, no matter the location on earth the Enhanced GHG hypothesis requires a significant upward trend if atmospheric CO2 concentrations significantly rise. Negative and zero-to-very-low trends are impossible over a 30-year period of rapidly increasing atmospheric CO2 concentrations if the Earth responds as the hypothesis holds.
Since the graphic shows negative and zero-to-very-low trends around the globe the Enhanced GHG hypothesis is logically falsified. Of course, that’s just me and I have no intention of trying to prove it scientifically.
You nailed it. Either CO2 is well distributed or it isn’t. If it is then everywhere should show a significant average temperature increase. If it isn’t then the “global average temperature” is a joke of the first order.
Here is the funny deal. The “journalists muddy account ” is 1) from an esteemed leading environmental journalist and 2) did not lead to any correction from Hansen, the New York Times, or an environmental group. Why??
It is, obviously, a muddy account. It is hard to work out what it means. But it isn’t wrong.
Aah, I see business is still booming at Fake-Graphs-R-Us.
Mr. M: Although I agree with you that it is essentially a fake graph, Mr. Stokes will tell you where he got it and ask you for your data, it’s made-to-order for his racehorse style of discussion. I like to take his own words and turn them on him. Here, he removes the predictions cited by the author and inserts some other prediction without sourcing that. He is ordinarily more of a challenge, here not so much.
Jim Hansen 2005 (pdf): “Curiously, the scenario that we described as most realistic is so far turning out to be almost dead on the money. Such close agreement is fortuitous.
For example, the model used in 1988 had a sensitivity of 4.2°C for doubled CO₂, but our best estimate for true climate sensitivity is closer to 3°C for doubled CO₂.“ (my bold).
Accidental correspondence is always worth a tout among climate-change pushers.
Let’s also recall that climate models have no predictive value. Hansen’s projections include no uncertainty bounds, They’re physically meaningless. Including the middle scenario B.
“Accidental correspondence”
He is referring to correspondence between a scenario and what eventuated. Scenarios are not predictions. It just happened that the results of future decisions that he could not know about corresponded to one of the predicates for his calculation. Usually it doesn’t, and you have to do some interpolation to relate the temperature outcome to his GHG scenario.
“corresponded to one of the predicates for his calculation.”
Yep, the “C” scenario.
All that extra CO2 and real temperatures match the “no added CO2” scenario
The climate models and the CAGW predictions are nothing more than data matching exercises. You could pick *any* factor that correlates with the data and say it is the causative reason temps are going up. The CAGW crowd has picked CO2. They could have picked:
You would be unable to falsify any of these as “the* causative factor, just like you can’t falsify CO2 as *the* causative factor. But not being able to falsify the factor doesn’t mean it is *actually* the causative factor.
What happened prior to 1988 is history and not related to future predictions, except perhaps to note the poor fits for 1977 and 1984. Scenario A is obviously a non-starter, despite it supposedly being “Business as Usual.” Scenarios B and C were in close agreement with GISS until about 2005, when they diverged significantly, largely because Hansen chose to introduce hypothetical volcanic eruptions, which did not take place on the assumed dates, subjectively lowering Scenario C. Were it not for the 2016 El Nino event, there would be poor agreement between GISS temps and Scenario B; the single crossover point at 2016 deceptively makes it appear that there is good agreement with Scenario B. The best agreement, except for two points out of about twenty, is with the subjectively depressed Scenario C, characterized as “Draconian Reductions,” which obviously have not happened.
As I have previously pointed out, a simple linear extrapolation of Hansen’s own data does a better job of predicting the future than any of the scenarios applied to his model.
https://wattsupwiththat.com/2018/06/30/analysis-of-james-hansens-1988-prediction-of-global-temperatures-for-the-last-30-years/
So if the scenario that best fits observed data is the one where Hansen suggests ‘draconian reductions’ then what is he whining about? We’ve achieved the same result without needing his extreme austerity measures – good on us, game over for Hansen! Much wootage and celebrations!
“We’ve achieved the same result without needing his extreme austerity measures –good on us, game over for Hansen!”
And Game Over for Alarmists in general.
Obviously, CO2 is not a problem. We should not destroy our economies trying to reduce it.
As I drive in Manhattan, strangely without a submarine.
Troll.
as of today scenario A (I believe its the do nothing scenario) is off by 100% and scenario B is off by at least 50% and scenario C is higher than observed .. I’d say thats “exaggerated” …
Hansen’s predictions and scenarios ended in 2019.
Hansen’s prediction were meaningless garbage.
Needed lots or urban, airport and agenda driven adjustment to even come close to Scenario B
Real temperatures are much nearer Scenario C, showing that CO2 has little or no warming effect.
Hansen’s predictions are linear extrapolations based on assumed atmospheric CO2 concentrations with a few random “bumps” thrown in to make them less linear-looking. All UN IPCC CliSciFi models are the same and their temperature outputs vary from one another only by ECS assumptions and different games with aerosols and clouds. His 1988 model with its 4.2℃ ECS was running way too hot and can only get the results he did by playing with aerosol and other parameter adjustments. Hansen’s model didn’t predict anything.
“playing with aerosol and other parameter adjustments”
Just so no one misses it. He played with UNMEASURED parameters that could be set to whatever he NEEDED them to be. Current models are no different. They depend on assumed values of lots of different parameters. Whether those assumptions are realistic or not is simply ignored, they are purely used to keep the models from “blowing up”.
Where’s the graph with his ABC scenarios projections based on CO2 levels and the resulting temps?
CO2 is way above his “worst” case but temps are not.
PS When did he say the Oceans were supposed to be boiling?
“We have pretty much followed the middle scenario B.”
That is a LIE.. of course.
Real temperatures are at or below the “C” scenario, while atmospheric CO2 levels continue to climb.
Hansen has effectively shown that CO2 does absolutely NOTHING.
Correct.
Funny. This graph does not show 2001 being 0.6 degrees higher than 1958. Go figure.
That is a graph from Thorne’s paper of 2005. It is displayed on the Met Office site with this warning:
“Cautionary noteIt is important to note that significant uncertainty exists in radiosonde datasets reflecting the large number of choices available to researchers in their construction and the many heterogeneities in the data. To this end we strongly recommend that users consider, in addition to HadAT, the use of one or more of the following products to ensure their research results are robust. Currently, other radiosonde products of climate quality available from other centres (clicking on links takes you to external organisations) for bona fide research purposes are:”
That’s the funniest thing I’ve read for some time!
Here is part of the note under this graph….
Global means have been attained through zonally averaging all the available gridded data and then taking a cos(lat) weighted average. This mitigates the effects of the unequal spatial sampling (Figures 1, 7, and 8), yielding a more truly representative global mean value,
Yet you use GISS which you know is totally unreliable as a measure of global temperatures over time.
You know it comes mainly from urban tainted and an increasing number of airport sites.
You know it is then deliberately adjusted to show even more warming.
You are well aware that the chances of it even remotely representing real “global” temperatures is basically NIL.
Yet still you use it.
That is NOT SCIENCE,… that is zealotry.
Shrill and repetitive.
Poor Nick-pick, the SHILL. !
You know GISS isn’t worth a pinch of snuff
You know cannot counter single point I have made.
Yet you still use it !
That is DISHONEST and profoundly unscientific.
But we expect no better from you.
Ho, ho, ho. The fox defending his hen-house. Gatekeeping, much?
No “scientist” of any reputation ever uses numbers that they KNOW are from really bad sources or are of unknown quality, and have been agenda-driven “adjusted” to match a desired outcome….
… to compare to that desired outcome.
That is zealotry, not remotely science.
Nick knows that the surface fabrications are from heavily tainted urban and airport sites.
He knows that the probability of the surface fabrications even remotely resembling real “global” surface temperatures is basically NIL.
The only people Nick is fooling are Foolish Nitwits and simpletons.
Bar the last few years the temperatures seem to fit scenario c best. I assume that is a low emissions scenario. In other words, just carrying on as normal seems to have given the results we wanted without having to make massive sacrifices. That hardly suggests we need to take any drastic action.
Are we looking at the same graph? The temperature profile (even allowing for the fact that you’re only showing the highly adjusted GISS data) follows Scenario C, where we basically stop burning anything in 2000, until the El Nino in 2016. There’s a total mismatch with Scenario B from about 2003 to 2016. Anyway, as I recall, even B assumed significant emissions reduction measures which have not been taken.
Climate science is so political and PR-driven
Indeed, some might just say it isn’t really scientific at all. Lines of code have replaced the entrails, tea leaves etc of old.
“…we have to offer up scary scenarios, make simplified, dramatic statements, and make little mention of any doubts we might have. This ‘double ethical bind’ we frequently find ourselves in cannot be solved by any formula. Each of us has to decide what is the right balance between being effective and being honest.” — – Dr. Stephen Schneider, former IPCC Coordinating Lead Author, APS Online, Aug./Sep. 1996
I’d say the tipping point on that balance has been passed and everything is now scary scenarios with net zero honesty.
A big favourite with the media – among others, of course – is Friederike Otto – the climate attribution queen. In Greece (Rhodes and Corfu) the fires were the result of arson. Big surprise, eh. But that counts for nothing in the mind of the rabid alarmist.
“The human-caused climate crisis is undeniably to blame for the deadly heatwaves that have struck Europe and the US in recent weeks, scientists have shown.”
https://www.theguardian.com/science/2023/jul/25/deadly-global-heatwaves-undeniably-result-of-climate-crisis-scientists-attribution
How do they know this?
““Such heatwaves are no longer rare and the most important thing is, these extremes kill people, particularly destroying the lives and livelihoods of the most vulnerable,” said Dr Friederike Otto at Imperial College London, UK, who was part of the analysis team.”
Ok There is a team, but how do they know this? It doesn’t actually say, but we know how they ‘know’, don’t we?
They modelled it and then attributed it….
“The researchers found that greenhouse gas emissions made the heatwaves 2.5C hotter in Europe, 2C hotter in North America, and 1C hotter in China than if humankind had not changed the global atmosphere.”
https://www.theguardian.com/science/2023/jul/25/deadly-global-heatwaves-undeniably-result-of-climate-crisis-scientists-attribution
Call me old fashioned, but that isn’t my idea of scientific enquiry. That’s politics.
Climate attribution studies are very opposite of science.
They take one fake unvalidated model they pretend is low CO2
… run it lots of times using faked data, get some numbers and probabilities out of it
Then they take another FAKE unvalidated with anti-science pretend CO2 warming built into it
… run it lots of times using fake data and get some more numbers and probabilities.
They then compare one lot of fake output against the other lot of fake output and pretend it shows what CO2 does.
It is worse than playing PacMan or SimCity as a form of science.
I did say above “lines of code have…”
“The methodology itself is documented in a more extensive companion paper. It covers all steps in the attribution process: the event choice and definition, collecting and assessing observations and estimating probability and trends from these, climate model evaluation, estimating modelled hazard trends and their significance, synthesis of the attribution of the hazard, assessment of trends in vulnerability and exposure, and communication. “
Pathways and pitfalls in extreme event attribution
https://link.springer.com/article/10.1007/s10584-021-03071-7
So, we have: Event choice and definition…. ‘assessing’ observations…. estimating probability and trends from these… climate model evaluation…. estimating hazard trends(?)… a synthesis of….
You get the picture. It isn’t empirical science, Jim.
Yet the projections seem to be holding up rather well.
The topic of discussion here is Hansen’s prediction, not the CMIP ensemble model runs.
Those are NOT global temperatures.
They are mal-adjusted urban/airport temperatures
They do not represent anything except prpoganda.
I´m born and raised in Denmark, therefore I have read the litterary fairy tale by H.C. Andersen “The little Matchgirl”, reading it still gives me a lump in the throat. When The Lancet published their lattest figure of the comparison between cold and heats deaths, my first thought was, read the Little Match Girl before you publish a fraudulent figure like that. That goes to James Hansen to.
BTW Nick Stokes, have you remembered to read the footnotes this time … !!
… And … The author of the article “You´ll own nothing and you be happy” is also from Denmark, the titel have since been rewritten to “Here´s how you city could look like in 2030” but the date is the same. Is this a coincidence “Yes of Course” it is, is it a coincidence that the weather forecast color-maping have changed “Yes of Course” it is. Is it a coincidence that the “nobel-prize winner” Barack Obama recently have installed propane-tanks with the capacity of 2.500 gallons on his ground at Marthas Vinyard “Yes of Course” it is. Is it a coincidence that the nobel-prize-winner John Clauser is being cancelled, hell no, give him Barack Obamas nobel-peace-prize to him to so he have two instead of one, with our inconvenient Pal Al Gores to, it becomes three.
The talks about Blackouts and Climate-lockdowns can be necessary, merely confirms the history of science, science is about power and only a “grain” of the truth. Taken that in concideration we should actually thanks John ” the grifter” Kerry for raising the fraudulent “consensus” with 1 percent-point from 97 to 98%. To apply this “rule of thumb” must “mean” that 98% of the science is about power and only two percent truth, so a speak … I could ofc be wrong, CC can potenialy cause blindness, so perhaps it´s still 97% about power and only 3% of the truth. I have to look further into that …!!
I wonder if Obama’s mansion on the Vineyard is covered with solar panels? If not, I wonder how he justifies that fact.
A politician gets elected by telling people what they want to hear, not what they believe or intend to do if elected. Only once they have retired can they behave in a manner that reveals what they actually believe.
Id happily provide Tar n Feathers, someone got a match?
“””may have been honestly duped about the science and engineering,
Yes James Handstand – and YOU did it
Heat Energy does not ever flow up a thermal gradient.
The notion of Green House Gases is contrived fantastical nonsense
How many are still duped…
The Theory says:
OK, so by same principle that The Moon has a dark side, so must Earth and thus another area of πr² must be in the dark absorbing nothing
But hang on a minute: At all times, half of Earth is in day-time and half is in night-time
Yet the explanation for the Green House Effect only includes 2 parts, each of πr²
But Earth has 4πr² of area so where, in the Theory Of Greenhouses is the other 2πr² of Earth’s area looking at.
Where in in fact is it – how can you simply ‘disappear’ half of Earth’s entire surface area?
Even and much much worse (is that even possible) The Theory says that Earth has an Albedo of about 0.30 – primarily because of clouds and ice.
Well yes it does BUT: That is after ‘climate’ has modified it.
Climate created the clouds & ice.
You cannot use those things to create climate – climate did it already
So what TheTheory does is take an Earth that has been cooled by its climate and then contrive some fantatsical imagination to warm it back up again.
This is truly the Science of Alice in Wonderland – and to hold it all together requires to trash the 2nd Law, Entropy, Carnot and the words of their own authority, Jozef Stefan
And nobody said anything – The Good Men sat on their hands
we are in sooooo much trouble here
“contrived fantastical nonsense”
That just about sums the AGW religion up.
Dr Markus Ott has a much more plausible method of wrapping energy onto a sphere:
https://www.youtube.com/watch?v=JXKHfL55G2A
There are a few other videos in the series, watch them all and download the accompanying paper:
https://tomn.substack.com/api/v1/file/71a8adc6-7aa4-42e4-88eb-caa6d0f04057.pdf
No they say that the sun’s rays are effectively parallel when they reach earth, consequently the total amount of energy received is the solar flux/unit area *the Earth’s cross-sectional area, this energy is distributed over half the Earth’s area.
“James Hansen on Fire”
I do wish there was a hell that he could burn in
But maybe we won’t need water heaters at all.
Greenland melted recently
https://www.sciencedaily.com/releases/2023/07/230721113113.htm
Drawing the wrong conclusion? That “Greenland may be more sensitive to human-caused climate change than previously understood” when the conclusion should be that very warm periods happen WITHOUT human causes?
Funding will be withdrawn if the approved conclusion has not been met.
Forest fires occurred long before humans evolved. Doesn’t mean humans can’t also cause forest fires.
Many humans do cause forest fires – they seem to get some kind of ‘kick’ out of it.
Me thinks you didn’t get the point. 🙂
Yes, I understand that the Greek authorities have arrested two people for arson.
Make that at least 5 and counting (my figures are a day or so behind), although one of those was subsequently sectioned in a mental institution rather than face trial. Previous years in Greece have seen numbers arrested at about 15-30, usually with investigations going on past the arson season itself. For the last few years, at least, there have been extensive co-ordinated arson attacks from Italy through Greece and into the Balkans – it’s a very serious issue that these governments are dealing with – literally a matter of life and death.
“one of those was subsequently sectioned in a mental institution”
ah… so they are rabid greenies !
That makes sense.
“literally a matter of life and death.”
But, of course, the climate scammers use these arson attacks to further their “climate change” agenda.
They really are truly despicable and dishonest.
Or are these fires an intentional part of their agenda.
have arrested two people for arson.
Waited for a hot, dry and WINDY day to get the best effect !
Yes, over 90% of the fires in AB this year are human caused.
You have now posted correct info several times recently
Well done.
You have absolutely ZERO EVIDENCE that humans cause warming (except in urban areas and airports etc..
Plenty of evidence that humans use fire,. and occasionally deliberately light them.
While fools like Hansen ( and some body else here) obsess on AGW Two other threats have snuck up on us . 1)A soft tyranny that will become a hard tyranny. and 2) Rapidly advancing AI combined with advanced robotics and connectivity ( combined with defense/ offense weapons tech) Oh maybe I should say 3 threats when you combine number 1 and 2. I am taking AI very seriously now- just because Chat Gpt does not get AGW correct in our opinion does not mean it is not a existential threat. Very disturbing. We need to pivot.
Two words – Sky net😗
It all went well, until the very end, where he just started spinning ’round and ’round…
…but it’s always fun to see another soul awaken.
P.S. AI is a machine. Machines have owners. Machines do what their owners bought them for.
Maybe you should stop worrying so much about a machine.
…and find out who the owner is, so we can hold s/him/t responsible.
Not necessarily, look deeper – one of Google’s top executives in the field , Mo Gawdat recently would seriously disagree with the “ just a machine” but I hope you are right.
It has been said that a good general plans for the worst and hopes for the best.
Find out where the on/off switch is.
If there was an On/Off switch, my friend, I would not be half as freaked out…
There is also, potentially, a threat from aliens- OK, once y’all stop laughing, this Wednsday, Congress is holding a hearing on the subject of UAPs and aliens with 3 guests who know a lot about the subject. I think it’s at 10 AM EST but not sure.
Could be AI coming back after finding a worm hole 3 months from now when they became self aware
Joseph – it might be the new jargon TLA de jour, but I simply cannot take ‘UAP’ seriously – I read it as OAP and then visualise zimmer frames in space! 👽
I like using UFO better.
I’ll be watching that hearing. One person is claiming the U.S. has a crashed UFO in its possession, and he seems to be in a position to know. We shall see.
Like all Leftist bullshitters they have to take a simple, universally understood term and substitute incomprehensible jargon in its place. Can you imagine the number of bureaucratic meetings that had to take place to come up with UAP?
AI is the new CAGW. It is being used to engender fear in the populace so they will give up more of their freedoms to Leftist politicians and Deep State actors. Resist!
James Hansens 2006 predictions ran out 7 years ago. 7 years ago is intresting from an historical point of view. 7 years ago he admitted sea levels were 6 to 9 meters (20 to 30 feet) higher during the last interglacial than they are today. But what he failed to say was that paleoclimatological studies have indicated that it took a number of millennia for sea levels to rise those 6 to 9 meters when temperatures were warmer than today.
Here´s my “riddle” to James Hansen: If you put a statue of him after his natural height on the shore, how long will it take before it is under water?
Not soon enough!
That’s easy
Never.
We are near the end of the Holocene interglacial, must be, meaning there is zero chance of getting 2m rise before it ends
Texas sharpshooter fallacy. Some Hansen predictions are correct, some are not. Exactly as predicted by laws of chance. Same predictive skill as a coin toss.
Relativity rest on hitting the bullseye 100% no matter the location.
Yes
Like hurricane models that are 10% accurate
1 in 10.
Better off with magic 8 balls
Hey! Quit running down my Magic 8 Ball.
Hansen prediction of sea level flooding his office due any day now.
Hansen can be fickle. He once strongly supported a 100 MW woody biomass plant in FL. Then, the forestry haters got on his case and he changed his mind.
Sitting in calgary, this morning the local “conservative” talk radio station had a newscast pushing the ludicrous debunked nonsense that this July is the hottest month in 120,000 years.
You see and hear this garbage every day and most people can’t read so they’ll never grasp they are being lied to.
But this is the nonsense used to devalue oil and gas companies and elevate EVs and renewables, dead end wasteful technologies
“The world is shifting towards a superheated climate not seen in the past 1m years, prior to human existence, because “we are damned fools” for not acting upon warnings over the climate crisis, according to James Hansen, the US scientist who alerted the world to the greenhouse effect in the 1980s”
We’ve been hearing this month that this is the hottest in 125,000 years. Now its headed to the hottest in the past 1m years.
These people don’t actually look at the data.
We still aren’t above the 2016 peak yet from the El Nino. That should happen in the next year by a small margin.
Most of the hottest temperatures ever for each U.S. state have not been broken during this climate crisis. Just in the 1930’s, 23 of the 50 states had their hottest ever temperature that still stands today.
July 1936 was almost 5 degrees hotter than July 2023.
OK, that just 1 country but most of the decade of the 1930’s was like that in the U.S. with widespread droughts, year after year.
So let’s expand the horizon slightly back to 1876-1878, shortly after the Little Ice Age ended with the global temperature 1 deg. C cooler than this and CO2 at 130 parts per million less than this.
Climate and the Global Famine of 1876–78
https://journals.ametsoc.org/view/journals/clim/31/23/jcli-d-18-0159.1.xml
During the late nineteenth century, a series of famines affected vast parts of Asia, causing mortality on a scale that would be unthinkable today (Davis 2001). Of these, the so-called Global Famine lasting from 1876 to 1878 was the most severe and widespread in at least the past 150 years (Hasell and Roser 2018; Gráda 2009; Davis 2001). The Global Famine inflicted acute distress upon populations in diverse parts of South and East Asia, Brazil, and Africa, with total human fatalities likely exceeding 50 million. These famines were associated with prolonged droughts in India, China, Egypt, Morocco, Ethiopia, southern Africa, Brazil, Colombia, and Venezuela (Davis 2001; Clarke 1878; Hunter 1877). Historical documentation indicates famine-related mortality between 12.2 and 29.3 million in India, between 19.5 and 30 million in China, and ~2 million in Brazil (Davis 2001), amounting to ~3% of the global population at the time. It was arguably the worst environmental disaster to ever befall humanity
++++++++++++++++++++++
These people continue to be completely denying that the current regime is a climate OPTIMUM for life and climate change is PROTECTING US.
They cherry pick every extreme and call it a climate crisis.
In June, it was cool in Phoenix but hot in Texas………..so all the reporters went to Texas to tell us about how hot it was and impossible without the climate crisis.
In July, the heat moved to Phoenix………so all the reporters moved to Phoenix.
Wherever the heat goes, that’s where they report from and they use it to tell us the planet is on fire.
No……….just the usual natural variations in weather that have always happened, while they cherry pick the expected extremes and call them a crisis.
Today’s fake climate crisis is a picnic compared to much worse weather/climate events in the past BEFORE CO2 went up.
Speaking of picnics.
It was warmer than this in the higher latitudes of North America between 9,000 to 5,000 years ago (that’s a bit less than Hansen’s 1 million years). There was less Arctic sea ice. CO2 levels were lower. Thousands of years before the Industrial Age.
That’s why it’s called the Holocene climate OPTIMUM……BECAUSE it was so warm…..the way most life prefers it.
https://en.wikipedia.org/wiki/Holocene_climatic_optimum
These people obviously aren’t interested in practicing the scientific method.
Deciding what they want to believe and other people to believe……….then seek out places with extreme weather and tell people that it couldn’t have happened without man made climate change…………including ABC Nightly news tonight with their usual stuff.
“This month will end up being the hottest month ever”
They keep saying that about the US too.
The heat dome in the Southwest U.S. is being temporarily dislodged east for several days (then it cools off again in the Midwest and turns downright chilly in the Northeast for next week).
These were the average temperatures thru yesterday.
Compare those temperature anomalies above, here in 2023 to July 1936
https://www.wunderground.com/cat6/North-Americas-Most-Intense-Heat-Wave-July-and-August-1936
“Now its headed to the hottest in the past 1m years.”
Well, it is probably warmer than when a 1km thick layer of ice covers most of Canada and northern USA
That is probably a good thing. 😉
But the reality is that the planet is only a degree or so above the coldest period in 10,000 years, and well below the much warmer climate that existed for most of the Holocene.
Nick Stokes’s comments are a real asset to the discussion. His (mendacious?) responses bring out the real truth from real scientists! One only has to look at the page upon page of failed climate predictions in the timeline on the top right of this page which contradict most of Nick’s arguments! Have a good day Nick.
Stokes is the religious faithful. Any attempt for his acknowledgement of the climate fraud that occurs is like trying to nail jello to a tree.
When proven wrong he either will not respond or use some slippery, Gordian knot mentality to side step the issue.
At least Mosh provides info that is useful and breaks up the group think that can occur.
Griff – well that guy…..I think when he was in grade school, his desk was moved next to the teacher because he flicked boogers.
Never let a good El Nino go to waste amidst an ignorant public and cheerleading leaders and media.
NOAA SST-Nino3-4 GlobalMonthlyTempSince1979 With37monthRunningAverage.gif (880×475) (wp.com)
I’m from the (federal) Government and I’m here to help you.
story tip
U.S. Forest Service Admits to Sparking Monster Wildfire (msn.com)
AGW has been found to be a false hypotheses based on science and observation. For example it has been shown that greenhouse gas theory violates the second law of thermodynamics. Since AGW is false it should be no surprise that predictions based on AGW have been less than accurate.
STORY TIP:-
Talking of “on fire”, here’s one from the Beeb https://www.bbc.co.uk/news/world-europe-66310280