Essay by Eric Worrall
In Australia we call a 110F top temperature a warm Summer day – so when alarmists tell us these temperatures are a climate crisis, it leaves us Aussies a bit perplexed.
Scorched by burning questions, our answer should not be inaction
July 24, 2023 — 5.00am
Consider, for a moment, how many words your eyes tend to skip over when you read – if you still do – articles about the catastrophe we are, right now, in the midst of. My list would look something like this: floods; fire; record temperatures; ice melting; mass extinction; bleached coral; 1.5 degrees; 2 degrees; IPCC report; drought; heatwave; tipping point.
There are more, but I’d like you to keep reading.
…
I am writing this – and, full warning, this paragraph will bore you – at the end of a truly crazy period. The world has likely just seen its hottest two weeks on record. Nobody alive has lived through a hotter period. The people of Phoenix, Arizona endured almost three weeks with temperatures above 43 degrees. Climate change has combined with El Nino to produce almost literally unbelievable conditions. (At least all this gave me a new phrase: “heat dome”. This is apparently hot air trapped by the atmosphere. For now, my eyes slow down when I come across it; that will no doubt stop soon.)
As others have noted, such facts seem now barely to register in Australia. …
The question of how to approach climate change – with gloom or optimism – is a vexed one. The American commentator Ezra Klein recently wrote of the ways in which a world that has addressed climate change is actually more exciting: better cars, warmer homes, cleaner air. Politically, he wrote, we can’t rely on doom to convince people: “The green future has to be a welcoming one, even a thrilling one. If people cannot see themselves in it, they will fight to stop it.”
…
Read more: https://www.smh.com.au/environment/climate-change/scorched-by-burning-questions-our-answer-should-not-be-inaction-20230723-p5dqjf.html
The author goes on to complain that Australians also aren’t supporting “The Voice”, a left wing attempt to introduce racial identity based privileges into the Australian constitution. I’m not sure what “The Voice” has to do with climate change.
So why aren’t Aussies or the general public getting more excited about a few hot days? Probably for the same reason Arizona residents don’t usually get that excited by hot weather. Most people who live in hot places like Australia have experienced or worked in hot weather, at home or on holiday, weather conditions which rival this alleged “climate crisis” we are enduring.
That Phoenix Arizona heatwave record (22 consecutive days above 110F) was only a few days longer than a previous record (18 days above 110F) in 1974, back when CO2 levels were around 330ppm. Even if every minute of those 4 extra days of Phoenix heatwave was due to the 93ppm rise in CO2 since 1974 (2022 figure approx 423ppm), the appropriate response is to buy a bigger air conditioner, not to shut down Western civilisation.
If the climate crisis we’ve all been waiting for turns out to just be a few extra beach and poolside weather days, what a sad, uninspiring finale to all that dramatic climate propaganda buildup we’ve endured over the last few decades.
For more background on climate change alarmism click here.
Eric, here in South Florida we have had a week of extreme heat warnings. Over 110 like Phoenix. Except there is is. Dry heat, and here it is a ‘feels like’ index of heat (low 90’sF) plus humidity (RH in the 90s here along the ocean almost every day.)
I used to work in a poorly ventilated plastic factory operating heated hydraulic presses. During hot spells the factory floor hit 130F, with clouds of steam from the leaky presses and chemical processes floating in the air.
When I told my friend, he laughed. His job was entering underground mines straight after the explosion, to make sure all the charges had detonated. Nobody waited for anything to cool down or dry out, they were all on big production bonuses.
I attended university at USF in Tampa. We called it 95², 95°F and 95% RH. No a/c in our cheap, student ghetto houses. Somehow, we survived.
Actually you didn’t survive, you died and now find yourself in Climate Change Hell.
Be-Else-Bub is running the White House
One thing I know: It is much easier working outside in low humidity than it is working in high humidity. I can’t mow quite as much lawn with my push mower on a high humidity day. I have to quit a little sooner. 🙂
Some directly observed, recorded and honestly reported hot weather events in Australia –
the 1896 heatwave event.
January 1896 49 degree heatwave killed 437 people in AUS
https://joannenova.com.au/2012/11/extreme-heat-in-1896-panic-stricken-people-fled-the-outback-on-special-trains-as-hundreds-die/
Yep, must have been CO2 tunnelling back in time….
This is why BoM “denies” all temperatures before 1910 .
Just wait, eventually they will be Karlized much lower. Its pre 1900, they MUST be lower
and many died due to inappropriate clothing women wore many yards of woolen or if lucky serge type cotton skirts and petticoats, men had maybe denim for the workers but usually woolen trousers and fairly heavy cotton shirt
all the water would have been warm to outright hot from tanks if they were lucky or dams otherwise maybe some artesian supplies or well for some.
in Birdsville even now the artesian water in the cold tap is Hotter than the water from the HWS
While they promote above average temperatures as scary in one location, another location nearby is usually experiencing below average temperatures. The people in the below average areas question why they fail to report on the weather in their areas. The weather has always been this way, but the cultivist’s voices and their desperation are getting louder. That’s really the difference: the tipping point is approaching.
The tipping point of their hysteria?
Yep.
true that! while se sth aus n sw vic are damned cold (just 11.1c here today) and have been well under even the usual low winter temps we have the useless idiots in aBC etc telling us how aus has had a warmer than avg winter, hell even qld has been cold recently
Story tip – The Lancet provides a rare opportunity to see obvious climate data manipulation – American Thinker
J. Boles,
People should be sacked for this blatant scientific misconduct. From the Top, which allowed it to be done.
Geoff S
but the medicos are on the warmist bandwagon so its no real surprise is it?
This has already been mentioned on Twitter by Patrick Moore and I’ll say the same here as I said there “I don’t have a problem with it.”
Yes there are two different scales used on the graph, but anyone looking at it will see that.
The graph is NOT a like for like comparison of the absolute numbers but is a comparison of the different age groups affected in each country listed, in the hot and cold weather, which is important epidemiologically.
It’s a matter of context.
Within the context of healthcare the age distribution and potentially the ethnic makeup of a population is important, hence the details of each half have to be visible, hence the two different scales.
From the perspective of anthropogenic climate change, this appears misleading propaganda and hence is wrong.
The graph is attempting to show multiple variables in one, stratification by age, country, summer, winter.
Perhaps the format is wrong, but multiple graphs may not have been practical for the article.
I am aware of the damage that graphs of temperature have caused in the past, but I would ask you to think what a graph is trying to convey within the context of where it is published and who it is aimed at. As a former health care professional I have a slightly different perspective than I perhaps would have done 20 years ago when I was an engineer.
JohnC,
Crap. It is crooked. Pure and simple. People need to be sacked. Geoff S
From the linked article: “I would never ascribe bad motives to the Lancet or the article’s writers. I’ll note only that we have learned in other contexts that information about alleged anthropogenic climate change is often presented in misleading ways, with the Lancet’s chart being a perfect example of that bad habit.”
So the chart is an obvious (or not so obvious) fraud, yet the author says she would never ascribe bad motives to the people who created the chart.
Maybe should doesn’t ascribe bad motivies to bank robbers, either. They might have needed the money and are just victims of circumstance.
That author could watch the U.S. from space on the CO2 channel in near-real-time and high resolution to appreciate how those “heat dome” conditions also produce very strong longwave emission to space. This is the same range of wavelengths at the edge of the atmospheric window portion of the IR spectrum, where about a quarter of the static clear-sky “warming” effect of a doubling of CO2 is computed. The end result is not that of a passive “trap.”
Looks like Phoenix is getting some relief, but West Texas is pretty hot right now.
https://www.star.nesdis.noaa.gov/GOES/conus_band.php?sat=G16&band=16&length=72&dim=1
On the “brightness temperature” scale for visualization, the radiance at 50C (red) is 13 times the radiance at -90C (white).
“””“heat dome” conditions also produce very strong longwave emission to space. Th…
That’s been my point and have asked about it myriad times = that a hot atmosphere can **only** be losing more heat to space than a (previously) cooler one.
‘The Science’ of global warming says as much.
Only three things can cause a global temperature increase:
Ah but but but the cry goes up, The Energy Is Trapped by Green House Gases
Fine yes nice it might be, in fact, how could it not be. The distinction between GreenHouseGases and non GreenHouseGases is arbitrary and contrived
All substances absorb heat and all substances radiate.
Yes. They. Do.
But even then that’s irrelevant because:
Increased absorption is NOT the same as decreased emission
Increased absorption, as proposed and stated, leads to increased temperature and that leads to increased emission.
i.e. Cooling (in the absence of extra energy coming from somewhere)
‘Global Warming’ is in fact global cooling.
as you say and the Sputnik says also.
I appreciate your reply. Yes, radiative cooling, properly understood, ought to relieve us of the unwarranted fear of warming. More scientists and meteorologists and others who grasp this concept should speak up against the drumbeat of doom.
#NASA_Knew
https://wattsupwiththat.com/2022/05/16/wuwt-contest-runner-up-professional-nasa-knew-better-nasa_knew/
“Looks like Phoenix is getting some relief, but West Texas is pretty hot right now.”
The high-pressure system is moving east into the central U.S. Soon most of the U.S. will be experiencing the heat from this weather system, including the northeast.
Probably so, and that same link to the GOES East Band 16 6-hour animation for CONUS will show the response as a strong increase in the longwave emission to space over more of the U.S.
“In Australia we call a 110F top temperature a warm Summer day “
Eric, that is stretching it a bit. In parts of the outback, yes. The highest temperature ever in Brisbane was 107.1F. Drier cities get hotter; Melbourne, where I live, has for long periods held the record for capitals (though currently Adelaide).
Back after a heat wave in Melbourne in 2014, I made a table of very hot days in the past. 17 days altogether over 110F, since 1856. Phoenix beat that in a month. But the thing is, 7 of those had been within the last 5 years.
Now show us a picture of where that thermometer is, and the surrounding area.
And the same from 1939.
Then tell us that Melbourne has not expanded as an URBAN area.
Don’t wimp out this time !
I wonder if you are actually supporting what Nick is saying. Nick is saying that temeratures of 110F are not very common. When he provides temperature data you imply the figures are exaggerated because of the location of the thermometer. That would suggest that, in fact, there were even fewer days when the termperature was 110F, which would appear to support Nick rather than Eric.
Also, it’s a pity that the discussion got derailed into one about causes. Nick said nothing about causes. He simply disagreed with the statement that Australians regard 110F as a warm, sunny day. And I don’t think that referring to people who work in mines, bakeries or factories is of much help. What percentage of Australians work in these places?
But at the end of the day, how Australians regard 110F is a pretty subjective matter. Some might, some might not I suppose. But I wonder how Australian cricketers regard playing in 110F.
My daughter (from Scotland) lived in a flat in Sydney with no air-conditioning in 2010. When the temperature was around 40C she found it unbearable. But maybe Australians are more used to it.
One thing rarely if ever mentioned is humidity. Try a Bermudian summer, with condensation running down the walls if you boil a kettle for some tea. Hong Kong is similar.
That’s what makes people sweat without relief as it doesn’t evaporate and cool the skin as effectively as when it’s a dry heat. Although not as pronounced, the Gulf Stream whizzes past the UK and promotes a moisture laden atmosphere which gets uncomfortable as the temperature heads to 30ºC+.
As far as human perception of heat is concerned, a moisture laden atmosphere is far more uncomfortable than a dryer atmosphere.
This is BoM Melbourne now.
No carparks right next to it or anything! 😉
Now we wait for NIck to show us where it was in 1939.
And a zoomed out view, showing that there is nothing that could cause random heat. 😉
I find it totally amazing.. or more like BIZARRE, that BoM, or anyone else, thinks this an appropriate place to compare historic temperatures. !
I’m really not sure what your point is here. From 1908 to 2013, temperatures were measured at the regional office. WUWT complained about that. In 2014 they moved to the better site that you have described. A fuller story on the history is here, with photos. All the temperatures quoted are as measured.
ROFLMAO.
So you are saying that just before it moved in 2014…
… the original BoM site was SO COMPROMISED that not even BoM could use it.
Makes your red values look pretty stupid, hey Nick
Furthermore, you actually KNEW they were from a compromised site.
How deceitful and disingenuous of you !!!
Btw.. love the carpark in the new BoM site pic.
“A fuller story on the history is here, with photos”
And no Nick.. there is only one photo, of the new site with carpark, in that link.
The first link shows the totally abysmal site that you got your data from.
Why the deliberate LIES… always !
For those who can’t be bother following Nick’s first link..
.. here is a picture of the site he got his temperature data from.
He is really making a total fool of himself this time. !
Your logic is so muddled here. Eric said 110 is a common occurrence. First you said Melbourne was a good site, presumably meaning that other sites might get to 110F more often. Now you say it is a bad site, presumably meaning that it reads too hot. But it still only had 17 days over 110F.
No way out this time Nick… No blethering, and no shnivelling.
You have been caught red-handed trying to make a point using data from a site you KNEW was massively compromised.
Nowhere did I say the Olympic Park site was a good site.. In fact just the opposite.
On a hot day with a northerly wind it channels all the heat from the railway down over cement and tar through between two big modern buildings, onto the weather site.
It is a horrific site for measuring real temperature, maybe just marginally better than the old horrific site.
Great for creating extreme high temps though.
And if you were too dumb not to see the 😉 next to my comments…
ie sarcasm…
… that is your problem.
“But it still only had 17 days over 110F.”
The whole point of your “timeline” was to try to imply that it is more common in later years. As you’ve already admitted by 2014 even the BOM had to admit the site was hopeless and shifted it to the brand spanking new heat island zone.
And you defend this level of incompetence.
No, I’m trying to show that, contra Eric, 110F isn’t common.
BoM didn’t admit the site was hopeless. They just moved to a less urban environment. Do you think that was bad?
BS.. you got caught out with deliberate distraction and deceit again.
Are you really saying the original Melbourne site wasn’t totally compromised.?
WOW.. !
Sinking fast in your own BS and quicksand. !
“110F isn’t common.”
It is in many parts of Australia.
Nowhere does Eric mention just Melbourne
Nick being disingenuous yet again !
That image of the old BOM Melbourne site.
“Kristen Brynes has offered a couple of photos she had available taken from different angles of the same site, see them below. Thanks Kristen.”
It was in a WUWT article I wrote in 2007.
https://wattsupwiththat.com/2007/10/23/how-not-to-measure-temperature-part-33/
Just for the memories.
Geoff S
Nick, I know that you don’t know this but Melbourne’s high temperatures are always in summer and always caused by hot winds from Central Australia where the sun’s radiation is absorbed by the Simpson Desert and others, and the many rocky mountain ranges within 200 miles of Alice Springs. In late December the sun’s overhead position is only 60 odd miles north of Alice and large high pressure systems to the south of Australia cause the airmass to flow over the eastern coast and down from the centre. That is what heats the southern capitals. Nothing to do with CO2, man or any other crazy reasons you may have.
I’m just reporting the temperatures. Some days are very hot, but Eric exaggerates when he says 110F is common. Yes, there are many things that bring heat to Melbourne, but they seem to be bringing more than before.
a shit-ton of massive gross highrise buildings along the shorelines also blocks seas breezes, moronic councils cut down large trees that shades streets and homes and the stupid bushgardens full of trendy dark bark bark or even worse lovely heat intensifying gravel as well
houses with no verandahs and dark roofs and no lawns worth a damn or gardens, all yuppie designer mc mansions..and they wonder why its hot?
Nick said..“But the thing is, 7 of those had been within the last 5 years.”
So no Nick you were NOT just reporting temperatures…
… you were trying to push your stupid warmist agenda…
Even now you are making idiotic claims like,
… “but they seem to be bringing more than before.”
… when you KNOW it is a LIE based on bad data.
DECEITFUL and disingenuous…
No there’s not. There is only one thing that brings heat to Melbourne and that is what I have described – the hot airmass from central Australia. And it is not bringing it there any differently than it has for many thousands or millions of years. I never mentioned whether 110F was common which it is not, and no location anywhere gets heat brought from many things. Anymore than cold weather coming from many different sources or places.
You sure don’t know much about the real world of weather.
“but Eric exaggerates when he says 110F is common.”
And he is correct. !
Australia has many places where day regularly reach 110ºF
Melbourne only does it at really bad urban sites.
yup those foul stinking hot northerlies that rip through burn the plants to a crisp by lunchtime and give you that burning eyelids heat as you step outside..and id bet if anyone ever looked the ONLY days we get the raging fires are the windy ones, if its 40c but fairly still the fires risk is high but not a patch on a windy day. you see the difference in the animals behaviour on those days as well, theyre as jumpy as rural people are then;-)
Plenty of Aussies work in factories or bakeries or mines which drive temperatures up another 10C above your numbers. I worked in an old tin shed plastic factory in Maribyrnong in Melbourne where floor temperature hit 55C / 130F on hot days. The leaky hot presses and chemical processes released vast quantities of steam.
Most of the workers were elderly chain smoking East Europeans, though one of them was a pregnant Samoan girl.
Once you get used to the heat it doesn’t bother you. Such temperatures are no threat to health unless you are already extremely unwell.
So you accept that it is warming?
That’s the only argument here, as far as I’m concerned.
Sure – like it warmed in medieval and Roman and Minoan times.
Australia has actually been cooling for most of the last 17 years.
But don’t let facts get in your way.
As I’ve pointed out previously (i.e. the last time you produced that very same chart which starts in March 2002), it shows a warming trend of +0.06C per decade. If you’d bothered to update your chart (it stops in October 2022) you might even have noticed that….
So, talking of “facts“, lol.
Australia is in a cooling trend:
Shows only Max temps. Stops 10-years ago. No trendline on chart, etc…
Australia has been cooling since the El Nino, Foolish Nitwit.
There’s that monkey with a ruler again.
Sorry little monkey, but nearly all the graph is sloped downwards with a couple of little steps upwards here and there.
Use your eyes, Foolish Nitwit. !
Seriously Rusty? All you’re concerned about is having us say that it is warming?
It is warming.
Furthermore, unbidden, I will happily go further and say that I think it is more likely than not that human emissions are partly responsible for that warming.
But somehow I don’t think that will make you crawl back under your bridge. Because you can’t even entertain the possibility that this mild warming is beneficial and in no way something we need to counteract.
That’s actually progress compared to when I first started reading this blog. Back then the vast majority of articles and contributors weren’t even admitting to that much. In fact, warnings of impending cooling abounded (David Archibald, Don Easterbrook… etc.).
Is that you griff?
It’s been warming since the 1980’s. It was cooling before that. And the long-term trend is cooling. See the Tmax chart of Australia above.
It’s warming in the short time frame. It is cooling in the longer time frame.
There’s nothing to get exercised about.
Why would you only use (10-year-old) TMAX data to consider whether somewhere is warming? With enhanced greenhouse warming you’d expect more warming to occur at night in hot countries like Australia, right? So, if you wanted to hide a warming trend you would only use TMAX.
Oh look, I just answered my own question.
Cooling the last 7 years in Australia..
And as shown, it has been cooling for most of this century, except for a couple of single month jumps.
UAH last 11 years and several months.
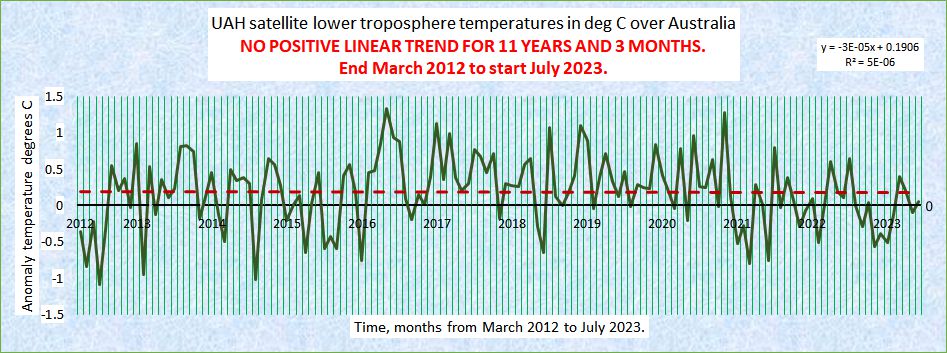
Only atmospheric warming in the last 45 years has come at two major El Nino steps.
It has now been cooling since the 2015/16.
You may have read.. but you have neither comprehended or learnt anything in all that time
You are still as bog ignorant as you were.
There is NO CLIMATE EMERGENCY!
What you have said above is accurate, but its significance is a complex question.
Rusty and Nick would no doubt say that the enhanced greenhouse effect resulting from our CO2 and other emissions is the root cause of the energy accumulation that sporadically heats the atmosphere through ENSO and other ocean-atmosphere processes.
I don’t know how to argue that they are wrong except to make a case that uncertainty in the data is too high or to impune the data quality of the surface measurement record.
There’s the approach of denying that there is any such thing as the enhanced greenhouse effect, which I must reject because it necessarily requires rejecting the reality of the natural greenhouse effect. (Note that accepting that something exists, does not imply accepting that it is significant. The natural GHE is significant and the enhanced GHE may be insignificant or at most modestly, manageably small).
It is a very weak argument for me to cite consensus but nevertheless there may be some weight to the fact that Anthony Watts and most of the regular authors on Anthony’s site here acknowledge and assume the validity of the greenhouse effect.
It’s a another weak argument for me to say we don’t know what else it could be. Arguing from ignorance as it were. But having an alternative explanation for the warming trend would be very helpful.
What we have is data showing imperfectly that there is a slight warming, mostly in winter, in higher latitudes, at night. The observed effects are mostly beneficial, despite all dishonest attempts and literally billions of dollars wasted on bogus attribution and impact studies.
Despite all the climate scare porn being pumped out by the propaganda organs of the church of Climastrology…
There is NO CLIMATE EMERGENCY.
If we squabble over ECS (Equilibrium Climate Sensitivity temperature rise per doubling of CO2 concentration in the atmosphere) being 3, 1.7, 1.1, 0, or -0.5, we are arguing among ourselves over how insignificant the enhanced GHE is, instead of persuading the persuadable that the apparent slight warming trend is not a problem that justifies the destruction of our way of life.
Make no mistake, there is a concerted effort afoot and a desperate push today to destroy our way of life. It is the clear and present danger. Everyone who opposes that must stand together on our common ground:
There is NO CLIMATE EMERGENCY.
The world has warmed. It’s an interglacial period we’re lucky to be in. Glacials last 70-80k years and interglacials are typically 10-20k years. Hopefully the current warming and extra CO2 can keep the world from freezing over for the next few thousand more years.
So why is it that a natural event, El Nino, causes warming but a cooling event, La Nina, can overcome CO2 warming? We have been told it is all due to CO2. 😉
I don’t understand your point, leefor. El Niño and La Niña are two sides of the same ENSO coin.
The boy spends the money that the girl saved up. They are both natural phenomena. In a warming trend, average temperature ratchets upward in a one step down, two steps up fashion.
It’s not telling us why we’re in a slight beneficial warming trend. And let’s not lose sight of the reality that it’s a slight, beneficial warming trend that we don’t need to try to deny like the Climastrologers try to deny the Medieval Warm Period with their hockey stick graph.
Maybe it is delayed cooling caused by the enhanced greenhouse effect or maybe it’s something else. But either way, or both, there’s NO CLIMATE EMERGENCY!
And nowhere did I say different.
Temperature records clearly show temperature has risen since the LIA.
Who said otherwise?
Keep hearing that. No one has yet explained why all the global data sets that start in 1850 show no warming trend for the first ~80 years?
From whom? Pray tell.
Well, from the above poster for a start. I don’t keep a list, but I have repeatedly made the argument here that discernible ‘global warming’ doesn’t actually become a thing in the surface records until the second half of the 20th century.
We know it warmed up to 1930.40’s out of the coldest period in 10,000 years.
It then cooled up the late 1970s
Now it has warmed back up to about the same as the 1940’s
The surface record is an adjusted fabrication of urban/airport etc warming..
it is NOT “global” in any way, shape or form.
“Global data sets”
That made me laugh.
The only global data sets are the regional surface temperature data. All that data shows it was just as warm in the Early Twentieth Century as it is today.
What you mean by “global data sets” is the surface temperature records which are combined with bogus sea surface temperature data, which distorts (deliberately, imo) the global temperature profile into a Hockey Stick profile that makes it appear that we are experiencing unprecedented warming today.
But the written, unmodified temperature data from all around the world puts the lie to the Hockey Stick chart’s “hotter and hotter and hotter” temperature profile.
The Australian Tmax chart above shows the real temperature profile of the planet. I say that because all the other Tmax charts from different regions around the world show the very same benign temperature profile and show we are not experiencing unprecedented warming from CO2 or any other source.
I’m good for something then.
No, but carry on…
Australian TMAX temps cover average temps across the whole world? OK, don’t carry on. At least we both got a laugh!
You are showing your ignorance again, Foolish Nitwit !
REAL data from many parts of the world shows the 1940s about the same temperature as now.
The so-called surface data is a hodge-podge of randomly spaced urban and airport affected really bad data, further corrupted by agenda-based fabrication.
The chance of them even remotely resembling actual “global” surface temperatures is basically ZERO.
CMoB regularly updates his “new pause in the UAH dataset” numbers by calculating backwards from the latest datapoint until the earliest negative, i.e. just less than zero, trend value.
Some commenters here, and many elsewhere, complain that this constitutes “cherry picking”, but it is just the algorithm / methodology he has chosen to use (and post articles about).
The “explanation” that you seek regarding why “all the global data sets that start in 1850 show no warming trend for the first ~80 years” is that if you perform a similar procedure from the start point (January 1850) you will find the latest date that results in a (just less than zero) negative trend is always around 80 years later, i.e. 1930-ish.
Attached is a plot I did in response to another comment here on WUWT mid-June (it may even have been to you, I genuinely can’t remember … and can’t be bothered to take the time to check …) which shows one of those “global data sets that start in 1850” — HadCRUT5, “Air” temperatures version — and one set of trends more than 30 years long (= “climate”) that can be extracted from it.
Enjoy …
Didn’t I just say that?
Your chart shows the cooling trend from 1850 to ~1920. If you had extended it to ~1930 it would be more or less flat.
That’s the only point I’m making. The poster I responded to said “Temperature records clearly show temperature has risen since the LIA”.
I said they don’t. An ~80-year run of zero warming in the period after the LIA is not evidence of steadily warming temperatures.
How far back in the record do we need to go to find an 80-year period of zero warming?
Answer: the 1930s.
Yes.
If you combine a negative trend with a carefully chosen fraction of a subsequent (shorter but steeper) positive trend then you can “cherry pick” a zero trend.
So what ?
Again, I agree.
When you have temperatures rising in “fits and starts” instead of a “steady warming trend” (as claimed by the poster I was originally responding to back in June), then a “~80-year run of zero warming” isn’t “evidence of” anything.
It is either “an observation” or “a curiosity”.
The “temperature records”, for GMST anomalies at least, only go back to 1850 (HadCRUT, BEST, NCEI since January 2023, …), but the proxy records agree that the LIA effectively “ended” in the first half of the 19th century … when GMST was rising from it’s “lowest in the Holocene” levels sometime between the 14th and 18th centuries.
The only overlap between “the first half of the 19th century” and “since 1850” is “1850” …
1) Do you agree that “the temperature record” of HadCRUT5 does show “a rise in temperature” since 1850 (= “since the LIA”) .. or not ?
2) Would you like to rephrase your reaction to “Temperature records [ like HadCRUT5 ] clearly show temperature has risen since the LIA [ = since 1850 … ]” in my last extract above ?
No warming trend for the first 80 years after 1850?
How then did the open season at the coal port in Spitsbergen go from 3 months of the year before 1920 to over 7 months of the year in the late 1930s?
There was obviously considerable warming in the Arctic in that period and this was well before CO2 really got going after 1950
I am referring to global average temperatures. I’m sure there was some variation in various regions and localities, as there are today.
You are totally clueless about what the global average temperature is, or was.
Basically everywhere without massive urban warming shows the 1940s similar to now.
The current surface temperature fabrications are totally unfit for temperature comparison over time.
There are no “global” data sets
Before 2005 nearly all the southern oceans were just guessed at.
Even now the land surface fabrications are from tainted urban and airport sites, heavily manipulated.
The chances of those surface fabrications even remotely representing real surface temperatures is basically NIL.
same as working in a kitchen with the fryers n hotplates on full belt, stepping out into 4oc feels cool
One should never take any notice of what this person says. The highest temperature recorded in Brisbane was 43.2C on the 26th of January 1940 and that is about 110F
I went by the Wiki table

But you’re right; I didn’t check the fine print which says their period starts in 1999.
But still it is a long way from being a frequent occurrence, if it didn’t quite get there once, in 1940.
“I went by the Wiki table”
Oh dearie me.. even you should know better than that !
Yep 1940 was warmer… thanks for the confirmation.
I hope your shoes are tasty. !
It also hit 43 C in Brisbane in January 1902 and Highest temperatures for Cairns was 1923, Darwin 1892 and Alice Springs 1891
But 43C still isn’t quite 110F. You say Brisbane nearly made 110F twice in the past. If so, then 110F can hardly be described as a normal warm sunny day in Brisbane, can it?
That was not the comment made originally. It was about the highest reached in the past
And the hottest temperature ever recorded on Earth was at Furnace Creek in Death Valley where the temperature hit 56.7 C (134.1F) in July 1913
Thanks for that, but I think this conversation is about Australia/Brisbane. It might not be; it gets quite confusing here at WUWT…
Nick confirmed that Brisbane was warmer in 1940.
You really are confused all your life, aren’t you Foolish Nitwit.
You are aware, are you not, that Wiki is purging all content from the site that remotely contradicts the concept of catastrophic climate change.
Not that they were’t before, was it Bob Ward who dutifully altered thousands of submissions from others contradicting the received wisdom? And bragged about it…..
It was the other William Connolly
Thank you. His name escaped me.
How about an added column with the CO2 levels for each of those highs.
Interesting, 7 highlighted post 2009 high temps
AND
7 – 43C+ temps in the 1800s
Yep seems like a whole lot of the same old thing
But the most recent of those was 1882. No Stevenson screens.
No massive urban warming, either
No deliberate placement to catch the hot northerly winds and channel them onto the rapid response thermometer.
Recording second by second values, which mercury thermometers naturally allowed for.
And as Nick is well aware…
The red numbers are from a highly compromised urban site.
Still trying it on, hey Nick !
Why continue once you been exposed as disingenuous. !
You’ve shown the majority of Melbourne highs were prior to CAGW
Thanks for proving our point that CO2 is not the control knob
Temperatures to two decimal places?
LOL
What’s the uncertainty in those numbers?
Oh, I forgot, alarmists’ don’t bother with uncertainty values.
Sean Kelly’s article in the SMH is one of those rants that make readers dumber, at least one quote from UN secretary-general is apt: “this is madness”.
I couldn’t get past the box linking to a related article: “The hottest July in 120,000 years”.
“This month is likely to be the hottest July the earth has experienced in about 120,000 years after a series of lingering heatwaves seared the northern hemisphere, says one of the world’s leading climate scientists, Professor Michael Mann”.
Madness.
We only have reliable instrument measurements back to 1850. Satellite sounding data, which is much more variable and less reliable, and records the lower troposphere rather than the surface, goes back to ~1979.
Let’s just wait and see what they all say at the end of the month.
No, the surface data is NOT reliable..
It is highly tainted by urban expansion, changes in site, large increase in the number airport site, large decrease in the number of colder sites etc etc .
And the data manipulations in the agenda-driven fabrications are also highly dubious to say the least.
Only reliable data that isn’t tainted by an agenda, is UAH,
And it shows zero trend for most of the last 45 years except for two El Nino steps.
There is absolutely zero evidence of any CO2 or other human-forced warming in the UAH data.
Nail seems to think that the urban effect doesn’t exist for some reason. His ego prevents him from admitting he’s wrong even if it’s the most simple concept to understand. If it didn’t have an effect, why would the National Weather Service set these station placement standards?
https://www.weather.gov/coop/sitingpolicy2#:~:text=When%20possible%2C%20the%20shelter%20should,important%20for%20obtaining%20accurate%20measurements.
This may be the first time I have seen a mainstream newspaper in the UK acknowledge the urban heat island effect..
The i newspaper carried a report about the recent warmth on Monday 24th July 23 under the alarmist headline ‘Experts warn UK is dangerously unprepared for red hot summers’. By Daniel Capurro.
Full of the usual guff but just almost two thirds of the way in he writes
“further worsening the urban heat island effect, where cities can be as much as 7C warmer than the surrounding countryside”
That’s probably as honest as it’ll get as far as acknowledging the UHI. I’d bet that if we had only good sites measuring then we’d still be below 1C.
Dave,
In 2018 I summarised a lot of work on UHI in a WUWT article.
One sentence reads “From the satellite based work of Youn-Young Choi et al. there are time-of-day effects that make Seoul, Korea seem some 8°C hotter than its surroundings and Tokyo about 10°C hotter, as the largest of the observed effects.”
In poker terms, I see yopur 7 deg and raise you to 10 deg.
https://wattsupwiththat.com/2018/12/20/the-science-of-the-urban-heat-island-effect-is-pathetic-and-misleading/
Geoff S
It doesn’t matter how loud you shout. The truth always outs.
The chart attached shows the history (to date) of the huge adjustments made to the UAH lower troposphere data set. They far outweigh the surface data adjustments. Yet you guys cling to it like it’s gospel.
Reliable?
Por Foolish Nitwit.
These are SCIENTIFIC adjustments
… very different from Agenda-based non-scientific adjustments
But it has been confirmed over and over again…
that you are totally clueless about what science is.. and isn’t !
“Yet you guys cling to it [UAH data] like it’s gospel.Reliable?”
The UAH data correlates with the weather balloon data. Are you saying the weather balloon data is no good?
What do you think they’ll say Rusty? Even if it eclipses a record, does that really prove CO2 as the main driver in the warming? If you think it does, you’re sweeping under the rug the 1997-2014 pause despite all the CO2 that went up into the atmosphere during that 18 year period.
No, it might just be a huge coincidence.
Might you be sweeping under the rug all the evidence that the IPCC, etc have presented concerning the fact that natural variability in global weather systems can temporarily mask the underlying warming from greenhouse emissions?
You know you have no scientific evidence that enhanced atmospheric CO2 causes warming
I suppose that is why you stick with baseless innuendo, conjecture and model-based mantra…
It seems to be all you have.
Show us “all this evidence” from the IPCC.
You have never been able to show us any before.
It is as though YOU KNOW THERE ISN’T ANY !
Pat Frank shows that the uncertainty bars for the global trend are far greater than the supposed trend:
“Finally, the 20th century (1900–1999) GSATA, 0.74 ± 1.94 °C, does not convey any information about rate or magnitude of temperature change”.
Then Pat Frank needs to get that insight published in the reputable peer reviewed literature.
Seems to be a stumbling block for Pat, for some reason….
Understanding basic maths will always be way too hard for you, Foolish Nitwit.
There is very little in the way of “reputable” literature from the “climate science” arena..
Anything reputable gets blocked by the AGW gatekeepers.
You do understand what journal peer-review is for in “climate science”, don’t you…
… you don’t actually think it is anything about actual Science, do you?
Or are you really that naive!
So Climate Scientologist Michael Mann is making an unsubstantiated claim?
I’m shocked, shocked I tell you.
http://www.assassinationscience.com/climategate/1/FOIA/mail/1047388489.txt
Remember this email? The next time someone argues in favor of ‘peer review’, refer them to this. Phil admitted that he didn’t even read the paper and still advocated for a witch hunt.
In what sense?
I lived in the Coachella Valley (Palm Springs and further east) for years and the summer temps routinely topped 110F up to 120 and slightly beyond. It’s a retirement area with older people doing just fine in the summers.
I just talked to a friend in Peoria Arizona (west of downtown Phoenix) and she and her son and grandson were out today shooting in the afternoon. Everyone survived/sarc
“were out today shooting in the afternoon. Everyone survived”
Good!
They missed each other.
Lots of Americans own guns. Very few seem to be properly trained in how to use them.
An unsubstatiated assumption. I think I see a trend.
As long as you can still go out and shoot, everything will be ok.
It would be quite nice with temperaures like that, here in Scandinavia. We have been struggeling with temperatures around +16°C during day and in someplaces below +10°C during nights for several weeks now. This time of year, we usually have above +20°C most of the day. (2 m above ground, not surface …)
Who’s calling for the shutdown of “Western civilisation”, Eric?
OMG.. you haven’t been listening to your cult masters again.. naughty little boy !
Please try to at least read what your masters in the GW religious cult are saying.
Do you or do you not support Net Zero by 2050?
Because absent several miracles, Net Zero can only actually be achieved by shutting down Western Civilization.
I think it’s ridiculous, since you ask.
It’s a political slogan. They have no intention of reaching net zero by 2050 and already they are moving away from the notion; including the Labour Party here in the UK.
We should do it; but there is zero chance of it happening because of politics.
“Who’s calling for the shutdown of “Western civilisation”, Eric?”
No alarmist politician is calling for it out loud, but their actions are bringing about the destruction of the Western world, if they are allowed to continue down the Road to Ruin they are taking us.
Is your electric bill higher or lower than in the past?
Isn’t that because gas prices have risen, Tom?
Gas being a fossil fuel.
No, the main reason for electricity price rises is the infection of grids by unreliable suppliers. ie wind and solar.
When they go missing in action, which they very often do, someone has to provide the electricity..
It costs a lot of money to have big electricity supply equipment sitting around doing nothing for those periods when wind and solar are providing nothing.
It would be far cheaper just to have a system that was able to run 24/7 at its most efficient levels.
Wind and solar can never be part of such a system,
That would be my answer, too.
As a Canadian I am very envious of Australian weather. I’m hoping all those alarmists are right and we can get 5-10 degrees warmer.
The cold doesn’t bother you as much when you’re younger, but as you get into your 40s+ it can be quite difficult to deal with. I got pneumonia from the cold in my early 20s and I still have a weak lung that is quite susceptible to infection in the winter.
I was using my heat here in Colorado for most of June. Temperatures above 90⁰F in July feel like the surface of Venus now (we don’t have A/C). I can’t wait for the single digits again…
Arizona does not have a lot of wind turbines but Texas and California both have plenty.
Any Arizona resident worried about warming weather should be building a class action against Texas and California for robbing their air flow. The airflow from the Gulf of Mexico to Arizona has to negotiate energy robbing wind turbines in Texas while the flow from the North Pacific to Arizona loses energy to the Californian turbines.
The location of wind turbines is selected to take advantage of available wind resources. Robbing wind energy for coastal air flows reduces the advection of moisture from the ocean to land. The atmosphere requires the atmospheric water column to exceed 30mm for convective instability to occur. If the TPW is below that level then convective instability and resulting rain are not possible, That is the situation over central Australia during most summers leading to perpetual hot and dry conditions.
Nothing is free in this world. Wind resources across coastlines are highly precious resources. Robbing energy from that vital resource will have serious negative consequence for delicate habitat. It is easy to make deserts. Not so easy to make lush pastures.
TPW over Arizona currently 16mm. Same time last year it was 23mm. In 2021 it was 26mm.
https://earth.nullschool.net/#2023/07/25/0100Z/wind/surface/level/overlay=total_precipitable_water/orthographic=-111.89,34.52,795/loc=-108.087,37.201
Remove atmospheric moisture and ground temperature will rise substantially.
I can’t find it now but there was a study by one of the Polish unis which showed disrupted air flows in the wake of the windmills
Eric,
Apart from single day high temperatures, here is a quick summary of 3-day heatwaves for 8 of our cities.
…..
Here are the hottest of past 3-day heatwaves for eight biggest and/or most relevant cities.
Figures are in deg C as the highest average over 3 consecutive days of Tmax from the BOM climate data online site.
Adelaide 2014 44.3
Alice Springs 1891 45.8
Brisbane 1940 38.2
Darwin 1892 38.3
Hobart 1897 39.5
Melbourne 2009 44.2
Perth 1897 39.5
Sydney 1960 41.1
…
You can see that paradoixically, the hottest heatwaves are not in cities closest to the Equator. The hottest shown here are from Adelaide and Melbourne, with only Hobart being further from the Equator.
This is because typical hottest heatwaves forn in the continental centre, with Alice Springs as an example. The daily weather pattern drives hot air south to Adelaide or S-E to Melbourne. How hot it gets in these coastal cities depends on many things, including how hot the source near the centre was, how fast the weather system moved to the coast.
Note that many 3-day records were set in years way before the dread CO2 can be invoked. Geoff S
Forgot to mention that these temperatures have large uncertainties, like expressed conventionally as if a normal distribution apllied, should be more like (say) 40 +/- 2 deg C.
This means that there is not much difference between any of these number shown.
Geoff S
Greg, these:
Alice Springs 1891 45.8
Brisbane 1940 38.2
Darwin 1892 38.3
Hobart 1897 39.5
Perth 1897 39.5
Sydney 1960 41.1
if only for 3 days these would not have been classed as heatwave. With these dates a heatwave was for 5 days.
Times the change and we have just become a little delicate.
Geoff.. we know that by 2009 the Melbourne site was totally swamped by urban warming from concrete, tar and traffic etc etc…. The “heat wave” data is meaningless.
What was the Adelaide site like in 2014 ?
Seems the Kent Town site was moved in 2017/18 because the area had become a “built-up” area.
“Built-up” would be a euphemism for “urban warming affected” ?
Thanks Geoff. Like you say, no evidence of a climate crisis, just weather.
Organisations that deal in figures and percentages know a 1000 ways to dodgy them up to achieve the desired outcome.
The BBC has reported this here https://www.bbc.co.uk/news/science-environment-66289489
“Using computer models, they simulated a world without the effects of emissions pumped into the atmosphere to the real-world temperatures seen during the heatwaves.
The North American heatwave was 2°C (3.6°F) hotter and the heatwave in China was 1°C hotter because of climate change, the scientists concluded.
The world has warmed 1.1C compared to the pre-industrial period before humans began burning fossil fuels.”
”If temperature rise reaches 2C, which many experts warn is very likely as countries fail to reduce their emissions quickly enough, these events will occur every two to five years, the scientists say.
The study also considered the role of El Niño, a naturally occurring powerful climate fluctuation that began in June. It leads to higher global temperatures as warm waters rise to the surface in the tropical Pacific ocean and push heat into the air.
The study concluded that El Niño probably played a small part but that increased temperatures from burning fossil fuels was the main driver in the more intense heatwaves.” My emphasis.
Best line: “the appropriate response is to buy a bigger air conditioner, not to shut down Western civilisation.”
Have the climate fanatics nothing more interesting going on in their lives than being hysterical, talking nonstop about this topic, and wanted us all legislated into a cardboard box?
Meanwhile In Midwest USA…
“Our first heat wave of the summer begins today! And it’s honestly strange and unusual that we’ve had to wait this long, into late July, to see a stretch of 90+ degree days in a row.” -The News
Andrew
Climates warm and climates cool. Plants, animals, and humans will adapt. Wind and solar are expensive, unreliable, fragile, energy poor and environmentally wasteful. Worldwide, they will not replace fossil fuels.
The climate models are inaccurate, and even if CO2 was responsible for most warming, Western nations not using any fossil fuels would not stop the continued increase in CO2 emissions because other countries will not follow the West.
Fortunately, there is not a climate crisis. The politicization and takeover of science, tech, and media by the authoritarian Left is a crisis.
From “Beds are Burning” by Midnight Oil…..
Four wheels scare the cockatoos
From Kintore, east to Yuendemu
The Western Desert lives and breathes
In forty-five degrees