Steve Milloy
The claim that July 3-4, 2023 were the hottest days in the past 125,000 years is based on satellite data and computer modeling by the University of Maine’s Climate Reanalyzer. But there seems to be a problem with the Climate Reanalyzer.

The chart (above) is a screenshot from this morning. I highlighted the August 20, 2022 date because of what I tweeted below on that date.

My August 20, 2022 tweet from the Climate Reanalayzer shows that average global temperature anomaly on that date was -0.1°C.
But the screenshot from today, says the anomaly was 0.25°C — a 0.35°C difference. What happened? Is the Climate Reanalyzer reanalyzing temperatures to fit the narrative?
Tony Heller and others have spotlighted how data is being manipulated to advance the climate hoax.
Is that what the University of Maine is doing? Any explanation?
Read more about Global Temperatures and data shenanigans at EveryThingClimate.com
The increase in Antarctic temperatures is due to the weakening of the polar vortex in the lower stratosphere (it is strong in the upper stratosphere). The influx of water vapor over Antarctica means a loss of energy to the stratosphere, which sinks almost to the surface above the pole in winter. This is evidenced by temperatures below -60 C.
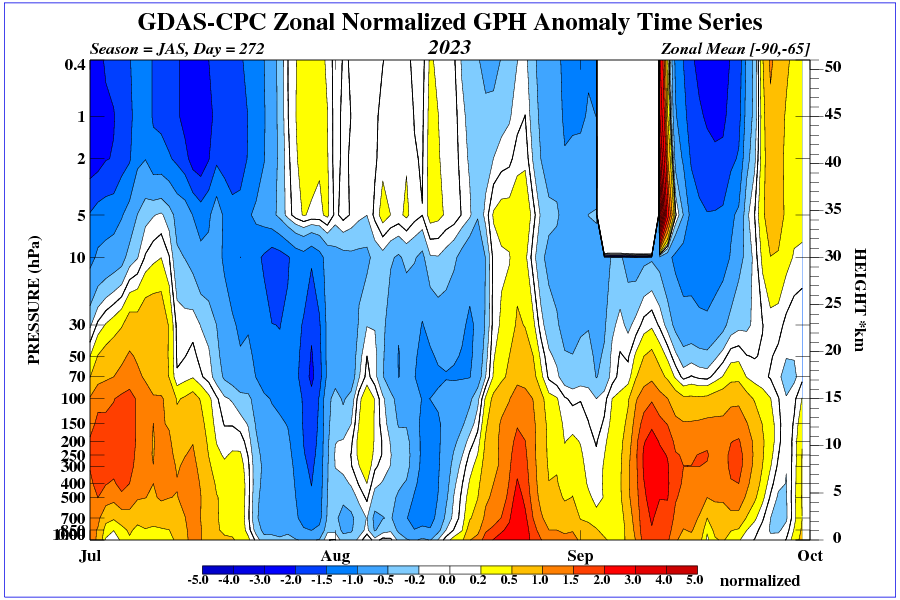
https://earth.nullschool.net/#2023/07/17/2000Z/wind/isobaric/500hPa/orthographic=-327.25,-82.36,490
https://earth.nullschool.net/#2023/07/17/2000Z/wind/surface/level/overlay=temp/orthographic=-327.25,-82.36,490/loc=118.227,-75.527
Satellites detect more water vapor radiation over the Arctic Circle.
Sorry, over the southern polar circle.
2m world temperature is just a fantasy.
Recent global record high temperature claims are also based on the ECMWF weather model, the ERA5 reanalysis that heavily uses the ECMWF wqeather model, and also the Japanese JRA-55 and JRA-3Q reanalyses that use weather models. These weather models have input from multiple sources, including radiosondes aboard weather balloons and weather station readings.
As for the single day of 8/20/2022 having global temperature .1 degree C less than averaged over 1979-2000: This is an example of a pattern by Steve Milloy, of cherrypicking a single day of the year, or one country combined with one or two months of the year, or for about 9 years of one of the 7 most major global temperature datasets having towards its start one of the two greatest El Nino global temperature spikes since the one of 1878 and towards its end a triple dip La Nina.
After seeing another comment, I saw that what Steve Milloy was saying is that CFSR reported a different figure for 8/20/2022 that day than they did recently. So, I noticed they used different datasets (CFSv2 now instead of the GFS weather model in August 2022).
Afier I saw a comment below about a figure for a date in 2021 being changed, I checked to see if the 8/20/2022 report and the recent report on 8/20/2022 use the same dataset. They don’t. The older report is based on CFSR using the GFS weather model, the newer report is based on CFSR using CFSv2. Meanwhile, the recent global temperature records are also according to the ERA5 reanalysis using the ECMWF weather model (which mostly works better than the GFS one).