Guest Post by Willis Eschenbach
PART THE FIRST – REAL WORLD
Well, my monkey mind started thinking about the relationship between how much sunshine is absorbed at the surface and the surface temperature. Here’s the CERES satellite data showing the relationship:

Figure 1. Surface temperature and how much solar radiation is absorbed at the surface. Radiation is in watts per square meter (W/m2).
As we’d expect given our daily experience, more sunshine raises the temperature and less sunshine lowers the temperature.
The question naturally arises—just how much does the surface temperature go up for each additional W/m2 of absorbed radiation at the surface?
We can approach this question in three different ways. First, here’s a scatterplot of the monthly values shown in Figure 1, along with the trendline.

Figure 2. Scatterplot, monthly surface temperature versus how much solar radiation is absorbed at the surface. Because there is uncertainty in the monthly averages, I have used Deming regression rather than standard linear regression.
The second way to calculate the relationship between the surface temperature and surface absorbed sunshine is by linear regression on a gridcell basis, weighted by the area of the gridcells. This gives us the same answer, 0.22 °C per each additional W/m2 of absorbed solar radiation.
The third way to examine the relationship looks at the long-term averages of both temperature and absorbed solar radiation as a scatterplot on a gridcell-by-gridcell basis. This allows us to see what is happening at different temperatures.

Figure 3. Scatterplot, gridcell averages, temperature versus average absorbed solar radiation. The slope of the red line shows the trend of temperature with respect to absorbed solar radiation at various temperatures.
There are several interesting things about this graph. First, over most of the earth (central region above), the relationship between absorbed solar and temperature is pretty linear, with an average trend (slope of the red line) being 0.21 °C per W/m2.
To assist in understanding this, here’s a graphic showing how much solar radiation is absorbed at the surface.

Figure 4. Surface absorbed solar radiation (downwelling radiation minus reflected radiation)
You can see the effect of the nearly continuous clouds at the Intertropical Convergence Zone (ITCZ) as a yellow stripe just above the equator.
To return to Figure 3, in the areas where there is little sunlight, the temperature increases very rapidly with increasing sunshine. Here is a map of where those areas are.

Figure 5. Parts of the world where the annual average absorbed solar radiation is less than fifty watts per square meter.
And at the right-hand end of the scale in Figure 3, surprisingly, in areas where average absorbed solar is above about 210 W/m2, increasing the absorbed sunlight doesn’t warm the surface much at all. The average response in the colored areas shown below is 0.03°C per W/m2. Go figure. Here are those locations.

Figure 6. Parts of the world where the annual average absorbed solar radiation is greater than two hundred ten watts per square meter.
The horizontal dotted lines above and below the Equator on the map in Figure 6 show the limits of the tropics. Note that most of the tropical oceans don’t warm much further in response to absorbed solar radiation increasing byond 210 W/m2.
And at the end of that, we have three different estimates of how much temperatures go up when solar goes up and go down when solar goes down. All three of them are on the order of a 0.2 °C temperature change for each 1 W/m2 change in absorbed sunshine. And all three show that temperature varies with absorbed sunshine, going up with more sunshine and down with less sunshine, just as we see every day.
PART THE SECOND – MODELWORLD
After I looked at what is actually happening, I thought I’d take a look at what the models say is happening. The model data is available at the marvelous KNMI website by selecting “Monthly CMIP5 scenario runs. These are from the Fifth Computer Model Intercomparison Project (CMIP5). The surface air temperature is identified as “TAS” (temperature air surface). Downwelling solar at the surface is “RSDS” (radiation shortwave downwelling surface), and reflected surface solar is “RSUS (radiation shortwave upwelling surface). The absorbed radiation is the downwelling solar minus the reflected solar.
I started with the temperature data. I was interested in the historical data, which is essentially identical for the four “Scenarios”, yclept RCP26, RCP45, RCP60, and RCP85. I used the RCP26 data. The historical data ends in 2012. Here’s the CMIP5 mean global historical surface temperature reconstruction compared to the Berkeley Earth global surface temperature.

Figure 7. Berkeley Earth and CMIP5 model temperatures compared.
Well, that’s pretty respectable. The models have done a decent job of emulating the major changes in the historical temperature. (It does bring up the question of how different models with widely differing climate sensitivities can all hindcast the temperature so well, a question I discussed in “Dr. Kiehl’s Paradox” … but I digress.)
Having done all of that, I went to look at the modeled absorbed solar radiation … and my eyes bugged out of my head. Here’s that modeled result. As with temperature, the solar results are basically identical for the four scenarios, so I’m showing RCP26.

Figure 7. CMIP5 RCP26 historical surface absorbed solar radiation anomaly.
YIKES! Temperatures are going up and absorbed sunlight is going down? Say what? How unbelievable is that?
But wait, as they say on TV, there’s more! Here’s the same RCP26 solar data, this time including their projection of absorbed solar at the surface out to the year 2100.

Figure 8. CMIP5 RCP26 historical and projected surface absorbed solar radiation anomaly.
It’s … curious. Modeled surface absorbed solar is decreasing over the historical period all the way right up to 2012, and then it immediately turns around and starts increasing.
Probably just a coincidence.
But consider … if they somehow get rising historical temperatures with falling historical absorbed solar radiation, think of how high their future projections will be with rising absorbed solar radiation. It’s a win-win situation for the alarmists!
And how come I’m the guy who notices these things and not the good folks running the models or the people at CMIP5?
Always new questions.
Here on the northern California coastal hillside where I live, we are in the midst of an all-too-frequent occurrence … Pacific Gas and Electric, aka PG&E, can’t keep the electricity on. Once again, we’re out of power. Sigh. I just fired up my reliable fossil-fuel-powered Honda i2000 generator, strung the extension cords, and I’m back in business.

But never fear, the geniuses running California have a brilliant solution for the endless outages, brownouts, rolling blackouts, and power shortages.
You ready for their plan? Here it is:
- Increase even further the amount of unreliable, intermittent renewable wind and solar electric generation
- Jack the already outrageous ($0.34/kWh) electrical prices even higher to discourage demand
- Increase the grid load by banning the sale of gas-powered lawnmowers, leaf blowers, garden tractors, chainsaws, etc. by 2024
- Increase the grid load further by banning the sale of gas-powered generators like mine shown above by 2028
- Close the one remaining nuclear power plant, and
- Drive the load on the grid through the roof by forbidding the sale of gas-powered vehicles after 2035 …
Yeah, that’s the ticket. That’ll reduce the brownouts, rolling blackouts, and total outages. Plus it will screw the poor today, but hey, we’re helping the poor in the year 2050 and saving the world, so it’s all for the best in this best of all possible worlds …
Buncha fricken’ rocket surgeons, alright.
My best to all,
w.
You know it but I still gotta say it: When you comment, please quote the exact words you are referring to. This makes everything clear, and avoids the misunderstandings that seem to proliferate on the intarwebs.
Figure 4 would be more interesting to split the response between water and land. Most of the heat going into water produces water vapour so there is lower response in temperature to absorbed solar.
California doesn’t fool around. But then neither does Colorado. This just in from Colorado Public Radio’s web site:
Shocked.
One day there will be a federal, state, city and township – and parking meter – holiday for the final debunking of the global warming myth. We will be free.
“And how come I’m the guy who notices these things and not the good folks running the models or the people at CMIP5?”
Perhaps they are using Mike’s Nature trick to hide the decline
Zhang and Rossow’s paper “Global Radiative Flux Profile Data Set: Revised and Extended” showed that downwelling shortwave radiation has been increasing since their measurements begun, early 1980’s.
According to this paper, downwelling shortwave radiation has increased by about 3 watts per squ m.
Using Willis’s calculations this means a warming of .6C since early 1980’s. There is also a cooling from an increase in outgoing longwave radiation.
UAH global temperature data set shows a warming since the early 1980’s of about .5C.
Thats pretty close.
Brilliant as always!
Explains temperature development in Sweden due to increase in sun due to less clouds and the lack of summer response (over 220 W/m2) Your figure 3.
Is this just a coincidence? https://www.bbc.co.uk/news/science-environment-65948544
Or this
both taken in the uk
the sunspots three days ago
the prominence three weeks ago.
Hi Willis. Can you tell me where you got the temperature data for Figures 1, 2 & 3, please?
I’ve used a Stefan-Boltzmann conversion of the CERES upwelling LW data. I’ve checked it against the other surface datasets, and it agrees with them about as well as they agree with each other. So I use it by preference because it is in agreement with the other CERES datasets.
For example, here’s CERES cloud radiative effect scatterplotted against first CERES and then Berkeley Earth surface temperatures.
For the kinds of anayses that I’m doing, the small differences are immaterial.
Regards.
w.
Points arising:
1/ The Sputnik says absorbed solar is decreasing.
How it knows that is, short of StarTrekTechnology = a mystery. Unless it’s doing a really simple Albedo measurement.
So if we go with that, NASA are saying that Earth is getting ‘lighter in colour‘
Well that’s easy to do:
So which is it?
You know which one I go for as it explains rising sealevels, reducing length of NH growing season hence = rising CO₂
i.e Soil Erosion.
We all know that ‘bone dry’ fields. gardens, roads, yards, roofs and bone-dry everythings are lighter in colour than ‘wet things’
That explains the rising temps dry things don’t have the ‘heat mass/inertia’ that water gives things – so when the sun comes out the heat faster and so to higher temps.
It’s well known about – the really clever people call it “Aridification”
I call it Desertification.
2/ To my mind it’s more obvious than a ReallyObviousThing that NASA are trying to implicate green house gases as the warming agent.
C’mon, how can absorbed solar be going down and temps go up. The thing (Earth) that’s warming MUST be getting energy from somewhere and GreenHouseGases are the only possible answer in these modern times.
3/ Willis does us a nice little graph (his Fig. 3)
How that divvies up into its 3 sections is quite simple.
The left hand part, the really steep bit at less that 50W is where water has become ice.
So we’re right back onto the Albedo trail – snow/ice have an Albedo of 80% – compared dark soil at 10% and deep clear water at 6% (normal incidence)
The middle bit made a nice comparison with my ‘all water world’ Excel model.
In my model and for latitudes below where water freezes (60° latitude) – the average temperature response in my model is 0.18 degrees Celsius per Watt
And the sensitivity rises above 50 degs latitude but not as much as my simple model doesn’t allow water to freeze.
The right hand part where things level off is seen in my model and in The Real World and as noted many times by TheManHimself = that deep water never gets above 31°Celsius.
This drops straight out of a Stefan radiation calculation.
i.e. That on a spherical object at the equator, the average solar power over a 12 hour day is (after Albedo of 0.06) = 914Watts/m²
To be in equilibrium, the water must radiate away half that much over 24 hours, via an emissivity of (say) 0.95
(you work it out)
4/ The really awful bit coming out of the 0.2°C per Watt of absorbed energy.
Everyone is gonna leap up and down, especially his Ludship Monckton and yelling about Equilibrium Climate Sensitivity (ECS) – and There It Is – Willis and The Sputnik have found it.
The trouble with ECS is a guy called Carnot and = why Climate Science is such an awful mess.
Because all Watts per Square Metre are not equal.
It is that when Energy heats an object/substance/gas, it is imparting mechanical energy to the molecules/atoms of that substance = the very definition of any/all Heat Engines
Hence, to calculate a heating effect, you need to account for the temperature of where the energy is coming from and the temperature of the object absorbing that energy.
For the sun, the calculation is almost trivial because the sun is so hot = the Carnot Efficiency is over 95% – meaning that for objects on Earth almost all the solar energy becomes = heat (higher temperature)
BUT EVEN THEN – where is that 95% figure in any of climate science? It’s important when we’re quibbling about a few fractions of a Watt
But for the supposed Green House Gases – they are not coming from an object of 5,700 Kelvin, far from it.
Run an example, as per Tyndall’s experiment.
Tyndall used boiling water as his energy source and his temp reference and why not, it makes his experiment repeatable
Tyndall’s absorbing object was the gas in his test chamber and it would have been at what – maybe 20°Celsius?
So the Carnot Efficiency then would have been 21% in Tyndall’s experiment using boiling water
So to get the same heating effect from as we do from El Sol, we would need 95/21 = 4.5 times more Watts per m²
IOW To get the same effect using boiling water rather than El Sol would require 4.5×0.21 watts per m²
call that = 1 Watt/m²
And that’s using boiling water – NOTHING in the atmosphere is that hot
Lets run a Santa Ana wind over a glacier
Santa Ana = 35°C
Glacier = minus 10°C
Carnot efficiency would be then = 14%
i.e. The wind really got it’s work cut out to inflict anything much upon the glacier
Foe Climate Science it gets impossibly worse.
Because of Lapse Rate meaning all parts of the atmosphere are always colder than anywhere below that part, the Carnot efficiency becomes negative
Lapse Rate and Carnot make an utter mockery of the GreenHouseGasEffect
edit/reply to PS
Back to my Excel Water World
I divided the globe in strips of equal latitude then worked out some sines and cosines to get the average (over 12 hour) absorbed energy, hence what needs to be radiated away over 24 hours.
You can do this because ‘water stores energy’ – the temp drop of 100 cubic metre of water overnight would be about 0.05Celsius
I then did a brute force integration, working out TempxArea, summing those and dividing by the total area
I got a global average temp of 10.5Celsius – using an albedo (water) of 0.06 and emissivity of 0.95
(My earth has no atmosphere = no clouds and why not, CliSci says earth;s atmosphere is transparent and you don’t get more transparent than = not there)
The really laughable thing is when I ask Excel for a simple average of the Watts/m² power – it tells me 303 Watts/m²
Doing it properly gets a warmer Earth (10.5C vs minus18C) for less power (303 vs 340)
What a total joke it all is.
Reply reply…
Hopefully it dawns on why clouds(esp), supposedly ‘reflecting heat’ back to the ground/earth/surface would have no effect.
And why putting a mirror or shiny foil near warm objects does not stop them cooling.
It comes straight out of Carnot that the warm object, via the mirror/foil/clouds is radiating upon itself – so the source temperature and the absorbing temperature are the same.
The Carnot Efficiency thus becomes= Zero
i.e. The object radiates energy and that energy can not come back
Josef Stefan said exactly that when he that that “Objects radiate according to their own selves – what any other object anywhere does is irrelevant”
Sorry, all that shiny stuff inside your Thermos Flask DOES NOT work by ‘reflecting heat’
Clouds in the sky don’t do it neither.
They can and do reflect solar energy because : It is hot so it can be reflected onto a cooler object and be absorbed there.
Clouds on Earth do not affect the temperature of the sun – the GHGE says they should
The optimist thinks that he is living in the best of all possible worlds. The pessimist fears that he may well be right.
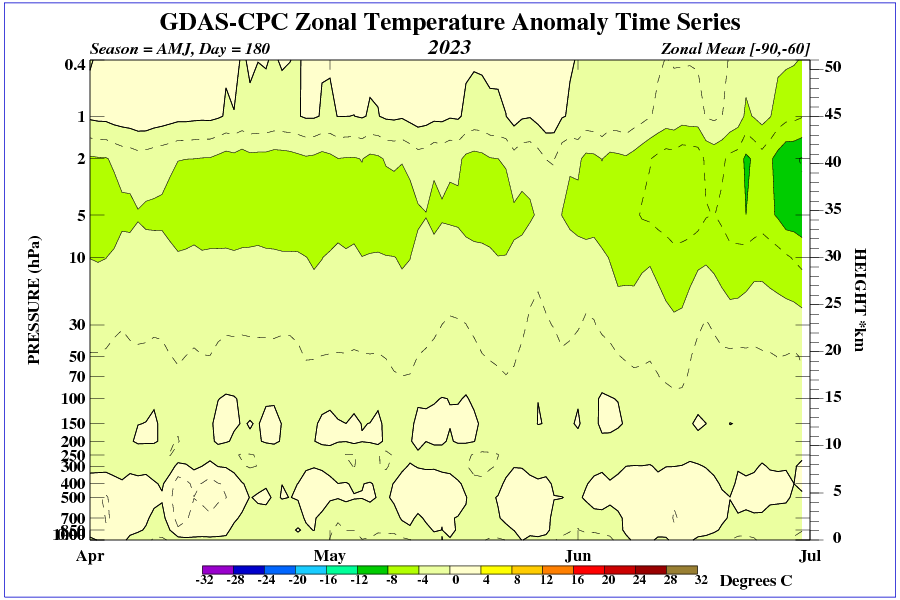
Low temperatures in the upper stratosphere over the southern polar circle.
Willis, if I am understanding your writings correctly, adsorbed solar is inversely proportional to cloudiness as in Fig 1 and cloudiness has been declining in recent decades, hence higher temperature. If cloudiness is declining, then so must be humidity and climat4you.com shows declining humidity at all tropospheric elevations in recent decades. So far, so good. But why is humidity declining? Isn’t CO2 supposed to increase temperature and humidity?
The Earth’s troposphere is very thin. Water vapor decreases and causes strong surface heating, especially when the jet stream weakens and stationary highs form.

The opposite is true in winter, the surface temperature in stationary highs decreases rapidly.
I think Willis that you have made an absoloutely huge discovery, for which all credit is due. Why does the surface appear to absorb less energy at higher temperatures? Your plot (long-term averages of both temperature and absorbed solar radiation) is the key, because it shows what happens when there is more water vapour in the atmosphere, water is the temperature controller for the Earth. It would be interesting to do a similar plot of average humidity against energy absorption, or particularly a surface 3d plot, and I think you have the evidence against all of the modellers. They forgot the water!
Clouds control the temperature of the Earth. The amount of clouds depends on the amount of sunlight striking the wetted surfaces of the planet. Why the control hasn’t been tighter than a degree in the last century is what is elusive.
Why does my old car wander its way down the road? Why the control isn’t tighter is elusive. No control system is perfect, there is always some slop due to tolerances and hysteresis. The earth’s temperature is much the same.
For those confusilated by bdgwx’s bizarre idea that everything is a “free parameter”, I can do no better than to cite Freeman Dyson on the subject. Click on the image to enlarge it.
w.
I think you have me confused with someone else. That is not my idea nor do I support it.
“I think you have me confused with someone else. That is not my idea nor do I support it.”
Really? Then why did you say:
” If it can only be determined via experimentation then it is a free parameter.”
*Everything* is determined by experimentation. Measuring the length of a 2″x4″ board is an experiment. There are many ways to actually do it. You can use a measuring tape. You can use geometry/trigonometry by comparing it to the height of a known (ask a Boy Scout how to measure the height of a tree). You can stand it next to something whose height is known. These all result in experimental results.
But the height of the board is *not* just ASSUMED hoping it will fit in the stud wall you are building!
Willis says
“ surprisingly, in areas where average absorbed solar is above about 210 W/m2, increasing the absorbed sunlight doesn’t warm the surface much at all. The average response in the colored areas shown below is 0.03°C per W/m2. Go figure. Here are those locations.”
My impression is that those areas are ocean, and so, depending on the spectral W/L of the surface TSI, some of said energy goes below the surface, and is transported to other regions before returning to the surface. A change is solar spectrum here could have very slow but long term effects in earth’s energy budget.
I have speculated that this help’s account for why the oceans are, on average, warmer then the land surface.
In the likely futile quest to get bgdwx to wake up, let’s consider this note about a tunable parameter in the GISS ModelE climate model:
So when temperatures are not “reasonable”, which is to say they exceed some tunable “boundary temperatures” parameter, they are simply reset back to the temperature of the previous timestep.
How do we know that these “boundary temperatures” are tunable parameters?
In part, because they have no counterpart in nature.
They don’t exist in the real world. They are not something we can design an experiment to measure, like we use experiments to measure the value of G, the gravitational constant. They can’t be measured, because they don’t exist.
Finally, I draw bgdwx’s attention to something he might have missed in Dyson’s story about Fermi:
Clearly, Fermi and Dyson did NOT share bgdwx’s crazy idea that every physical constant is actually a free parameter in disguise …
w.
Sure why not. What it is doing is solving for the virtual potential temperature and specific humidity in the PBL using inputs from a restart or initialization file using the PBL model developed by Cheng et al. 2002 which I’ll call CCH. Based on my cursory read of that model the code looks reasonable. The tcheck subrountine checks the temperature profile of the PBL for consistency with the ground temperature. If there is an inconsistency it morphs the CCH computed profile into one that is consistent with the ground temperature. You might be wondering how an inconsistency might arise. The CCH model could have deficiencies (the authors even say as much) or more to the point of the comment in the code it could be that the inputs given to ModelE were themselves unreasonable. In some configurations ModelE operates on a 1+ million cell grid mesh meaning that it is very likely that one of the inputs into the CCH model was in fact unreasonable which would cause an unreasonable output. Given the extent of the spatial domain I think it is impractical to halt the model run as it seems likely that at least one of the inputs would always be unreasonable. And when you see how the correction is applied it make sense. You could probably argue that there are better alternatives to a linear interpolation. But that would also come at the cost of increased computational complexity. Again, maybe it’s because I’m programmer that deals with issues like these on a daily basis. I don’t know. All I can say is that there is nothing offensive to me regarding the code. Would I want to do it differently? Yeah…probably.
It looks like Fermi and Dyson’s ideas are consistent with my own. And as I’ve said repeatedly I don’t think every physical constant is a free parameter. I’ve even given many examples of ones that are not, why they are not, and why you want to avoid them if possible.
Willis, you might get a better correlation between surface temperature and solar energy absorbed by examining only a one degree area of the earth’s surface on a monthly basis. Then take a random square to compare to see how the results hold.
I really dislike this averaging of annual temperatures (GAT) and insolulation values as it requires introducing fudge factors from biased sources. The lack of uniform temperature collection points and homogenezation techniques to make up for that lack requires introducing a bias. In addition, the gradual daily change in obliquity creating the seasonal change in insolulation would demonstrate the global consistency of this effect on all the other one degree squares. In short we would expect to see NH and SH squares act the same given the same insolulation value in their respective season regardless if it is over land or water.
From this, the AGW crowd would have a very difficult time of explaining away the solar connection to surface temperature.
As usual, things are more complex than they seem at first sight …
w.
Interesting, could you show just the absorption only?
Figure 4 above.
w.
Annual absorption is the same at the equator and the polar regions?
Are clouds and ice having the same effect?
Sunshine hours have definitely gone up here, notably since the AMO shifted to its warm phase from 1995:
Thanks, Ulric. I need to do a post on that question.
w.
Please do, I look forward to it.
Willis, great post, thank you.
From the dataplots we can see a lot of variation in time of the surface temperature and of the absorbed solar radiation, figure 1.
Also there are data points deviating from the trend line in figure 2 :
Temp = trend*Sol+m
If the atmospheric carbon dioxide concentration have any influence on the surface temperature then we can do an extended trend analysis like in :
Temp = trend_b*Sol+trend_c*CO2_Conc+m_b
What will the statistics tell about the two trend figures?
Kind Regards
Anders Rasmusson
Thanks, Anders.
The problem with that plan is that the change in CO2 forcing is basically a straight line. As a result, it will be assigned a large importance in any dataset with a trend.
Here, for example, is temperature as a function absorbed solar plus CO2 forcing, as well as temperature vs absorbed solar plus time of absorbed solar (a straight line). “allt2” is temperature, “absol” is absorbed solar, “coforce” is CO2 forcing.
And here is the same, but using the timeline in place of CO2 forcing
As you can see, almost no difference in significance (p-value, listed as “Pr(>|t|)” or R-squared. It’s a recurring problem with trying to assign causation to CO2 forcing.
w.
Ok, thanks a lot. Just to compare those statistic figures, it would be interesting to also see the corresponding statistics for the simple : Temp=trend*Sol+m
We got trend=0,22 °C/(W/m2) from your post. What about R-squared and the other statistics?
Kind Regards
Anders Rasmusson
Willis wrote: “my monkey mind started thinking about the relationship between how much sunshine is absorbed at the surface and the surface temperature. Here’s the CERES satellite data showing the relationship”
Well, Willis, maybe your “monkey mind” should run some of these ideas past a physicist before you post them, in order to look like slightly less of an idiot. Your “monkey mind” does not know what either “sunshine”, “temperature”, or “absorbed” means, so you trying to explain how these quantities are related at the surface by means of satellite measurements is not going to enlighten anyone about anything. While we are at it, where are the error bars?
You probably forgot that two gentlemen much smarter than you have already thought about these relationships, and they developed a law of physics that describes them. It is the Stefan-Boltzmann radiant heat transfer law, and the two gentlemen are of course Stefan and Boltzmann. Interestingly, what they found is that radiant energy transfer (and power is a measure of the rate of this transfer) depends on the temperatures of the two objects concerned, not the other way around.
So “°C per W/m2” is backwards. Just like your monkey mind…
Steve, were you born an arrogant ασσhole, or did you have to practice? Let me suggest that you dial back on the aggro. I suspect you’re a smart guy, but you’re sure doing your best to dispel that impression.
And why the anonymity? Got something to hide? I find that folks without the courage to sign their words are far more likely to indulge in your style of nasty personal attacks, because their words can never come back to haunt them or be recognized by people who actually know them … how about you stand up like a man and take off the mask?
To return to the issues in question, I gave the source of the data that I used. It’s at the bottom of the graphic. It’s the CERES EBAF 4.1 dataset. If you’d taken the trouble to look at it rather than jumping to attack me based on your misconceptions, you’d have seen that It includes both surface downwelling and surface reflected solar data. Here’s a list of the available datasets.
The difference between the CERES “Surface Shortwave Flux – Down” and the CERES “Surface Shortwave Flux – Up” datasets listed in the graphic above is the surface absorbed solar flux.
But then, you’d have known that if you’d done your homework.
If you think the CERES folks don’t understand what either “sunshine”, “temperature”, or “absorbed” means, I strongly suggest that you take it up with them …
As to the S-B Law, sure, I’ve used it for decades. Not sure what your point is there. If you’d quote what I said that you think contravenes the S-B law, please quote my exact words and I’m happy to discuss it.
w.
PS—Literally hundreds of physicists have read my work. When they’ve had objections, which naturally happens, we generally discuss them like gentlemen.
Let me invite you to do the same.
Willis, I am not anonymous. I cannot get WordPress (since the login system was implemented) to show my full name, no matter how I try. Others seem to have the same issue (not everyone, but a few people). But I do have a full name. It is Steve Keppel-Jones. You know, one of those pesky guys who keeps pointing out your constant physics errors? I am not hiding anything, because I take care to write only true physics statements, unlike you.
Remember, I tried to discuss your physics errors like a gentleman, but guess what I got in return? Logical fallacies, name-calling (“pond scum”, “pig”, “horse”, etc.), psychological projection, and finally, your favourite word, “Pass”. That is not how scientists discuss science, Willis. Are you sure I am the a$$h013 here?
I have tried to point out your errors many times. Many others have too. Every time, we get the same idiotic responses from you – “but the scientists said so”, “why would they lie”, “you’re wrong but I’m not going to tell you why”, “Pass! Pass! Pass!”, “Pig”, etc. You do not get to claim the moral or scientific high ground here, Willis. Especially for a guy who hasn’t studied physics in 50 years, at barely a first-year university level, spent all of the intervening time fishing, good for you, and whose information was apparently already 50 years out of date back then!
I would like to know which physicist agreed with your oft-repeated claim that SURFRAD scientists have measured positive downwelling longwave IR at the surface at night, many times, all over the world. I need to have a chat with whoever that guy is, because he’s wrong, just like you. And it is easy to show that directly, from first principles. You don’t know what those principles are, so naturally you can’t defend your own point, but if you know of a physicist who thinks he can, I’d like to talk to him.
I am not taking any of CERES’s errors up with the CERES folks because what they do is their business, and they are not paid to tell the truth any more than the SURFRAD folks are. They certainly won’t listen to me. But when you post their bad ideas and data here, uncritically, you are continuing to support folks involved in “one of the most arrogant, least scientifically supported naked power grabs in all of history”. The power grab you described as being run by people who “don’t have your best interests at heart” and therefore you shouldn’t “buy into it”. All of that is true. Yet here you are, once again buying wholesale into their nonsense and promoting it for them.
If you want to measure downwelling shortwave radiant energy at the surface, or surface temperature for that matter, why would you use a satellite? It’s not at the surface, is it? What physicist told you that this would be a good idea? Therefore “surface shortwave flux – down” and “surface shortwave flux – up” measured from a satellite are just guesses, and there’s a whole atmosphere in the way too, so they’re not going to be very good guesses at the best of times. They can try to “adjust” and “correct” for all those problems, but the more “adjustments” and “corrections” they add, the bigger the error bars get. Where are the error bars, Willis? I’m sure you know that error bars are a critical parameter of any physical science endeavour. But you (and apparently CERES) left them out. Why?
Of course, one of the things that real scientists (as opposed to you or the “climate scientists”) need to be able to do is to choose the correct instrumentation and experimental setup for the question at hand. A question about what’s happening at the surface is, of course, best answered by instruments at the surface. I recommend a pyranometer and a thermometer sitting on the ground, the same way SURFRAD is set up. Instead, you are trying to answer SURFRAD-type questions with a SATELLITERAD-type experiment. Bizarre… but not totally unexpected when a fisherman gets involved in physics, I suppose.
You claim that you know what the S-B law means, but you obviously don’t, otherwise you wouldn’t write “°C per W/m2”. (Indeed, your entire “Steel Greenhouse” farce shows that you have no idea what the S-B law says, or why it says it, never mind what “radiation”, “power”, or “energy” mean, or how they are related to each other. Remember when I asked you to define all those thermodynamics terms in your own words? You said “I’m not defining those words for you! Bugger off! Pass! Pig wrestling! Lead a horse to water but you can’t make him think!” – slightly paraphrased, but extremely unscientific, arrogant, and ignorant of you all the same. And the question still stands) Anyway, the S-B law says the relationship between temperature and radiant power transfer is the other way around from what you wrote – i.e. radiant power transfer depends on temperature. Meaning, W/m^2 per °C. Why not write these relationships correctly instead of backwards, the way the arrogant and scientifically unsupported “climate scientists” do it?
stevekj July 1, 2023 12:48 pm
Thank you. I’ve never heard of that happening, so I made an incorrect assumption. You have my sincere apology for me thinking you were deliberately hiding your name. Clearly, I was 100% wrong.
As to the rest? Sorry, not interested. Go bother someone else.
w.
Willis wrote: “Sorry, not interested.”
And, that would be why folks who know their physics call you an “idiot” instead of a “gentleman” or a “scholar”. You could learn some real physics, you know. I am quite sure of it. But definitely not with an attitude like that.
Nope. I’m not interested because you say ridiculous things like this:
“Anyway, the S-B law says the relationship between temperature and radiant power transfer is the other way around from what you wrote – i.e. radiant power transfer depends on temperature.”
You say that temperature does NOT depend on radiant power transfer. In other words, your claim is that an increase in radiant power transferred to the earth’s surface does NOT increase the temperature … in other words, you are saying that increasing sunshine doesn’t warm the earth.
The S-B law says:
Radiant power transfer = σ ε T^4
Where σ is the S-B constant, 5.67e-8, ε is emissivity, and T is the temperature in Kelvins.
So yes, you’re correct. Radiant power transfer does depend on temperature.
But we can solve the equation for T, which gives us
T = (Radiant power transfer / (σ ε))^1/4
So while radiant power transfer is indeed a function of temperature, temperature is also a function of radiant power transfer.
And I simply can’t deal with that level of ignorance.
For example, lots of scientists have looked at my “steel greenhouse” post. You’re one of the very few who seem to misunderstand it and claim that it violates thermodynamic laws.
For folks not familiar with my work on the question, see my posts “The Steel Greenhouse” and “People Living In Glass Planets“.
If you (or stevekj) think you’ve found an error in either of those, please quote my exact words and show (demonstrate, not simply claim) why my words are incorrect.
w.
Oh and another thing occurred to me. When you wrote “PS—Literally hundreds of physicists have read my work. When they’ve had objections, which naturally happens, we generally discuss them like gentlemen.”, did you mean to write “hundreds of climate scientists“?
Because no actual physicist who has passed an actual physics exam would sign off on anything you have written about thermodynamics, or quantum mechanics for that matter – it is all wrong. Every word of it that I’ve seen, in several different forums, for many years. And you are completely impervious to being corrected, by me or anyone else who knows better – hence my slightly acerbic tone. There is no point in being gentlemanly with someone who is as arrogantly ignorant and closed-minded as you are. I tried. Many others did too. And I am very polite with people who are willing to learn, like Ferdinand Engelbeen for instance. I corrected his misconceptions about thermodynamics politely, over the course of many days. Eventually he saw that his previous view (the same as yours) was false, because it led to an obvious contradiction. You’re not smart enough to get that far, sadly. And certainly not for lack of trying on my part, heaven knows.
(To be fair, you wrote one correct thing once, when you said “electromagnetic radiation is a form of energy”. But you only wrote that once, that I saw, and nothing else you wrote is consistent with that statement – and when we pressed you to explore the consequences of this statement on the rest of your false physics, you naturally refused, perhaps hazily glimpsing a glaring contradiction off in the distance waiting to horribly embarrass you. So I am fairly sure you only got that one right by accident.)
But, to return to my main point here, climate scientists are not physicists, Willis. The field of “climate science” bears approximately the same relationship to physics as astrology bears to astronomy. They use the same words, yes, but they use them in completely different (and generally wrong) ways. And even that is probably being unfair to astrologers.
This may seem, on the surface, astonishing to a fisherman or a cowboy, who is not used to thinking that all the fish or all the cows are somehow lying en masse, but remember, climate scientists are not in the business of selling the truth, in the way that, say, a university physics professor is. They are in a different business. They are in the business of selling “one of the most arrogant, least scientifically supported naked power grabs in all of history” (those are your words, in case you forgot already). There is no place for truth in that endeavour. None. In fact the truth would be highly counterproductive for them. That’s why WUWT exists at all. And because they are government employees, no one in any position of authority is going to grade them on their work. Except us here on the internet. Well, not you, obviously. But some of the rest of us who do know our physics, anyway.
So someone around here who is more creative than me coined the phrase “climate fiziks” (or some similar variation) to refer to what they are doing. It is not physics. Do not confuse the two. And please do not insult actual physicists by referring to “climate scientists” as “physicists”.
Steve, you’re free to keep believing that if it helps you to sleep.
Me? Not interested. I’d strongly advise you to try out your line of patter on someone else. It doesn’t work with me.
w.
“It doesn’t work with me.”
I know that, Willis. I’ve tried to educate you before, as have many others, with the same result. They do call it insanity when you do the same thing over and over and keep getting the same result. And maybe trying to teach you physics is insane. But in the same way that you come from a line of fishermen, I come from a line of professors, so it’s in the blood, and I have to keep trying. It’s just what I do…
“Tried to educate me”?
You are truly hilarious.
w.