Guest Post by Willis Eschenbach
A couple of months ago, I came across another claim that the solar sunspot cycle affects weather down here at the earth’s surface, in particular, ocean temperatures in the El Nino region of the tropical Pacific Ocean. The paper is called Evidence of solar 11-year cycle from Sea Surface Temperature (SST), by Mazza and Canuto, hereinafter MC2021. I wrote about it in my post “CEEMD Versus Joe Fourier”. In this post, I thought I’d expand my analysis a bit and clarify one of the reasons why the MC2021 claims are not true.
Now, folks who read my work may be aware that I started out as a true believer in the idea that sunspots affect surface weather. As a kid, I’d read about William Herschel’s 1801 claim that sunspots affected wheat prices in England. So I thought it would be very easy to find evidence that the variations in solar energy caused by sunspots actually changed surface weather.
But when I first went to actually look at the data, I found … nothing. So I kept looking. Since then I’ve looked at dozens and dozens of claimed correlations and found … nothing. Well, that’s not exactly true. I did find a scientific paper called “On The Insignificance Of Herschel’s Sunspot Correlation“, wherein the author looked for hard evidence to back up Herschel’s claim and found …
Nothing.
So, I was interested in the MC2021 paper. It says:
After having downloaded and analysed hundreds of temperature records of the earth surface, eventually, we found clear evidence for the sun’s 11-years cycle signature in some few cases, while for the vast majority of the others this wasn’t detectable, buried under other oscillations (seasonal or El-Nino related) or noise. We found that two conditions are the most favourable in finding the proper sun’s signature in temperature records: as a rule of thumbs:
Focus on the sea surface tropical temperatures, in the range 5°N – 5°S. This is not surprising, there solar rays transfer their energy to surface waters with less reflection or scattering and with an optimum incidence angle.
Forget anomalies or indices of whatever type; for our goals this is only data jamming.Look whenever possible to real sea surface temperatures (SST).
After careful analyses of the many temperature records of the whole earth surface temperature, as well as of selected regions, we identified two regions as the most affected by the 11-year solar cycle. Both of them refer to ocean equatorial regions, known to climatologist as El-Nino-3 and El-Nino-3-4.
Hmm, sez I … here’s their money graph showing the claimed relationship:

Figure 1. Figure 4 from MC2021, showing the relationship between sunspots and the cycles in the El Nino regions.
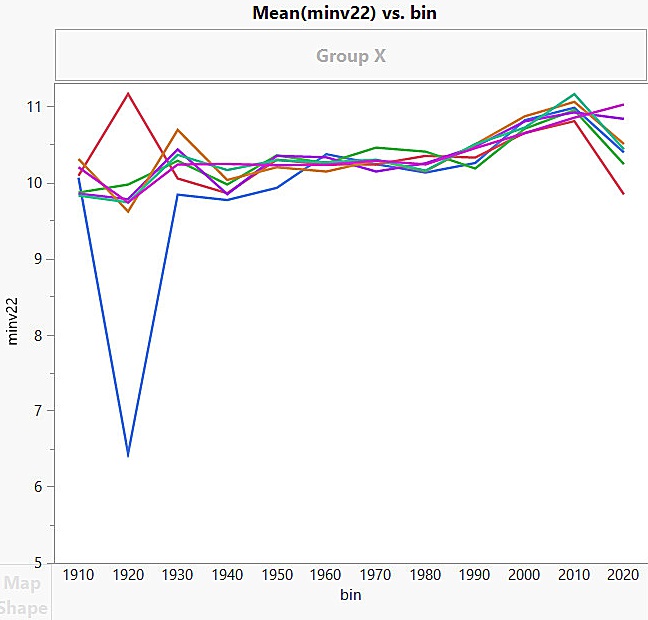
Hmmm, sez I … so I went to see if I could replicate their findings. Instead of just using the Nino4 and Nino34 indexes, I also used the Multivariate ENSO Index (MEI) and the Southern Oscillation Index (SOI). All of these are known to correlate in some strong manner with the El Nino/La Nina oscillation in the tropical Pacific. (I have not used the NINO3 Index as they did, because it does not correlate with the others.) Here’s that result, starting in 1979, which is the start of the MEI dataset.

Figure 2. A comparison of the underlying ~ 11-year cycles in the sunspots and the tropical Pacific Ocean. Cycles have been determined using Complete Empirical Ensemble Mode Decomposition.
Hmmm, sez I … one thing is for sure. The Nino4, Nino34, MEI, and SOI are all clearly different measures of the same underlying phenomenon. In each dataset, you can see the recent very long La Nina conditions at the right side of the graph, and the datasets agree well with each other throughout.
And all of them line up quite well with the sunspots, with a lag of a couple of years between the sunspots and the tropical ocean indexes.
So what’s not to like?
Well, what’s not to like is that the data is very short. My rule of thumb is that you can’t tell much with only three cycles of some phenomenon, and I’ve been fooled more than once by even five cycles. And here we have only four cycles.
Fortunately, although the MEI only goes back to 1979, the other three indices go back much further. Here are the full datasets, starting in 1870.

Figure 3. A comparison of the post-1870 underlying ~ 11-year cycles in the tropical Pacific Ocean. Cycles have been determined using Complete Empirical Ensemble Mode Decomposition.
Since there is reasonably good agreement between the timing of the cycles of the three datasets, let me use their average to represent the long-term conditions in the tropical Pacific, and compare that to the sunspot data.

Figure 4. A comparison of the post-1870 sunspots and the average underlying ~ 11-year cycles in the tropical Pacific Ocean. Cycles have been determined using Complete Empirical Ensemble Mode Decomposition.
I’m sure you can see the difficulty. Prior to about 1945, the ocean is way out of phase with the sunspots. And the further back you go, the greater the disagreement between the two datasets. In addition, the envelopes of the signals are very dissimilar. You’d expect that if the solar signal is strong, the temperature should be strong also … but that’s not the case at all.
You can see this via Fourier analysis as well. The more recent post-1960 part of the ENSO record has a clear 12-year cycle (not 11 but 12 years, blue line, right panel) … but when you look at the full dataset back to 1870 (red line, right panel), that cycle disappears down into the noise and changes to a 13-year cycle. Note that this doesn’t happen with the sunspot data (left panel). There, the 11-year cycle is always clearly above the noise and remains steady at 11 years.

Figure 5. Fourier periodograms of the full-length (red) and post-1960 sunspots (left panel), and Nino4 index(right panel).
Unfortunately for those of us studying climate science, we’re looking at a hugely complex system. The climate is composed of six major subsystems—the atmosphere, biosphere, hydrosphere, cryosphere, lithosphere, and electrosphere. Each of these subsystems has internal resonances and cycles occurring at a variety of timescales from milliseconds to millions of years. Not only that, but all the subsystems are exchanging energy on a variety of regular, intermittently regular, and random intervals on the same timescales. Finally, the system is fueled by a constantly varying source of energy.
Even the IPCC acknowledges that this system is totally chaotic, chaos that has existed for millions of years. And as a result, we often see what I call “pseudocycles”. These are cyclical variations in some given datasets. However, they are not true cycles—they appear without warning, last for some time, and then fade away and disappear, replaced by some other pseudocycles.
This problem is exacerbated by the fact that so many of our weather-related datasets are so short, often shorter than one human lifetime. The MSU dataset of the lower troposphere temperature is only 44 years of data, shorter than most lives. Same for the Multivariate Enso Index. Same for the post-1970 data used in the paper under discussion, MC2021.
And this intersection of short datasets and pseudocycles leads to lots of claims of cyclical behavior in surface temperature datasets, particularly regarding sunspots, where no true, unchanging cycles actually exist.
There’s a final problem. This has to do with the fact that natural weather datasets are often what’s called “autocorrelated”. This means that today’s temperature is often related to yesterday’s temperature, and this month’s temperature is often related to last month’s temperature.
The problem is that autocorrelated data often includes cycles … cycles that may or may not mean something. For example, here’s a random autocorrelated dataset, of a type called “Fractional Gaussian Noise” or “FGN”. As the name implies, it’s just noise, no meaningful signals. Note how closely it resembles say a natural temperature dataset.

Figure 6. An example of random fractional gaussian noise (FGN).
And here’s the CEEMD decomposition of that same FGN dataset. Remember, this is just noise, no actual signals present.

Figure 7. CEEMD analysis of an example of random fractional gaussian noise (FGN). (Click to enlarge)
So … what are we looking at here? Well, the left panel shows the individual signals resulting from the decomposition of the FGN noise. As you can see, there are signals at a variety of frequencies, with a residual showing what’s left after all the regular signals are removed.
The right panel, on the other hand, shows “periodograms” of each of the signals in the left panel, with corresponding colors. The periodograms show what the strongest cycles are in the decomposed signals. As you can see, the strongest cycle is at 10 years, shown in green. You can see that signal on the left panel. Must be from sunspots! … oh, wait, it’s just random Gaussian noise …
However, the ten-year cycles are far from a regular signal. Both the amplitude and the cycle length are constantly changing, as can be seen in the green line of the left-hand panel. It’s also revealed by the smaller peaks in the green line on the right-hand panel.
That, dear friends, is what I have termed a “pseudocycle”. It’s “pseudo” because it is not an unchanging, persistent cycle. Instead, it’s just one of the many cycles that we find in all autocorrelated data, meaningless cycles that appear, change, and disappear.
Notice also that the FGN noise contains a persistent trend, the black line at the bottom right of the left panel. This is the result of the same thing, autocorrelation. As discussed in the AGU article “Nature’s Style: Naturally Trendy“, trends in natural datasets may mean just as little as the trend displayed by this FGN data.
And this is why in climate science folks must always, each and every time, adjust their statistical claims for autocorrelation … for example, without adjustment for autocorrelation, the statistics of the FGN signal shown above say the trend is very meaningful, with a p-value of <2e-16.
But once we adjust for autocorrelation and use the Bonferroni calculation to adjust for the fact that I looked at 5 FGN datasets to find that one, it turns out that it’s not statistically significant at all, with an autocorrelation and Bonferroni adjusted p-value of 0.075 … just random noise after all.
Climate science. Hidden potholes everywhere.
My best wishes to all,
w.
The Usual Request: Quote the exact words you are discussing. I can defend my words. I can’t defend your (mis) understandings of my words. Thanks.
Further Readings: Most of my prior sunspot investigations …
Congenital Cyclomania Redux 2013-07-23
Well, I wasn’t going to mention this paper, but it seems to be getting some play in the blogosphere. Our friend Nicola Scafetta is back again, this time with a paper called “Solar and planetary oscillation control on climate change: hind-cast, forecast and a comparison with the CMIP5 GCMs”. He’s…
Cycles Without The Mania 2013-07-29
Are there cycles in the sun and its associated electromagnetic phenomena? Assuredly. What are the lengths of the cycles? Well, there’s the question. In the process of writing my recent post about cyclomania, I came across a very interesting paper entitled “Correlation Between the Sunspot Number, the Total Solar Irradiance,…
Sunspots and Sea Level 2014-01-21
I came across a curious graph and claim today in a peer-reviewed scientific paper. Here’s the graph relating sunspots and the change in sea level: And here is the claim about the graph: Sea level change and solar activity A stronger effect related to solar cycles is seen in Fig.…
Riding A Mathemagical Solarcycle 2014-01-22
Among the papers in the Copernicus Special Issue of Pattern Recognition in Physics, we find a paper from R. J. Salvador in which he says he has developed A mathematical model of the sunspot cycle for the past 1000 yr. Setting aside the difficulties of verification of sunspot numbers for…
Sunny Spots Along the Parana River 2014-01-25
In a comment on a recent post, I was pointed to a study making the following surprising claim: Here, we analyze the stream flow of one of the largest rivers in the world, the Parana ́ in southeastern South America. For the last century, we find a strong correlation with…
Usoskin Et Al. Discover A New Class of Sunspots 2014-02-22
There’s a new post up by Usoskin et al. entitled “Evidence for distinct modes of solar activity”. To their credit, they’ve archived their data, it’s available here. Figure 1 shows their reconstructed decadal averages of sunspot numbers for the last three thousand years, from their paper: Figure 1. The results…
Solar Periodicity 2014-04-10
I was pointed to a 2010 post by Dr. Roy Spencer over at his always-interesting blog. In it, he says that he can show a relationship between total solar irradiance (TSI) and the HadCRUT3 global surface temperature anomalies. TSI is the strength of the sun’s energy at a specified distance…
Cosmic Rays, Sunspots, and Beryllium 2014-04-13
In investigations of the past history of cosmic rays, the deposition rates (flux rates) of the beryllium isotope 10Be are often used as a proxy for the number of cosmic rays. This is because 10Be is produced, inter alia, by cosmic rays in the atmosphere. Being a congenitally inquisitive type…
The Tip of the Gleissberg 2014-05-17
A look at Gleissberg’s famous solar cycle reveals that it is constructed from some dubious signal analysis methods. This purported 80-year “Gleissberg cycle” in the sunspot numbers has excited much interest since Gleissberg’s original work. However, the claimed length of the cycle has varied widely.
The Effect of Gleissberg’s “Secular Smoothing” 2014-05-19
ABSTRACT: Slow Fourier Transform (SFT) periodograms reveal the strength of the cycles in the full sunspot dataset (n=314), in the sunspot cycle maxima data alone (n=28), and the sunspot cycle maxima after they have been “secularly smoothed” using the method of Gleissberg (n = 24). In all three datasets, there…
It’s The Evidence, Stupid! 2014-05-24
I hear a lot of folks give the following explanation for the vagaries of the climate, viz: It’s the sun, stupid. And in fact, when I first started looking at the climate I thought the very same thing. How could it not be the sun, I reasoned, since obviously, that’s…
Sunspots and Sea Surface Temperature 2014-06-06
I thought I was done with sunspots … but as the well-known climate scientist Michael Corleone once remarked, “Just when I thought I was out … they pull me back in”. In this case, Marcel Crok, the well-known Dutch climate writer, asked me if I’d seen the paper from Nir…
Maunder and Dalton Sunspot Minima 2014-06-23
In a recent interchange over at Joanne Nova’s always-interesting blog, I’d said that the slow changes in the sun have little effect on temperature. Someone asked me, well, what about the cold temperatures during the Maunder and Dalton sunspot minima? And I thought … hey, what about them? I…
Changes in Total Solar Irradiance 2014-10-25
Total solar irradiance, also called “TSI”, is the total amount of energy coming from the sun at all frequencies. It is measured in watts per square meter (W/m2). Lots of folks claim that the small ~ 11-year variations in TSI are amplified by some unspecified mechanism, and thus these small changes in TSI make an…
Splicing Clouds 2014-11-01
So once again, I have donned my Don Quijote armor and continued my quest for a ~11-year sunspot-related solar signal in some surface weather dataset. My plan for the quest has been simple. It is based on the fact that all of the phenomena commonly credited with affecting the temperature,…
Volcanoes and Sunspots 2015-02-09
I keep reading how sunspots are supposed to affect volcanoes. In the comments to my last post, Tides, Earthquakes, and Volcanoes, someone approvingly quoted a volcano researcher who had looked at eleven eruptions of a particular type and stated: …. Nine of the 11 events occurred during the solar inactive phase…
Early Sunspots and Volcanoes 2015-02-10
Well, as often happens I started out in one direction and then I got sidetractored … I wanted to respond to Michele Casati’s claim in the comments of my last post. His claim was that if we include the Maunder Minimum in the 1600s, it’s clear that volcanoes with a…
Sunspots and Norwegian Child Mortality 2015-03-07
In January there was a study published by The Royal Society entitled “Solar activity at birth predicted infant survival and women’s fertility in historical Norway”, available here. It claimed that in Norway in the 1700s and 1800s, the solar activity at birth affected a child’s survival chances. As you might imagine, this…
The New Sunspot Data And Satellite Sea Levels 2015-08-13
[UPDATE:”Upon reading Dr. Shaviv’s reply to this post, I have withdrawn any mention of “deceptive” from this post. This term was over the top, as it ascribed motive to the authors. I have replaced the term with “misleading”. This is more accurate…
My Thanks Apologies And Reply To Dr. Nir Shaviv 2015-08-17
Dr. Nir Shaviv has kindly replied in the comments to my previous post. There, he says: Nir Shaviv” August 15, 2015, at 2:51 pm There is very little truth about any of the points raised by Eschenbach in this article. In particular, his analysis excludes the fact that the o…
Is The Signal Detectable 2015-08-19
[UPDATE] In the comments, Nick Stokes pointed out that although I thought that Dr. Shaviv’s harmonic solar component was a 12.6-year sine wave with a standard deviation of 1.7 centimeters, it is actually a 12.6-year sine wave with a standard deviation of 1.7 millime…
The Missing 11-Year Signal 2015-08-19
Dr. Nir Shaviv and others strongly believe that there is an ~ 11-year solar signal visible in the sea level height data. I don’t think such a signal is visible. So I decided to look for it another way, one I’d not seen used before. One of the more sensitive …
23 New Papers 2015-09-22
Over at Pierre Gosselin’s site, NoTricksZone, he’s trumpeting the fact that there are a bunch of new papers showing a solar effect on the climate. The headline is Already 23 Papers Supporting Sun As Major Climate Factor In 2015 “Burgeoning Evidence No Longer Dismissible!…
The Cosmic Problem With Rays 2016-10-17
Normal carbon has six neutrons and six protons, for an atomic weight of twelve. However, there is a slightly different form of carbon which has two extra neutrons. That form of carbon, called carbon-14 or ’14C’, has an atomic weight of fourteen. It is known to be formed by the …
Is this approach saying the oceans cannot store heat and produce large lag effects?
The oceans can store heat and produce “lag effects” … but even a lagged response to sunspot-related variations would be revealed by CEEMD or Fourier analysis. They look at the frequency of the signal, not the lag.
In addition, I’m always suspicious of handwaving “lag effects”. The sun raises the temperature of the ocean today, not in two years … if you want to establish a “lag effect” you need to provide a plausible physical explanation for it. And those explanations are almost always lacking.
w.
“…but even a lagged response to sunspot-related variations would be revealed by CEEMD or Fourier analysis.”
Sounds like handwaving to me. Why don’t you prove your statement by determining the exact lag using CEEMD between something easily verified, like Nino3 and Arctic Sea Ice Extent, otherwise I’ll be suspicious you might just be bs-ing us again.
“The sun raises the temperature of the ocean today, not in two years”
No Willis, the ocean is not a reflector, the ocean lag during one solar cycle is one year or less, however one solar cycle doesn’t change the climate by itself. The longer term lag that controls the climate is associated with 11 solar cycles, or 120 years.
“if you want to establish a “lag effect” you need to provide a plausible physical explanation for it. And those explanations are almost always lacking.”
My explanation isn’t lacking; but yours is just completely missing. Sunshine is absorbed at depth and it takes time for the ASR to upwell as sensible surface heat.
How would that work? You are basically saying that the energy gets transferred in the first 200m of the ocean and then disappears into the depths only to reappear later. The warmer water is going to be less dense than the colder water. It does not seem possible that it would not rise to the surface.
“It does not seem possible that it would not rise to the surface.”
It does rise, and I count on it rising. We know it does by observing the heated water rise from underwater Kelvin waves to the surface.
The right question really is whether overall the ocean loses heat as fast as it absorbs solar energy. Can we agree if it did that the ∆SST=0?
If there were no absorption at depth and subsequently zero upwelling time, the ocean surface would then be acting as a perfect reflector.
If Willis Eschenbach were being honest with himself, he would admit this is exactly the position he has taken in spite of him not directly saying so when he claimed there is no SST lag from ASR in the ocean depths.
.
Bob Weber March 19, 2023 6:22 am
You know, Bob, I’d have done that if you’d just asked politely like a decent human being.
But since you’ve larded it up with personal attacks on my honesty, I’ll pass. You can prove it yourself.
I don’t “BS” anyone, Bob. Perhaps you or your friends do, I don’t know. But me, I’m an honest man. It appears you have little knowledge of my species of humans. We tell the truth as best we know how, and we won’t stand for charming folks like you calling us liars.
So let me cordially invite you to place your ugly accusations as far up the distal end of your esophagus as your arms will reach. Come back when you’ve learned to keep a civil tongue in your mouth, and we can discuss the science.
w.
PS—Your false claim is equivalent to saying that if the sunspot cycles were shifted later by say 6 years, a Fourier or CEEMD analysis wouldn’t show an 11-year cycle … I hope you can see without further experimentation or explication how foolish that is.
Your continual use of strawman arguments and avoiding direct answers are both indicators of your inherent dishonesty Willis Eschenbach.
“It appears you have little knowledge of my species of humans.”
What species is that I wonder?
“…we won’t stand for charming folks like you calling us liars.”
FWIW, I didn’t call you a liar, but I can be charming when I want to be.
BTW, who is this “we” and “us”, as it was only “you” I was referring to?
PS-“Your false claim is equivalent to saying…”
I actually didn’t make a false claim, but you did gaslight me Willis as I was not talking about the specific thing you said, but something else.
“I don’t “BS” anyone, Bob.” – Obviously you don’t realize you do this.
“Come back when you’ve learned to keep a civil tongue in your mouth, and we can discuss the science.”
Projecting again. That’s some advice you should take Willis.
My lady read this thread and made some interesting observations. She said you are acting like a child, like someone who can’t take the heat.
She said I gave you the science in my first comment, but you ignored it, and that you actually were the uncivil one, quite unreachable too. She didn’t think the things I said were nasty but what you said were.
In terms of you discussing any science with me in the future, drawing from long experience now, I am sure it will be as one-sided as usual.
If you paid attention to my charts from my first comment you would know my case is so strong that you now know your years-long anti-solar activism failed, that physics has trumped your auto-correlation concerns.
The facts I presented say 120 years of sunspot activity dictates the climate, falsifying your claim of no ASR lag. You were proven wrong.
The real source of your vitriol is you knowing you lost this debate to me.
Every time you are confronted with contrary evidence you lash out.
Pass. I won’t deal with a man who calls me dishonest. I was brought up under what in my family was called the “Captain’s Code”, the code of conduct of my great-grandfather, a Mississippi riverboat captain.
Among the statements in his code are:
I’ve done my utmost to live by that, as well as the other parts of his code.
Now, it’s not 1856 anymore, so I’ve never killed someone for calling me dishonest.
But I certainly don’t have to put up with scumbags like you making that accusation.
Talk to the hand,
w.
Sunspot cycles might be regular cycles but grouped high/low cycles are not regular and thus not being picked up by this type of frequency analysis tool. In the absence of better explanations of these grouped sun cycles and their variability on ocean heat storage plus data limitations on long ocean heat cycles like AMO turning points, the issue will sit and provide cover for the doom mongers pushing policy.
update

Thanks, RG. I’m not clear what you mean by “grouped high/low cycles”. If you mean the data you show above, there is a clear, albeit quite variable, ~8-year cycle. It is picked up very clearly by the CEEMD analysis (blue line, both panels)
Interestingly, that area of the ocean has been cooling since September 2010 …
Best regards,
w.
Sorry, I was referring to Leif’s solar cycle slides in various presentations showing SC 12-16 as grouped, low cycles and higher intensity grouped cycles before and after. The SCs 5 and 6 are also low. See How-to-Predict-Solar Cycle 25 (2021). Leif probably has similar slides of long-term cycle comparisons in other presentations. The AMO link above is just a reminder of ocean cycles.
Ah. No worries. Here’s the yearly sunspot CEEMD. The top left panel of the left page, marked “Raw”, shows the raw sunspot data. From the right page, you can see that most of the 11-year energy is in empirical mode C3. The periodogram shows energy in cycles that are both slightly longer and slightly shorter than 11 years. Click on the graphic to enlarge it.
Now look at the actual structure of empirical mode C3, in the left panel. You can see that the CEEMD analysis has picked up the variations in both amplitude and period.
Regards,
w.
You mean like circulation?
Are 14 cycles enough?
https://agupubs.onlinelibrary.wiley.com/doi/full/10.1029/2012GL051977
Indian monsoon strength at solar cycle peaks.
And in Suess cycles during the 500 years of the Allerod:
https://www.nature.com/articles/srep02753
Same goes for the East Asian monsoon:
https://kd.nsfc.gov.cn/paperDownload/1000009531240.pdf
https://journals.ametsoc.org/configurable/content/journals$002fclim$002f32$002f10$002fjcli-d-18-0288.1.xml?t:ac=journals%24002fclim%24002f32%24002f10%24002fjcli-d-18-0288.1.xml
The Indian and East Asian monsoons’ fluctuations are just two of many climatic phenomena strongly correlated with solar cycles of décadal to centennial durations. Probably millennial as well.
Millennial scale solar cycle effects on climate:
https://www.sciencedirect.com/science/article/abs/pii/S0277379104003063
https://lweb.cfa.harvard.edu/~wsoon/myownPapers-d/SoonVelascoHerreraetal14-JulyIssue-ESR.pdf
December 2022 study:
https://www.nature.com/articles/s41598-022-25815-w
First paper says:
This is what passes for science these days? A statement that something “may” (or may not) be true? Color me unimpressed.
===
The second one uses three ice core datasets with resolutions of 25 and 30-50 years … not seeing how that will reveal the sunspot cycle. In addition, their three solar datasets (nitrates, 14C, and 10Be) disagree greatly. Nitrates show low solar activity 4-5kyr BP and high solar activity 6-7kyr BP … but their other two datasets show the exact opposite.
And all three of them suffer from a common problem—in addition to being affected by solar activity, they’re all known to be effected by climate and weather activity. And that means they’re useless for the purpose.
===
The third paper claims to diagnose a 1,000 year cycle in a 1,091 year dataset … riiiight. Also, 10 different measurements of the Mongolian sediments have been made:
Not one of these has an 11-year cycle as the strongest short-term (under 50 years) cycle. And only two have anything resembling a strong 11-year cycle:
Sorry, not buying that one either.
Look, how about YOU do your damn homework and stop just throwing things at the wall to see what sticks. YOU go, as I just went, get the Mongolian data, and run the Fourier analysis of your third study yourself. Report back to us with your findings …
… I’ll wait.
Finally, if the only evidence you can find for a solar connection to lacustrine sediments is from 122 million years ago, I have to ask—where is the modern evidence?
w.
“This is what passes for science these days? A statement that something “may” (or may not) be true?”
Geez, Willis, a whole lot worse than this passes for “science” these days … as they say, you just have to “follow the science”. 🙂
I’ve provided it for the last 13,600 years, to include the past six and 14 solar cycles.
You need to do the work of actually studying the climate system before presuming to pass judgement on the work of real scientists.
You clearly don’t have a clue as to how the atmosphere works.
Here is one way in which solar radiation and its varying effect on the ozone layer in the startosphere affects air pressure in the troposphere, hence the trad winds and ENSO.
The stratosphere, unlike the troposphere, gets warmer with height. The main reason for this is the ozone layer, which absorbs UV radiation from the sun, warming air around it. The difference is dramatic. The average temperature of the stratosphere is about -110 degrees F. It warms to around freezing at the top of the stratosphere, thanks to the ozone layer.
As noted, UV flux varies by a factor of two during the more or less 11 years of a solar cycle. Hence, the ozone layer varies greatly in its ability to warm the stratosphere. At its warmest, the stratosphere expands, pressuring the troposphere.
The first one is totally standard climate model based. Are you kidding? You think that means something?
The second one never heard of the Bonferroni correction. Yes, if you flip ten coins enough times, eventually they’ll come up all heads … you and the authors seem to think that’s significant.
w.
Sorry, Milo, but the output of reanalysis climate models is not data in any sense of the word. It is just more climate model nonsense. The problem with climate models is that, as I’ve shown, the output is nothing but a lagged and rescaled version of the input. And since solar data goes into reanalysis models, you’re virtually guaranteed to see it in the output.
All of which means absolutely zero about the real world.
w.
To which study are you objecting? The first, 14-cycle paper? How is its reanalysis, used for one of three phenomena, invalid?
The correlation between monsoons and the solar cycle is based upon observations. It has been studied since before and by Gilbert Walker, who discovered the SO.
Have you read the papers I cited?
Well, my view is that it takes more than one solar cycle to have a measurable effect and that is further confounded by internal ocean cycles which can be out of phase in different ocean basins.
Solar effects might be rapid in small areas of the tropical oceans but any global effect is a wholly different issue.
Maybe you should try ChatGPT
“Vuk V. Vukcevic, a retired engineer, has proposed a theory that connects solar activity to Earth’s climate using data from the Atlantic Multidecadal Oscillation (AMO). The AMO is a cycle of variation in sea surface temperature over the North Atlantic Ocean that lasts for several decades at a time. Vukcevic suggests that changes in the sun’s activity, specifically the oscillations of its magnetic field, affect the ocean currents that create the AMO cycle.”
Got a bit of my name wrong, but rest near enough.
Sorry, vuk, not finding it.
As you can see, there’s only a cycle at 9 years, not eleven (green line). And it comes and goes, almost disappearing entirely in between.
Here’s the Fourier analysis.
Like I said … 9 years.
Regards,
w.
There is significant degree of correlation
Thanks, Vuk. Please provide links for the geomagnetic data and I’ll be happy to take a look at it. Your data looks nothing like the data from here.
Not sure what geomagnetism has to do with sunspots, though …
Regards,
w.
What was unexpected is that the ‘ChatGPT’ would pick up this particular one out of many other matters I wrote on the solar activity related or otherwise, to the geomagnetic events.
NOAA data is good as long as it shows the ‘East geomagnetic component’ of the field.
Geomagnetic term refers to the wide range of Earth’s magnetic field events from daily geomagnetic storms – directly associated with the solar activity, to multi-millennial core variability.
Dr Svalgaard is the world’s top expert on the ‘GM east component’ variability, so I will refer you to
https://www.researchgate.net/figure/Daily-variation-of-the-East-component-nT-of-the-geomagnetic-field-at-Hobarton-for-the_fig2_237368863
Of course, you are welcome to look at the alternatives.
Look up AMO and the North Atlantic dawnwelling
For the geomagnetic data in the area look here (calculate the annual difference in column 7 1880-present)
https://www.ngdc.noaa.gov/geomag/calculators/magcalc.shtml#igrfwmm
East component of the magnetic field; Y is positive eastward magnetic declination.

Solar magnetic & geomagnetic East component variability
Image credit: Dr.Leif-Svalgaard
Annual change in East component as calculated from above data referrence
Vuk, you might want to listen to the March 17 Heartland podcast. Most of it is on the SVB banking mess but the last 15 or 20 minutes relates an experience with ChatGPT. To say it is horrifying I don’t think is an exaggeration.
I think Fig 4 has mislabeling. No yellow on graph.
Yellow=blue, maybe a nod to the embattled Ukrainians.
Thanks, Tom, fixed.
w.
Are you saying that the sun has zero effect on the climates of the planets? In which case what drives climate?
Willis didn’t say that. What he said was, “the solar sunspot cycle [is not well correlated with] ocean temperatures in the El Nino region of the tropical Pacific Ocean.“
Obviously, sunlight affects climate: it’s a lot colder where I live, when the days are 10 hours long, than when they are 14 hours long. But solar irradiance and solar magnetic field (both of which could plausibly affect Earth’s climate) change much more subtly over the course of sunspot cycles, so it isn’t a given that there’ll be detectable effects from that cycle on our climate.
Note that systems don’t necessarily need external drivers to exhibit oscillatory behavior, either with regular oscillations, or with highly irregular ones.
The UV portion of TSI changes far more than subtly. That high energy component is what makes and breaks ozone, with profound effects upon surface pressure, hence the trade winds which rule ENSO and its knock-on effects, such as Asian monsoons.
UVA also penetrates deeply into seawater:
https://www.researchgate.net/publication/260280374_Penetration_of_UV-visible_solar_radiation_in_the_global_oceans_Insights_from_ocean_color_remote_sensing_PENETRATION_OF_UV-VISIBLE_SOLAR_LIGHT#:~:text=The%20results%20indicated%20that%20the,nm)%20in%20most%20oligotrophic%20waters.
The results indicated that the penetration of the blue-green radiation for most oceanic waters is ∼30–40% deeper than the commonly used euphotic zone depth; and confirmed that at a depth of 50–70 m there is still ∼10% of the surface UVA radiation (at 360 nm) in most oligotrophic waters.
That was my understanding from papers I’ve read. TSI changes by about 0.1% but UV appears to change by several percent over the 11 year solar cycle. Is the TSI/UV change across the 22 year cycle (N to S to N) asymmetrical across the two 11 year cycles (N to S and S to N)?
“It is clear from the discussion of Section 5.3 that ozone is produced by short wavelength solar ultraviolet radiation and destroyed by radiation at somewhat longer wavelengths. Because the amplitude of solar cycle variability is greater in the far ultraviolet (see Section 5.2) ozone production is more strongly modulated by solar activity than its destruction and this leads to a higher net production of stratospheric ozone during periods of higher solar activity. Observational records (Figure 29a) suggest a peak in ozone response of about 2% over the solar cycle in the upper stratosphere, with a secondary maximum in the lower stratosphere, although the restricted length of the data series means that these results are not yet statistically robust. Ozone column (Figure 29b) shows 0.5 – 4% higher values in ozone columns at 11-year cycle maximum relative to minimum.”(Haigh 2007, p 33)
Haigh, J.D., 2007. The Sun and the Earth’s climate. Living reviews in solar physics, 4, pp.1-64
Thanks, John. I fully agree and have never disagreed that atmospheric ozone levels are related to sunspot cycles.
What I can’t find is evidence that this, or any other sunspot-related correlation, makes it down to the surface.
w.
Clearly you haven’t looked for such evidence.
I’ve provided it in these comments.
When UV flux is at its height in the solar cycle, the ozone layer warms the steratosphere more, increasing air pressure, which does affect the troposphere below. That’s why monsoons are stronger at solar cycle peaks.
You refuse to address this inconvenient truth. It’s not based upon models, although reanalysis does confirm observations. Sir Gilbert Walker found the correlations among the solar cycle, air pressure and monsoons more than a century ago, in the data, but since you’ve never studied the relevant disciplines, you wouldn’t know that.
Real atmospheric physicists and meteorologists find the same today. Now however they understand the causation better than Sir Gilbert could.
Since you fancy yourself a polymath competent in statistics, I recommend this on Sir Gilbert’s contributions to the discipline applied to atmospheric physics, climatology and meteorology:
Statistical Science 2002, Vol. 17, No. 1, 97–112 Sir Gilbert Walker and a Connection between El Niño and Statistics Richard W. Katz
From your link about Walker, emphasis mine:
Oops …
w.
Milo March 18, 2023 1:24 pm
The UV changes in synchrony with the sunspots, so if what you claim without a scrap of evidence were actually true, we’d see in the analysis of the ENSO data above … but we don’t.
w.
Anyone who has ever studied solar radiation spectra knows that UV varies by a factor of two over the ~11-year cycle.
https://www.ngdc.noaa.gov/stp/solar/solaruv.html
That ENSO depends on air pressure determined trade wind direction and strength I assume you know. That ozone concentration affects air pressure then I guess is your issue.
Numerous studies have found the role played by ozone variations in ENSO. Here’s one:
https://www.nature.com/articles/s41598-017-05111-8
You read the entire post and that’s what you thought he said?
Just clarifying in my own mind.
Oooh that Gaia – she’s such a little tease isn’t she….
And, she can also see CO2. 🙂
Tye incoming energy from the sun, as measured at the top of Earth’s atmosphere, has not changed enough in the satellite age to cause even 0.1 degree C. of climate change. I said it, if no one else will, To prove this statement is false, you must offer evidence that NASA satellites are not measuring correctly, or that NASA is lying, which is always a possibility.
The amount of solar energy that reaches Earth’s surface has very likely changed due to changes in cloudiness, changes in air pollution and changes in albedo, including UHI and dark soot continually deposited on Arctic ice and snow.
It is now time for all the “sun worshippers” to get mad at me.
TSI is not the metric which matters. While it changes little, its UV component varies by a factor of two (100%), vs. TSI by only 0.1% over a solar cycle, ie on the order of 1000 times more. That’s significant in itself, but also, UV radiation is qualitatively different, as well as quantitatively, as it controls ozone levels and stratospheric heating, hence air pressure and winds in the troposphere.
So by ‘sun-worshippers’, you must mean ‘atmospheric physicists’, who understand Earth’s air a lot better than you do.
What is your take on the work of Labitzke, van Loon on the ultraviolet, ozone, stratosphere, QBO link?
Took a look at Labitsky. It’s a joke. He’s diagnosing a correlation using only three cycles, each of which has only 18 datapoints. Adjusted for autocorrelation and ignoring Bonferroni, the p-value for 10.7cm flux and The Pas atmospheric pressure is 0.13.
Regarding Bonferroni, he’s looked at one of 12 month pairs, one of 13 pressure levels, and one of two QBO directions. That’s 27 possibilities. So for statistical significance, you’d have to find something with a p-value < 0.05/27 = .0018 … and even ignoring autocorrelation that p-value is 0.009.
Not impressed. If you look in 27 places at 3-cycle datasets as they’ve done, you’re basically guaranteed to find something somewhere.
w.
What about the work of Joanna D Haigh?
Provide LINKS! I’m not going on some damned snipe hunt for you or any other man.
w.
I guess he doesn’t have an answer to that. Solar-climate studies have been misguided for over 200 years and Willis is just following that tradition.
TSI changes by only 0.1% over the solar cycle. The expected effect at the surface of that change is too small to be detectable. Yet a detectable effect of about 0.1 ºC is found. It is not distributed over the entire surface, as could be expected, but a signal of about 0.4 ºC is found in the northern middle-high latitudes. There is at least a 10 times amplification of the signal, and the amplification mechanism has been worked out and named the top-down mechanism.
If you want to find something you should look where it should be expected to be. Willis looks at the surface, like scores of researchers before. He gets the same result and claims to prove something about the sun-climate. He obviously doesn’t.
UV 200-315nm changes with the solar cycle are 3%, i.e., 30 times bigger. And they have a clear double effect on ozone at the stratosphere, by increasing the ozone amount by about 3%, and by increasing the temperature at 30 km high by about 1 ºC. This is obviously the place where to start looking for a solar effect on climate, and it is the place where Karin Labitzke found it.
At fall the stratosphere starts to transition from a radiatively controlled environment to a dynamically controlled environment. Poleward heat and mass circulation becomes controlled by the thermal wind balance, the strength of the zonal circulation, and the effect of planetary wave flux on the mean meridional circulation. Atmospheric waves are the power that drives stratospheric (Brewer-Dobson) circulation, and they are the ones that provide the energy required by solar activity changes to change the climate. This is obviously way over the top of Willis’ head.
The main effect of solar activity changes on climate is in the amount of heat transported poleward when the Sun is not shining. It is clearly not a direct radiative effect, but an indirect dynamic effect. The way the stratosphere conditions are set, mainly by the QBO, determines the magnitude of the effect, so expecting a linear relation with sunspots is self-defeating. The stratosphere-troposphere coupling that acts through the annular modes is responsible for translating the effect to the troposphere and surface during the cold season. This is why a relationship between solar activity and the Arctic Oscillation keeps being found. This sets the position and strength of the tropospheric jets and storm tracks.
The main evidence that this is so is that the Oct-Jan acceleration in the speed of rotation of the Earth measured by the length-of-day displays a clear modulation by solar activity. This is known since the 1970s. To be able to change the speed of rotation, solar activity must have an effect on the global atmospheric circulation big enough to affect the transfer of momentum. The effect of circulation changes on ENSO is indirect. The entire meridional heat transport of the Earth, particularly in the NH winter, responds to solar modulation. This explains why the solar variability effect on surface temperature is most noticeable in the middle-high latitudes of the NH because changes in the amount of heat directed toward the pole produce changes in the air-mass exchange between the Arctic and the continents.
Willis is looking in the wrong places with the wrong techniques as if he didn’t want to find anything. The problem of the solar-climate effect has been solved. Its solution is just not what we were expecting it to be. It is a lot more complicated and will take many years to work out the details. Willis is just adding to the noise. He won’t admit to being wrong because that means his dozens of articles on this issue were a waste of time to him and his readers and because he has his own pet hypothesis that sinks if it turns out that solar changes are driving climate change.
Javier Vinós March 19, 2023 12:54 am
What I guess is that you’re too damn arrogant to QUOTE THE WORDS YOU ARE DISCUSSING? Who doesn’t have an answer to WHAT?
Claims without evidence, math, links, or support? Typical Vinós.
Again, more handwaving. The signal is found in WHAT in the “northern middle-high latitudes”? Surface temperature? Rainfall? Cloud levels?
Next, a link to the “signal” and the claimed “top-down mechanism” is what a real scientist would add to your endless blather.
If you were paying attention, you’d know that I’ve never denied that the sunspot cycle has an effect on the upper atmosphere. I’m a ham radio operator, and every operator knows that. What I’ve not been able to find is any trace of that at the surface.
Nor have I ever denied that solar UV changes more than visible and near-infrared. And while the percentage changes in UV 200-315nm are larger, the actual strength in that band is so small that the absolute changes in radiated energy are smaller than the changes in visible/near IR.
As to what Labitske “found”, it’s a joke. She claims a statistically significant result, with NO adjustment for either autocorrelation or Bonferroni, from a trivial 18 data points over three solar cycles. Laughable. Here’s one of her graphics:
If you don’t see the problem with that, first re-read the head post, then re-read the head post again, and then take a statistics class.
Once again, lots of handwaving, lots of big words, but no data, no math, no links, no evidence. Plus a gratuitous insult. Yeah, that’s how scientists do it.
Gosh, an “indirect dynamic effect”. That sounds so sciency!
Once again, claims with no facts. This time the claim is that “a relationship between solar activity and the Arctic Oscillation keeps being found” Here’s the CEEMD analysis, the Fourier analysis, and the approximately 11-year cycles of the Arctic Oscillation compared to sunspots. Please point out the relationship.
No 11-year cycle there, although there is a weak cycle at ~8.5 years … here are the Fourier periodograms.
In fact, the AO has only very weak cycles of any kind. Note also that there is no sign that the QBO is affecting the Arctic Oscillation—the QBO has a regular 28-29 month cycle, and the AO shows no trace of that.
Finally, here are the empirical modes of the AO and sunspots in the range of the sunspot cycles:
As you can see, because of the different cycle lengths of 11 years and 8.5 years, the two go into and out of phase with each other.
Once again, endless claims without actual evidence. Here’s the monthly LOD anomaly since 1962. There’s an ~ 20-year cycle, but no 11-year cycle at all.
And here are the averages by month. I’ve highlighted the Oct-Jan section. Please point to the “Oct-Jan acceleration”.
You continue saying big words:
Your lips are moving but no science is appearing. Facts. Observations. Links. Data. Math. Graphics. You don’t have a single one of these. All you’ve done is read, credulously believe, and repeat what you’ve read. Any half-brained parrot can do that.
Listen, you unpleasant little man. I’ve done my best to find a solar signal. I’ve looked in the atmosphere, the lakes, the rivers, the clouds, the rainfall, everywhere I can think of. For you to claim I have bad motives is slimy, and it proves you don’t even have the belief in your own claims.
More insults, more claims that “the science is settled” … but not one solid thing in the whole morass.
Javier, you are flat-out lying when you say I “won’t admit to being wrong“. I’m more than happy to admit when I’m wrong. I actually have an entire post entitled “Wrong Again“, for when I was, and another entitled “Wrong Again, Again” for when I was … again. Show me one other climate scientist who is that honest about being wrong.
But first, you have show, not merely wag your nasty tongue and make unsupported claims but actually demonstrate, that I’m wrong.
w.
That opinion of yours is a joke. Labitzke’s finding is confirmed and accepted by atmospheric researchers.
I don’t have to demonstrate anything to you, and your opinion is irrelevant. Only the physical reality and our collective knowledge about it matter.
Strong statistical relationship in the data record: Labitzke’s (1987) discovery was followed by several papers which expanded on the original result (e.g., van Loon and Labitzke, 2000; Labitzke, 2004, this issue). Strong correlations are seen year-round between the solar cycle and stratospheric geopotential heights and temperatures in both hemispheres, irrespective of the phase of the QBO. Primarily during northern late winter the QBO appears to modulate the direct correlation with the solar cycle (Dunkerton and Baldwin, 1992). Although the relationships are not as strong as in the stratosphere, variations approximately in phase with the solar cycle are also seen in satellite records of global temperature in the lower troposphere (e.g., Douglass and Clader, 2002), the North Atlantic Oscillation (Kodera, 2003), surface temperature (North and Wu, 2001), and upper ocean temperature (White et al., 1997).
Solar-ozone mechanism: The UV spectrum varies by several percent over a solar cycle. Since UV radiation is absorbed by ozone in the stratosphere, the concentration of ozone varies with the intensity of UV radiation (Haigh, 1994). This radiative-photochemical mechanism effectively amplifies the solar cycle through a positive feedback with the ozone concentration, apart from dynamical feedbacks. Ozone variations have a direct radiative impact on the stratosphere and troposphere, and observations of temperatures are broadly consistent with the expected radiative forcing.
Model simulations: General circulation model (GCM) simulations of the solar effect (Matthes et al., 2003) reproduced an upper stratosphere global annual mean solar signal in good agreement with observations. However, the models failed to simulate seasonal patterns and the observed response in the lower stratosphere. One study (Matthes et al., 2004), with improved tropical dynamics but without interactive ozone, shows an improved signal in northern winter and the lower stratosphere. An important aspect of solar and QBO effects is the cumulative influence of these forcings over the course of a winter season, as seen in the stratosphere’s response to the QBO (O’Sullivan and Dunkerton, 1994, Gray et al., 2003).
Dynamical mechanism to amplify solar effects: Observations (e.g., Kodera et al., 1990, Dunkerton, 2000, Kodera and Kuroda, 2002) and models (e.g., Gray et al., 2003) show that circulation anomalies in the upper and middle stratosphere move poleward and downward during the winter season and are linked to anomalies in wave-induced momentum transport. The anomalous wave forcing (interacting with the mean flow) can be regarded as a dynamical mechanism to maintain or even to enhance the amplitude of anomalies as they migrate downward into regions of higher atmospheric density. Perturbations originating in the tropical upper stratosphere (e.g., due to the solar cycle) therefore may be transmitted to higher latitudes and to lower altitudes by this dynamical mechanism. Within the stratosphere proper, the relevant waves are planetary-scale Rossby waves propagating on the potential vorticity gradient at the periphery of the polar vortex (Perlwitz and Harnik, 2003, Ortland and Dunkerton, 2004).1 In the troposphere and lowermost stratosphere, synoptic-scale baroclinic waves, owing to the instability of the tropospheric flow, may also contribute to the apparent downward propagation of anomalies Baldwin et al., 2003a, Baldwin et al., 2003b. Induced mean meridional circulations are important in both regions, and may be particularly important in communicating the annular-mode signal all the way to the surface (Ortland and Dunkerton, 2004).
You probably don’t know who Mark Baldwin (14760 citations) and Tim Dunkerton are. They are two of the top 20 researchers of the stratosphere in the world.
Your main talent appears to be statistical. That won’t help you with what happens in the stratosphere, which requires a good knowledge of atmospheric waves, how they generate and propagate, and the effect they have. You will not contribute anything to our understanding of the solar effect on climate. You are stuck within the first line quoted. “Early attempts to associate the solar cycle with weather and climate variations involved surface or tropospheric observations.” It is useless to try to explain things to you. I have tried and failed.
Yep. And I could win the lottery. What is it with you passing vague generalities off as science?
w.
Javier, I just read the whole Baldwin article. He says something that I’ve never denied, that the sunspot variations have an effect on the upper reaches of the atmosphere.
But when it comes to that affecting the surface, he lapses into the usual vague handwaving full of a torrent of weasel words:
===
Although the details of how the solar cycle affects stratospheric winds are not well understood, solar influence on surface climate would likely involve interactions with stratospheric Rossby waves and the coupling of the lower stratospheric circulation to near Earth’s surface. Here we provide an overview of stratosphere-troposphere dynamical coupling. We also discuss dynamical mechanisms that might communicate stratospheric circulation anomalies downward from the stratosphere to the troposphere and surface.
and
The total effect on the atmosphere may be a superposition of direct and indirect effects
and
This dynamical mechanism could maintain and energetically amplify the stratospheric solar signal.
and
… any such solar effect that alters stratospheric winds could be communicated to the troposphere …
and
It is the communication and possible amplification of stratospheric signals downward to Earth’s surface that is crucial to any solar-climate mechanism.
and
Whatever the details of solar influences on the upper stratosphere, if the solar cycle modulates winds in the subtropical stratopause region, then these anomalies could, in principle, be drawn poleward and downward (via wave, mean-flow interaction) to the lowermost stratosphere. From the discussion thus far, it is not clear that the troposphere should be affected.
and
… the long winter NAM timescale could presumably be caused by the annual cycle.
and
Perhaps wave reflection and breaking in the subtropical upper stratosphere and lower mesosphere are important to the coupling mechanism
and
Another mechanism that could contribute to surface effects is wave reflection in the upper stratosphere
and
which is really a combination of mechanisms involving planetary-wave forcing, induced circulation and possible feedback between planetary and synoptic-scale waves
and
Weak changes to the winds could be amplified by interactions with waves that extend several kilometers into the stratosphere
and
One way that the 11-year solar cycle could influence tropospheric climate is through an indirect pathway: tropical stratospheric ozone heating creates off-equatorial circulation anomalies,
and
The mechanism, though imperfectly understood, may be similar to that associated with the extratropical QBO
and
There seem to be two mechanisms, or pathways, involved by which the direct solar/ozone heating in the low-latitude upper stratosphere can be communicated to the global lower stratosphere and troposphere.
and
This pathway for solar influence could involve interactions with the QBO, but the details are not yet understood.
and
If the stratospheric circulation changes with the solar cycle, ozone depletion, or increasing greenhouse gases, those changes will likely be reflected in changes to surface climate.
===
That’s not science. That’s speculation about what may possibly could might be likely to probably happen. I can get that vague nonsense from any popular science article in the Guardian.
w.
That’s science, as you would know if you were a scientist. In science, all knowledge is provisional and liable to be revised and changed at any time. As Richard Feynman said, “we don’t know what’s true, we’re trying to find out and everything is possibly wrong.” So that is how scientists express themselves. There is no room for knowledge to advance if no room for doubt is left about what we think we know. Baldwin & Dunkerton are talking about things for which there’s evidence from a multitude of studies. The right attitude for a scientist is to go to the bibliography of the article to read the articles they quote and to assess the evidence those articles present, then repeat it with the bibliography of those articles, until knowledge is gained of what the evidence supports regarding the issue of interest.
As I said, this is all above your pay level. You should stop writing about things that are more complex than you can handle and about which you refuse to study and learn. The only thing all those articles you write about a solar-climate effect shows is how little you know about that complex field. As with any field, there is good science and bad science. You specialize in criticizing bad science and dismissing good science. There is no possible learning or advancing from what you do and it is essentially useless.
Javier, first, a whole list of things that might could maybe possibly be true is not science. It’s hand-waving speculation. If a scientist has evidence, he presents it. If he doesn’t know something is true, he doesn’t guess and make sixteen vague statements about what might conceivably be true. That’s called “speculation”, not science.
There are an infinity of things out there that could be true. I could win the lottery, and that is an undeniable fact.
But me saying that isn’t science, unless you are including science fiction under that rubric.
I just took a look at Einstein’s 1905 paper establishing Special Relativity. Care to guess how many times he used the words “could”, “might”, “may”, “possibly”, or “likely”?
Not. Once. That’s what scientists do. They talk about what they know, and they leave the fantasizing and speculations to guys named Javier and his faves.
Second, I have raised a host of extremely specific objections to the “science” you are pushing.
Rather than give specific replies to them, you attack me personally.
As I said, and as you know …
… that’s not science. That’s an ad hominem attack.
Come back when you are willing to discuss the following:
Someone here is not acting like a scientist … but it’s not me. I’ve given you very specific, cited, documented, graphed, and detailed objections to the links you’ve posted.
You’ve responded with slimy personal attacks, boasts about you being so much smarter than I am, and claims I’m incompetent. And somehow, you think that’s science, to ignore my scientific claims and attack me personally instead.
Pathetic.
If I’m so damn incompetent, how come you’re running away from my very specific objections like a cockroach at midnight when the kitchen light comes on?
w.
Javier, I had another thought about why statements full of weasel words like “could” and “may” and “might” are not science.
They are not falsifiable.
Science consists of someone making a falsifiable statement about the world, and then other people try to show that it’s wrong. If they cannot show that it’s wrong, it’s provisionally accepted as being true.
But if I say “The temperature variations in the stratosphere could be transferred to the troposphere by internal waves at the boundary”, that statement cannot be falsified.
And that is why climate alarmists specialize in statements like “Global climate change could lead to a 1-meter rise in sea levels.” There’s no way to falsify that statement. And that means two things:
Regards,
w.
Please read what Javier, a real scientist instead of playing one on a blog, actually said. He told you where the signal is and of what it consists. Typically, you pretend he didn’t , because you can’t handle the truth.
“TSI changes by only 0.1% over the solar cycle. The expected effect at the surface of that change is too small to be detectable. Yet a detectable effect of about 0.1 ºC is found. It is not distributed over the entire surface, as could be expected, but a signal of about 0.4 ºC is found in the northern middle-high latitudes. There is at least a 10 times amplification of the signal, and the amplification mechanism has been worked out and named the top-down mechanism.”
Had you ever studied climatology, you’d know about Arctic and high temperate latitude amplification.
It’s highly arrogant of you to presume to comment on subjects about which you’re so woefully ignorant.
Willis writes “If you were paying attention, you’d know that I’ve never denied that the sunspot cycle has an effect on the upper atmosphere. I’m a ham radio operator, and every operator knows that. What I’ve not been able to find is any trace of that at the surface.”
Are you suggesting the upper atmosphere is effectively disconnected from the lower atmosphere?
I’m not “suggesting” anything. I’m simply pointing out that we can find evidence of sunspots affecting the upper atmosphere, but not the surface.
In any case, the lack of circulation across the tropopause is well documented. Inter alia, that’s why volcanically ejected SO2, water, and dust remain for so long in the upper atmosphere.
w.
Although not ideal, datasets using “old” MEI algorithms are available at the PSL (NOAA) website, in the “MEI[.ext] data access and publications” sections near the bottom of each webpage.
“MEI.old” was updated from 1950 to (November) 2018, while the even older “MEI.ext” went from 1871 to 2005.
URL 1 : https://www.psl.noaa.gov/enso/mei.old/
URL 2 : https://www.psl.noaa.gov/enso/mei.ext/index.html
Nice work, Willis!
Many natural cycles have variable periods. If you can say of a cyclical phenomenon that each period is predictably within some fairly broad range (e.g., 9-14 years, for sunspot cycles), then it’s still fair to call it a cycle. It’s just not a particularly regular cycle, and Fourier analysis won’t work very well on it.
Thanks, Dave. However, you say:
If you can say of a cyclical phenomenon that each period is predictably within some fairly broad range (e.g., 9-14 years, for sunspot cycles), then it’s still fair to call it a cycle. It’s just not a particularly regular cycle, and Fourier analysis won’t work very well on it.
Not true. See Fig 5. Fourier works well on the sunspot cycles … and it also reveals that the SST average index is NOT a real cycle.
w.
Meanwhile, I keep hearing fools say “climate science- it’s settled”. It sure ain’t. And of course, the oceans aren’t boiling. Will Gore ever live that down?
The same people who claim that climate science is “settled”, continually present new “studies” and predictions of climate doom. In fact, they throw out so many claims and predictions that Climate Realists don’t have enough time to refute all of them.
The science is settled? .. but we keep hearing more and more “It’s worse than we thought” stories. That’s unsettling junk science, not settled real science.
The only thing settled about modern climate science is the conclusion that every claim must scare people That was settled in 1979.
What’s the tilted yin-yang-ish symbol on your graphs?

It’s a black and a white whale … my personal logo. And you’re the first to ever ask.
w.
he Nino4, Nino34, MEI, and SOI are all clearly different measures of the same underlying phenomenon.
these measures are total fabrication, subjective indices like “sun spots”
human inventions, constructs with NO underlying physical UNITS.
with no units here is no dimensional analysis, with no units there can be no physical
law or relationship.
just chance correlation
Thanks, Mosh. The underlying units for sunspots is … well … sunspots.
The units for the NINO3.4 and NINO4 indices is °C of SST.
The SOI is calculated as the standardized difference between standardized Tahiti monthly average sea level pressure anomalies and standardized Darwin monthly average sea level pressure anomalies. The units are standard deviation. However, it could just as easily be calculated in hPa.
The only one that fits your description is the MEI. The MEI is the time series of the leading combined Empirical Orthogonal Function (EOF) of five different variables (sea level pressure (SLP), sea surface temperature (SST), zonal and meridional components of the surface wind, and outgoing longwave radiation (OLR)) over the tropical Pacific basin (30°S-30°N and 100°E-70°W). So no, no units, it’s a pure index.
Finally, are you seriously claiming that the excellent agreement between the Nino4, Nino3.4, SOI, and MEI shown in Fig. 2 is just “chance correlation”?
Really?
w.
Not so. Variables without assigned measurable units can be analyzed statistically with rankings. I’d generally consider an ‘Index’ to be essentially a ranking.
https://en.wikipedia.org/wiki/Rank_correlation
Thanks for the vote Mosh’.
Thumbs are meaning free here. They are awarded serially, based on the commenter. All you need to see are the fraction of dissed/approved comments with no reply.
Toughen up and be like bdgwx. Don’t give ’em, and ignore them.
The argument the climate alarmists use is “today is Special”. With that as an anchor assumption, Willis’ use of 120 year old data is not relevant. What is relevant is 1) what is happening “now” (post 1979, satellite era), and 2) how anthropologic CO2 impacts (as modeled) the climate cycles.
As technically informed skeptics, we follow the key geological premise that “the past is key to the future “. The Kerry/Mann/Drescher position is that the present is not the key to the future as the critical features of the present (CO2) are NOT like the past.
I’m terribly frustrated by our continual fight based on a premise that the past is a predictor of the future. Biden and Gore and Gates and Trudeau and, and, don’t operate from that premise.
Our only true hope for a return to sanity is to demand they address their failed predictions with modifications of their forecasts. That and demand they walk their talk; given how existential their crises are said to be.
Speaking of autocorrelation, random noise, climate science and hidden potholes I would appreciate your comments on something that appears to have an 11-year cycle.
I grew up in northwestern North Dakota, surrounded by sloughs (potholes). At about age 12, I noticed that old, abandoned fence lines were inundated with drifts of topsoil. My Mom explained to be that they resulted from the “dirty thirties”.
Next, I noticed that all the sloughs that had been full of water “all my life”, in 1958 were all dried up. But by 1969 they were overflowing, and 11 years later, 1980, they were dry again, only to refill by 1991 and dry up by 2002. but by 2013 were overflowing nearby roads. My expectation is the sloughs will once again be mostly dry by 2024 (I won’t be around to see what happens in 2035)!
It’s tempting to associate this phenomenon with the 11-year solar sunspot cycle. In the interest of full disclosure, I should have added “more or less” behind each of the dates, but as stated the dates are very close.
I’m not a climate scientist, but I studied college engineering level chemistry, physical geography and geology. My BS in electrical technology and pipeline cathodic protection work helped me understand the same diversity in earth currents “associated” with solar cycles that I observed.
I’m of the mind that what I’ve observed is more than random noise and that I havent’ “autocorrelated”. Kindly suggest any probable errors in my reasoning.
There are cycles in the Mandan ND (near Bismarck) daily precipitation. However, they are by no means stable or unchanging.
w.
One could say the same thing about the sunspot cycles! Perhaps therein lies the problem. Even if something had a fixed period of 11-years, it would drift in and out of sync’ with sunspots because the sunspot cycle is variable.
Good post, Willis! Thank you.
“Not only that, but all the subsystems are exchanging energy on a variety of regular, intermittently regular, and random intervals on the same timescales.”
Yes, and there are very strong exchanges going on.
I have been looking at hourly tide gauge data recently. One subsystem. Specifically, I was curious about the phase difference between the U.S. west coast and east coast.
Why? Because for every foot of slow rise, the ocean does about 8.6 Watt-hours per square meter of work against the atmosphere, and vice versa as it falls. Here I have plotted the time-synched difference between Los Angeles and New York tide gauge water levels.
Bottom line? Powerful energy exchange is going on in the world of cyclic phenomena, which the climate models cannot possibly represent by computation. Just another reason to see that any claim to have diagnosed the climate response to GHGs is unsound, as I see it.
Mmmm … work is being done, but not by the ocean. It’s being done via the changes in the amplitude and direction of the gravity vector. Not sure what that means in terms of climate.
Interesting thought.
w.
I agree with your point about the gravity vector as the source for the tidal movements. In any case, the potential energy of the overlying column of the atmosphere increases and decreases with the water level rising and falling. And it is interesting to ponder that the column of the atmosphere has not expanded or compressed – just higher or lower in respect to the center of mass of the earth.
That terminology is interesting (to this non-scientist). What would be an example of work that IS done by the ocean? Would the ocean resisting the force of the wind be considered work done by the ocean?
Work done by the ocean or the atmosphere is expended in the creation of turbulence in the fluids acting against the solid earth. To quote from Adrian Bejan in Thermodynamic optimization of global circulation and climate
w.
smart man
Just pointing out that I am using the terms “work” and “potential energy” in the sense expressed here.
https://apps.ecmwf.int/codes/grib/param-db?id=162061
Willis:
In an earlier thread i had posted a link to my article :”The Definitive Cause of La Nina and El Nino Events”, which showed 100% correlation with them being caused by increasing or decreasing levels of SO2 aerosols in the atmosphere, primarily as the result of volcanic eruptions, which you had commented upon
https://doi.org/10.30574/wjarr.2023.17.1.0124
In NO way are they cyclic events, yet here you are, ginning up cycles in this thread.
You are being fooled by your graphical programs! Volcanic eruptions occur so frequently that graphical programs can give the impression there are cyclic effects. You need to look at each discrete event to see what actually caused it, as I did, for the representative period that I examined.. .
Willis,

Yours is a delightful and timely essay because of the way you have shown that assumptions about data must be tested.
We live in a world of altered climate observations, yet we seldom see tests of whether alteration has affected the results.
You mention a data break at the time of WWII. Recall that Climategate had many mentions of a desire to get rid of some observations taken during WWII. I do not think it so in this case, but the question could be raised if your CEEMD analysis gave different results for altered versus unaltered observations.
With colleagues, looking at many Australian daily temperature data sets, we find an unexpected pattern that day of the week can show a repeatable difference to other days. Like stories of Lemon automobiles made on Fridays, some data sets have different Sundays. The effect can be magnified on adjusted data versus raw data, though it is getting hard to work out what is really raw.
As another example, years ago I objected to the adjustments made to satellite observations of energy at Top of Atmosphere, with incoming and outgoing values around 1360 W/m2 being subtracted to find a balance where people were looking for 1 W/m2 difference as meaningful. But, the satellite platforms were up to 12 W/m2 different on average, so adjustment was made to bring them into line, to homogenize them. What if the adjustment assumptions are wrong?
Further, of course, there are the many objections already made by others about the dangers of testing climate model performance against historic data that have been adjusted.
While my comments sound negative, they do not in any way detract from the outcomes Willis has shown here.
Geoff S
Thanks, Geoff. Your comments are always interesting.
w.
Thanks Willis,
You mention autocorrelation in terms of one day like the next, one month like the next. Bonferroni corrections. “Climate science. Hidden potholes everywhere.”
One point is that autocorrelation can often be shown on various timescales of temperature series, daily, monthly, annual. Some of these effects seem to be natural, while others can be man-made, in both raw and adjusted data. The interesting ones cover the whole period of available data. Some are undoubtedly “here today, gone tomorrow” effects. Example, a thermometer observer with one preference for certain numbers replaced by another observer with a different signature. How does the Bonferroni correction deal with this? Surely you have to split the data at changeover date, if known or discoverable. You have the question of whether the Bonferroni adds certainty or uncertainty depending on whether the autocorrelation deals with man-made or natural effects.
I have used examples from daily data over land, when over sea as in your El Nino case are different probably different. No UHI for example.
All this to emphasise “Hidden potholes everywhere.”. I for one appreciate your approach of questioning the fundamentals. Modern climate science is full of scientific amateurs failing to question. Geoff S
The climate is composed of six major subsystems—the atmosphere, biosphere, hydrosphere, cryosphere, lithosphere, and electrosphere.
You forgot the big number seven “subsystem”:
Leftist Baloney
Given that climate is a complex chaotic system there is another possibility to consider. It may be the case that for periods of time the main drivers are some simple combination of factors before the equilibria that support that get undermined and the system moves to a more chaotic area of its phase space.
The problem of course is that even if this is true, it is not very useful, because to be able to make useful forecasts we need to be able to decipher when these simpler mechanisms get undermined, and to navigate the chaotic aftermath.
If we consider a portion of the Mandelbrot set, and take the colour coding as a proxy for say temperature we can see portions of the space where the colour varies little, and others where eddies produce significant variations in a tight spiral. The transition can be quite sudden, and depending where you are move to a very different regime. Obviously it is a gross simplification, but hopefully it helps convey the idea.
Milo March 18, 2023 12:31 pm
Folks like Milo have this ugly habit of citing studies that they haven’t replicated … or even attempted to replicate. Somehow, they believe that peer review is meaningless for alarmist climate science, but it works perfectly for sunspot studies …
In any case, I looked at the July-August monsoon rainfall anomalies in India. They claim that rainfall is higher during solar peak years, viz:
Here’s my analysis of monsoon (which they define as July-August) precipitation:
A few notes:
• The average rainfall during sunspot peak years is virtually identical to the average rainfall during sunspot minimum years.
• Of the 11 peak sunspot years, only a mere two of them are wetter than both the preceding and following years.
• Of the 11 minimum sunspot years, five of them are wetter than both the preceding and following years.
In other words, there’s no pattern to be seen here.
Next, here’s a scatterplot of sunspots vs. monsoon (July-August) Indian rainfall.
The trendline shows a slight decline of rainfall with sunspots, but it’s far from statistically significant.
Next, here are the ~11-year CEEMD signals for sunspots and rainfall:
Note that in addition to not having the same average cycle length, the changes in the precipitation cycles precede the changes in the sunspot cycles … so unless you have a time machine the sunspots can’t be the cause.
Let me close with the Fourier periodograms:
As you can see, the Indian monsoon rains have very little in the way of cyclical behavior at all. A small peak at five years, a tiny peak at ten years … not impressed.
Now, you’re free to blindly claim, as Milo and others do, that the scientists must be right because reasons and consensus … me, not so much.
I follow the data, not the scientists.
w.
You don’t even know what the data are.
Your ignoramus fan boys here who rate your drivel up are even greater nincompoop scientific and staistical illiterates than you. Ignorance loves company.
Poseurs like you shame climate change skeptics. Please shut up!
I see. I’ve given you the links to the data on the Indian monsoon rains. I’ve shown that monsoon rains during maximum sunspots are statistically indistinguishable from minimum sunspots. I’ve shown that monsoon rains do NOT have an 11-year cycle.
And your oh-so-scientific response?
An ugly, false, science-free personal attack on me, and even on people who agree with me … gosh, that’s so sciency!
Come back when you can actually answer my objections, there’s a good fellow.
w.
Willis
Your general question is to provide some evidence of a solar cycle (activity level) on weather, or climate. Taking you at your word but not addressing at all your analysis above, I feel there is such a correlation (cause and effect) presented in the work of Prof Qing-Bin Lu of Waterloo University, Ontario, Canada.
He is in the Department of Physics and Astronomy, cross-appointed to Departments of Biology and Chemistry, Canadian Institutes of Health Research (CIHR).
His thesis is that variation in CR’s, CGR’s and UV causes a large change in the ozone concentration over Antarctica which essentially opens, closes or modulates a huge heat vent. After postulating the effect(s) he replicated the chemistry in his lab. Solar activity is a modulator of cosmic rays. (His is not the mechanism proposed and demonstrated by Svensmark.)
Relevant papers are
“Correlation between cosmic rays and ozone depletion”, Phys. Rev. Lett. 102, 118501 (1-4) (2009)
Cosmic ray driven electron-induced reactions of halogenated molecules adsorbed on ice surfaces: implications for atmospheric ozone depletion and global climate change”, (2010a) Phys Rep. 487, 141-167 (published online in 2009).
“What is the major culprit for global warming: CFC’s or CO2?” (2010b) J. Cosmology 8, 1846-1862.
“On cosmic ray driven electron reaction mechanism for ozone hole and chlorofluorocarbon mechanism for global climate change” (2012) arXiv:1210.1498 [physics.ao-ph]
“Cosmic ray driven reaction and greenhouse effect of halogenated molecules: Culprits for atmospheric ozone depletion and global climate change.” Int. J. Mod. Phys. B27, 1350073 (1038).
“Cosmic ray driven reaction and greenhouse effect of halogenated molecules: culprits for atmospheric ozone depletion and global climate”, Journal of modern physics B vol 27 No. 17, 1350073 (2013).
Reply to “Comment on ‘Cosmic ray driven reaction and greenhouse effect of halogenated molecules: culprits for atmospheric ozone depletion and global climate’ ” by Rolf Muller and Jens-Uwe Gross, same journal Vol 28, No 13 1482002 (2014).
Reply to “Comment on ‘Cosmic ray driven reaction and greenhouse effect of halogenated molecules: culprits for atmospheric ozone depletion and global climate’ ” by Dana Nuccitelli et al”, all ditto ending 1482004 (2014).
Those two seem to be “the team” trying to block further investigations. I think there are at least 8 other preliminary papers as well, examining atmospheric chemistry modulated by CR’s, which are in turn (mostly) modulated by solar activity. He had an atmospheric chamber where he could test all this, and did so.
“Eli Rabbet” attacked his ideas online and embarrassed himself (as far as I was concerned) by sneakily using data from the wrong satellite to show “no effect”. The correspondence online is Eli being rude and Prof Lu being polite.
To me, essentially, he proposes a second “Iris Effect” as per R Lindzen, that operates over the South Pole. In one paper he claimed he can explain all global temperature variation from 1960 onwards with this mechanism. I have no idea how that claim stands up in light of the Pause and the Recent Pause.
Thanks, Crispin, most interesting. When I read something like this, I always look to see what datasets might reveal something interesting about the question. Unfortunately, we have few long-term temperature datasets for the South Pole. The Scott-Amundsen station has data but only from 1957 up until 1993. Other than that we have the UAH MSU data. Here are the Fourier periodograms of those datasets plus sunspots.
Sorry, not seeing the putative effects …
w.
There’s also a magnetosphere. Just sayin’.