Steve Milloy
Recall that my 13 million-view tweet sent Big Climate into a paroxysm of desperate but fake ‘fact checks.’ Is NOAA now trying to slowly warm the current pause with an eye toward eliminating it? Or is this just innocent data correction?
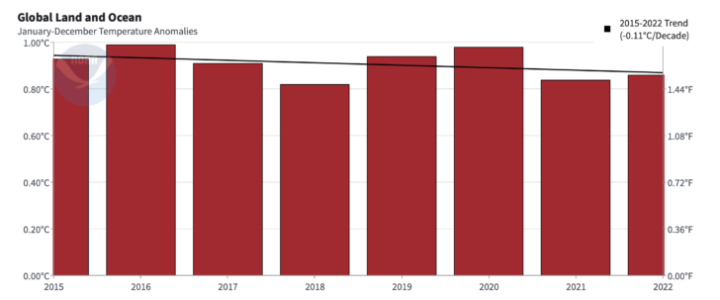
So here is the graph that the 13 million-view tweet was based on. The image was taken on January 12, 2023.
Now here is the image taken today.
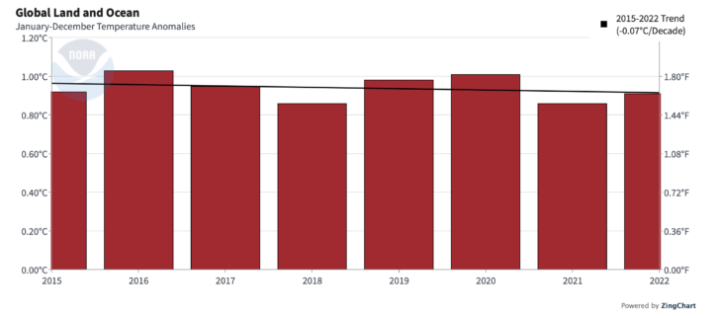
They are very similar. But note the trend. In January, the 2015-2022 cooling trend was -0.11°C/decade. Today, the trend has been knocked back to -0.07°C/decade.
Is this a mere data correction/adjustment by NOAA or the beginning of something more sinister? Stay tuned.
It does not fit the Narrative, so of course it must be “corrected”.
If they were going to ‘correct’ it why wouldn’t they just make the trend positive?
They will change the trend to positive, it will just take a couple more adjustments. If you do all the changes at once people will notice. So it is best to fake the readings slowly.
Looks like people have already noticed, so…
11 people have noticed Nail.
You wouldn’t have noticed if someone didn’t show you…
Gives the AGW followers hope.
And why did they reduce the warming trend over the period of record?
What is this reduction? What are you actually talking about? If you don’t make a clear statement you won’t get an answer.
Of course you don’t want an answer do you? You think your nonsensical statement is a rhetorical question which is a killer argument. You probably found it on Reddit and don’t even know what it refers to. Try again.
I’m referring to adjustments documented in Menne 2009, Karl et al. 2015, Huang et al. 2014, etc. The net effect of all adjustments reduces the overall global warming trend over instrumental record period.
Human emissions could only be responsible for post 1950 warming, but there was similar warming before then to what has happened in the past 40 years. You deliberate refer to the net effect (or just regurgitate a talking point) because the overall effect is to adjust the data to better reflect the assertion that warming since 1950 was not natural by reducing the earlier warming trend.
That adjustment was still an exampe of tweaking data to fit the theory.
Do you think CO2 (and other GHG) molecules created before 1950 behave differently than those created after 1950?
Of course they do. CO2 is magic, weren’t you told?
Everybody who is familiar with “The Science” knows that the argument is about how much was emitted.
It is The Science (What climate scientists insist is settled) that human emissions were not enough to cause any significant heating until after 1950. They couldn’t have the same rate of warming from 1900 to 1940 as in the past 40 years when human emissions of CO2 was a tenth of 1980 in 1900.
You had -2 likes and it’s-1. Somebody actually liked your silly rebuttal?
I’m responding to your statement “Human emissions could only be responsible for post 1950 warming” That just simply isn’t true regardless of whether you think it is silly or not.
Really is sad when an alarmist starts thrashing.
I can’t determine if bdgwx’s post is an example of ignorance or a desperate attempt to change the subject.
As the historical record shows, man wasn’t emitting enough CO2 prior to 1950, to make a difference.
I’ll ask you the same question. Do you think pre-1950 CO2 molecules behave differently than post-1950 molecules? If yes then what property of the CO2 molecule causes it to behave differently? If no then you agree with me.
And note that the contention is not the amount of CO2 emitted which is obviously lower in the past. Literally everyone accepts that. The contention is that Robert B said “Human emissions could only be responsible for post 1950 warming” which is patently false. I’m trying to convince Robert B that there is nothing special about pre-1950 molecules that cause it to stop behaving the same way as post-1950 molecules. CO2 causes a positive radiative force in proportion to the amount of increase in the atmosphere regardless of when it got there. Specifically the radiative force pre-1950 is 5.35*ln(310/280) = 0.54 W/m2 and post-1950 is 5.35*ln(420/310) = 1.50 W/m2. 0.54 W/m2 may be smaller than 1.50 W/m2 but it isn’t zero. That’s the point.
I take it you disagree?
Notice how the troll evades the point and re-asks the already answered question. If it’s trying to be cute, it’s failing at that as well.
You don’t have to answer. But without an answer I’m left with no other choice but to accept that you think 5.35 * ln(310/280) = 0.54 W/m2 is the same thing as 0 W/m2. It is an absurd argument, but I’ll accept that I cannot convince you otherwise. I’ll just put it down in my ever expanding list of absurd arguments and move along.
I tiny step back toward reality.
They knew the previous iteration was farcical.
Its now slightly less farcical.
But Karlization jacks up the recent warming trend. Lowering the overall trend was a propaganda move.
They used the old night marine air temperature (NMA) relationship to SST to adjust SST upwards going forward. Sadly (for them), the recent NMA to SST relationship has changed and should lead to a downward revision in the calculated trend. That is if CliSciFi was normal science.
Step by small step, so that their mathematically illiterate (ie TFN) followers don’t notice.
They will, they are just doing it in several steps.
Like a frog placed into cool, not boiling, water, you need to turn the heat up slowly or else even some the idiots will notice and defect
How many NOAA “corrections” result in cooling the temperature trend? If the corrections are really just corrections, you would expect the net effect to be no change in the temperature trend.
NOAA’s corrections result in a lowering of the overall warming trend over the instrument record. See Dr. Hausfather’s summary of the topic here.
Anyway, the change in the trend in this case (2015-2022) is not the result of new corrections. It is the result of the fact that data is still being uploaded into the repositories.
1950 is the date when man made global warming is supposed to have started. According to the graph you have supplied, NOAA cooled the temperatures from 1950 to 1980 and warmed the temperatures thereafter. So thank you for confirming that NOAA has indeed warmed the temperature record over the period when man made global warming is supposed to have occurred.
BT said: “1950 is the date when man made global warming is supposed to have started.”
Anthropogenic CO2 emissions increased significantly starting around 1850.
BT said: “ So thank you for confirming that NOAA has indeed warmed the temperature record over the period when man made global warming is supposed to have occurred.”
Look again. The warming trend is lower because of the adjustments.
I was quoting the IPCC which said that human activity is the dominant cause of warming starting in the 1950s. Look again at the graph you supplied. Again, thank you for confirming that NOAA has indeed warmed the temperature record over the period when man made global warming is stated to have occurred by the IPCC.
https://www.bbc.co.uk/news/science-environment-24292615
The beginning of anthropogenic modulation and anthropogenic modulation being dominant are not the same thing.
Look at the graph. What would you say is the difference in the adjusted vs raw warming trend from 1950? What is the difference from 1880?
We are talking about temperatures and I am merely quoting the IPCC. The IPCC clearly doesn’t care about temperatures before 1950 as it couldn’t attribute any human influence on the climate before then.
The IPCC attributes 0.13 W/m2 of influence to humans by 1850 [IPCC AR6 WG1 Annex III]. And you can see that the very first graph in the SPM shows temperatures back to 1 AD with a zoom in from 1850 to 2020. [IPCC AR6 WG1 SPM]
“The IPCC attributes 0.13 W/m2 of influence to humans by 1850”
Total baloney, malarkey, banana oil, BS speculation, meaningless, wild guess. No one on this planet knows what percentage of warming since 1850 was manmade. Those who claim to know are liars.
No one even knows the global average temperature before 1940 — it is a wild guess of the Northern Hemisphere not fit for science. In fact, before the use of satellite data in 1979, the global average is not fit for science. Too much infilling because of insufficient global coverage And too many adjustments.
Not enough data.
It’s not just the infilling. Atmospheric heat must be measured by enthalpy, not temperature. It’s why 100 DegF in Phoenix is not equal to 100 DegF in Miami. Differences in humidity make major differences in the amount of heat involved in each location.
They talk about CO2 trapping “heat” but then start talking about temperature as a way to measure it. Basic scientific idiocy from the word go.
RG said: “Total baloney:”
It’s right there on pg. 2144 in annex III.
I read it. They have the uncertainty of those early measurements at 90%, and yet double of that blind guess can not explain a warming rate the same as in the past 40 years.
As people try to point out, human emissions are NOW an excess of 4% more than naturally emissions of CO2 that it’s asserted can not be absorbed by natural sinks , which increased CO2 levels. It’s silly to believe that the naturally sinks that were once capable of keeping CO2 levels steady at over 2000 ppm, but couldn’t have 1% more plankton, for example, sequestering 0.2% extra man-made CO2 in 1850, so CO2 levels must have risen 10 ppm in 10 years.
They are just making stuff up. Still, accepting it, the pre 1950s warming cannot be so much, so that change is adjustments to fit the theory, that has the dual purpose throwing everybody off that adjustments always cause more warming after 1950.
It’s total baloney even if if was written in 1,000 studies. and included on 1,000 different IPCC pages. Multiple mentions of baloney do not create truth. I know baloney when I see it. As in your comments.
Your problem, BedofWax, is you treat the IPCC as a science organization because you are a gullible fool.
No real science organization would have dismissed all natural causes of climate change as “noise” in 1995, for the sole purpose of blaming all global warming on man.
No real science organization would treat CO2 enrichment of the atmosphere as bad news that must be stopped — real science proves the opposite — ,more CO2 is beneficial for life on our planet.
The IPCC started with a conclusion. It was formed to prove that conclusion was correct and failed miserably to do that.
The goal of the IPCC is leftist climate scaremongering, and you are not bright enough to notice. That’s why no sensible person takes your comments seriously.
Leftism goals of more power and control depend on climate scaremongering and useful idiot trained parrots like you. BedofWax.
There is more that there is 90% uncertainty.
90% certainty is just a BS number with no scientific meaning. It is based on a popular vote — perhaps 90% of “scientists” felt confident in the conclusion/ That is meaningless claptrap.
You are correct Richard… the real truth is that the whole concept of a global “temperature” is itself malarky… a totally made up thing that has absolutely ZERO meaning except for the eggheads that grift our tax dollars on climate change lies/studies
I wish i had bdgwx as my college prof. .. he could’ve adjusted my raw grades to a “B”… see, i didn’t even ask for a huge grade trend… just a “B”
“Anthropogenic CO2 emissions increased significantly starting around 1850” So what? Your climate catastrophe friends state they couldn’t have affected temperatures until about 1950. Why is that?
Mr David Guy-Johnson said: “So what?”
Anthropogenic modulation (at least in terms of CO2) started around 1850; not 1950 as Bill Toland claims.
Mr David Guy-Johnson said: “Your climate catastrophe friends”
I think you have me confused with someone else. They are not my friends.
Mr David Guy-Johnson said: “state they couldn’t have affected temperatures until about 1950. Why is that?”
I don’t know. You’ll have to ask them whoever they are. I only follow reputable scientific works which state unequivocally that CO2 affects temperatures at all points in time including those billions of years ago. They also say that CO2 is only one among many agents that modulate temperature and that temperature changes are the result of the net effect of all agents acting simultaneously.
Of course none this has any relevance to the fact that the net affect of NOAA’s adjustments actually reduce the warming trend relative to the unadjusted data over the period of record.
Bdgwx, again you have misrepresented what I said. I was talking about temperatures, not co2. You have misrepresented me numerous times in the past. Stop it.
Bill Toland, I’m responding to “1950 is the date when man made global warming is supposed to have started.” If you don’t mean that man made global warming was supposed to have started in 1950 then what DO you mean?
“Anthropogenic modulation (at least in terms of CO2) started around 1850; not 1950 as Bill Toland claims” is what you stated. That is NOT what I said and you know it. Stop misrepresenting me.
Bill Toland said: “That is NOT what I said and you know it. Stop misrepresenting me.”
If I’ve misrepresented you then I apologize. That is not my intention. If you weren’t talking about man made global warming starting in 1950 then 1) why did you say it that way and 2) what did you actually mean?
You honestly cannot tell the difference between what I said and what you said? I was talking about temperatures and you are talking about co2 levels.
I’m talking about temperature too. CO2 is an agent that modulates temperature. Humans began emitting in significant quantities around 1850. That means the anthropogenic modulation of temperature began at least as early as 1850; not 1950.
Significant as compared to what? Keep in mind that the total annual turnover of CO2 in the biosphere is approximately 700 gigatonnes.
Significant in that the anthropogenic fingerprint becomes detectable. The 14C fingerprint in trees began a noticeable decline starting at least as early as 1825 [Levin & Hesshaimer 2000] and the 13C/12C ratio first dropped below the preindustrial mean around 1750 [Bohm et al. 2002]. BTW…Friedlingstein et al. 2022 list about 480 GtCO2 of turnover in the biosphere each year.
The same “isotopes” also come from natural sources, and none of those are being measured. The fact is, they don’t know the reason for the increase in atmospheric CO2, it’s all estimates and assumptions and circular logic.
No they don’t. The fossil reservoir is uniquely 14C and 13C/12C depleted. Not that the isotopes are the only smoking gun for the human fingerprint. Actually, the only smoking gun you need is the law of conservation of mass. The isotope and other lines of evidence just turn the smoking gun into a proverbial smoking nuclear bomb. The anthropogenic modulation didn’t start in 1950. It was at least 1850 and probably further back than that even.
The increase of atmospheric CO2 since 1850 is 100% manmade. Grow up and stop being a science denier.
If you disagree. you must explain where the +200ppm to +300ppm of CO2 emissions from burning fossil fuels went, if not into the atmosphere.
And then you must explain how the atmospheric CO2 increased from 280ppm in 1850 (estimated) to 420ppm in 2023 (measured), up +140ppm
Where did the +200 to +300ppm of CO2 go?
What else could have caused the +140ppm increase of atmospheric CO2?
Two simple questions that you will never answer because you already proved with your comment that you don’t know the answers.
The ONLY fingerprint that is manifest.. is the prior “adjustment” fingerprint..
… that the whole of the AGW meme rests on.
I’m not sure what you’re point is there. Are you trying to say that you believe the anthropogenic modulation start in 1950 as well?
Bdgwx, the IPCCC is a lie of an organization much along the same lines as the covid bioweapo… ahem, i mean vaccine… both are completely political with a nefarious agenda… for both, the truth is right in front of you but u need to open your eyes to see it… ask Jesus and he may unblind you so you can see the truth
Just because something is detectable, is not evidence that it is enough to matter.
The low levels of CO2 being emitted in 1850 were not enough to effect temperatures. If they were, then the many times greater levels today should be increasing temperatures by way more than has been recorded.
You nailed it! Either it is a control knob or it isn’t.
5.35*ln(310/280) = 0.54 W/m2 doesn’t matter but 5.35*ln(420/310) = 1.62 W/m2 does? What is the point at which the radiative force matters? Be specific.
You are using radiation intensity as if there is no such thing as an inverse square law. Do you know how to do a 3D integral using vector calculus?
What is the actual w/m^2 value at a point 3km above the earth if the earth is radiating x w/m^2 at every point on the surface?
going from 280ppm to 285 ppm isn’t enough to matter.
If it were, going from 285 ppm to 420 ppm would have ended all life on earth.
A few million years ago, the CO2 levels were several thousand ppm. According to your theory, that should have made the atmosphere hot enough to melt lead.
MarkW said: “going from 280ppm to 285 ppm isn’t enough to matter.”
5.35 * ln(285/280) = 0.1 W/m2. If you don’t think 0.54 W/m2 matters then it is no surprise that you also think 0.1 W/m2 doesn’t matter either. The question is…at what point does it matter? I argue that it matters when it is > 0 W/m2 consistent with the 1st law of thermodynamics.
MarkW said: “A few million years ago, the CO2 levels were several thousand ppm. According to your theory, that should have made the atmosphere hot enough to melt lead.”
Nope. That’s not what my theory says. Do you want to know my theory or do you want to keep creating strawmen?
However, measurements show that Earth can go one or two decades without increasing its temperature, despite CO2 increases every year. It would seem to me that the hiatus is in indication of little power of modulation.
Pauses are not an indication that CO2 cannot modulate the temperature. It is an indication that it isn’t the only thing modulating the temperature. When we factor in ENSO, AMO, volcanic activity, and solar output we can see that the increase in CO2 is not inconsistent with the existence of pauses.
And according to CMIP5 we should expect to find ourselves in a pause lasting 101 months about 18% of the time which is slightly higher than the 15% of the time since 1979.
KNMI Climate Explorer
East Central Kansas has apparently been in a pause since 1953. That’s about 800 months. What does CMIP5 say about that length of pause?
The GAT line is URBAN data that will warm, unnaturally.
That is what GISS et al are all based on.
Urban areas consist some 1% of the globe but the majority of surface data.
And since the CONUS recording stations have a higher percentage of rural stations than does the remainder of the global stations the temperature variations have vastly different patterns.
No. The GAT line is computed from the area weighted average of the grid mesh. So urban areas are only weighted 1% whereas non-urban are given 99% weight.
Then why use the urban stations at all?
Because they can’t get the results they want without using the urban stations.
The “model” appears to be nothing more than an exercise in curve fitting. We need to be comparing UAH6 to the CliSciFi models.
BedofWax gets credit for a correct comment
More CO2 always impedes Eath’s ability to cool itself, although not much above 400ppm
Climate change, however, is the net result of all local, regional and global climate change variables, and CO2 is NOT the temperature control knob.
CO2 is just one of many climate change variables, including:
The following variables are likely to influence Earth’s climate:
1) Earth’s orbital and orientation variations (aka planetary geometry)
2) Changes in ocean circulation
Including ENSO and others
3) Solar energy and irradiance, including clouds, albedo, volcanic and manmade aerosols, plus possible effects of cosmic rays and extraterrestrial dust
4) Greenhouse gas emissions
5) Land use changes
(cities growing, logging, crop irrigation, etc.)
6) Unknown causes of variations of a complex, non-linear system
7) Unpredictable natural and
manmade catastrophes
8) Climate measurement errors
(unintentional errors or deliberate science fraud)
9) Interactions and feedbacks,
involving two or more variables.
According to the IPCC which you love to site, CO2 has become so dominant that it totally swamps all natural sources of variation.
That’s why they assume that 100% of the warming since 1850 is caused by CO2.
MarkW said: “That’s why they assume that 100% of the warming since 1850 is caused by CO2.”
The IPCC doesn’t say that. They say that 76% of the net radiative force comes from CO2. And only 40% of the total forcing. And in 2000 at the peak of the natural force it was only 32% of the total forcing [IPCC AR6 WG1 Annex III].
I didn’t say or even suggest that.
That is closer to what I was saying.
Then we agree. Maybe you can help me convince the WUWT audience of the fact that CO2 isn’t the only thing modulating temperature.
An “agent that modulates temperature?!” LMAO. Evidence is needed, and they (and you) don’t have any.
Nowhere in the climate record is there empirical evidence of “CO2 drives temperature. Conversely, there is a good deal of empirical evidence that CO2 does NOT drive temperature.
The IPCC does a good job of citing the evidence. I recommend starting there. Make sure you actually review the evidence in the first order citations and branch out to the secondary, tertiary, etc. citations as needed.
You can convince people that CO2 has no effect by showing that CO2 behaves differently in regards to its ability to impede the transmission of energy in the atmosphere than in controlled experiments, that the 1st law of thermodynamics is wrong, and/or that reservoirs in the climate system can take in energy without increasing their temperature or causing a phase change.
Have you figured out how 300 w/m^2 at the surface can be 300w/m^2 at the top of the atmosphere when there is a little law called the inverse square law when it comes to radiation?
Manmade CO2 emissions were probably too small to measure the effect of more CO2 before 1950.
No global warming that could have been caused by CO2 was measured until 1975.
And no warming that could have been caused by CO2 was measured after 2015.
In 4.5 billion years, there were just 40 years, from 1975 to 2015, when some of the global warming could have been caused by manmade CO2, and probably was. The exact amount of that global warming that was caused by manmade CO2 is unknown. Except by liars.
Those 40 years of beneficial global warming, that harmed no one, are being used to promote leftist totalitarianism, with useful idiots like you helping.
No thanks to you for helping to reduce our personal freedoms, BedofWax
Leftists control CO2 to control people.
And you don’t have the intelligence to realize that fact.
and bdgwx says “I only follow reputable scientific works”
like SKS ?
😉
What is SKS?
According to the alarmists, in order to be reputable, a site has to follow the alarmist narrative.
Manmade CO2 emissions were insignificant before 1940, relatively small until 1950, and accelerated after 1975.
The global warming from 1910 to 1940 was not caused by CO2 emissions because they were much too small.
Strike 1 for CO2 the control knob
The pre-“revision” cooling from 1940 to 1975 was not caused by CO2 emissions.
Strike 2 for the CO2 control knob
And the flat temperature trend from 2015 to 2023 was not caused by CO2 emissions.
Strike 3 for the CO2 control knob
The CO2 control knob of the temperature theory has struck out, BedofWax — you may now grieve over the loss of your favorite boogeyman.
As you say CO2 emissions did not really begin to rise much until after 1950.
Yet the open season at the coalport in Spitsbergen (Svalbard) went from 3 months of the year before 1920 to over 7 months of the year in the late 1930s. There was obviously considerable warming of the Arctic during that period.
On another thread I asked bdgwx what may have caused it?
He replied “I don’t know”
“I don’t know” = correct answer for anyone.
You are right of course, but don’t you think it might just make you step back and ask what else is going on that I don’t understand?
You realised, that there is a negativ sign.
So, tell me if -0.07 is more or less then -0.11.
Yes. -0.07 C is more than -0.11 C in the same way that -0.28 C is more than -0.42 C for adjusted vs raw in 1880 respectively.
I take it you disagree that -0.07 > -0.11?
Fossil-fueled agriculture equipment didn’t become common until the 1930’s. Fossil-fueled automobiles didn’t become common until after 1910 and didn’t reach large numbers until the 20’s.
Exactly what happened in 1850 (before the civil war) that caused anthropogenic CO2 emissions to increase significantly? Population growth and exhaling? We killed far more bison exhaling CO2 during that period than we had population growth.
The industrial revolution resulted in coal being burnt to create steam power.
The warming trend is steeper since 1940 by eliminating the global cooling from 1940 to 1975 and pretending it never happened.
Look at the graph. How much steeper is the trend using the raw vs adjusted data from 1940 to 2015?
You are misunderstanding the point of data rigging. What they are doing if you look a the adjustment difference graph is they are reducing the early 20th c. warming period , which was just a rapid and the late 20th c. rise but occurred long before CO2 was deemed to be making a significant change to temperature.
This is a period that NO climate models manage to reproduce and has been a constant problem for their CO2 driven models which cannot even hindcast climate properly.
The only solution ( other then making models WORK ) is to rig the part of the climate record which is inconvenient to them.
That this reduces the 150y trend is not a problem because the it is only the last 70y they need to make as steep as possible.
So you don’t think ship intake observations are biased high relative to bucket observations?
how do you know they are biased high? By the time the bucket is raised to the deck and sits for a while till someone finds the thermometer to stick in the bucket the water will tend to move toward the ambient temperature of the atmosphere surrounding the bucket. It will no longer be at the sea tempeature.
Depending on the replacement flow rate of the water in the ship intake pipe it may actually be closer to the sea temperature than the water in the bucket.
It’s the main reason why these temperatures have such a wide measurement uncertainty that they are unfit for determining differences even in the units digit let alone in decimal places. And no amount of “adjustments” can be anything other than a subjective guess!
“the size of this warming is broadly consistent with
predictions of climate models, but it is also of the same magnitude as natural climate variability. “
“the unequivocal detection of the enhanced green-
house effect from observations is not likely for a
decade or more.”
https://www.ipcc.ch/site/assets/uploads/2018/05/ipcc_wg_I_1992_suppl_report_full_report.pdf
So natural variation or CO2? So now attribution studies know these things.;)
That was written 3 decades ago. The warming is now 1.1 C.
And that has nothing to do with the science. Perhaps you can tell us exactly how much is natural variation? And quote the paper on which you rely.
And of course remember that the Southern Hemisphere was woefully under sampled. (Phil Jones CRU, John D McLean,JCU)
The natural force was +0.12 W/m2 and the anthropogenic force was 2.72 W/m2. The planetary energy imbalance is about 0.87 W/m2. So given the 2.84 W/m2 of total force minus the energy imbalance we have 1.97 W/m2 of transient force matched up with 1.1 C of transient warming. So of the 1.1 C anthropogenic accounted for about 1.03 C and nature accounted for 0.07 C. [IPCC AR6 WG1 Annex III].[Schuckmann et al. 2020]
So from Schuckman they know the OHC to 2000m back to 1980? That’s funny. “The basic assumption for the error distribution is Gaussian with a mean of zero, which can be approximated by an ensemble of various products. However, it does not account for systematic errors that may result in biases across the ensemble and does not represent the full uncertainty. “.
Remember Phil Jones and the SH ocean.
Broadly consistent.
That’s a weasel word big enough to drive an entire scam through.
Models predict that it will warm. It warms, ergo models have been proven.
It doesn’t matter that the models predict 3 times as much warming as has been seen.
It doesn’t matter that warming began prior to the introduction of meaningful amounts of CO2 into the atmosphere.
All that matters is that the narrative be protected.
Starting from zero, it’s easy to have a statistically significant increase in trend. But the fact remains that total CO2 levels did not start moving up in any significant fashion until after 1950.
CO2 increased 30 ppm from 1750 to 1950. That is 27% of the increase from 1950 to 2022. That is hardly insignificant. And you have to go back thousands of years before you see an equivalent change.
Half of nothing, is still nothing.
MarkW said: “Half of nothing, is still nothing.”
Do you think 420 – 310 = 0 and thus 0.5 * (420 – 310) = 0?
For the record…I get 420 – 310 = 110 and 0.5 * (420 – 310) = 55.
Adjustments… LOL!!!… it’s the neoscience approach where you cherrypick or adjust the data to fit your narrative instead of changing your narrative to fit the data
C’mon mann, how do you suppose ol’ Zeke could possibly know what the Earth’s surface temperature was way back at the end of the 19th century? (Hint: He couldn’t have known prior to the advent of satellite MSU data in 1979).
As for areas of the planet where there actually was fairly decent thermometer coverage back then, i.e., the good old USA, your friends at NASA-GISS have been tampering with the data, as shown here:
https://realclimatescience.com/nasa-noaa-us-data-tampering/
Frank from NoVA said: “C’mon mann, how do you suppose ol’ Zeke could possibly know what the Earth’s surface temperature was way back at the end of the 19th century?”
Observations.
Frank from NoVA said: “He couldn’t have known prior to the advent of satellite MSU data in 1979”
Sure, we can discuss the MSU data. Here are the adjustments that UAH makes.
Year / Version / Effect / Description / Citation
Adjustment 1: 1992 : A : unknown effect : simple bias correction : Spencer & Christy 1992
Adjustment 2: 1994 : B : -0.03 C/decade : linear diurnal drift : Christy et al. 1995
Adjustment 3: 1997 : C : +0.03 C/decade : removal of residual annual cycle related to hot target variations : Christy et al. 1998
Adjustment 4: 1998 : D : +0.10 C/decade : orbital decay : Christy et al. 2000
Adjustment 5: 1998 : D : -0.07 C/decade : removal of dependence on time variations of hot target temperature : Christy et al. 2000
Adjustment 6: 2003 : 5.0 : +0.008 C/decade : non-linear diurnal drift : Christy et al. 2003
Adjustment 7: 2004 : 5.1 : -0.004 C/decade : data criteria acceptance : Karl et al. 2006
Adjustment 8: 2005 : 5.2 : +0.035 C/decade : diurnal drift : Spencer et al. 2006
Adjustment 9: 2017 : 6.0 : -0.03 C/decade : new method : Spencer et al. 2017 [open]
That is 0.307 C/decade worth of adjustments with a net of +0.039 C/decade.
Frank from NoVA said: “As for areas of the planet where there actually was fairly decent thermometer coverage back then, i.e., the good old USA, your friends at NASA-GISS have been tampering with the data, as shown here:”
First, they aren’t my friends. Second, they didn’t tamper with the data. They corrected the biases caused by time-of-observation changes, instrument package changes, etc. [Vose et al. 2003] [Hubbard & Lin 2006] Third, remember that Tony Heller was deemed so untrustworthy that even WUWT banned him from the site.
Christy is making adjustments by referencing the satellite measurements to actual temperature readings from radiosondes. Thereby improving the accuracy of satellite measuring system. The NOAA is not. The NOAA actually believes that the output from a computer model is data. Enough said.😞
First, no, that is not how Christy is making the adjustments. Second, if it were then Christy is doing a bad job. And third, if it were than why use the MSU data at all and not just jump straight to the radiosonde datasets.
Thank you, thank you, thank you!
I’ve been begging someone for proof these satellite measurements are but proxies. You have, with that list of links, proven my suspicions: Satellite measurements are interesting, useful even, but not as precise as I’m asked to believe.
Have I thanked you yet?
As for detector technology, I have many, many questions still…
All measurements are proxies
why is radiation brightness any more of a “proxy” than the height of an expanding liquid in a capillary or the resistance of thermally varying resistor.
Go sit in front of a simple electric bar heater. Measure the glow.
Take the whole thing outside in the wind, measure the glow.
Now tell me which one warmed you up more.
…and thanks for clarifying that aspect of “measurement” for me.
In your opinion, the fact that wind removes heat from your body proves that the heater is providing less heat?
Producing ‘heat’ and delivering/absorbing it is not the same thing. I measure the ‘colour’ of a lamp in Kelvin, does not mean my skin gets 4000 Kelvin warmer on stage.
The issue is what the proxy is for. With an expanding liquid or a resistor you can at least make an attempt to judge what is going on at a specific location over time. The way the so-called “climat scientists” go about combining these are not statistically justified but that’s another argument.
The radiation brightness, as measured by satellites, is never measured twice at the same place and especially not at the same time. It is a true proxy trying to define something that doesn’t exist.
The radiation brightness is no more a good proxy for heat than is temperature. Atmospheric heat depends on at least humidity as well as other factors (e.g. pressure). You can have two locations with the same temperature (and therefore the same radiance) with vastly different enthalpy (think Phoenix and Miami).
It’s why when you hear the CAGW crowd talking about “trapped heat” and then talking about temperature you can assume they don’t have a clue as to what they are talking about.
Even UAH now says their dataset has a monthly uncertainty of 0.20 C. [Christy et al. 2003]. That is 20x higher than their original claim of 0.01 C. [Spencer & Christy 1990].
I seem to remember trying to convince you of this a year ago and you refused to believe it. With an monthly uncertainty of +/- 0.20 C how do you tell a decadal difference of 0.14 C per decade like the government gives out?
The key is not necessarily the overall accuracy.
The real advantage is using the same measuring device for all measurements. If the same adjustments are used on all measurements to achieve better accuracy, then there is no reason to expect that anomaly values will change one way or the other.
‘Observations.’
You must be joking. Outside of the US, Europe and a few other Western-like outposts, there was insufficient instrument coverage on land, let alone the oceans and the polar regions.
‘…they didn’t tamper with the data.‘
They don’t tamper with the actual data, which would hopefully be a felony, but they do make ‘adjustments’ to the reported data (see below) and actually fabricate ‘data’, which remarkably plots linearly against CO2 measurements, for non-reporting stations.
‘They corrected the biases caused by time-of-observation changes…’
You obviously don’t read links that don’t conform to your worldview. Heller (and others) have debunked the efficacy of TOBS ‘adjustments’ by separately analyzing stations depending on the time of day their thermometers are actually reset. Hint: they had the same trends.
Hubbard and Lin showed in 2004 (or maybe 2006, I forget) that regional adjustments to land based temperature measurement devices was impossible due to differences in micro-climate (e.g. humidity, elevation, geography, terrain, etc). You could only apply adjustments on a station-by-station basis. Although they didn’t address the issue, those station-by-station adjustments could only be made for a short period in the past unless there was some way to track calibration drift over time.
Bottom line? If you can’t apply adjustments on a regional basis then trying to infill data into unknown areas is impossible as well.
Any temperature tracking must be done only where sufficient measurements are available. That tracking should not be extended into areas that don’t have sufficient measurement data. That means that “global” averages, even today, are highly questionable since we don’t have “global” measurement data for even recent time periods.
Yes. I’m serious. Observations.
No. It is the exact opposite. The net effect of all adjustments is downward. CO2 concentration is upward.
I did read the links. I read all of the links I post. And no, Tony Heller has not debunked the efficacy of TOB adjustments. What he did was compute the US average temperature using a method so egregiously wrong that Anthony Watts himself banned him from participating on this very blog [1].
TOB adjustments are BULL. There is no way of knowing the time of day the reading was taken unless you have seen it yourself or have a video of the same. 100 years ago people were not even sure what the time of day was, let alone whether the person read a thermometer graduated in single degrees at exactly 5pm or didn’t and just made up a reading because the weather was too nasty to bother going outside.
The TOB is recorded with the observations.
Per your 2014 link:
‘As part of its adjustment process, USHCN infills missing stations based on a spatially-weighted average of surrounding station anomalies (plus the long-term climatology of that location) to generate absolute temperatures. This is done as a final step after TOBs adjustments and pairwise homogenization, and results in 1218 records every month.’
That’s a lot of mannufactured ‘data’. To what end?
It’s exactly what Hubbard and Lin showed you *shouldn’t* do! Anomalies carry the same exact measurement uncertainty (especially systematic uncertainty) as the absolute temperatures do. The anomalies carry the exact same variances that the absolute temperatures do. Using anomalies solves nothing when it comes to measurement uncertainty so using them to infill other locations only spreads the measurement uncertainty around to other stations. And that is *especially* true for UHI effects!
Frank from NoVA said: “To what end?”
By not using a local infilling strategy like kriging or gaussian regression you effectively infill using a global strategy. For example, given the sample {1, 2, ?, 4, 5, 6, 7, 8, 9, 10} the naïve average is (1 + 2 + 4 + 5 + 6 + 7 + 8 + 9 + 10) / 9 = 5.78 and is effectively the same as (1 + 2 + 5.78 + 4 + 5 + 6 + 7 + 8 + 9 + 10) / 10. Notice that the ? is effectively infilled with the average of the filled 9. But if we use a local technique we get (1 + 2 + (2+4)/2 + 4 + 5 + 6 + 7 + 8 + 9 + 10) / 10 = 5.5. Notice that the naïve technique (which is effectively a global infill has 0.27 of error. Infilling like this is done to reduce the global bias.
If the 2 or the 4 is contaminated with UHI then you’ve just spread that contamination to another station.
You’ve ignored the question ‘to what end?’. If East Jibip has actual data and you want to know what the average temperature (or trend) is there, you’re in luck! If not, too bad, because infilling, kriging or gaussian regression does not provide you with data. Unless, of course, you’re attempting to calculate the Earth’s GAST, in which case I’ll ask you to tell me what it is. And while we’re on the subject, maybe you can kindly tell me how the IPCC ‘knows’ that our pre-fall from Eden GAST was exactly 288.15K
I literally just answered the question. It is to reduce error.
How does spreading UHI and/or systematic bias around reduce error?
The difference between what the data shows and models predict has been reduced. Therefor error has been reduced.
What error? The non-reporting station temperature of ‘N/A’ (or however they code it) was accurate. By making up ‘data’, they’ve introduced error. Now that we’ve settled that, can you tell me where the IPCC’s GAST estimate of 288.15K comes from?
You’re “making up data” either way. When you ignore unfilled cells you are effectively infilling them with the global average. That’s worse then infilling them with kriging (or like technique).
I’m not making up anything. If you have real data at an actual location, it allows you to say things, e.g., the average temperature in July, about that location. Nothing else. But I would like to know more about where the IPCC’s 288.15K comes from. Is it modeled? How?
How do you compute the average temperature for July (which has 31 days) with only 30 days worth of data?
The uncertainty in the data will swamp any difference in the averages between using 30 days or 31 days. As usual you are trying to completely ignore uncertainty and just assume that everything is 100% accurate and you can discern differences out to as many decimal places as you want!
bdgwx still believes that if you have 10 thermometers in 10 swimming pools, that by adding an 11 thermometer in an 11 pool, you can increase the accuracy of the first 10.
MarkW said: “bdgwx still believes that if you have 10 thermometers in 10 swimming pools, that by adding an 11 thermometer in an 11 pool, you can increase the accuracy of the first 10.”
First, I didn’t say that. Second, that has nothing to do with what we are currently discussing.
It’s got everything to do with it.
Taking 30 different atmospheric temperature measurements on 3 different different days is *exactly* like sticking thermometers in 30 different swimming pools. Adding a 31st swimming pool to the set isn’t going to increase the accuracy of your average in any meaningful way. The variation between the pools will make the change in the average truly undiscernable. This is especially true in months like September and March where monthly temperatures see a wide variation as the seasons change.
That’s pretty much it in a nutshell.
bdgwx,
No, there are ways to ignore missing data cells. Ease of computing with elementary programs like Excel is a prime reason to infill, but that is mental laziness. With many programs, say annual T data to compute a degrees per century trend, a year tagged as missing data is simply deleted, so the final result is attend over 99 or 98 or whatever number of years. It is surprising how often this type of error is unrecognised. I fell for it many times in the early days.
Geoff S
Sure, you can completely ignore the missing value, but then you are no longer computing a global average. Remember, the globe has 510e6 km2 of area. Not 400e6 km2 or 450e6 km2 or even 500e6 km2. It’s 510e6 km2 and no less. If you don’t compute a spatial average accounting for all 510e6 km2 of area then haven’t computed a global average temperature.
“then haven’t computed”
You haven’t “computed” a global average temperature by using guessed-at infill data. You have *guessed* at a global average temperature.
And therein lies the rational for “LONG RECORDS”.
Your own calculation shows a small error by leaving out one day in ten! What is one day out of 30 or 31 using your method? What is the error of leaving one day of one grid out of 510e6 km2?
You are worried about the mean of a distribution. What the result in variance/standard deviation? How does infilling with a mean value change those?
You adjust for nonexistent data by increasing your uncertainty interval. You can’t remove uncertainty by making up data.
Bingo!
MarkW said: “You can’t remove uncertainty by making up data.”
That’s patently false.
Do a data denial experiment and see for yourself. Take a set of observations and hide some of the values for the averaging step. Do a naive average ignoring the missing values (which is effectively the same as infilling them with the average of the existing values) and record the error. Now exploit correlation and infill the missing values using locality (either temporal or spatial) and compute the full coverage average and record the error. Do this a thousand times. Which one has the lower root mean squared error?
I did the experiment, both with my data and with yours, and posted it here in this thread.
The variability of the data results in an uncertainty that is wider than change in the average value. In other words the uncertainty prevents you from knowing what the true value actually is. It keeps you from discerning the difference in the hundredths digit the way you are doing.
You are only kidding yourself that you have somehow decreased the uncertainty.
Throw away *all* of the values and replace them with the average value. What is your uncertainty then?
So making up data improves data quality.
No wonder you believe that GCMs output data.
MarkW said: “So making up data improves data quality.”
If by improves data quality you mean reduce the error then the answer is yes. I demonstrate how it works here. In that example there was one missing day. Using the naive assumption that the missing day behaves like all of the others yields 0.07 F of error. But by exploiting spatial and temporal correlation I reduced it to 0.03 F. And by exploiting the global circulation of the atmosphere I reduced it to 0.00 F. If you disagree then point out the math mistake, I’ll correct it, and we’ll see how it plays out.
And yet your uncertainty was something like 3.0. In other words if your average is 34C +/- 3C then how do you discern a difference of 0.07 or 0.03?
Ans: YOU CAN’T!
You are only fooling yourself!
Feynman: “The first principle is that you must not fool yourself and you are the easiest person to fool.”
Infilling with average values only drives the things toward the average value. It masks standard deviation and variance in the data. It just creates a more peaked distribution.
But, of course, that’s the whole idea. Try and make it look like uncertainty goes down.
MarkW said: “You adjust for nonexistent data by increasing your uncertainty interval.”
Explain that. Be specific. How are you adjusting the data specifically? I want to replicate your procedure and see how well it does.
Why does this need explanation?
If you are measuring crankshaft journals and you measure seven out of eight do you just assume the eighth one is equal to the average of the other seven?
If you have seven boards of varying lengths you are using to create a beam to span a foundation do you just measure six and assume the seventh one is equal to the average value of the other six?
In each case you had better increase your uncertainty for the unknown piece or you are going to wind up failing in your task. the engine could fail because the crankshaft bearings seize or are too loose for good oil pressure. The beam could wind up being too short to cover the span.
It’s no different with temperatures when you are trying to figure out what is going on. If you just always assume the unknowns are equal to the average with zero uncertainty then you may as well just bet on the next horse race with no knowledge about the horses that are running!
bdgwx,
Sorry, but your example is illogical nonsense. The missing value is missing because it’s real value is unknown. Any imputed value is a guess. People can affect the size of a guess, but not the size of the missing value. People can impute reasonable looking values, like in your example, but that is illusory because the true value is unknown for comparison.
With conventional temperatures, there are some ways to restrict the likely range of imputed values. For example, a.mercury thermometer should show values above Hg freezing point and below the melting point of glass, but that type of constraint is rarely useful.
Geoff S
Do you want to work through an example together to demonstrate how this works? Pick your favorite station and post the Tmin and Tmax for a single month. We’ll then do a data denial experiment where we intentionally hide one of the days data and we’ll compute the monthly average using different infilling strategies. And remember, the goal is compute a monthly average temperature for the station so we HAVE to account for all of the days in the month otherwise it isn’t a monthly average.
You will find that the variability in the daily temperatures introduce an uncertainty (i.e. a standard deviation) that will swamp any change in the average that you might find through infilling missing data. You will be doing nothing but moving the average around inside the uncertainty interval when you don’t actually know the true value to begin with!
“And remember, the goal is compute a monthly average temperature for the station so we HAVE to account for all of the days in the month otherwise it isn’t a monthly average.”
Same reasoning. If the standard deviation of the monthly temperatures is such that the average remains within the uncertainty interval then what have you gained from the additional data point? You still won’t know a “true value” for the average!
We’ll a do a test run with my home town of St. Louis. In January of 2023 the data looks like this.
Day, Tmin, Tmax
1 43 65
2 52 62
3 45 72
4 37 46
5 33 42
6 27 48
7 31 43
8 26 40
9 23 56
10 38 59
11 42 66
12 31 52
13 22 31
14 19 39
15 32 54
16 46 62
17 39 50
18 38 43
19 37 44
20 29 37
21 22 44
22 32 42
23 34 48
24 30 45
25 33 38
26 25 35
27 25 55
28 32 59
29 23 49
30 17 23
31 11 22
The actual average temperature is 39.44 F.
Now, let’s the deny the use of the data from Jan. 12, 2023. The naïve average is 39.37 F. But that isn’t the average for January; only a subset of January. If we want to say it is the average for January we have to account for all 31 days. The no-effort naive approach is to assume the missing day behaves like the filled 30. We are effectively infilling using the average of the filled 30. The end result is 39.37 F. That is an error of 0.07 F.
Again, we will deny the use of the data from Jan 12. 2023. But this time we use a local infilling strategy that exploits temporal correlation. We will use Jan. 11 and 13th to infill Jan. 12. Using this approach our final monthly average is 39.40 F. This is an error of 0.04 F. We have reduced the error by using a local strategy as opposed to a global strategy.
But we’re not done yet. Not only can we exploit temporal correlation, but we can exploit spatial correlation as well. We will infill Jan. 12 using the Chesterfield station. Using this approach our final monthly average is 39.41 F. This is an error of 0.03 F. We have reduced the error yet again.
And it doesn’t stop there. If we exploit global circulation model predictions from the day prior we can infill using predictions of the temperature. The end result here is 39.44 F. This is an error of 0.00 F. We have reduced the error yet again.
Do you see the power of exploiting locality and spatial and temporal correlations? Do you see the power of exploiting the laws of physics (GCM predictions)? By using a better infilling strategy we reduced the error from 0.07 F to 0.00 F.
‘Do you see the power of exploiting locality and spatial and temporal correlations? Do you see the power of exploiting the laws of physics (GCM predictions)?’
I see the power of massive fraud. Your StL example missed a single day. The reality, as you note, is that NASA is using GCMs to infill ‘data’ for stations that haven’t recorded a real measurement in weeks, months, years. How many and what percentage of the total ‘readings’ does this in fact represent? You may not realize this, but you’ve just verified Heller’s contention that NASA’s infills have a very high correlation with CO2.
Sounds to me like you (and Nick) are saying that we need to make up data to create a spherical grid, which we need to create a global average surface temperature. Question: Way before said spherical grid existed, the IPCC estimated GAST at 288.15K. Where and how did they get this number?
Frank from NoVA said: “Your StL example missed a single day.”
It works for any number of missing values. In fact, the more missing values you have the better locality based infilling strategies become. You can prove this out for yourself by repeating the data denial experiment for your favorite station. I’ll help you if want. Which station do you want to consider?
Frank from NoVA said: “The reality, as you note, is that NASA is using GCMs to infill ‘data’ for stations that haven’t recorded a real measurement in weeks, months, years.”
I said no such thing. And no, they don’t.
Frank from NoVA said: “How many and what percentage of the total ‘readings’ does this in fact represent?”
0%.
Frank from NoVA said: “You may not realize this, but you’ve just verified Heller’s contention that NASA’s infills have a very high correlation with CO2.”
No it doesn’t. NASA’s infilling strategy document in [Hansen & Lebedeff 1987] has nothing to do with CO2. What they do is exploit spatial correlation.
Frank from NoVA said: “Question: Way before said spherical grid existed, the IPCC estimated GAST at 288.15K. Where and how did they get this number?”
I don’t know. Can you post a link where you got that?
Infilling is just a fraud. It’s a subjective guess since you don’t know the differences in the micro-climates among locations. As I’ve shown you in two different posts just leaving the data out leaves your average well within the expanded uncertainty interval of the data itself.
The variance in your data is so wide (almost 100) that the average is really meaningless in any case. Your SEM is 10/sqrt(31) = 1.8. In other words the population average could range from 37.6 to 41.2 quite easily.
This is all ignoring the measurement uncertainty in the temperatures and assuming that there is no systematic bias in the measurements.
‘0%’ – Absolutely not true!
‘NASA’s infilling…has nothing to do with CO2.’
If it’s based on GCM ‘physics’, it utilizes the model’s forcings, i.e., CO2.
‘Can you post a link where you got that?’
The 288K pre-industrial GAST figure pops up everywhere in alarmist circles. Here it is quoted by the lads at PSU:
“However, if we take ε = 0.77 (i.e., the atmosphere absorbs 77% of the IR radiation incident upon it), we get a result, Ts = 288 K = 15°C. Just right!”
Looks like they assumed the result they wanted and just plugged eta to obtain it. How robust! But you can investigate further here:
https://www.e-education.psu.edu/meteo469/node/198
Frank from NoVA said: “If it’s based on GCM ‘physics’, it utilizes the model’s forcings, i.e., CO2.”
Can you post the page and paragraph number in the HL87 publication I linked to above where you are seeing that. Better yet…show me the line in the source code where this is happening. You link it is based on GCM predictions…prove it!
Frank from NoVA said: “Looks like they assumed the result they wanted and just plugged eta to obtain it. How robust! But you can investigate further here:
https://www.e-education.psu.edu/meteo469/node/198“
That has absolutely nothing to do with how GISTEMP measures the global average temperature.
‘You (th)ink it is based on GCM predictions…prove it!’
No problem – you recently said so yourself:
‘Do you see the power of exploiting the laws of physics (GCM predictions)?’
And here’s the link to the comment where you said it:
https://wattsupwiththat.com/2023/02/20/is-noaa-trying-to-warm-the-current-8-year-pause/#comment-3684558
‘That has absolutely nothing to do with how GISTEMP measures the global average temperature.’
But it has EVERYTHING to do with WHY you and Nick are so adamant about infilling temperature data – alarmists need to compute the current GAST so that they can compare it to the ‘pre-industrial’ GAST, i.e., the 288K, in order to scare the masses into doing colossally stupid things, like net zero.
So, again, what is the origin of the 288K?
Frank from NoVA said: “No problem – you recently said so yourself:
‘Do you see the power of exploiting the laws of physics (GCM predictions)?’”
Yep. That is exactly what I said. Thank you. Notice what I didn’t say. I didn’t say NASA bases its infilling on GCMs or CO2. I wasn’t even talking about NASA.
I’ll ask again…if YOU think they base their infilling on GCMs or CO2 then provide the link supporting that hypothesis.
Frank from NoVA said: “And here’s the link to the comment where you said it:
https://wattsupwiththat.com/2023/02/20/is-noaa-trying-to-warm-the-current-8-year-pause/#comment-3684558”
Yep. And I stand by that comment 100%.
Frank from NoVA said: “But it has EVERYTHING to do with WHY you and Nick are so adamant about infilling temperature data “
No it doesn’t. NASA does NOT infill based on GCMs. Just because I showed it was possible and reduces the error to zero does not mean that NASA or anyone actually does it that way. The point I’m making is that more advanced infilling techniques unequivocally reduce error even to the point where it goes to near 0. If you don’t understand the concept then ask questions. I’m more than willing to clarify points.
Frank from NoVA said: “So, again, what is the origin of the 288K?”
I have no idea. First it was 288.15 K now it is 288 K. I don’t even know where you got that figure. If you can provide the link from where you got it then I’ll read it and try my best to help with its interpretation.
As usual, bdgwx always wants to ignore uncertainty. Using Possolo’s method of analysis in TN1900, the expanded uncertainty of the monthly median temperatures is 0.65, a whole order of magnitude larger than his 0.07 difference in the averages.
When your uncertainty swamps the difference you are trying to perceive, thinking you are actually seeing something is only fooling yourself. What was it that Feynman said about that?
The standard deviation of your data is 9.9 before dropping Jan 12. It is 10 afterwards.
The difference of 0.07 is meaningless. It is almost two orders smaller than your standard deviation. Using Possolo’s method of analysis the expanded uncertainty of your average is 0.65, an order of magnitude larger than the difference of 0.07.
Why you always want to ignore the uncertainty in what you do is just beyond me. When the uncertainty swamps the differences you are trying to perceive you are only fooling yourself that the difference actually exists!
Equating GCM’s to the laws of physics. Now that’s delusion on steroids.
MarkW said: “Equating GCM’s to the laws of physics. Now that’s delusion on steroids.”
Then it should doubly shocking to you that using that infilling technique reduced the error to 0.00 F. Tell me…what was the error using the assumption that the missing day behaves like all of the others that is being advocated for here?
You do realize that continued insertion of an average value will reduce the error to zero, right? Replace every temp with the average and what error do you get? What happens when you infill 7 days with the average of the other 23/24 days? Your imputation of reduced error may be mathematically correct but is it physically correct?
You also fail to see that infilling errors accumulate whether at the same site or multiple sites. What is the accumulated error from 10 sites each with an error?
Your logic is similar to the train company in Ohio. It’s gone 10,000 miles w/o a problem, it will go further.
I see your temps are integer values. Yet you are doing calculations based on one hundredths of a degree. Significant digit rules allow for using one extra digit (tenths) to minimize rounding errors. Your final value of each average should be expressed as integers following those rules. Your “errors” then disappear!
These are physical measurements and should follow the rules every university, government, and business laboratory must follow to refrain from adding unwarranted information (precision).
bdgwx,
You have made multiple posting after this one, yet have not responded to this. Don’t you have an answer?
bdgwx,
You claim the average of your numbers is 39.44 F.
That is immediately wrong.
You cannot state it better than 39 F.
Geoff S
GS said: “You claim the average of your numbers is 39.44 F.”
Absolutely. And I stand by that claim. I did it in Excel.
GS said: “That is immediately wrong.”
Say what? You don’t think an average is Σ[x_i, 1, n] / n?
GS said: “You cannot state it better than 39 F.”
This has to be a joke right?
I’ve already posted this to you about Significant Digits. I’ll post it again and maybe it will sink in. If you need university references I’ll be happy to give them to you.
“””””I see your temps are integer values. Yet you are doing calculations based on one hundredths of a degree. Significant digit rules allow for using one extra digit (tenths) to minimize rounding errors. Your final value of each average should be expressed as integers following those rules. Your “errors” then disappear!
These are physical measurements and should follow the rules every university, government, and business laboratory must follow to refrain from adding unwarranted information (precision).”””””
Just for one reference from:
http://chemed.chem.purdue.edu/genchem/topicreview/bp/ch1/sigfigs.html
“””””It is important to be honest when reporting a measurement, so that it does not appear to be more accurate than the equipment used to make the measurement allows. We can achieve this by controlling the number of digits, or significant figures, used to report the measurement.”””””
Even then he needs to quote an uncertainty interval that will probably be in the units digit!
Here is 31 median daily temperature values for Jan, 2022 (in Kelvin).
265.18,261.54,270.54,276.96,267.23
261.79,263.96,273.12,269.57,273.65
280.07,276.84,280.59,277.51,267.09
269.90,276.18,281.37,270.15,261.59
263.73,275.43,277.29,276.90,264.93
267.26,275.23,270.43,277.71,276.79
280.84
The average is 271.98 with a standard deviation of 6.25.
Let’s delete the last one, 280.84. The average is now 271.68 with a standard deviation of 6.1.
EXACTLY what do you think has been lost in leaving out one data point? Let’s add the data point back in using the average of the other 30 data points and see what we get.
average = 272.9, standard deviation = 6.4
All of these average values are well within the uncertainty interval as determined by the standard deviation of the values.
272, 272, 273
Pick a value out of the middle and replace it with the average of the two surrounding values. E.g. replace 280.59 with the average of 277.51 and 276.84 = 277.18. The average remains 273 with a standard deviation of 6.4. No change.
What other infilling technique would you use? Remember, these are values measured at the same location using the same device. If you try using temperatures measured at different locations using different devices how do you account for differences in the micro-climates at the various locations?
Good point – I had forgotten about the old Alarmist ploy of manipulating temperatures on C or F scales rather than K or R scales.
Yes, Tim,
To add to the confusion, when you look over data in the detail that I have done over the years for BOM Australia, you see more and more irregularities. Re missing values from daily temperature files, sometimes Tmax values are shown as missing when Tmin values are continuous, allowing one a little inference that the Tmax was deleted because it was anomalously high as the preceding Tmin night was quite hot. There is no statistical method known to correct for the operator omitting to record values that are high. Infilling with averages or with the mean of values on either side is wrong and misleading.
When the operators allow wrong and misleading methods to happen, as with homogenization, you start to be sispicious of the actual abundance of wrong manipulation. You can only guess at it because the numbers are gone forever.
I am preparing another WUWT article that shows some real eye openers from tests that help you infer what is really different to what else. Do stay tuned, because the Gormans and I seem to have similar tight logic in mind. Geoff S
Omitting high and low “outliers” only serves to lower variance and standard deviation. Unless there is a physical reason for omitting them they should be considered as part of the record, e.g. if there was a grass fire under the station at 3PM local on day X. If you follow Possolo’s method in TN1900 all that omitting does is raise the coverage factor used for the expanded uncertainty thus making the uncertainty associated with the average larger.
If you are omitting data because it “seems” wrong that is basically just committing fraud, pure and plain.
There is a price to be paid for never considering the uncertainty of your results – no one can trust what you have done. That seems to be endemic in climate science.
The more I look at temperate data the more I don’t trust anything about CAGW. If temperatures are considered to be random variables then to “average” them they must be iid, i.e. have the same distribution with the same standard deviation skewness, etc.
That simply is not the case with Tmax and Tmin. That makes (Tmax+Tmin)/2 a median of a skewed distribution and not an average. The median of a skewed distribution doesn’t have a standard deviation. The fact that doing this for over a hundred years doesn’t make it right, correct, or physically useful.
It’s why I continue to push for the use of degree-days calculated as the integral of the temperature profile for studying climate. It eliminates the need to assume that all temperatures are random variables with Gaussian distributions. Degree-days give a *much* better picture of the climate at a location. You can add degree-day values and get a total value on a monthly or annual basis. A location with a cold climate is going to have fewer cooling degree-days than one with a warmer climate where they could each have the same Tmedian value!
brgwax,
No,
I do not want to do that experiment.
You are using the wrong criterion to show you have improved something.
A better mathematical “result” from a favourite stats formula does not create a better product or future for that product.
Tim Gorman has just illustrated that your product can fail, be it bearings or planks, because you have used the wrong criterion.
You need to calculate actual fit, like the worst probable actual fit, not the best mathematical fit.
Geoff S
GS said: “I do not want to do that experiment.”
Here’s what I think. I suspect you don’t want to do the experiment because you know infilling using local strategies is more effective than a naive strategy. You know the experiment is going to confirm this and you don’t want to see it firsthand.
GS said: “You are using the wrong criterion to show you have improved something.”
Really? You don’t think error (the difference between the estimated value and the actual value) is the right tool for job? What metric should I use to test the skill of infilling strategies?
GS said: “Tim Gorman has just illustrated”
Between he and Jim they constantly make numerous math mistakes including the belief that Σa^2=(Σa)^2 and some so egregious that they conflate averages with sums and conflate the mathematical operators quotient (/) and sum (/). Here is the thread where they made at least 24 algebra mistakes. Not a single one of these was corrected or even acknowledged. They also challenge the 1LOT, Stefan-Boltzmann Law, etc. They don’t think it is even valid to perform mathematical operations on an intensive property. Is this really the duo you want to act as your authority for truth?
“Between he and Jim they constantly make numerous math mistakes”
Malarky!
I took 31 daily median values from my own weather station and showed how the average and standard deviation changes when you leave a day out or infill a day with an average of the surrounding temperatures.
YOU DIDN’T DO ANYTHING TO SHOW HOW THAT WAS MISCALCULATED.
The result of the average remains within the standard deviation meaning you simply don’t know what the *actual* true value is. Yet you somehow think you have the “true value” and that you have decreased the “error”.
You *still*, after at least two years, do not understand uncertainty. You just ignore it and the impact that it has. You are a total failure as a physical scientist.
Your statement of error falls short as usual. The NWS/NOAA specifies ±1° F combined uncertainty for all but CRN stations. Part of that uncertainty at each station is due to systematic error which obviously doesn’t disappear.
U_max would be ±9 if straight addition were used. Using RSS will give “u = √(9*1) = 3”.
You can not reduce this uncertainty by finding an “average uncertainty” which effectively spreads that uncertainty amongst all elements. That would be an uncertainty of “3 / 9 = 0.33”. In other words each measurement in the collection now has an uncertainty of 0.33.
You can not logically justify that since you already know each element has an uncertainty of ±1! It would be in essence saying that the mean is surrounded on each side by elements with ±1 uncertainty, but that the calculated mean has a much smaller uncertainty.
Let’s use the method specified in NIST TN 1900 for temperature.
mean = 5.78
SD of (1, 2, 4, 5, 6, 7, 8, 9,10) = 3.07
3.07 / √9 = 1.02
t Factor for DF=8 and 97.5% => 2.306
1.02 * 2.306 = 2.36
=> 5.78 ± 2.38
(1, 2, 5.78, 4, 5, 6, 7, 8, 9, 10)
mean = 5.78
SD = 2.09
Var = 8.4
t Factor @DF = 9 => 2.262
2.09 / √10 = 0.917
0.917 * 2.262 = 2.07
=> 5.78 ± 2.07
That is far, far from your error of 0.27.
I have also included an image of a calculator page for reference.
So a few dozen “observations” almost all of which are in western Europe and east coast US, are sufficient to tell us what the temperature of the entire planet was, to an accuracy of greater than 0.1C?
it’s kind of like saying the force of gravity is the same on the surface of the moon as it is on the surface of the earth because we measured it at the surface of the earth!
MarkW said: “So a few dozen “observations” almost all of which are in western Europe and east coast US, are sufficient to tell us what the temperature of the entire planet was, to an accuracy of greater than 0.1C?”
I think you have me confused with someone else. I didn’t say that.
That is *exactly* what you are saying when you state you can infill data for the entire globe from the data obtained in western Europe and the eastern US.
If you *can’t* do that then how do you extend your trend back into the past?
Since you claimed that we know the temperature of the whole earth to within a tenth of a degree 200 years ago, that is indeed what you said.
MarkW said: “Since you claimed that we know the temperature of the whole earth to within a tenth of a degree 200 years ago, that is indeed what you said.”
You definitely have me confused with someone else. I didn’t say that either.
If you want to challenge something I said then fine. Quote it and I’ll either defend it or concede that I was wrong.
What I’m not going to do is defend arguments you and you alone are making.
“This is an error of 0.03 F.”
Then how did you come up with an error in the hundredths digit?
Yep.
All uncertainty is random and cancels. The average is always 100% accurate to any number of decimal points. You can just assume that all temperatures are equal to the average so the standard deviation and variance is always zero.
You left out the huge warming adjustment to the 1940 to 1975 period, to eliminate global cooling as CO2 was rising, liar. bedofwax
Honest Climate Science and Energy: 16 average temperature charts: The first five show Inconvenient average temperature data are changed at will by goobermint bureaucrat scientists”
The graph posted above includes all adjustments.
Hausfather is the con man who claimed the climate models were “accurate” by using their TCS prediction, rather than their ECS prediction, and using RCP 4.5 rather than RCP 8.5. Zeke H. is a con man and his followers are trained parrots of climate alarmism.: Climate Howler Global Whiners.
Meanwhile the political IPCC continues to climate scaremonger with their ECS wild guess. A TCS with RCP 4.5 with roughly half the ECS / RCP 8.5 rate of warming prediction would not scare anyone, so it gets no publicity.
The IPCC conveniently allows people to think ECS is for the next 50 to 100 years, when it is really a wild guess for the next 200 to 400 years.
Their actual wild guess for the next 70 years, TCS, is not scary enough for their anti-manmade CO2 propaganda, which is the IPCCs main goal.
So TCS gets no publicity from the IPCC
Nor does the least inaccurate climate model — the INM from Russia — get any publicity from the IPCC
.
Nor does the most accurate temperature compilation, UAH, get publicity form the IPCC
Nor do the NOAA tide gauges, which are the ONLY accurate measure of relative sea level, get any attention from the IPCC because they prefer over-adjusted satellite absolute sea level claptrap.
Do you see a pattern here BedofWax?
The only pattern is you only arguing by assertion, greenest Richard.
I believe you are referring to Hausfather et al. 2019. The authors used two approaches 1) change in temperature versus time and 2) change in temperature versus change in radiative forcing (“implied TCR”). The reason ECS is not used is because it requires the equilibrium period to have elapsed which for the fast feedbacks is on the order 100 years.
Regarding the Russian INM model…I compared the 42 models from the CMIP5 suite to BEST over the period 1880-2020 the INMCM4 (Russia) had a trend of +0.063 C/decade. The best model is IPSL-CM5B-LR (France) with a trend of +0.088 C/decade. The BEST trend is +0.087 C/decade. The CMIP5 ensemble mean had a trend of +0.079 C/decade. The Russian INM model is clearly inferior among its peers. I encourage you to download the data and verify this yourself. The data can be downloaded at the KNMI Climate Explorer.
BEST is built on all the WORST data available.
The most urban affected, unstable, un-scientific data they could find.
Then adjust the wazoo out of it to get the trend they wanted.
That is interesting take considering WUWT gave it their seal of approval back in the day. It was heralded here as the be-all/end-all datasets because it 1) didn’t perform adjustments and 2) was independent.
WUWT gave that seal of approval prior to the work being done, based on the reputation of those involved and conversations between Anthony and those scientists.
The approval was withdrawn after the mess was published.
Exactly. Anthony liked the method. He just didn’t like the result.
When you decide to lie, you really go all out.]
He liked the method, the problem is that they didn’t follow the method, as Anthony explained when he withdrew his endorsement.
Like most alarmists, you only see what you want to see, and are simply incapable of ever presenting all of the facts.
BTW, I’m guessing that you aren’t bright enough to realize that even you know you were lying when you claimed that Anthony endorsed the work of the BEST group.
MarkW said: “BTW, I’m guessing that you aren’t bright enough to realize that even you know you were lying when you claimed that Anthony endorsed the work of the BEST group.”
I’ve never seen an endorsement more unequivocal than that.
Is that credible? Here are the changes year by year, taken from the two charts posted. I might be off by a pixel in the readings.
I think so. They are all within the ±0.075 C uncertainty NOAA publishes for those years.
No, you haven’t thought. The chart shows that the changes result in increased anomalies except in 2015. It is part of the salami slice process of warming the present. It is not an argument to say that the because the adjustment is less than the uncertainty it doesn’t matter. If we add a number of similar adjustments, but ignore them individually on your spurious reasoning it is not OK.
Now that we know the reason for the changes was the implementation of NOAAGlobalTemp v5.1 last week which includes significantly more observations and provides full spatial coverage for the first time the changes make since. And it’s a testament to NOAA’s 5.0 analysis that the changes from 5.1 are still within the uncertainty envelope.
I’m not sure what you mean by ignoring adjustments individually. I’m certainly not suggesting doing that. In fact, I’m suggesting the opposite. If you know of a bias you better make an attempt to correct it otherwise I (and others) are not going to be satisfied.
Neither you nor NOAA use the recommended procedure for finding the expanded uncertainty of the mean of temperatures.
I have also asked you to define what sample mean you are using.
1 sample with 9500+ entries or,
9500± samples of what size?
It does matter when finding the SE/SEM.
A minor correction of previous massive fakery.
The result is still massive fakery.
Because a hockey stick needs a straighter shaft.
Otherwise it’s not a hockey stick, right?
The biggest of the big lies is that values have been adjusted up AND down therefore it A-ok.
The “hockey-stick” is in reference to the 1902-1998 instrumental period set against the 1000-1980 proxy record [MBH99]. By adjusting the pre WWII period up more than the post WWII period you are reducing the perceived “hockey-stick” shape. So if the hypothesis is that NOAA is making adjustment to make the hockey-stick look more pronounced then they did a really bad job of it and instead made it look less pronounced.
bdgwx,
A significant part of that Hausfather graph comes from Australia. Australia’s Bureau of Meteorology has produced several successive homogenised versions of land temperatures, recently under the acronym ACORN-SAT.
Colleague Chris Gillham at his web site Waclimate has carefully documented the substantial “cooling the past” done by BOM. The Australian pattern since 1910 is rather different to the Zeke version. This invites discussion of mechanisms that make them different, since logic would infer that well-mixed CO2, if it heats the globe, should not recognise national boundaries.
Please search “”Gillham waclimate” then select the chapter on ACORN-SAT version 2.2 cooling the past. You will see actual data, simply organised, starting with raw data.
I am currently helping to prepare a WUWT article that, if accepted, will raise some interesting questions of when raw is not.
Geoff S
And ACORN-SAT has over 200 changes for “statistical reasons”.
About 1.5% of the global average temperature comes from Australia.
bdgwx,
It is more than that in 1910 if you only count properly measured data.
Geoff S
Geoff, that’s not how global average temperature datasets work. They don’t take the average of the stations. They take an area weighted average of all of the cells in the grid mesh. Australia’s area wasn’t any different in 1910 than it is today.
Yep, they bury the actual temperature data deeper and deeper so no one can tell what is actually occurring.
No one can answer if Tmax or Tmin is growing or falling and where is it happening!
It doesn’t matter how yo do the averaging. As Hubbard and Lin pointed out all you do is spread around any systematic biases stemming from calibration and/or microclimate differences.
“””””This invites discussion of mechanisms that make them different, since logic would infer that well-mixed CO2, if it heats the globe, should not recognise national boundaries.”””””
Using a statistic that is not descriptive of the data, i.e., the SE/SEM, is exactly part of what you are talking about. The SE/SEM only describes the sample mean distribution and is dependent on sample size (and NOT the number of samples). It is not a descriptive statistics that describes the variability of the actual data.
This link has pertinent info.
https://www.ncbi.nlm.nih.gov/pmc/articles/PMC1255808/
Wow! They just keep trying to keep the narrative going, cuz its dying and they know it. The push is on to reinforce whatever the BS of the day is cuz folks are catching on that its all meant to control the populations. That is all.
And the trolls, as we see, know it also.
Else why arrive here so quickly to so strongly protest innocence?
People in general eat and pay rent.
NOAA has a history of manipulation and cherry picking data. Their agenda has been clearly stated. CO2 concentration is not far above record lows when you look at long tern trends. Temperature is not far above the lowest as we are in an interglacial period. The warming now should not come as a surprise. The only real question is the cause. CO2, though a greenhouse gas, has an R^2 correlation of near zero with actual temperature over eons. The point is, there are many factors to climate change.
Steve, the 2015-2022 trend is short and sensitive to the data still rolling into the GHCN and ERSST repositories. You should be seeing changes to the trend on a daily basis especially (but not necessarily limited to) 6 months after the date in question. Some data points like those from remote and disconnected stations are delayed by years. And if the records are hand recorded they have to be digitized which can create a decades long delay in getting the data uploaded. NOAA is still working on digitization projects for data recorded decades ago so the trends for decades in the past should be changing as well. Anyway, a change of 0.04 C/decade when the uncertainty is on the order of 1 C /decade is well within expectations. In fact, I’m surprised the change was that small.
“Anyway, a change of 0.04 C/decade when the uncertainty is on the order of 1 C /decade is well within expectations. In fact, I’m surprised the change was that small.”
With that kind of uncertainty there isn’t any way to tell if the trend is positive, negative, or sideways.
Exactly what I keep saying. 8 years is far too short a period to be claiming any pause.
At the Forbes Air Force Base in Topeka, Kansas the pause has lasted since 1953. Is that long enough to be claiming a pause?
Well as you were claiming the annual uncertainty of that station is ±6°C, and as you think that any linear trend that can exist within the uncertainty interval is acceptable, I’d assume you wouldn’t think it was long enough as temperatures could have risen or fallen by 12°C during that period.
But seriously, one location is not the globe.
Out of interest, using the daily GHCN data, I found the trend based on annual averages to be +0.11 ± 0.11°C / decade.
But the daily data is missing about 30 years between 1970 and 2000. So maybe you have a more complete data set.
Where did I claim the uncertainty of that station to be +/- 6C?
It is and has been an ASOS weather station with a +/- 1.0C uncertainty.
Seriously, if one location on the globe has seen no trend in Tmax or Tmin since 1953 then where *is* the global warming occuring? For every station with *no* global warming there has to be another station with twice the global average in order for the global average to be what it is! If the global average has gone up 0.6C since 1950 then there has to be a station somewhere that has seen 1.2C increase in order for the average to come out to 0.6C! Where is that station?
My data is from NOAA. A big chunk of the data is missing. But since a linear trend is typically determined mostly by the start data and the end data the trend is zero. My personal weather stations agrees with KFOE since 2012 with an average anomaly of 0.04K, a mode of 0, and a standard deviation of 2.8.
I’m not surprised you are now trying to figure out a way to disregard the linear trending you so vociferously defend otherwise.
The fact is that the temperatures in the 50’s and 60’s are no different than they are today. Where in Pete’s name is the global warming?
As I said elsewhere, if you are afraid of CAGW then move to east central Kansas. We seem to be an island of constant temperature. (apologies to the Soggy Bottom Boys).
“As I said elsewhere, if you are afraid of CAGW then move to east central Kansas. We seem to be an island of constant temperature.”
The whole of the United States and Canada have been in a temperature downtrend since the 1930’s.
In the United States, in 1934, it was 1.2C warmer than the current temperature today.
Hansen said 1934 was 0.5C warmer than 1998, which makes 1934 warmer than 2016, too, since 1998 and 2016 are statistically tied for the warmest temperature in the satellite era (1979 to the present).
Like you said: “Where is the global warming occuring?
It’s only occuring in the computers of climate change alarmist data mannipulators.
It’s been a while but I once took a global sampling of locations on each continent and calculated their heating and cooling degree-day values for the past twenty years. Most came out with cooling degree-values on a downtrend (i.e. max temps going down) with most having heating-degree days going up (i.e. temps going down). Not all by any means but the majority.
That’s where it first came obvious to me that if you have some locations with moderating climate then there must be some that are seeing a *lot* of warming to offset the cooling plus even more. Problem is that I didn’t find any such locations in my sampling. That’s not to say my sampling was very exhaustive, it was only about 30 locations around the globe. But it was enough for me to start asking questions about the “global average”.
I still don’t know why climate science doesn’t move to doing degree-days. HVAC engineers use them extensively, especially the integral form that is in use today. Agriculture has always used the degree-day measure. Degree-days have always seemed to me to better represent the “climate” than just using temperature measurements with all the statistical inadequacies that go along with that.
“Where did I claim the uncertainty of that station to be +/- 6C?”
It was Jim who made the claim. We spent some time discussing it at the start of the month. I don’t remember you disagreeing with the claim.
See the thread starting here for instance
https://wattsupwiththat.com/2023/02/01/uah-global-temperature-update-for-january-2023-0-04-deg-c/#comment-3674931
JG starts by saying
and when I expressed doubts you told me to
Whist JG showed how the calculation worked for the Topeka station to give an uncertainty of ±12°F.
“It was Jim who made the claim. We spent some time discussing it at the start of the month. I don’t remember you disagreeing with the claim.”
Your reading comprehension disability is showing again! Jim was the one that posted the excerpt from the ASOS manual showing the +/- 1.8F (+/- 1C) uncertainty for ASOS stations!
Possolo calculates the variability in the stated values of the temperatures while ignoring the measurement uncertainty as being small enough to discount compared to the data variability.
THAT HAS NOTHING TO DO WITH THE MEASUREMENT UNCERTAINTY OF THE MEASURING STATIONS!
“THAT HAS NOTHING TO DO WITH THE MEASUREMENT UNCERTAINTY OF THE MEASURING STATIONS!”
It was Jim who referred to it a measurement uncertainty. I’ll repeat in case you missed it
And he specifically used Topeka to illustrate his calculations. He even labels the calculation of 12F as “MEAS. UNCERT.”
Yes sir, I did. I also said it was preliminary. I’m pretty sure it was for Tmax only. Besides the point now.
You had just as well forget what I said before, because I have moved to another method of calculation, i.e., TN 1900. You might want to familiarize yourself with it.
And because the average of Tmax and Tmin hides so much of the variability, I am only working with them as separate distributions. They are both generated by totally different waveform functions and therefore Tmax and Tmin are representative of entirely different distributions.
They are also terribly correlated and therefore their average is not Independent which both the LLN and CLT require. They are both from different distributions, which again violates the assumptions necessary for the LLN and CLT.
It would behoove you to begin investigating the assumptions necessary for many of the statistical calculations and tests you make rather than just formula shopping. An example is you never quote a variance/SD for any mean you use! Where do you think that variance/SD goes throughout the calculations? Does it just magically disappear through the magic of statistics?
“You had just as well forget what I said before, because I have moved to another method of calculation, i.e., TN 1900. You might want to familiarize yourself with it.”
TN1900 was the method you were claiming to use in previous comments.
“I’m pretty sure it was for Tmax only. Besides the point now.”
Nope. The table you posted was showing average temperatures.
https://wattsupwiththat.com/2023/02/01/uah-global-temperature-update-for-january-2023-0-04-deg-c/#comment-3674980
e.g. June 1953 is TMax: 34.0, TMin: 21.4, TAvg: 27.7.
Your table gives the June figure as 82, which assuming you are using °F, is 27.8°C.
“It would behoove you to begin investigating the assumptions necessary for many of the statistical calculations and tests you make rather than just formula shopping.”
Says someone who tries to calculate the SEM using the seasonal monthly variance as the standard deviation.
“An example is you never quote a variance/SD for any mean you use!”
I keep asking what standard deviation you want, and why you think it would be relevant?
“Where do you think that variance/SD goes throughout the calculations? Does it just magically disappear through the magic of statistics?”
Depends on what you are talking about. Do you know?
“””””Says someone who tries to calculate the SEM using the seasonal monthly variance as the standard deviation.”””””
That is exactly what the NIST TN1900 shows. If you have a beef with them you should take it up with them.
Perhaps you didn’t read my response to bdgwr. I attached a screenshot of a standard old standard deviation calculator. It uses the same method. Funny how that works.
You need to critique the method instead of just making an assertion that it is incorrect.
“””””Depends on what you are talking about. Do you know?”””””
I asked first, you’re it!
It is not “exactly” what they show. They show a SEM calculation on individual daily values from a single month. You took monthly averages from the whole year. The standard deviation you see comes almost entirely from the seasonal variation.
The irony is still that you accuse me of just plugging values into an equation without understanding the assumptions behind it, and then do just that by putting the monthly absolute values into a SEM calculator.
Your values are not random IDD variables.
If you are talking about the image, those are values from bdgwx’s calculations of how adding an average value in changes calculations. They are not daily, monthly, or annual anything.
I have not done that. I have calculated January monthly values using daily Tmax and Tmin. For the baseline, yes, I used the January average for Tmax and Tmin from each year. I then used the method in TN1900 to calculate the baseline average and its uncertainty. As I tried to show, the calculation procedure is not isolated to the TN1900. It is an accepted algorithm for finding an expanded uncertainty. Your argument is not with me, but with other authorities. You should contact them with your concerns.
Better yet, show us references that differ in the algorithm that should be used. Otherwise your protestations will fall on deaf ears.
You are barking up the wrong tree. Nothing I have shown yet used an average based upon a 12 months annual average. I will be doing each month separately which eliminates any seasonal variation with which you are concerned. My point? If no months show any growth in warming, then by inference, there can be no annual growth either. It also shows that CO2 can not be the driver of “heat” for just one or two months.
Sorry dude, I have studied the assumptions. From TN1900, (a) measurement and systematic uncertainty are negligible, (b) the distributions can be assumed to follow a Student’s t distribution, and (c) an expanded uncertainty is calculated by multiplying the SEM of the sample by a Student’s t factor based upon the degrees of freedom.
Lastly, if you have examined the common data of Tmax and Tmin, you should have determined that they are extremely correlated. Something like >0.9. That means they are not considered independent! No statistic determined from them can be considered to be independent either. In other words, Tavg is not made up of independent elements. That means the LLN and CLT can not be used to justify any finding since the IID assumption is violated.
Hence the reason for treating Tmax and Tmin as each independent from each other! That is also bolstered by the fact that they are each samples drawn from different distributions, again violating IID when averaged together.
“If you are talking about the image”
Well I was thinking about the image in your original comment
https://wattsupwiththat.com/2023/02/01/uah-global-temperature-update-for-january-2023-0-04-deg-c/#comment-3674980
I’d assumed your other image was the same. But it doesn’t really matter. The point still stands. Calculating a SEM from a standard deviation based on seasonal variation is where your method is wrong.
“I have not done that. I have calculated January monthly values using daily Tmax and Tmin. For the baseline, yes, I used the January average for Tmax and Tmin from each year.”
We may be talking at cross purposes here. I ‘m refering to the specific chart you showed in the referenced comment. There you seem to be calculating the average monthly value for each month of 1953, then using the standard deviation of these monthly values to determine the SEM and uncertainty of the annual value. This has nothing to do with base lines.
As I suggested, if you want to do this better you should be taking monthly anomaly values rather than absolute values, as you want to remove the seasonality. Maybe you’ve done that elsewhere, but I haven’t seen it. I don’t read every comment made to every article.
“It is an accepted algorithm for finding an expanded uncertainty.”
And I’ve not disagreed with it. Treating the SEM as the uncertainty (at least the non-biased part) of an average is what I’ve been advocating for years, and you kept telling me I was wrong to do so. I’m glads you are now accepting it. But that doesn’t mean you can just plug any values into a SEM calculator and get a meaningful result. The assumptions are that values in the sample are random, independent and are identically distributed. Sometimes these assumptions don’t matter too much, but in your case they definitely do. You are not taking random samples from throughout the year, or looked at another way, each month is not an identically distributed random variable. Augusts will always be hotter than Januaries, and you will always have exactly one August and one January in each “random” sample.
“I will be doing each month separately which eliminates any seasonal variation with which you are concerned.”
Then that’s not what I was talking about. I’m talking about what you did do, not what you intend to do in the future.
“My point? If no months show any growth in warming, then by inference, there can be no annual growth either.”
And agin this has nothing to do with my point, which was your claim that the annual uncertainty was around ±6°C.
For the last time, that was from preliminary work. Think of it as a prerelease. I don’t even have that spreadsheet anymore and am not going back to redo the formulas.
If that’s all you got to argue about, don’t bother!
Fine. then all you had to say is you no longer agree with your earlier assessment, and say what your new uncertainty assessment is. But it was only a couple of weeks ago when I was being yelled at and called a troll because I pointed out that this same uncertainty figures where obviously nuts. Maybe if you had spent more time pointing out how preliminary the figures were, we could have saved a lot of wasted time.
“””””And I’ve not disagreed with it. Treating the SEM as the uncertainty (at least the non-biased part) of an average is what I’ve been advocating for years, and you kept telling me I was wrong to do so. I’m glads you are now accepting it. But that doesn’t mean you can just plug any values into a SEM calculator and get a meaningful result. “””””
Let’s be honest here. The expanded uncertainty being calculated is the statistical uncertainty from the distribution. It IS NOT the measurement uncertainty from random errors and systematic error.
The fact that sampling bias and small samples sizes result in a larger uncertainty than the measurement uncertainty doesn’t remove the fact that measurement uncertainty is important.
“””””You are not taking random samples from throughout the year, or looked at another way, each month is not an identically distributed random variable. Augusts will always be hotter than Januaries, and you will always have exactly one August and one January in each “random” sample.”””””
Don’t try to rationalize seasonality as a reason not to look at annual monthly averages. I spent 30 years of my career dealing with call center hiring and scheduling along with circuit provisioning. Seasonality was just one issue. In general if growth appears only in certain months, it WILL BE APPARENT in graphs of total monthly averages. Same with negative growth in other months. The real problem is using a Tmid that hides what is happening at different times.
“It IS NOT the measurement uncertainty from random errors and systematic error.”
Measurement uncertainty was the words you used. NIST TN 1900 talks about uncertainty of the measurement result, and distinguishes between measurands derived from measurement equations, and those defined by observation equations, Example 2 being an example of the latter. They are treating the daily average maximum temperature as being made up from observations with random errors about the average. (Whether this makes sense for measuring the actual monthly temperature is a question I ask myself, but I’m happy to accept it for the sake of argument.)
“The fact that sampling bias and small samples sizes result in a larger uncertainty than the measurement uncertainty doesn’t remove the fact that measurement uncertainty is important.”
As I’ve tried to point out before, I think that uncertainty from sampling should usually be a lot greater than the uncertainty from measurements.
“Don’t try to rationalize seasonality as a reason not to look at annual monthly averages.”
I’m not doing anything of the sort. In fact I advocate using annual averages as a way of removing the seasonality. But this has nothing to do with the uncertainty.
“In general if growth appears only in certain months, it WILL BE APPARENT in graphs of total monthly averages.”
Your ability to keep missing the point is quite spectacular. This is not about whether some months are warming faster than others. It’s about the fact that some months are naturally warmer than others.
“The real problem is using a Tmid that hides what is happening at different times.”
It doesn’t matter if we are using TMAX, TMIN or TAVG, it will still be the case that some months are warmer than others, and using the standard deviation of those months to calculate the standard error of the mean will not be meaningful.
You haven’t read the document have you?
The error components of calibration and reading the thermometer are negligible. And, the conclusion is:
“Therefore, the standard uncertainty associated with the average is u(r)= s ∕ √m = 0.872 ◦C.”
It is called the standard uncertainty, not the measurement uncertainty as associated with “reading the scale inscribed on the thermometer.“
You are trying to pick things apart like grammar and the use of nouns and adjectives. You are not advancing any cogent arguments about why this Technical Note is incorrect in determining the monthly average temperature and its expanded uncertainty.
Do not expect any further responses if you can’t address the issues contained in the Technical Note. You are wasting everyone’s time and patience by not addressing the facts with any references whatsoever. When was the last time you gave a link to a reference describing why something you think is wrong is correct? Tell folks what is wrong with anything in that Technical Note and show them why with references.
“And I’ve not disagreed with it. Treating the SEM as the uncertainty (at least the non-biased part) of an average is what I’ve been advocating for years, and you kept telling me I was wrong to do so. “
It is wrong. Possolo in TN1900 had to make the assumption that all uncertainty was negligible in order to use the variation of the data. It’s the same assumption *YOU* always make and then deny: all measurement uncertainty is random and Gaussian and therefore cancels.
In Possolo’s example he is using multiple Tmax values from the same location using the same device. That means he is (approximately) measuring the same thing multiple times. IF, and it is a big if, you can assume that systematic bias is negligible then assuming the measurement uncertainty cancels is at least understandable if not actually realistic. Then the uncertainty is can be estimated using the variation of the measured values.
But you must at least attempt to measure the same thing multiple times. Tmedian is *NOT* a measurement. Tmax and Tmin are. Using even Tmax and Tmin by themselves to get monthly averages of each is a crapshoot in some months like March and September because of seasonal changes. There isn’t any way to account for that because it shows up in the variance of the temps and those carry over into the anomalies as well. It’s why it *should* be an imperative to include the standard deviation or variance with *everything* having to do with trying to use temperatures. The fact that this just gets ignored all the time is one reason why things like the “global average temperature” is useless.
I am pretty sure I also qualified that statement as preliminary.
It also was done by finding the straight Variance of the data. I have since began using the method in TN 1900 so that any disagreement can be taken up with NIST.
“I am pretty sure I also qualified that statement as preliminary.”
Not sure where.
Sorry. Those were meant to be three separate block quotes, but wordpress decided to join them together.
You are still barking up as tree with nothing in it. As I have said before, these were made prior to using only Tmax and Tmin as separate signals.
You aren’t going to get any satisfaction from me by bringing up quotes that I made in the past and have since said are no longer meaningful.
If you want to do something useful, refute the graph I showed for January Tmax and Tmin. That is what I feel is pertinent to what temperatures are doing. I will be doing the other months for this station and then moving on to others around the U.S. and then the world. I feel confident there are many other places with little to no growth.
“You aren’t going to get any satisfaction from me by bringing up quotes that I made in the past and have since said are no longer meaningful.”
It was three weeks ago. If you are admitting you were wrong then that’s progress.
“If you want to do something useful, refute the graph I showed for January Tmax and Tmin”
What’s to refute? I’m not sure what point you think they make, and I assume you are using the same mysterious data Tim uses.
I’d say you shouldn’t be joining the two different sections whilst ignoring the missing data. And your uncertainty intervals should be around the values rather than the baseline.
Here’s my own graph of TMax values for January along with a trend line.
The warming rate is 0.48°C / decade.
And here’s the same for TMin.
Warming rate is 0.18°C / decade
By the way, I noticed your data doesn’t seem to include 1970 or 1998. Again it would be useful if you say exactly what data you are using.
“Seriously, if one location on the globe has seen no trend in Tmax or Tmin since 1953 then where *is* the global warming occuring?”
You haven’t established there has been no warming in that one location. As I said, the data I used showed a warming rate of 0.11°C / decade, around 0.8°C warming since 1953. This compares with global trends of about 0.15°C / decade over the same period (Using NOAA data). The ±0.11°C / decade uncertainty in the Topeka trend, just means it is not significantly different from he global trend.
“For every station with *no* global warming there has to be another station with twice the global average in order for the global average to be what it is!”
That’s not necessarily true.
“If the global average has gone up 0.6C since 1950 then there has to be a station somewhere that has seen 1.2C increase in order for the average to come out to 0.6C! Where is that station?”
The global average has gone up about 1°C since 1953 using the NOAA trend.
You’ll just dismiss it as UHI, but as it’s on my laptop at the moment Oxford in the GHCN has a trend of +0.25 ± 0.06°C / decade.
“You haven’t established there has been no warming in that one location. As I said, the data I used showed a warming rate of 0.11°C / decade, around 0.8°C warming since 1953. “
I simply don’t know how you are calculating this.
For the KFOE temp data Libreoffice Calc shows the trends as:
For Tmax the slope of the trend is 1.17 E-05
For Tmin the slope of the trend is 9.64 E-06
These are for Kelvin temperatures.
They are so small as to be equal to zero.
“That’s not necessarily true.”
Your lack of math skills is showing again!
“The global average has gone up about 1°C since 1953 using the NOAA trend.”
Not in Topeka apparently.
“You’ll just dismiss it as UHI, but as it’s on my laptop at the moment Oxford in the GHCN has a trend of +0.25 ± 0.06°C / decade.”
.25 is smaller than 1. So somewhere else has to have gone up by 1.75 (7 times more than .25) in order to get an average of 1. So where on the globe has the average temp gone up by 1.75C?
“I simply don’t know how you are calculating this.”
I downloaded the GHCN daily values for USW00013920. I calculated the TAVG from TMAX and TMIN. I calulated average monthly values from the daily values, and annual values from these monthly values, rejecting any year that didn’t have 12 monthly values. I then just ran the annual values (starting from 1953) through the lm function in R. Here’s the result
Coefficients:
             Estimate Std. Error t value Pr(>|t|)
(Intercept) -9.187557  10.822926  -0.849   0.4011
Year         0.011092   0.005436   2.040   0.0481 *
---
Signif. codes:  0 ‘***’ 0.001 ‘**’ 0.01 ‘*’ 0.05 ‘.’ 0.1 ‘ ’ 1

Residual standard error: 0.8689 on 39 degrees of freedom
Multiple R-squared:  0.09644,	Adjusted R-squared:  0.07328
F-statistic: 4.163 on 1 and 39 DF,  p-value: 0.04813
And here’s a graph.
Here are my graphs of Tmax and Tmin. Neither show any discernable slope up or down.
You didn’t compute *average* values, you computed MEDIAN values. It is Tmax and Tmin that determine climate, not Tmedian. Neither Tmax or Tmin show that the climate is changing in here in east central Kansas. As a control I also downloaded data from Appleton City, MO which is in the same geographical area. It shows the same. I’ll leave the graphs in the next message.
Here’s the Appleton City, Mo graphs.
We are *NOT* seeing any increase in either Tmax or Tmin in this are. That’s one reason to question CAGW. If this region is not experiencing increasing temperatures then somewhere else must be experiencing really significant increasing temperatures.
Do *YOU* know where that might be?
Regarding note 4 above. Using the GHCN daily data from 1953 to 2022 for TMAX, I get a trend of 6.93 E-5 °C / day. Still about 10 times your rate. This is equivalent to 0.25 °C / decade.
However, graphing this suggests where the difference is.
In your data there is a noticeable break in the modern part of the data, which isn’t present in mine. In your data the maximum temperatures never got close to 100°F for about a decade, then suddenly are almost always reaching 100.
Probably an issue with raw verses adjusted data.
Thermodynamics should be done in Kelvin. That’s what I did. Try it and see if it makes a difference.
Apart from the fact that most of the time you insist on using Farenheit.
But why on earth do you think adding a constant to all the values will change the trend?
Bellman
“””””But why on earth do you think adding a constant to all the values will change the trend?”””””
From NIST
“””””The concept of an absolute temperature scale is powerful; it is different than simply relative temperature, in which objects are talked about being hotter or colder than something else. The absolute, thermodynamic temperature of an object provides information on how much average energy of motion (kinetic energy) its atoms and molecules have. “””””
https://www.nist.gov/si-redefinition/kelvin-introduction
Which has absolute zero to do with my point.
Why do you think a trend will be different if measured in Celsius or Kelvin? Or, Fahrenheit or Rankine? You are literally just adding a constant to all values in each case.
“””””The absolute, thermodynamic temperature of an object provides information on how much average energy of motion (kinetic energy) its atoms and molecules have. “””””
Do you think this is not important?
Have you ever learned thermodynamics or chemistry?
Have you ever learned what adding a constant does to a slope?
If you want to deal with thermodynamic properties etc, you have to use an absolute scale. If you want to do any non linear arithmetic you have to use an absolute scale. But all we are doing here is looking at the change in temperature and that is not affected by the scale you use.
Tomato – tomato. You use what you want.
Thanks.
In other words there is no reason why every thermodynamic textbook I have uses Kelvin?
And you think changing from Farenheit to Kelvin is merely adding a constant? You’ve never bothered to actually look up how to do that, have you?
“In other words there is no reason why every thermodynamic textbook I have uses Kelvin?”
Would you for once actually read what I say and respond accordingly.
If you are dealing with thermodynamics or any thing requiring you to know the absolute temperature you use and absolute temperature scale – and that should be the appropriate SI units.
But this makes no difference to a linear trend, because all you are looking at is a change in degrees and 1 degree C is the same as 1 K.
“And you think changing from Farenheit to Kelvin is merely adding a constant?”
Nope. And I hope I’ve never said that. But as always you prefer to argue against the things I haven’t said rather than admit a simple and obvious point. Changing from Celsius to Kelvin is simply adding a constant. If you want to convert from Fahrenheit you will also have to scale the value.
“You’ve never bothered to actually look up how to do that, have you?”
Do you really think these constant pathetic insults help your argument?
“Would you for once actually read what I say and respond accordingly.
If you are dealing with thermodynamics or any thing requiring you to know the absolute temperature you use and absolute temperature scale – and that should be the appropriate SI units.”
ROFL!! Of course atmospheric and surface temps have nothing to do with thermodynamics.
You fail at physical science every time you post!
Still refusing to read or address my point. This is not about thermodynamics, it’s about what happens to trand when you add a constant to every value.
And you have *NEVER* bothered to go see how to convert F to K. I knew you wouldn’t. You’d rather just live in your bubble of delusion.
BTW, I’ve attached the cooling an heating degree-day graphs (over the past 277 months) for KFOE and for KSZL (Whiting AFB near appleton city). They all show a similar trend line as to what I’ve posted in my spreadsheet.
The slope is out in the E-05 decimal place. In other words impossible to tell if it is cooling or heating, just like it is impossible to tell what Tmax and Tmin is doing. It’s certain that there is no discernable “global warming trend” at either location. But you just continue on in your delusional bubble believing that there is.
I’ll repeat: If anyone is scared of CAGW just move to east central Kansas – it’s not happening here.
Excellent!
“And you have *NEVER* bothered to go see how to convert F to K. I knew you wouldn’t. You’d rather just live in your bubble of delusion.”
Such childish insults.
F to C: (F – 32) / 1.8 = F / 1.8 – 17.78,
C to K: C + 273.15
So
F to K = F / 1.8 + 255.37
Still no explanation from you as to how adding a constant to all values can change the slope.
“In other words impossible to tell if it is cooling or heating”
In other words, you claim that there is a 70 year long pause is not something you can back up with the data.
“I’ll repeat: If anyone is scared of CAGW just move to east central Kansas”
Thanks, but apart from the problem of emigration, I wouldn’t want to live somewhere that frequently goes over 40°C.
“F to K = F / 1.8 + 255.37″
ROFL!! F * (1/1.8) is adding a constant?
“Apart from the fact that most of the time you insist on using Farenheit.”
I don’t insist on using F. Where do you get that from? Most of the temperature values are in Celsius!
“But why on earth do you think adding a constant to all the values will change the trend?”
What happens when the trend data includes values of 0 which add nothing to the total sum but increase the number of values?
There *IS* a reason why physical scientists and engineers use Kelvin (or Rankin). But it is absolutely not surprising that you don’t understand that. You truly have no use for the real world, do you?
“I don’t insist on using F. Where do you get that from? Most of the temperature values are in Celsius!”
You very rarely specify what units you are using, but as you are often quoting temperatures close to 100, I tend to assume they are in F.
“What happens when the trend data includes values of 0 which add nothing to the total sum but increase the number of values?”
The same as when it’s any other value. You could test it yourself. Calculate your trend using °C, including zeros, then convert to K. The result should be an identical slope, just a different intercept.
Most of the time, in any event, temperature trends are not being calculated in absolute Celsius, but as anomalies. And it’s the same thing, it doesn’t matter what the base period is the slope should be the same.
“The same as when it’s any other value. You could test it yourself. Calculate your trend using °C, including zeros, then convert to K. The result should be an identical slope, just a different intercept.”
I’ve put my spreadsheet on my web page. It shows there *is* a difference between using Farenheit and Kelvin. But I also know you won’t believe it. You’ll blame Libreoffice Calc for somehow being wrong.
“Most of the time, in any event, temperature trends are not being calculated in absolute Celsius, but as anomalies. And it’s the same thing, it doesn’t matter what the base period is the slope should be the same.”
The use of anomalies only INCREASES UNCERTAINTY! The uncertainty of the baseline ADDS to the uncertainty of the measurement. It does so whether you are adding or subtracting the two values. Therefore you can’t *know* what the trend actually is. And *YOU* have already said that adding a constant doesn’t change anything so how can using anomalies change anything?
You’ve never even bothered to go look up how to convert Farenheit to Kelvin, have you?
And, again, look at my spreadsheet. There *is* a difference in slope between using F and K.
One comment on Twitter asked why are we using a baseline calculated from inaccurate temperatures anyway. Why can’t climate scientists give us a “PREFERRED TEMPERATURE” by grid or climate zone by month and use that to gauge how far from the best temperature we are.
Very little climate science makes physical sense! An anomaly IS NOT a temperature anyway. It is merely an attempt to discern a differential.
“I’ve put my spreadsheet on my web page. It shows there *is* a difference between using Farenheit and Kelvin. But I also know you won’t believe it. You’ll blame Libreoffice Calc for somehow being wrong. ”
No. I blame it on the fact you have about 70 days with no tmax value, which you’ve treated as 255.37 for the Kelvin calculation. These missing values are towards the end of the data, so it’s hardly surprising that treating them as 0°F results in a slight negative trend.
Removing these values I get with R
Fahrenheit: 1.105e-5 °F / day
Kelvin: 6.139e-6 K / day
And 1.105e-5 / 1.8 = 6.139e-6
Note, this is using your incorrect data, hence the low rate of warming.
(Fahrenheit – 32) / 1.8 + 273.15
Dividing by 1.8 is *adding* a constant, right?
ROFL!!
Stop spending so much time rolling on the floor and try thinking, and maybe you wouldn’t keep making such a fool of yourself.
A change of 1 Kelvin is the same as a change of 1.8 Fahrenheit. Changing the units does not change the rate of change.
Unfreakingbelievable! If you divide every temperature by 1.8 what happens to the slope?
slope equals (distance / time)
slope_f = (Tstart-Tend)/time
slope_k = slope_f / 1.8
slope ≠ slope/1.8
It is *NOT* the same as just adding a constant!
If you measure a wooden board as 5′, and then convert that figure to inches by multiplying by 12 and saying it is 60″ long, do you think that makes the board 12 times longer?
You are using different units, you have to scale your figures appropriately. The numbers are different but the temperatures are the same.
“You are using different units, you have to scale your figures appropriately. The numbers are different but the temperatures are the same.”
You are equivocating again. The issue was why the slopes change when you use Kelvin like engineers and scientists do.
You kept saying that adding a constant won’t change anything from Fahrenheit to Kelvin as if the change only involved adding a constant.
Now you are trying to weasel out of admitting to that by trying to say DegF and DegK describe the same temperature.
You are pathetic!
“You are equivocating again.”
You still don’t know what that word means, do you? I assumed even you would have the intelligence to realize that when using different units you will have different numbers that equate to the same value. That even you wouldn’t think that a rise of 10°F is not the same as a rise of 10°C.
Really this is very, very simple. You made the eronious claim that the linear rate of warming would be different if you measured the temperature in an absolute scale rather than a relative scale. E.g between K and C. I explained why that was nonsense. The temperature scale cannot make a difference to the slope because the temperatures are the same, just different units. This is equally true if you convert from C to F, or from F to K. For some reason you now think that because F and K have different scales and therefore different scales for the slope, that somehow means the slopes are different.
Really. Just answer me this. Do you think these statements are equivalent?
“That even you wouldn’t think that a rise of 10°F is not the same as a rise of 10°C.”
YOU ARE THE ONE THAT CLAIMED IT WAS JUST ADDING A CONSTANT!
If that were true then a rise of 10F *would* be the same as a rise of 10C.
“You made the eronious claim that the linear rate of warming would be different if you measured the temperature in an absolute scale rather than a relative scale. E.g between K and C.”
Put down the BOTTLE! We were discussing the Forbes AFB graphs, one of which was in F and one of which was in K. *YOU* said they should have the same slope when it was obvious they didn’t.
The NOAA data is not provided in celsius, it is provided in fahrenheit.
You state: “The temperature scale cannot make a difference to the slope”
And then you list out .18F/decade and .1K/dec as being the same. Hint: THOSE ARE NOT THE SAME SLOPE!
slope = distance/time. distance in temp and time in decades. Different slopes. PUT DOWN THE BOTTLE!
“Put down the BOTTLE! We were discussing the Forbes AFB graphs, one of which was in F and one of which was in K. *YOU* said they should have the same slope when it was obvious they didn’t. ”
Yes, one showed a positive warming rate, and one a negative. At which point a smarter person, might have wondered if there was an mistake in their data. But, no, your data had to be perfect. If I suggested there was anything wrong with your data it was equivalent to saying LibreOffice was wrong. So I had to help you out by looking at your own spreadsheet and finding the error in the data. Do you remember?
I then pointed out that using the correct data showed both slopes where the same, that is allowing for the difference in scale between F and K. Here’s the link in case you missed it
https://wattsupwiththat.com/2023/02/20/is-noaa-trying-to-warm-the-current-8-year-pause/#comment-3686304
My values.
“The NOAA data is not provided in celsius, it is provided in fahrenheit.”
You can cchoose either, and it’s trivial to convert between the two.
“And then you list out .18F/decade and .1K/dec as being the same. Hint: THOSE ARE NOT THE SAME SLOPE!”
Better hint (without the all caps), they are the same. Slope isn;t just a number. It’s a rate of change, in temperature units per time unit.
“slope = distance/time. distance in temp and time in decades. Different slopes.”
Only if you think 1F is the same “distance” as 1K.
“PUT DOWN THE BOTTLE!”
Yet some here think I‘m a troll.
“I then pointed out that using the correct data showed both slopes where the same”
The slopes were *NOT* the same.
km/hr is *NOT* the same slope as miles/hour
Why you would think those ae the same slope can only be indicative of your lack of understanding physical science. You simply can *NOT* substitute km/hr for mi/hr. You cannot substitute degF/decade for degK/decade. The units are different! Therefore the slopes are different!
“It’s a rate of change, in temperature units per time unit.”
ROFL! No kidding. Try substituting km/hr for mi/hr sometime and see if it works out for you. Try substituting degF/decade for degK/decade sometime and see if it works out for you!
Just what do you think the slope of a trend line is? Unless you are dealing just with numbers, the slope has the same dimensions as the x and y axis. Changing the units does not change the slope.
“km/hr is *NOT* the same slope as miles/hour”
And I say that a slope (or speed) of 100 km /hr is the same as a slope (or speed) of 62 miles / hour. (rounding errors aside). If you don’t agree, try arguing it with a speed cop.
Tmax is based on a sine wave. Tmin is based on an exponential decay. They are *NOT* the same distribution. If the temps are considered random variables then they *must* have the same distribution in order to calculate an average.
When you combine two different distributions like this you get a skewed distribution. The typical way to describe such a distribution is by using the 5-number statistical description. I.e. a MEDIAN plus the range and the quartile values.
With a skewed distribution the median is *NOT* the average and doesn’t do a good job of describing what is happening without the other descriptors such as the range and quartiles.
That is almost certainly why Tmax and Tmin can show no change while your average does. You are *not* being accurate when you use (Tmax + Tmin)/2 as to what is happening with the distribution!
“It’s not possible for the max and min to not change but for the average to go up.”
I’ve given you the graphs for Tmax and Tmin from three different weather stations with different time intervals. You are denying what is as obvious as the nose on your face. They show no change. It’s what Mr. Abbott has been trying to tell you since you’ve been on here at WUWT.
You’ve got your little statistical hammers named “average” in your left hand and “Gaussian” in your right hand and By Pete, you are going to pound everything into submission with those hammers.
I keep telling you to get out of that box you live in but you never do. Maybe you might try calculating daily diurnal intervals and see what that data gives you. Or figure out how to integrate daytime and nighttime temps. I’ve given you a web site that will do that for you before – it’s called degree-day calculations. Maybe if you look at those you can tell why your “average” calculation doesn’t match what the actual graphs of the temperatures show!
“Tmax is based on a sine wave. Tmin is based on an exponential decay.”
Tmax is based on the maximum temperature recorded during the day and Tmin is based on the minimum temperature recorded during the day.
“If the temps are considered random variables then they *must* have the same distribution in order to calculate an average.”
Rubbish on all counts.
“The typical way to describe such a distribution is by using the 5-number statistical description.”
And how do you do that with just two data points? You have the range, but nothing else.
“That is almost certainly why Tmax and Tmin can show no change while your average does.”
It’s simple logic. The trend of the average can not be outside the trend of the maximum and minimum. And as you keep missing, I’ve done the same calculation with max and min. Guess what? The trend of the mean was halfway between the trend of the max and the trend of the min.
“I’ve given you the graphs for Tmax and Tmin from three different weather stations with different time intervals.”
How many more times? I am not denying your trends are different to mine. I’m saying the reasons are not because I’m using a mean. You can easily test it for yourself by calculation the trend of the mean using your data. It should come to something between the trend of your max and your min.
“You’ve got your little statistical hammers named “average” in your left hand and “Gaussian” in your right hand and By Pete, you are going to pound everything into submission with those hammers”
You’ve got one cliche and you’ll use it at every opportunity no matter how meaningless it becomes.
“Tmax is based on the maximum temperature recorded during the day and Tmin is based on the minimum temperature recorded during the day.”
Daytime temps are a sine wave in shape because of the travel of the sun across the globe. Nighttime temps are an exponential decay.
THESE ARE NOT IID DISTRIBUITONS. You cannot average distributions that are not iid. Why do you deny that simple truism?
“Rubbish on all counts.”
Being iid means you have a stable phenomenon you are analyzing. If they are not iid then you do *not* have a stable phenomenon. The average of a non-stable phenomenon is meaningless. It cannot be a “true value”. This is the *exact* situation with temperature measurements, you are measuring different things with different distributions, including Tmax and Tmin at the same location. Iid is a requirement for the central limit theory to apply. If the temperatures are not iid then CLT will not work for guaranteeing that the sample means are normally distributed. If the temperatures are not iid then the law of large numbers cannot guarantee that your sample will be close to the population average – i.e. the sample mean will have a large uncertainty.
It’s why statisticians like you and the climate scientists always assume temperature data is random and Gaussian – because then you never have to worry about anything like uncertainty!
“And how do you do that with just two data points? You have the range, but nothing else.”
That *IS* the big question! It doesn’t mean that you can just ignore it like you and the climate scientists do!
We have had the data to actual physical science since at least 1980. There are lots of locations with 20year degree-day data sets which integrate *entire* temperature curve so that doing garbage like combining daytime and nighttime temps into a median is unnecessary. *I* have 5 minute data since 2018 and 15 minute data since 2012 from my own weather station that can be used for the purpose.
The only other method is to analyze Tmax and Tmin separately. See what Tmax is doing and what Tmin is doing. That will tell you far more about the climate then some hokey Tmedian that can be the same value from locations with different climates!
Tmedian LOSES all the actual data that will tell you about the actual climate! Why does *anyone* still use it today? Ans: TRADITION. One of the biggest argumentative fallacies that exist.
I take it from you continuing down this pointless obsession, that you are not going to do the one thing I asked and actually tell me where you got the data you used to claim there had been no warming at Topeka.
“You cannot average distributions that are not iid. Why do you deny that simple truism?”
It’s not remotely the truth. IID has nothing to do with the ability to average things. We are not taking a random sample here, we are just finding the mid point between the two extremes. It may, or may not, be close to the actual average temperature throughout the day. But it is the average of the two extremes, which historically is normally all you have.
“The average of a non-stable phenomenon is meaningless.”
In what way is the daily temperature not stable, and not IID. I’m not sure you actually understand what IDD is, and you keep mixing up what random variables are being used here. If you take a single temperature from a random point of the day, it’s a random variable with a particular distribution. If you take two or more values from random independent times of day, they are each a random variable with the same identical distribution, that is they are IID.
But none of this has anything to do with taking an average, either by averaging max and min values, or by taking a systematic set of evenly spaced values throughout the day. In neither case do you have a random sample, which means you probably have a better estimate of the average than if you took an actual random sample.
” If the temperatures are not iid then the law of large numbers cannot guarantee that your sample will be close to the population average – i.e. the sample mean will have a large uncertainty.”
What samples and what population? If you are talking about daily temperatures, then the fact you don’t have a random sample, but a systematic distribution means you are much more likely to be close to the population mean.
“Tmedian LOSES all the actual data that will tell you about the actual climate! Why does *anyone* still use it today?”
Nobody uses Tmedian. That’s just your fantasy. What’s used is TAvg, and that’s still used today because it’s the simplest way of comparing past and present temperatures, given the data that is available.
You surely don’t understand. Read this link.
Independence, Covariance and Correlation between two Random Variables | by Manpreet Singh Minhas | Towards Data Science
From the link.
I can define a random variable as the Tmax temps in a month. I can define another random variable as the Tmin temps in a month. Their very definition (max and min) as two different types of measurements results in this. I can find their covariance and correlation coefficient. I can assure you that they are closely correlated which means they ARE NOT INDEPENDENT VARIABLES.
With that being decided, their average can also be inferred to not be independent. An average is made from parts. If the parts are not independent then their combination in an average does not make them magically independent. Some transform other than a simple average would need to be done to make the parts independent. If you wish to refute this, you need to provide references that show averaging two correlated variables somehow converts the means to an independent variable.
Here is another link with some pertinent information.
18.1 – Covariance of X and Y | STAT 414 (psu.edu)
You keep confusing the different correlations here. For one day max and minimum temperatures are correlated with each other – hot maximums are likely to be paired with hot minimums. The average of the two are not correlated. A single value can’t have a correlation.
If maximum and minimum temperatures were independent from day to day (they’re not), the daily average temperature would be independent. A hot day would not necessarily be followed by another hot day.
In reality average daily temperatures are not independent, hot days tend to be followed by other hot days, hence auto correlation. But that’s just as true for daily maximums and minimums temperatures as it is for daily averages.
And none of this means you cannot have a monthly or annual average either for maximum, minimum or mean values. The issue of independence is with uncertainty, and that also depends in these cases with exactly what you are measuring.
“””””The average of the two are not correlated. A single value can’t have a correlation.”””””
But the parts that make up that average control what the distribution around the mean is classified. You continue to treat a mean as a unique and independent number on a number line. It is not! It is a central moment of a distribution, even with only two numbers making up the mean, it is a statistical descriptors of that distribution.
“””””The issue of independence is with uncertainty, and that also depends in these cases with exactly what you are measuring.”””””
You are incorrect. Independence is a critical part of the LLN and CRT theorems. It doesn’t only have to do with uncertainty. It is a necessary base assumption that has to do with the ability of samples to converge to a single value.
I would recommend you read this article by W. M. Briggs at:
https://www.wmbriggs.com/post/17158/
It says:
“””””This is a perfect instance of the Deadly Sin of Reification. Of any actual series of numbers, including a series of length 1, a mean may be calculated. But that series does not have or possess a mean. The data do not sense this fictive mean, nor is the data influenced any way by this hobgoblin, because, simply, THE MEAN DOES NOT EXIST; and since it doesn’t exist, it doesn’t have any causative power. And the same is true for any statistical characteristic of any data.”””””. (capitalized by me)
A mean is a statistical descriptor of a set of data. It is not meant to be perceived as an actual physical part of the data. Learn that and you will have a better understanding of what statistical calculations are telling you.
You are never going to get bellman to understand any of this.
The problem is that averaging two series is a smoothing operation. It removes information from both data streams. You have chosen a method that covers up information.
How do I know? Here is a mean => 70. What numbers created it? Better yet the next set in the series has a mean of 72. What number(s) changed to create the increase?
You can trend the means of of Tmax and Tmin all you want, but the trend will tell you nothing about the factors that create the numbers you are trending. Removing the “seasonality” will do nothing to tell anyone what changes are going on in that “season”! Every method that you have chosen to use hides more and more information about what is happening.
When I plot Tmax or Tmin separately for one month each year, you can see what happened in that month throughout the entire time frame. Nothing is hidden, everything is available. I will be adding the baseline temperature used for each which means you can easily convert monthly Tmax and Tmin anomalies to absolute Kelvin temperatures. Try that with the GAT!
And I’ve also given you the results for max and min values separately.
In case you hadn’t noticed, this entire article is about using average temperatures to claim a pause. Nobody I’ve seen has criticized Steve Milloy for doing this, or suggested he is covering up information.
“When I plot Tmax or Tmin separately for one month each year, you can see what happened in that month throughout the entire time frame. Nothing is hidden, everything is available.”
Except you are not showing the daily data, or anything that is happening when the temperature was not at its maximum or minimum.
How about Tmax = 70 and Tmin = 45.
See the image!
Variance, s2: 312.5
s = √312.5 = 17.677669529664
sx̄= s√N=12.5
margin of error somewhere between:
57.5 +/-43 and 57.5 +/-72
I didn’t look up the proper t factor according to TN1900, so I am giving a range of where it may actually lay.
I’ve told you before, if you have a mean, you also have a variance and standard deviation, etc. You can’t seem to get through your head that an average/mean is a statistical calculation and not an actual measurement.
This wiki page adequately explains the moments surrounding a mean value. You can’t escape these when using statistics to describe temperature distributions.
Moment (mathematics) – Wikipedia
The question was how you determine a 5 number statistical description from just two numbers. Not about the uncertainty.
But as usual you are just plugging numbers into an equation without understanding why it doesn’t work in this case, and not doing the slightest sanity check on the result.
If the range of temps during the day is from 45 to 70, the average also has to be somewhere in that range. Your margin of error of ±43 is physically impossible. It is not possible for the average to be 14.5 or 100.5, because at no time during the day were temperatures less than 45 or more than 70.
SEM applies when you have a random independent sample. If you had taken two temperatures at independent random times in the day and one had been 45 and the other 70, then your SEM calculation might have some meaning. But they are not random temperatures taken during the day, they are the two most extreme temperatures from the day.
“””””But as usual you are just plugging numbers into an equation without understanding why it doesn’t work in this case, and not doing the slightest sanity check on the result.”””””
You need to do more than make an assertion that statistical descriptors of a distribution “doesn’t work”. You also need to define an accepted statistical test that will back up your “sanity check”.
Let’s look at 45, 50, 70, 75.
μ = 60
SD = 14.7
Expanded uncertainty => 60 ±14.4 to 60 ±19
Do these give you less heartburn? Why would the statistical descriptors using four numbers, be sane, yet two numbers aren’t?
What do you think three numbers might provide? Would that be insane?
You do realize that when you average Tmax and Tmin, you are creating a statistical descriptor of a distribution containing a number larger than the mean and a number smaller than the mean.
A consequence of using a data set that is extremely small is very large uncertainty of where that mean might actually be. The math doesn’t lie.
If you want to define the mean in another way, please show a reference!
I suspect you are trying to call it just another simple number without uncertainty or variance and ignore that it describes the center of a distribution.
“You need to do more than make an assertion that statistical descriptors of a distribution “doesn’t work”. You also need to define an accepted statistical test that will back up your “sanity check”.”
It’s difficult to provide what you ask if you won;t accept that claiming the average temperature during a day could be much larger than the maximum.
“Let’s look at 45, 50, 70, 75.
μ = 60
SD = 14.7
Expanded uncertainty => 60 ±14.4 to 60 ±19
Do these give you less heartburn?”
As I said I don;t think it’s a good idea to base a sample SD on just 4 values, but it’s certainly better than what you are doing with the maximum and minimum. I’m assuming your 4 values are genuinely random values taken form a population. This is very different to the situation where you know 75 has been chosen because it’s the largest value in the population, and 45 the smallest.
“Why would the statistical descriptors using four numbers, be sane, yet two numbers aren’t?”
Well for a start you have twice the sample size. But as I said max and min are not a random sample. The point of the SEM is to tell you what happens when you have a random sample from a population. If you have a random sample of just two values, what they will tell you is very little, hence the large SEM (and that could still be misleading if you are trying to estimate the SD from just those two values). But if you know the maximum and minimum values, you know the range, you know the average has to fall somewhere between the two, and unless you have a very skewed distribution it’s not likely to be close to either extreme, and more likely to be close to the mid-point.
“The math doesn’t lie.”
You keep pointing out the need to understand the assumptions behind the maths but then ignore all that in this case. The assumption of the SEM is that it’s a random IID sample from the population. That is not what you have with the maximum and minimum.
I debated not even answering this but here goes.
“””””It’s difficult to provide what you ask if you won;t accept that claiming the average temperature during a day could be much larger than the maximum.”””””
The AVERAGE could be much larger than the MAXIMUM! For some reason I don’t know how this could occur!
If you need help deciding anything, make Tmax = 75 and Tmin = 45.
“””””The point of the SEM is to tell you what happens when you have a random sample from a population.”””””
The point of the SEM, which is the standard deviation of the sample distribution, is to provide the interval in which the population mean may lay. In other words, the uncertainty in the estimated mean predicting the population mean.
“”””… and unless you have a very skewed distribution it’s not likely to be close to either extreme, and more likely to be close to the mid-point.”””””
ROFL! The mean is DEFINED to be the central point between the two values. The Variance, Standard Deviation, and SEM are defined as a measure of the possible values contained in the distribution.
DO THE MATH.
Tmax = 70 & Tmin = 45.
Mean = 57.5
Variance = (45 – 57.5)^2 + (70 – 57.5)^2 = 156.25 + 156.25
= 312.5
SD = √312.5 = 17.68
SEM = 17.68 / √2 = 12.5
T Factor @ur momisugly DF = 1 => 6.314
Expanded uncertainty = 12.5 * 6.314 = 78.9
57.5 ± 78.9
Can this define a normal distribution with 57.5 as the mean and 70/45 as points on the distribution? If you disagree, you need to provide some math and references showing a counter example.
“””””But if you know the maximum and minimum values, you know the range, “””””
No, you don’t know the range. You only know that you have a mean and two value on the distribution surrounding that mean. That is why the uncertainty is so large.
“No, you don’t know the range. You only know that you have a mean and two value on the distribution surrounding that mean. That is why the uncertainty is so large.”
What do you think the words “maximum” and “minimum” mean?
The are the maximum MEASURED value and the minimum MEASURED value. There is no guarantee that they define the range of possible values. There may have been larger and smaller values that didn’t actually get measured for whatever reason.
If you are going to create a distribution then you need to learn to live with the consequences of that creation. You can’t just take an axe to the distribution and say *these are the points I’m going to use as my limits”.
Your the one who wants to use maximum and minimum measured. If you think they are wrong and there may have larger and smaller values throughout the day, why would you think using just one would be more accurate than the average if the two?
Tracking Tmax and Tmin are at least ATTEMPTING to measure the same thing multiple times. Tmax and Tmin are different things from different distributions and as everyone keeps trying to tell you, multiple measurements of different things measured one time each doesn’t produce a distribution that tells you anything about physical reality. Multiple measurements of the same thing at least tries to get you in the ballpark of a true value, and that ballpark is defined by the propagated uncertainties.
No one is saying that Tmax and Tmin is wrong. It’s just that they don’t define the daily distribution perfectly. It’s why the uncertainty interval can give you values greater than or less than each. Something you seem to think is impossible. But it *is* statistically valid. You are so big on statistics but you won’t even accept what the statistics are telling you!
Same old, same old. Three, or four or six numbers can represent a distribution but two can not. I have scoured the internet trying to find a proof or declaration that two numbers can’t be used calculate statistical descriptors and I can find none.
I even showed him in another thread that technically an average is weighted by the probability associated with each occurrence.
Such that μ = X1•P1 + … + Xn•Pn
If all probabilities are the same, then each occurance is basically divided “1/n” or the sum is divided by “n”, i.e., an average. Two numbers, each with a probability of 1/2 (0.5) is a mean.
All we have is bellman’s, assertion that the results are insane. You’ll notice there are no references supplied!
How many more times? The problem isn’t that you are trying to calculate the SEM from a sample of two. It’s the fact that these two numbers are not random samples from the distribution, but are by definition the largest and smallest values in the distribution.
“I even showed him in another thread that technically an average is weighted by the probability associated with each occurrence.”
That would be for the population average. If you are just taking a sample then the probability of each value is determined by the number of times it occurs int he sample. But what do you think the probability of picking the maximum and minimum values in a distribution would be given just two random choices?
“All we have is bellman’s, assertion that the results are insane.”
That and the logic that the mean cannot be grater than the maximum value, or less than the minimum.
ROFL!! First you argue that Tmax and Tmin are the endpoints of the distribution, that there can’t be any values more than or less than they are, that they define the entire range of possible values. Now you argue that they are just samples from the distribution. Which is it?
“Now you argue that they are just samples from the distribution.”
I’m specifically saying they are not random samples. I can’t see where in my comment you got the idea I was saying anything else.
“””””but are by definition the largest and smallest values in the distribution.”””””
You just admitted there is a distribution.
From W. M. Briggs:
“””””This is a perfect instance of the Deadly Sin of Reification. Of any actual series of numbers, including a series of length 1, a mean may be calculated. “””””
“””””The calculation we also call a mean certainly can exist, if somebody troubles himself to flick the stones on his abacus. But for a series of size 1, a calculation for variance or autocorrelation cannot be done, yet the series still exists (the fallacy of limiting relative frequency lurks here;”””””
For a series of {1}, a variance nor a correlation coefficient cannot be calculated. A SERIES OF 1. He also says:
“yet the series still exists “, referring to a series of 1.
He doesn’t say it is impossible to calculate a variance or correlation coefficient for 2 or 4 or 6.
Think about this, a corollary of your assertion is that 2 data points that are not Tmax or Tmin would be ok to evaluate statistically.
Or perhaps, 2 data points can’t be used to determine any statistical descriptors at all which includes a mean.
As I said before on this thread, you have not provided ANY book reference, online reference, authoritative reference, mathematical proof or any document supporting your position.
If you want to go down the road with your CAGW peers and continue using Tavg and trending, be my guest. You will be left behind!
For myself, using the NIST TN1900 algorithm along with Tmax and Tmin is what I intend to do. It will be up to you to argue with NIST about retracting the Technical Note.
“You just admitted there is a distribution.”
“Admitted”? When have I ever denied it?
“For a series of {1}, a variance nor a correlation coefficient cannot be calculated. A SERIES OF 1.”
I think you mean sequence, not series. But I’ve no idea what point you think you are making here. I would say a sequence of one has a variance of 0. But I’m not sure if you are talking about a sequence or a sample from a larger population.
“He doesn’t say it is impossible to calculate a variance or correlation coefficient for 2 or 4 or 6.”
How do you get a correlation coefficient for a single sequence? You really need to spell out what this sequence is? Are they pairs or numbers, or random variables?
“Think about this, a corollary of your assertion is that 2 data points that are not Tmax or Tmin would be ok to evaluate statistically.”
You can evaluate max and min statistically, that’s what everyone does when they take their average. If you mean evaluate the standard error, my point is still that you can do that with a sample size of 2, but only if the two values are random, i.e. taken at completely random times of the day. But you would really need to know the population distribution, rather than the sample distribution. A simple distribution made up of just two values could be very wrong. What happens if your random sample consists of two identical values? Would you claim that meant there was no uncertainty in the mean?
“If you want to go down the road with your CAGW peers and continue using Tavg and trending, be my guest. You will be left behind!”
Do you include the author of this article or Lord Monckton in that list of peers?
“For myself, using the NIST TN1900 algorithm along with Tmax and Tmin is what I intend to do. It will be up to you to argue with NIST about retracting the Technical Note.”
By the NIST algorithm you mean calculating SEM, using stated values, just as I keep arguing.
I don’t particularly disagree with that example. If you want to estimate the uncertainty of the average max value from a sequence taken over the month, it’s a fair way of doing it. Though I think it could be improved by considering auto correlation and the non-stationary nature of temperatures across May.
But it is not comparable to taking an average based on maximum and minimum values. In their model each day is assumed to be a random variable about the mean, with an error that primarily comes from natural day to day variability. The difference between maximum and minimum values is not due to random natural variability, it’s due to deliberately selecting the hottest and coldest temperatures of that day.
“Tracking Tmax and Tmin are at least ATTEMPTING to measure the same thing multiple times.”
How many time did you keep insisting that it was impossible to measure the same temperature multiple times. Take a measurement one second later and the temperature has changed, or some such nonsense. Now you think that measuring a maximum temperature on consecutive days is measuring the same thing multiple times?
“It’s why the uncertainty interval can give you values greater than or less than each.”
Nope, the only reason that happens is because you are misapplying the concept of a standard error of the mean to something that isn’t a random sample.
“But it *is* statistically valid.”
Then demonstrate it. Go through all your data showing minute by minute temperature readings, and find one day where the precise average is so far removed from (Max + Min) / 2, that it is bigger than max, or smaller than min.
“You are so big on statistics but you won’t even accept what the statistics are telling you!”
Sorry, but how many times do you point out that you have to look at the assumptions of a statistical process? How many times do you claim some statistic is invalid “because it only works with normal distributions”? Yet now you trust in a SEM calculation when the sample is as far from random as it’s possible to get.
tg: “ at least ATTEMPTING to measure the same thing multiple times.””
bellman: “How many time did you keep insisting that it was impossible to measure the same temperature multiple times.”
Your lack of reading comprehension is showing again.
“Nope, the only reason that happens is because you are misapplying the concept of a standard error of the mean to something that isn’t a random sample”
The standard deviation of the sample means, commonly known as the standard error of the mean ONLY tells you how close you are to the population mean. It DOES NOT tell you how accurate that population mean is!
σ/sqrt(n) is *NOT* the accuracy of the mean no matter how much you wish it it to be. The standard deviation is a measure of the accuracy. The larger σ is, the less accurate the mean is.
σ/sqrt(n) is only a measure of accuracy of the mean IF, AND ONLY IF, all error is assumed to be random, Gaussian, and cancels. I.e. multiple measurements of the same thing.
BTW, I downloaded temps from several rural locations. I was curious at to what they would show for UHI from Forbes, both at the Forbes station and at my station (about 1 mile from Forbes). The rural stations in this area all show negative slopes for temps. Both mine, Forbes, and the closest municipal airport in Topeka all three show positive trends.
It’s pretty obvious that using stations located at airports, especially one like Forbes which is HUGE, big enough for just about any US military plane to land at, with lots of concrete and tarmac. There is simply no doubt that it affects the temperatures at my station. Proof that trying to infill or homogenize using stations even 1 mile away can easily propagate UHI out into rural areas. One more problem with the global average temperature.
“The standard deviation of the sample means, commonly known as the standard error of the mean ONLY tells you how close you are to the population mean.”
It’s an indication of the disbursal of possible results of a sample mean from the population mean. It does not tell you how close the sample mean is to the population, just how far it’s likely to be.
“It DOES NOT tell you how accurate that population mean is!”
The population mean is 100% accurate. It’s the measurand you are trying to estimate from a sample.
“σ/sqrt(n) is *NOT* the accuracy of the mean no matter how much you wish it it to be.”
Yet all I keep hearing is that TN1900 is the only way to calculate uncertainty for temperatures, and anyone who disagrees is saying NIST is wrong.
“The standard deviation is a measure of the accuracy.”
Accuracy of what? The standard deviation of a sample will tell you how close a single measurement is likely to be to the true average, but won’t tell you how close the sample average is to that average. And if you are saying SEM doesn’t account for systematic error in the measurements or in the sampling, and so doesn’t completely describe the accuracy of the mean – correct, but that also applies to the standard deviation.
“σ/sqrt(n) is only a measure of accuracy of the mean IF, AND ONLY IF, all error is assumed to be random, Gaussian, and cancels.”
“and only if is too strong” It’s not a binary result. And Gaussian is irrelevant with a large enough sample size.
“ I.e. multiple measurements of the same thing.”
And that’s meaningless nonsense. You keep repeating it endlessly and never justify it. Why do you think measurement errors will be any less random if you are measurement the same thing rather than different things?
I keep trying to get you to explain why, if say the uncertainty comes from rounding the measurements to the nearest unit, that would result in random errors when measuring the same thing over and over, but systematic errors when measuring different things with different sizes?
And none of this has anything to do with why you think you can use the the SEM to calculate the uncertainty of a daily average for max and min values.
tpg: “ ONLY tells you how close you are to the population mean.”
“It does not tell you how close the sample mean is to the population, just how far it’s likely to be.”
Unfreakingbelievable! The smaller the standard deviation of the sample means the closer you are to the population mean! A standard deviation of the sample means equal to zero implies you *have* the population mean!
Once again you are trying to argue that the color blue is actually green.
“The population mean is 100% accurate. It’s the measurand you are trying to estimate from a sample.”
Malarky! You are *never* going to learn, are you?
If there is any systematic bias in the measurements the population mean CAN NOT be 100% accurate! If every time you measure the length of a rod you get 1.2′ then the average will be *exactly* 1.2′. But if that measuring device has a systematic bias of 0.2′ then your average can *NEVER* be accurate, not even if all the measurements you take are the same!
“Yet all I keep hearing is that TN1900 is the only way to calculate uncertainty for temperatures, and anyone who disagrees is saying NIST is wrong.”
You are simply *NOT* a physical scientist at all. Why do you get on here and propound about things you have no clue about?
Possolo in TN1900 made two simplifying assumptions. You apparently don’t even grok what they were. Under those two simplifying assumptions, what he shows is at least reasonable even if not accurate in a physical sense. The main simplifying assumption is that measurement uncertainty can be ignored. Something you do ALL THE TIME!
If you make the assumption that measurement uncertainty can be ignored then the variability of the measurements is a valid estimation of the uncertainty of the measurements. The issue is that the measurement uncertainty simply cannot be that easily dismissed! Systematic bias is endemic in each and every field measurement device! Total measurement uncertainty is random error plus systematic bias. There is no way to know the ratio of random error to systematic bias so the total uncertainty interval has to be propagated onto whatever average is calculated from the measurement itself. You need to remember the truism: AVERAGE UNCERTAINTY IS NOT UNCERTAINTY OF THE AVERAGE.
u(q_avg) = Σ (u_i/n)^2 is the AVERAGE UNCERTAINTY, it is *NOT* the uncertainty of the average!
If every single one of those u_i intervals has systematic bias then the average uncertainty does not tell you how uncertain the average is, no more than the average value can be accurate in the face of systematic bias. Systematic bias does *NOT* disappear by dividing it by a larger number of samples. Only random error (where there is no systematic bias at all) can be treated that way, and even then it needs to be from iid samples which also implies multiple measurements of the same thing and not multiple single measurements of different things. There is *NO* true value when you have different things. The average is *NOT* a true value. The true value simply doesn’t exist in physical reality. The temperature at location A is like measuring the weight of a donkey and the temperature at location B is like measuring the weight of a rat. The average value of the two weights tells you nothing, the average weight simply doesn’t exist in physical reality.
“Once again you are trying to argue that the color blue is actually green.”
What I’m trying to argue is there’s a distinction between knowing how close your sample is to the population, and knowing how close you are likely to be.
“If there is any systematic bias in the measurements the population mean CAN NOT be 100% accurate!”
The measurement of the population is not the population.
“You are simply *NOT* a physical scientist at all.”
Correct. How did you figure that out? Was it because I keep pointing out I’m not a scientist of any sort.
“Why do you get on here and propound about things you have no clue about?”
Just trying to fit in here.
“The main simplifying assumption is that measurement uncertainty can be ignored. Something you do ALL THE TIME!”
You keep insisting Possolo is the ultimate authority, then claim I’m doing the same thing as him.
TN1900 does not assume measurement uncertainty can be ignored. And random measurement error is already present in daily errors, and is included in the SEM calculation. What the example does assume is that there are no calibration errors. That would be the systematic error.
There are lots of other assumptions in the example, that the errors a Gaussian, that they are independent, that the data is stationary. None of these are likely to be correct, but are probably reasonable enough given the scope of the exercise.
“If you make the assumption that measurement uncertainty can be ignored then the variability of the measurements is a valid estimation of the uncertainty of the measurements.”
Not when your sample consists of the maximum and minimum recorded values. Not when your sample are monthly averages across a year. You can not ignore the fact your data is not a random sample taken from highly non-stationary data.
“You need to remember the truism: AVERAGE UNCERTAINTY IS NOT UNCERTAINTY OF THE AVERAGE. ”
I keep telling you it’s true. Why do you think I need to remember it.
Really, all these rants are getting sad. I’m sure you know what you mean, but your obsession with repeating meaningless catch phrases means you keep getting it all wrong.
If measurement errors were entirely random, then the (measurement) uncertainty of the average is not the average of the measurement uncertainties. Why? Because the errors tend to cancel. The uncertainty of the sum is less than the sum of the uncertainties, and hence the uncertainty of the average is not the average uncertainty.
If measurement errors are entirely systematic, i.e the error is the same across all measurements, then the errors do not cancel, and the uncertainty of the sum is the sum of all the uncertainties, and so the uncertainty of the average is the average uncertainty. Simply because it’s the same as each individual uncertainty.
“I keep trying to get you to explain why, if say the uncertainty comes from rounding the measurements to the nearest unit, that would result in random errors when measuring the same thing over and over, but systematic errors when measuring different things with different sizes?”
You can’t even state the issue correctly!
You are trying to conflate significant digits with measurement uncertainty. While they are related they are not the same! Rounding has to do with resolution, you simply can’t increase resolution through averaging. Resolution is fixed by the measuring device capability.
Measuring the same thing with the same device WITH NO SYSTEMATIC BIAS should generate a random distribution of measurements with a certain resolution. Averaging those random values should result in a “true value” for the measurand, again with a specific resolution that is based on the measuring device. If there is any unknown systematic bias in the measuring device, however, the so-called “true value” ISN’T a true value, it is a true value offset by the “unknown systematic bias”. If you know what the systematic bias is, e.g. in a calibration lab, you can correct for it but who knows what the systematic bias is in 1000 different field temperature measuring devices all with different micro-climates?
Systematic bias applies whether you are measuring the same thing multiple times or multiple different things a single time each. You simply cannot get away from it no matter how hard you try. Averaging simply doesn’t help reduce systematic bias.
“I keep trying to get you to explain why, if say the uncertainty comes from rounding the measurements to the nearest unit, that would result in random errors when measuring the same thing over and over, but systematic errors when measuring different things with different sizes?”
That is why significant digit rules allow retaining 1 additional significant digit THROUGHOUT all calculations for determining the final answer. When the final answer is obtained, it is then rounded to the correct number of digits.
“Then demonstrate it. Go through all your data showing minute by minute temperature readings, and find one day where the precise average is so far removed from (Max + Min) / 2, that it is bigger than max, or smaller than min.”
And here we are again with you flip-flopping. Are Tmax and Tmin the endpoints of the range for the distribution or are they samples of the distribution?
Random nonsense. When did I say max and min where random samples from a distribution? The distribution being all temperatures over a day.
You didn’t answer the question. Why not?
Is Tmax – Tmin the range of possible temperatures.
Or are Tmax and Tmin samples from the possible temperatures?
Tmax – Tmin is the diurnal range of temperatures. The difference provides no useful information as to what causes a change in the diurnal range or even if they are moving in lockstep.
It’s the diurnal range *only* if they are true max and min. Otherwise the true diurnal range is unknown and max and min are just samples from the distribution.
I thought the answer was implicit when I asked you to justify the claim that I’d ever said they were random samples. But if that wasn’t clear enough, I think they are the endpoints not random samples. But as so often that will depend on exactly what you are talking about at this moment in time.
“Is Tmax – Tmin the range of possible temperatures.”
So now you’ve added the word “possible”. With no context. Obviously max and min are not the range of possible temperatures. 0k is the only limit there. Nor am I claiming they are the range of all reasonable temperatures across a year, or all possible temperatures that may occur on a specific day.
What I am saying is, ideally, they aretherange of all temperatures recorded on that specific day. (There are going to be issues with the accuracy if those values, and with exactly how they recorded.)
“Or are Tmax and Tmin samples from the possible temperatures?”
And there’s that word again. You are going to have to define exactly what possibilities you are talking about, and in what way you want to use them.
It’s certainly possible to look at all max temperatures as coming from a distribution of all possible maximum values over a certain period. That’s what TN1900 does. But that doesn’t make sense if you are looking at the one and only max value for one specific day, and it does not in any way justify the idea of using max and min values as if they were a random sample from that day. Which is why I’ll keep pointing out that Jim’s SEM got TAvg is completely wrong.
“ But if that wasn’t clear enough, I think they are the endpoints not random samples”
Because that’s what it says in your Bible? Or did you get that directly from God?
You admit you don’t even know what thermal inertia is let alone hysteresis yet you *are* sure tmax and tmin are endpoints?
“Nor am I claiming they are the range of all reasonable temperatures across a year, or all possible temperatures that may occur on a specific day.”
You are dissembling again. We are talking daily temperatures.
“What I am saying is, ideally, they aretherange of all temperatures recorded on that specific day”
Yep, Pete forbid, reality should come into play here. You don’t know what thermal inertia is or hysteresis yet you KNOW they are the range of daily temperatures. Just like you are sure that Tmedian and Taverage are always the same.
” it does not in any way justify the idea of using max and min values as if they were a random sample from that day.”
So says the Prophet Bellman!
You CAN NOT transform dependent variables into independent variables by a simple average of the two. All that does is hide the fact that the mean is made up from dependent variables.
One should find the variance+covariance of the piece parts and propagate that throughout. As closely as they are correlated, one could simply throw Tmax or Tmin clear out and use just the other one.
Guess what you get when you do that?
Dependent on what? If two values are correlated with each other, then averaging them will give you a single independent value. It has to be independent as there’s nothing else for it to be correlated with.
You just made an unwarranted assertion. Show both a reference and proof that this is true.
Remember, you made the assertion so it is up to you to provide positive proof. It is not up to me to disprove it.
I will tell you this, the average is made up of correlated numbers. That means the numbers move in the same direction. You would need to prove that as the piece parts move in concert, that the average moves differently. In other words, as the number pair increases, the average increases. As the number pair moves downward, the average moves down. You’ll need to prove the average moves up when the numbers go down and vice versa.
I asked you what dependency you are talking about? If you are claiming that TAvg is correlated, you have to explain what it’s correlated with, because otherwise it’s a meaningless assertion.
By definition the notion of independence requires two or more events. A single value can not be dependent in itself, it has to be dependent on some other thing. Here’s a reference
https://en.wikipedia.org/wiki/Independence_(probability_theory)
But it won’t mean anything ulsess you actually define your terms. What do you mean by the average is dependent?
If, as you seem to be saying now, you mean it’s dependent on the values that it’s an average of, then yes that is a dependency. It would be strange and meaningless if the average wasn’t dependent on it’s component parts.
But it has nothing to do with the fact that maximum and minimum are correlated with each other. Nor does it explain what you mean by “One should find the variance+covariance of the piece parts and propagate that throughout.” How do you propagate covariance to a single variable?
https://en.wikipedia.org/wiki/Covariance
Here is a very simple test. What is the correlation coefficient between Tavg and Tmax? What is the correlation coefficient between Tavg and Tmin?
Then tell me if the average is correlated with either of the parts that make it up!
Again I am tired of this. You never show any reference or math to back up your assertions.
If you can’t find a reference, don’t expect a response.
It will be very high. Just checking with the Topeka data and it’s around 0.98 for both. Seasonally adjusted it comes down to 0.93 and 0.90 respectively.
The correlation between TMAX and TMIN is a bit less, at 0.92, or 0.67 when seasonally adjusted.
“Then tell me if the average is correlated with either of the parts that make it up!”
As I told you in the comment above, it would be surprising if it wasn’t. It’s the fact that the average is correlated to its parts that means it’s a useful value.
That’s why I was trying to get you to explain what you meant by a dependency. You seemed to be claiming that TAVG was in itself correlated, which as I said makes no sense. Nor do I understand what you mean by propagating the covariance of the max and min onto the average.
“You never show any reference or math to back up your assertions.”
I gave you two references, both showing that concept of correlation or covariance is meaningless when you only have one value. This justifies my assertion that
If you can find a reference that shows how you can have a single correlated value then by all means show it. If, you just mean the average will be correlated with the max and min values, then you need to be clearer, and explain why you think this makes TAVG a useless value to track.
Read this:
https://stats.stackexchange.com/questions/122954/average-of-dependent-variables
“””””As for consistency, the Weak Law of Large Numbers will hold if (but not “only if”) correlation (and not necessarily dependence) vanishes asymptotically, in the sense of the sufficient condition associated with Markov’s WLLN.”””””
Correlation does not vanish.
“””””… meaning that it is virtually unprobable for the distance between sample mean and true value to be close to zero. So in this case the sample mean is not a consistent estimator of μ0 …”””””
Virtually unprobable for the distance between the sample mean and true value to be close to zero. In other words a large σ^2 and σ. Sound familiar.
What point are you making? That Q&A is about the law of large numbers. That’s irrelevant when you are averaging two values that are not identically distributed.
“Because that’s what it says in your Bible? Or did you get that directly from God?”
No. Because I think they are the maximum and minimum values. And, yes, they may not be exactly that, uncertainty and all, and time of observation can also play tricks. But t hey are far more the lowest and highest points in the range than they are random samples from the entire day.
“You are dissembling again. We are talking daily temperatures.”
You were the one who started talking about them being samples from possible values. I’m just trying to figure out what you believe, behind all your ad hominems.
“Yep, Pete forbid, reality should come into play here.”
Nothing is perfect. Tavg is just an approximation of the daily average based on imperfect maximum and minimum figures. But if you think that the max and min values are so unreliable it’s not even possible to say the daily average is roughly in the middle of them, why on earth do you keep insisting in talking about the trends of maximum and minimum?
“So says the Prophet Bellman! ”
So says the hobbyist Bellman who understands enough about what the Standard Error of the Mean is, to know that taking a value that is at least close to the warmest temperature of the day and averaging it with something close to the coldest part of the day, is not going to be the same as averaging two random values from the day.
“Tavg is just an approximation of the daily average based on imperfect maximum and minimum figures.”
You can’t even accept that it is a median and not an average. It’s all based on your religious belief that all distributions are random and Gaussian.
“You were the one who started talking about them being samples from possible values.”
Daily measurements ARE samples, pure and plain. And it has nothing to do with uncertainty intervals although they certainty have those as well. The highest daily temperature is simply not guaranteed to be measured by the measurement station. That’s physical reality – which I know you have no use for and don’t understand.
“But if you think that the max and min values are so unreliable it’s not even possible to say the daily average is roughly in the middle of them”
The MEDIAN *is* in the middle of them. Where the average is simply can’t be told since the distributions are not iid and aren’t even related! You can’t even accept that the average of a sine wave is .63Vmax and not Vmax/2!
“who understands enough about what the Standard Error of the Mean is”
You don’t understand what the standard error of the mean is at all. To you it is the accuracy of the mean. It isn’t. It’s a measure of how close you are to the population mean. If that population mean is inaccurate then so is the mean you calculate from samples because the samples will be inaccurate as well.
For some reason you can’t seem to get that into your head! If the population is created from measurements which have systematic bias then the population mean IS NOT ACCURATE. Neither are any of the sample means. You can make your sample size equal to the population so the Standard Error of the Mean is ZERO and the population mean will *still* be inaccurate! You can’t fix that with statistics and you can’t fix it by averaging.
What he is describing is a bounded uniform distribution.
A mean in this kind of distribution is meaningless.
The distribution is not likely to be uniform. It’s more likely to be U shaped. But it is obviously bounded.
To be clear, the distribution I’m talking about is the distribution of all temperatures at a specific station during a specific day. The one we want to find the average for. Not the distribution of all possible temperatures.
Yet you know very well that a U-shaped distribution is not what is being sampled.
You are just making stuff up. You are a troll.
I don’t think anythings being sampled. You are taking the maximum and minimum values of the distribution. It is not a random sample.
If you think it is, say what you think the population is and justify how the maximum and minimum values have been randomly selected from it.
Daytime temps represent a different temperature distribution than nighttime temps. How can you average two different distributions? You aren’t even considering covariance let alone independence.
LIG thermometers have thermal inertia. They can *never* measure the actual Tmax and Tmin because they can’t respond quickly enough. The high temp the thermometer is trying to measure is long gone before it can respond fully so you can *never* know what the actual Tmax is. In addition, LIG thermometers have hysteresis, they read differently going up than going down. So the max and min temps are never quite the same as far a calibration.
This makes Tmax and Tmin SAMPLES, not true measurements. In fact, even in many newer stations using electronic sensors they sensors have been designed to mimic the thermal inertia of the old LIG thermometers.
Once again, your complete lack of knowledge concerning physical science is showing. Yet you continue to come on here and propound on subjects you have absolutely no knowledge of.
“LIG thermometers have thermal inertia. ”
Finally a more plausible point. I’ve no idea how big a problem that would be, but it still doesn’t justify the idea of treating max and min as random samples about the daily distribution.
And, if you are worried about the accuracy of max and min values, why do you think it’s better to look at just max and just min?
“Finally a more plausible point. I’ve no idea how big a problem that would be, but it still doesn’t justify the idea of treating max and min as random samples about the daily distribution.”
ROFL!!
You don’t know how big of a problem it is?
Yet you come on here and claim as an unassailable truth that tmax and tmin encompass the entire range of daily temperatures and that they are not just samples taken from the actual temperature profile. You claim that it is wrong that when standard deviation and variance is calculated that there are temperature higher than tmax and lower than tmin in the distribution.
In other words “don’t bother me with reality”.
“You don’t know how big of a problem it is?”
You tell me.
My hunch, nothing more, is that it’s not likely to be a very big problem, given that thermometers don’t take that long to respond to temperature changes, and temperatures don’t generally change that much at their peak. But if it is a very big problem, will you accept that all your trends based on just max or min are useless?
“Yet you come on here and claim as an unassailable truth that tmax and tmin encompass the entire range of daily temperatures and that they are not just samples taken from the actual temperature profile.”
How do you think possible errors caused by lagging, equates to the maximum is just a random sample from the entire temperature profile?
“You claim that it is wrong that when standard deviation and variance is calculated that there are temperature higher than tmax and lower than tmin in the distribution.”
I said it was an obvious nonsense that the actual average could be larger, let alone, much larger, than tmax or smaller than tmin. What sort of error in TMax or Tmin do you think there would have to be to make that possible?
“My hunch, nothing more, is that it’s not likely to be a very big problem, given that thermometers don’t take that long to respond to temperature changes, and temperatures don’t generally change that much at their peak.”
Your extensive experience in the real world just comes shining through as usual.
Look at the attached graph and tell me how much the temp is changing at its peak? Does the term “inflection point” mean anything to you?
“How do you think possible errors caused by lagging”
Lagging is not a *error*. And it’s not a lag either. It’s a result of thermal inertia. Heat transfer is a time function. It takes time for the heat in the atmosphere to fully heat a substance to equilibrium. If the temperature falls before that equilibrium point is reached then the indicator will not show the peak. And thermometers *do* take some time to respond. For instance, for meteorological instruments a response time of 60s to obtain 95% of a step change. That’s a long time!
Why do you keep making assertions about things you have absolutely no knowledge of? You apparently didn’t even bother to go look anything up about response time of temperature measuring devices!
“I said it was an obvious nonsense that the actual average could be larger, let alone, much larger, than tmax or smaller than tmin. What sort of error in TMax or Tmin do you think there would have to be to make that possible?”
How do you know that if you don’t know the distributions? Religious faith?
(Tmax+Tmin)/2 is a MEDIAN if Tmax and Tmin define the range of possible values. It is *not* guaranteed to be an average if the two are taken from two different distributions.
The readings come FROM a distribution. Bellman is being a troll by trying to CREATE a distribution FROM the readings. That is not science, it is ignoring observed facts.
Trending Tmax is using readings from the same distribution. Same with Tmin. That is the only proper way to treat them, i.e., separately!
I am not trying to create a distribution from max and min. I’m saying they mark, usually, the extents of whatever distribution there is.
If you are talking about looking at the trend in max, or min, that’s a different question. I’m talking about whether it makes sense to plug max and min values for a single day into equations intended for a random sample, and claim that represents the uncertainty of the average for that day.
tmax and tmin *are* random samples from the temperature profile, i.e. its distribution. Even the Australian BOM says it doesn’t measure “instantaneous” temperatures using its platinum sensors. The sensors are built to have the same thermal inertia as an LIG and the measurement devices use an average of the short-interval measurements they make.
And again, daytime temps and nighttime temps are not iid. Doing an average of them violates the rules for CLT and the law of large numbers.
The medians calculated from tmin and tmax are a kludge for anything at best, inaccurate as all git out at worst. They are a carryover from TRADITION. Climate science is scared of stepping into the 21st century and having their religious dogma shown to be wrong.
Here is how ASOS is done in the U.S.
“tmax and tmin *are* random samples from the temperature profile, i.e. its distribution”
I’m saying that’s clearly nonsense, and it doesn’t matter how many times you repeat it. If you want to show I’m wrong produce some evidence. Show me a distribution of daily tmax and tmin, and show they randomly fall on the daily temperature distribution.
“Doing an average of them violates the rules for CLT and the law of large numbers.”
Two is not a large number. The CLT is irrelevant. Yet you are the one defending the idea that you can use SEM to calculate the uncertainty of the average of the two values.
“Show me a distribution of daily tmax and tmin, and show they randomly fall on the daily temperature distribution.”
If Tmax and Tmin are not members of a random distribution then how can you calculate an average from them?
No one is saying that Tmax and Tmin can be any value. They do *NOT* have to be the actual max and min temps, however. Even though you seem to think all measuring devices are perfect in your little box, they aren’t in reality. You *can* have actual max and min values that are greater than Tmax and less than Tmin.
“Yet you are the one defending the idea that you can use SEM to calculate the uncertainty of the average of the two values.”
The SEM is σ/sqrt(n) is it not? You keep saying you can calculate an average μ of two values which means you can also calculate σ. And n is two. So why do you think you can’t calculate the SEM?
You are caught between a rock and hard place here. Either you can calculate the average or you can’t. Which is it?
“If Tmax and Tmin are not members of a random distribution then how can you calculate an average from them?”
(TMax + TMin) / 2.
Pretty easy.
“No one is saying that Tmax and Tmin can be any value.”
If you are claiming they are a random sample from a distribution you are saying they can be any value from that distribution.
“They do *NOT* have to be the actual max and min temps, however. Even though you seem to think all measuring devices are perfect in your little box, they aren’t in reality.”
Indeed they are not, as I keep saying and you’ll just go on ignoring.
“You *can* have actual max and min values that are greater than Tmax and less than Tmin.”
Indeed, through measurement error, this lagging you alerted me to. And as I’ve been saying, the nature of how they are recorded. (e.g. Time of Observation.).
But as so often, you take a general observation, that max and min should be the maximum and minimum temperatures over a day, and try to find any specific reason why that may not be always or exactly the case, and try to use it to justify the claim that Jim’s calculations of uncertainty in the daily average have some relation to reality.
“The SEM is σ/sqrt(n) is it not?”
It is not. Standard error of the mean is what it is. σ/sqrt(n) is an equation that can used to find or estimate the SEM in some cases.
“You keep saying you can calculate an average μ of two values which means you can also calculate σ.”
No. First, σ is the population standard deviation. If you don’t know it you can estimate it using the sample standard deviation. But this isn’t very sensible when you only have two values. Second, max and min are not a random sample. In this case that’s better than a random sample. But it still means you will probably overestimate σ if all you do is take the sample SD from those two values.
“And n is two. So why do you think you can’t calculate the SEM?”
Maybe you can estimate the SEM, but I couldn’t tell you how. What I can say is just dividing the standard deviation by root 2 is not the way to do it.
If you knew σ, which may be able to estimate if you could make some assumptions about the distribution. E.g. if the day was a perfect sine wave, σ would be about 0.35 the range, you could calculate σ/sqrt(n). But what this is telling you is what the standard error of the mean would be, if you were sampling the mean by taking two completely random temperature readings. If you did that, sometimes you would have two values quite close to the max and min values, but other times, you get two values both close to the max, or both close to the min, and all combinations in between.
“Either you can calculate the average or you can’t. Which is it?”
What’s so difficult here. You can calculate the average, but it’s not so easy to calculate the SEM and that doesn’t mean the way you are doing it is remotely correct.
I’m not even sure the SEM makes much sense in this case. The max and min values are what they are. However many times you take the average you will always get the same mean. What you can do is look at the uncertainty of the max and min values and calculate the effect of that uncertainty on the mean. But you also have to consider the actual error caused by the “true” mean not being the average of max and min due to the likely skewedness of the daily distribution.
If you really want to investigate this, you would be much better actually looking at hourly or better values for various stations and seeing how the average based on that average compares with one based on max and min values.
As I keep saying, I don’t get what pint you think you are making. Just endlessly repeating “it’s a median not an average” doesn’t make your argument any more understandable.
*As I keep saying, I don’t get what pint you think you are making. Just endlessly repeating “it’s a median not an average” doesn’t make your argument any more understandable.”
*YOU* are supposed to be the all-knowing statistician and you can’t distinguish between a median and an average?
Tmedian and Taverage do *NOT* have to be the same, especially if you have a skewed distribution.
Trying to equate Tmedian with Taverage just goes along with your persistent assumption that everything is random and Gaussian. You can’t seem to understand that not everything is random and Gaussian.
I’m not a statistician and I’m far from all seeing. Unlike you I don’t assume I’m incapable of getting things wrong.
I do however know the difference between a median and a mean (my school always drummed into me that both where averages, but that was a long time ago). What I can’t do is distinguish between the two when you have just two values.
If you are talking about the median or mean of a skewed distribution, the mean and median will not be the same, and neither will be the same as (max + min) / 2.
So again, this isn’t about my understanding. I’m trying to figure out what you think the point of distinguishing between the two when talking about the average of max and min.
‘Unlike you I don’t assume I’m incapable of getting things wrong.”
Yes, you do. You can’t even accept that LIG thermometers have thermal inertia or hysteresis. It’s not even obvious that you know what those are. Yet you feel you are such an expert that no one can question your assertion that Tmax and Tmin are not samples but range boundaries!
“I do however know the difference between a median and a mean (my school always drummed into me that both where averages, but that was a long time ago). “
The median is *NOT* an average. You can’t even accept that truism.
“What I can’t do is distinguish between the two when you have just two values.”
That’s the problem! You CAN’T distinguish what the average is, only the median. You assume they are the same by assuming that all temperature measurements are random and Gaussian. You keep on denying that you assume that but it shows up EVERY SINGLE TIME you make an assertion about anything!
When you are measuring different things a single time each you have *NO* idea what the distribution looks like. NONE! You simply cannot assume that the distribution is random and Gaussian!
The distribution for Tmax is different than for Tmin and therefore you can’t calculate an average, only a median. Finding an average requires that the two distributions be iid and Tmax and Tmin distributions are *NOT* iid.
“If you are talking about the median or mean of a skewed distribution, the mean and median will not be the same, and neither will be the same as (max + min) / 2″
Put down the bottle. The median is *always* the middle value of the given range. The median is a measure of the center of a distribution, be it a sample or a population. It is sometimes called the “middle number”. If you have an odd number of data points then (Tmax+Tmin)/2 is the median EVEN FOR A SKEWED DISTRIBUTION. If you have an even number of data points then the median is the mean of the two center values EVEN FOR A SKEWED DISTRIBUTION.
“So again, this isn’t about my understanding.”
It is TOTALLY about your understanding. You understand nothing about reality and you can’t even demonstrate you understand what a median is.
“Yes, you do. You can’t even accept that LIG thermometers have thermal inertia or hysteresis.”
Apart from the fact I do accept it. And yes, it’s not something that occurred to me before, and may be an interesting source of uncertainty.
“Yet you feel you are such an expert that no one can question your assertion that Tmax and Tmin are not samples but range boundaries!”
Of course they can question it. But so far all of seen is angry assertions and vague hopes that somehow thermal inertia will turn them into random samples from the daily profile.
“The median is *NOT* an average. You can’t even accept that truism. ”
It’s not important, but as I said there seem to be two different sets of definitions here. I was always taught that mean median and mode where all types of averages, some think that average only means mean.
Here are a few links that agree with the idea that they are all types of average:
https://www.bbc.co.uk/bitesize/guides/z2jb4j6/revision/1
https://www.dummies.com/article/academics-the-arts/math/pre-algebra/the-three-types-of-average-median-mode-and-mean-168773/
https://data36.com/statistical-averages-mean-median-mode/
None of this means it’s right or wrong. But it is just a question of definitions.
“That’s the problem! You CAN’T distinguish what the average is, only the median.”
What do you think the mean of 6 and 7 is? What do you think the median of 6 and 7 is? How do you distinguish between the two?
“You assume they are the same by assuming that all temperature measurements are random and Gaussian.”
I’m specifically telling you that max and min are not random with regard to the daily distribution, and the daily distribution is not Gaussian. As I pointed out elsewhere, if daily temperatures follow a sin wave, the distribution will be U shaped. Far more values close to the maximum and minimum than close to the average.
“You keep on denying that you assume that but it shows up EVERY SINGLE TIME you make an assertion about anything!”
That’s only because at some point you’ve stuck a blindfold on with the words written on the inside. If you took a minute to try to understand what I’m trying to tell you it’s that the SEM calculation Jim uses fails ion part because the values are not random or Gaussian.
“When you are measuring different things a single time each you have *NO* idea what the distribution looks like.”
Well you do have some idea of what a typical daily distribution looks like. You’re the one who keeps insisting that you can determine the average day time temperature by assuming it’s a sine wave.
“Put down the bottle. The median is *always* the middle value of the given range.”
It would have helped a lot if you had just admitted at the start you don’t know what a median is.
No. The median is not always the the middle value of a give range. What do you think the median of 1,2,3,6 is? Is it 3.5, the middle value of the range?
“If you have an odd number of data points then (Tmax+Tmin)/2 is the median EVEN FOR A SKEWED DISTRIBUTION.”
Let’s see. 1,2,3,4,10. Min = 1, Max = 10, mean = 5.5. Media = 3. Are you sure you are correct on this?
Listen to what you are saying!
Why are ASOS stations that measure in seconds being installed and used?
You are trying to argue that all we need is Tmax and Tmin along with a calculated Tavg. All the other temps fall into that range and therefore the actual distribution is immaterial. Just find a simple average of two readings and say they have zero uncertainty. Average the averages and again you get a simple number with no uncertainty. Ignore the fact that 3, 4, 6 temperatures per day represents a distribution, but two samples can not!
Who needs the actual distribution, you’ve got what you need and all other analysis’ are bogus?
Dude, lots of folks want to know what Tmax and Tmin are doing separately. HVAC for one. Climate scientists SHOULD want to know. Farmers want to know so they can choose the correct seed variety.
You can put your head in the sand and continue saying that a trended Tavg tells us everything we need to know, but you will be ignored!
“Why are ASOS stations that measure in seconds being installed and used?”
Because they are better. Better at getting the true daily average, and showing temperatures change throughout the day.
“You are trying to argue that all we need is Tmax and Tmin along with a calculated Tavg.”
No. I’m arguing that for many historical records all you have is max and min values, and sometimes only average values. I’m arguing that a value based on the average of max and min is a reasonable approximation of the daily mean given the available data. I would also argue that if you are comparing temperatures across the decades it’s important to use a consistent measurement. Even if you have more accurate estimates of the daily average for modern times, you have to use the max min system if you want to compare them with earlier data, otherwise you introduce a systematic bias.
If you want to try to come up with a better model for historical daily values I’m sure that’s possible. But I’m guessing we will no end to the outrage in some places, if a new adjusted data set is reveled based on modeled daily values.
“Just find a simple average of two readings and say they have zero uncertainty.”
I’m not saying that.
“Average the averages and again you get a simple number with no uncertainty.”
Not saying that.
“Ignore the fact that 3, 4, 6 temperatures per day represents a distribution, but two samples can not!”
Again, they are not a random distribution.
“You can put your head in the sand and continue saying that a trended Tavg tells us everything we need to know,”
I’m not saying that.
“No. I’m arguing that for many historical records all you have is max and min values, and sometimes only average values.”
In other words: TRADITION! Is your nickname Tevye?
We’ve had more than tmax and tmin since at least 1980. That’s 40 years ago. Why hasn’t climate science moved on into the modern world along with engineers and farmers?
TRADITION and the lack of a Time Machine.
Ignored by those who work in reality at least. Engineers use cooling/heating degree-days. Farmers use growing degree-days.
Both based on watching the max temp profile and/or the min temp profile, at least in today’s world where you can get temp data at at least 2 minute intervals if not less.
And a reminder that whilst Jim and Tim keep arguing the toss about daily averages, they are still ignoring the request to say where they got their data for Topeka and why Tim’s graph does not agree with the data from GHCN daily.
Tim says no warming in the max values since 1953, GHCN shows warming in max values. Jim claims no warming in January max or min values, GHCN shows even faster rates of warming for January. Never will say what data they are using. But instead jest keep trying to divert the conversation in the hope I’ll forget the original point.
I told you where I got the data. I gave you the link and have given you the station id.
The fact that you choose to ignore that is YOUR PROBLEM, not mine.
https://www.ncei.noaa.gov/cdo-web/search
USW00013920
I’ve attached a screen shot of my spreadsheet. It is up to you to duplicate the values. Follow the instructions in NIST TN 1900, Ex 2.
Yes, thanks. It’s the same as Tim’s source and is as far as I can see just the daily GHCN data. As I said, it does not agree with Tim’s graph. Many days during the 1990s have maximum temperatures over 100°F, yet the graph Tim posted shows no days during the period around 1997 and 2004 as getting anywhere near 100.
I’ll double check with the NOAA version of the data, but as I said I see a fast warming rate when looking at just January for both maximum and minimum values. I’m not sure if you are claiming there has been no warming for January, and if not what your claim is.
Here’s my calculations using this data for January. I’m using the same method as for TN1900, that is SEM of daily maximum values with a 95% coverage factor based on a student-t distribution.
Trend is 0.48 ± 0.32°C / decade.
And for TMIN
Trend is +0.18 ± 0.24°C / decade.
Look at my spreadsheet.
Could you provide a source for your temperature data?
Parts of your graph just don;t agree with my data. I’ve used the GHCN daily data, but I also checked with the station data from
https://www.ncdc.noaa.gov/cdo-web/datasets/GHCND/stations/GHCND:USW00013920/detail
For example, for August 1998, both GHCN and the NOAA site show the 18th as having a maximum of 105°F. But your graph shows none of the daily values around that time going anywhere near 100°F.
Still waiting.
https://www.ncdc.noaa.gov/cdo-web/search
I have no idea what you are looking at. My graph shows several data points of 110F or so.
6/13/53 = 105
7/30/55 = 104
8/9/06 = 107
I haven’t done it yet but you are probably going to find that there were *more* high temps in the 50’s than in the 2010’s and 2020’s. There have been studies in Iowa (ag studies, not climate studies) finding the same exact thing.
When you do Tmedian you LOSE the variance of the actual temperature profile. It’s a piss-poor way of doing physical science.
Thanks, but that’s the same source I was using to check the GHCN data. There seems to be something wrong with your data set as it doesn’t agree either with GHCN daily or the NOAA source.
To be clear what I’m looking at is your graph for daily maximum temperatures in this comment
https://wattsupwiththat.com/2023/02/20/is-noaa-trying-to-warm-the-current-8-year-pause/#comment-3684580
It appear to show a noticeable break where temperatures for the first 7 years after 1997 are somewhat lower than anything before or afterwards. As an indication of this I note that none of those years show any day as being close to 100°F, whereas nearly all other years have days over 100°F.
To double check this I looked through my GHCN data, converting to Fahrenheit and found several days over 100, for example 18th August 1998 had a max of 105. But there are many others. I then downloaded the page for that month from the NOAA site and that also shows the day as being 105.
I’ve now downloaded the full data for that period from their cart using the link you provided and it also shows the 105 figure for that date
It’s the same for other >100 days in my records. 1999 for example
None of these are appearing in your graph.
There is nothing wrong with my data.
I’ve uploaded my spreadsheets to my web page. You can download the spreadsheets showing the graphs of the temperatures from there.
If you will note carefully on one of the spreadsheets I show the difference between using farenheit and using kelvin. the slopes *are* different.
I am hesitant about publishing my private web site but here goes:
ab0wr.net:8080
scroll to the bottom of the page and you can download two files, one for Topeka and one for Appleton City, Mo. They both show exactly the same – negligible warming (or cooling) at either location.
I’ll check your spreadsheet if you really want, but I’m not sure what good it will do. If there’s a problem with your data the same problem will be in your data. What you really need to do is redownload the data from NOAA and see if your daily max values agree with NOAA’s during the period I mentioned. Say during 1999.
As I’ve said elsewhere it looks very likely to me that your maximum values are actually the daily average values where NOAA give TAVG values.
It may be a simple copying issue, or maybe a problem with LibreOffice reading CSV, or it might have been a problem with NOAA”s download program.
But really, just insisting that there can be nothing wrong with your data is not something you should allow yourself to believe. Remember you are the easiest person to fool.
“What you really need to do is redownload the data from NOAA”
OMG! You didn’t even bother to look at the site I gave you!
I’m not surprised you don’t want to look at the spreadsheet! Might burst the bubble you live in!
My data and the noaa data from Appleton City, ,MO show the *exact* same thing as KFOE. So its not just one set of data, it’s THREE!
But that doesn’t really matter to you, does it?
I said I’d look at it when I get the chance.
In the mean time are you going to adress why your graph of maximum temperatures is not showing and days over 100°F from 1998 to 2005, when NOAA’s and the GHCN data show many days over 100 during that period?
You are right. When I imported the csv I got the columns off.
Here is a new graph of the Tmax record. The slope of the graph is .00046. Over ten years that’s an increase of .0046K. Over 70 years its a total of .032K. Still far less than what NOAA says by more than an order of magnitude. The uncertainty of the data is at least the standard deviation (+/- 12.5K)and should probably be looked at as two standard deviations which = 25K. That’s a range of about 248K to 308K, or almost the entire range of the temperatures. The trend line could lie anywhere in that range and be positive, negative, or sideways.
But I’m sure you’ll just say you can’t consider the uncertainty of the data but only the standard error which is just how accurately you’ve calculated the mean and has nothing to with the uncertainty of the data.
“You are right. When I imported the csv I got the columns off.”
I’m glad you accepted this. Hope you will be more cautious to check your data and graphs in the future.
“Here is a new graph of the Tmax record. The slope of the graph is .00046. Over ten years that’s an increase of .0046K. Over 70 years its a total of .032K.”
Oh, dear.
Just look at the graph you’ve posted. The trend line is rising by more than 10K over your data.
Your 0.0046, is not per year, it’s per day. 0.0046 * 365 * 10 = 1.7K / decade. 10 times faster warming than global averages.
Fortunately for the inhabitants of Kansas, it’s obvious your data is even worse than the last lot. Just look at the graph, you now have two sections where temperature just jumps up by about 10K for a decade or so. And somehow you’ve omitted the three decades where there is no daily data. Somehow I don’t think there is much certainty in your trend.
Ok, downloaded it, and from a very quick check it’s just as I’ve been saying.
Look at the row for August 18th 1998, row 7094. For tmax you have 87, for tmin 105. As I said this is because you are including the tavg data. 87 is actually tavg, 105 tmax, and the tmin value appears in the unlabelled column as 69.
No need to thank me.
I think I may have found the problem for you.
The CSV from NOAA contains daily values for TAVG, TMAX and TMIN. But only dates from 1st April 1998 to 31st July 2005 have TAVG values. These dates are just the ones I said where suspicious in your graph.
It seems to me you’ve used the TAVG value for those dates rather than the TMAX, hence the colder than expected values for those 7 years.
Here’s a graph where I’ve substituted TAVG for for those times when it’s available. Looks very much like your graph.
I used tmax and tmin. Look at my spreadsheet.
“Your lack of math skills is showing again!”
If you have 10 planks of wood with an average length of 1m, and you know one plank is only 1mm long, does that mean that one of the other planks must be 2m long? Or is it possible that the other 9 are each 1.1m long?
“Not in Topeka apparently.”
Indeed not. As I said, on the basis of that sparse data it would seem to have risen by only 0.77°C since 1953.
“.25 is smaller than 1.”
What part of “/ decade” didn’t you understand. 7 decades at the rate of 0.25 per decade is 1.75.
“So where on the globe has the average temp gone up by 1.75C?”
See my previous statement.
The average tells you nothing about what you have when they are different things. Someday you’ll come to realize that.
“Indeed not. As I said, on the basis of that sparse data it would seem to have risen by only 0.77°C since 1953.”
Sparse data? That’s a span of almost 70 years – and *you* try to make 40 years sound like it is “statistically signifcant”!
If neither Tmax or Tmin has gone up how do you explain that your Tmedian has gone up? That would cause most people to question what they are doing in using Tmedian to tell if the climate has changed. But apparently it doesn’t raise any questions in your mind at all!
Do you believe that Tmedian defines climate? Or is it Tmax and Tmin?
“The average tells you nothing about what you have when they are different things. Someday you’ll come to realize that.”
Some days I really suspect you’re just a not very good chat AI. It doesn’t matter what point I’m responding to, you’ll just be triggered by some keyword and fall back on another of your obsessions.
I was trying to answer your question as to how it would be possible for one thing being below an average and there not be another thing equally above the average. E.g. when you claim that if one station is not warming there must be another station warming twice as fast.
“Sparse data?”
Because there’s about 20 or so missing years.
“If neither Tmax or Tmin has gone up how do you explain that your Tmedian has gone up?”
Are you hoping if you repeat Tmedian enough times it will become a thing? I am not trying to explain it. There’s clearly a discrepancy between our two methods or data, and I wouldn’t like to say which it correct.
For the record, when I look at TMax, using annual values, I get a significant warming trend of 0.24 ± 0.13°C / decade.
For TMin an insignificant cooling of -0.02 ± 0.10°C / decade.
“Some days I really suspect you’re just a not very good chat AI.”
This has been pointed out to you over and over and over again, ad infinitum. If I have 20 6′ boards and 20 8′ boards the average length of 7′ WILL NOT BE FOUND IN THE PILE.
You can bray like a donkey all you want that the average length of 7′ exists but it doesn’t. If the 6′ boards have an uncertainty of .2′ and the 8′ boards have an uncertainty of .4′, a board with an average uncertainty of .3′ WILL NOT BE FOUND IN THE PILE.
Measuring different things *must* be handled differently than measuring the same thing multiple times. You simply refuse to believe that.There is *no* TRUE VALUE when you have a collection of measurements from different things.
“ E.g. when you claim that if one station is not warming there must be another station warming twice as fast.”
If the cooling slope is m1 then there must be a warming slope of m2 = m1 just to get a slope of zero for the combination. If you then want a warming slope greater than m1 it means that m2 > m1. How much greater depends on how large you want m2 – m1 to be!
Your lack of experience in the real world is just amazing. Ask a motorcycle or car racer how fast they have to go in order to catch someone 1/2 lap ahead. Velocity is the slope of the change in position. If you go the same speed as the person ahead of you then you’ll never change position relative to the leader. It’s no different with temperature. If you have a slope of -1 somewhere then you need a slope of +1 somewhere else just to get back to even. [ m_2*x – m_1*x] only equals 0x if m_1 = m_2. If you want a slope of +1 then m2 has to be +2. (2 – 1) = 1.
“Because there’s about 20 or so missing years.”
So what? If the temps today are the same as the temps 70 years ago then the slope of the temperature change has to be zero over those 70 years. If the temperature over the missing 20 years went crazy high and dominated the trend line then the linear trend would see increasing residuals for the current temps from the trend line. Even a simply analysis on the back of a napkin will prove this to you!
You seem to be trying to back away from your claim that only long trends are statistically significant. When longer term trends don’t match your shorter term trends then you claim the longer term trends can’t be right. Then you turn around and say that shorter term trends than your 40yr trends can’t be right either. “My trend, right or wrong” apparently.
“For the record, when I look at TMax, using annual values, I get a significant warming trend of 0.24 ± 0.13°C / decade.”
Just use the temps, not averages. Just graph the temps as they stand. You’ll get the graph I already posted.
The temps today are no different than the temps in the 50’s. It is the TEMPS that matter. They determine climate, not averages!
“This has been pointed out to you over and over and over again, ad infinitum. If I have 20 6′ boards and 20 8′ boards the average length of 7′ WILL NOT BE FOUND IN THE PILE.”
Which as always has zero to do with the point I was making or your incorrect claim.
“If the cooling slope is m1 then there must be a warming slope of m2 = m1 just to get a slope of zero for the combination.”
I tried to dumb it down to your level, and you still don’t get it. What you are saying is true, if you have just two stations. Or, say if you are comparing max and min trends with the average trend. But all I said is that with more than two stations it’s quite possible for one to deviate from an average without there necessarily being a station with an opposite trend. It’s not an important point, but as so often you blow it up into a massive distraction.
“ It’s no different with temperature. If you have a slope of -1 somewhere then you need a slope of +1 somewhere else just to get back to even.”
Say you have three slopes. -1, +0.5 and +0.5. What is the average?
“So what?”
The so what is you asked why I said the data was sparse.
“You seem to be trying to back away from your claim that only long trends are statistically significant.”
All I’ve ever said is that you calculate the significance of a trend to determine if it’s significant. On the whole shorter trends are less likely to be significant than longer trends, but it also depends on the size of the trend and the amount of variance.
“When longer term trends don’t match your shorter term trends then you claim the longer term trends can’t be right.”
I haven’t said anything of the sort. I’m quite prepared to believe you can find stations with long term zero or negative trends. All I’ve done is to check the data for myself and come to a different conclusion to you. I might be wrong, you might be wrong, we could both be wrong.
“Just use the temps, not averages.”
I explained why it’s better to use annual averages rather than daily temperatures. You’re the one who keeps howling about the wrongness of applying linear trends to wavy data. But I’ve laso done it as you suggest, just using the daily maximums and I get a very similar result.
“The temps today are no different than the temps in the 50’s. It is the TEMPS that matter. They determine climate, not averages!”
How can you know that unless you use some sort of averaging?
“Which as always has zero to do with the point I was making or your incorrect claim.”
In other words you simply refuse to acknowledge that measuring the same thing multiple times is *NOT* the same thing as measuring multiple things one time each!
You keep denying it but you circle back to the assumption that all measurement uncertainties are random and Gaussian and can therefore be ignore. When confronted with the fact that the variability of the data can lead to even LARGER uncertainties than the measurement uncertainties you just let it go in one ear and out the other.
“I tried to dumb it down to your level, and you still don’t get it. What you are saying is true, if you have just two stations. Or, say if you are comparing max and min trends with the average trend.”
It’s true no matter how many stations you have. Negative slopes of multiple stations have to be offset by an equal number of positive slopes JUST TO GET TO m = 0. To get an overall positive slope the sum of the positive slopes *has* to be larger than the sum of the negative slopes.
So where on the globe is it warming enough to offset the locations that are cooling? You refuse to answer. Why?
“Say you have three slopes. -1, +0.5 and +0.5. What is the average?”
You have three slopes. What do *YOU* do with them?
“All I’ve ever said is that you calculate the significance of a trend to determine if it’s significant.”
And only long data sets result in a trend with significance, right? Who do you think you are fooling?
“On the whole shorter trends are less likely to be significant than longer trends, but it also depends on the size of the trend and the amount of variance.”
Then your 40 year trend is less significant than my 70 year trend, right? You keep on dissembling so you won’t have to admit that, right?
“I haven’t said anything of the sort. I’m quite prepared to believe you can find stations with long term zero or negative trends.”
Then where are the offsetting stations with positive trends larger than the negative ones? Are we just going to get more handwaving “they are out there!”?
“I explained why it’s better to use annual averages rather than daily temperatures”
You haven’t explained ANYTHING. You haven’t even admitted that daytime temps have a different distribution than nighttime temps! You can’t even admit that (Tmax + Tmin)/2 is *NOT* an average but a median!
You really are desperate to avoid providing a link to your data, aren’t you?
You’ll go up any garden path rather then explain why your data doesn’t agree with any of the data I can find online.
“In other words you simply refuse to acknowledge that measuring the same thing multiple times is *NOT* the same thing as measuring multiple things one time each!”
Again, this has nothing to do with the point you were arguing. You said that if one thing was below an average there must be one other thing which is equally far above the average. It’s irrelevant, but fool that I am I pointed out this wasn’t necessarily true, and gave a simple example, and rather than addressing your own mistake you go on and on about how averages don’t exist if you can’t hold them in your hand, and how measuring different things is different to measuring the same thing.
And then if that’s not distraction enough, you repeat your same old lies, such as
“You keep denying it but you circle back to the assumption that all measurement uncertainties are random and Gaussian and can therefore be ignore.”
And then we get this beauty
“When confronted with the fact that the variability of the data can lead to even LARGER uncertainties than the measurement uncertainties you just let it go in one ear and out the other.”
I’ve been pointing this out to you for the past two years, but your head is so far up your own rabbit hole, you never acknowledged it, and just insulted me every time I mentioned it. I’ll repeat again, when taking a random sample to estimate the population mean the most important uncertainty comes from the sampling, that is given by the SEM. The measurement uncertainties should be less than this, because if they are not it means you are using a measuring instrument that can’t discriminate between the range of values you are measuring.
“It’s true no matter how many stations you have. Negative slopes of multiple stations have to be offset by an equal number of positive slopes JUST TO GET TO m = 0.”
I’ve already demonstrated why that isn’t true., There’s little point doing it again as it will just let you pull the discussion even further away from the subject.
“So where on the globe is it warming enough to offset the locations that are cooling? You refuse to answer. Why?”
Because it’s a pointless question, and one you could easily answer yourself if you really wanted to know. The fact is, you haven’t demonstrated anywhere is cooling, and have just claimed one place is only slightly warming, but refuse to address the obvious problem with the data you are using.
I’ve already pointed to Oxford, but you didn’t like the fact I used averages. So lets look at the daily data for TMAX. I get a warming rate of 0.34°C / decade.
“And only long data sets result in a trend with significance, right? Who do you think you are fooling?”
Not necessarily. That was the point I was trying to explain, but it obviously went right over your head.
“Then your 40 year trend is less significant than my 70 year trend, right? You keep on dissembling so you won’t have to admit that, right?”
Not necessarily, see above.
“You haven’t explained ANYTHING.”
Either that or you’re incapable of understanding the explanation.
“You haven’t even admitted that daytime temps have a different distribution than nighttime temps!”
Which has nothing to do with using annual averages rather than daily values to determine the trend line. Aren’t you the one who whines about not fitting linear trends to sinusoidal data?
“You can’t even admit that (Tmax + Tmin)/2 is *NOT* an average but a median! ”
Why should I? admit to something that is plainly false? If you were capable of explaining how your definition of an average precludes the idea of adding two values and dividing by two, I might try to explain why you are wrong, but in the mean time it looks like the very definition of an average of two things.
As I’ve said, by definition the mean of two things is also the median of two things, as by convention when you take the median of an even number of things you take the median to be the mean of the two central values.
Now are you going to stop coming up with more distractions and actually tell me where you got your data?
“You really are desperate to avoid providing a link to your data, aren’t you?”
I gave you the link and the station id. I will post the csv file on my web site if you wish, just let me know if you actually want it.
Yes, thanks. But that was after the comment you were responding to.
It would be interesting to see your csv file, yes, but for now it would just be a help if you could say what your csv file says was the maximum temperature on 18th August 1998?
This article by W.M. Briggs has a good statement.
“””””If you want to say that 52 out 413 times series increased since some time point, then just go and look at the time series and count! If 52 out of 413 times series increased then you can say “52 out of 413 time series increased.” If more or less than 52 out of 413 times series increased, then you cannot say that “52 out of 413 time series increased.” Well, you can say it, but you would be lying.”””””
https://www.wmbriggs.com/post/195/
That is what my goal is, to create evidence of changes in the time series of Tmax and Tmin at numerous stations. That is the only way to put your finger on what is truly happening.
“Because there’s about 20 or so missing years.”
So what is the problem? The only way to get a warming trend at the end is for the interim years is to have a sustained cooling trend. That is still an argument that does nothing to prove CO2 is a factor at all.
The 1999 to 2022 doesn’t show any warming in either Tmin or Tmax, yet everything you pose has a definite warming trend of a substantial value. Why the difference?
As more and more cities are added in to what we are examining it will be harder and harder for you to proclaim “global warming”. You have already seen the data from the Japanese islands here on WUWT that show no warming. Gosh, that is far from the U.S. We’ve had folks plot some British temps that show no warming. It’s only a start.
“I was trying to answer your question as to how it would be possible for one thing being below an average and there not be another thing equally above the average.”
Boy, are you obsessed with averages. Tell you what, next time you mention average or mean, why don’t you tell us the variance or standard deviation of the distribution you have just calculated the average for? That way we can judge what the data spread was in that distribution.
“The 1999 to 2022 doesn’t show any warming in either Tmin or Tmax, yet everything you pose has a definite warming trend of a substantial value. Why the difference? ”
Again, it would be a help if you could say what data you are using. Based on the daily GHCN data I get a warming rate from 1999 to 2022 of
TMAX: +0.37°C / decade
TMIN: +0.44°C / decade
That’s using the annual averages.
If I was unwise enough to use the daily values as Tim does I get
TMAX: +0.55°C / decade
TMIN: +0.62°C / decade
“My data is from NOAA. A big chunk of the data is missing. But since a linear trend is typically determined mostly by the start data and the end data the trend is zero.”
Could you provide a link. The NOAA’s Climate at a glance shows Topeka as having a trend of +0.4°F / decade since 1953.
https://www.ncei.noaa.gov/access/monitoring/climate-at-a-glance/city/time-series/USW00013996/tavg/ann/1/1953-2022?base_prd=true&begbaseyear=1901&endbaseyear=2000&trend=true&trend_base=10&begtrendyear=1953&endtrendyear=2022
“My personal weather stations agrees with KFOE since 2012 with an average anomaly of 0.04K, a mode of 0, and a standard deviation of 2.8.”
If you only have data since 2012, what is your base period for the anomaly? If it’s the same period, it’s not going to be a surprise if the average anomaly is 0.
“I’m not surprised you are now trying to figure out a way to disregard the linear trending you so vociferously defend otherwise.”
I have never claimed a linear trend is the last word on the subject. It’s a useful value if you want to compare the rate of warming. Nor am I trying to disregard it now. I’ve specifically told you what trend I get for the Topeka GHCN data, you so far have only made vague references to there being a trend of zero.
“As I said elsewhere, if you are afraid of CAGW then move to east central Kansas.”
Not having seen some of the maximum temperatures there.
Here are two graphs that should assuage your fears.
The anomaly values use a baseline of all available years.
1953 – 1969 => 17 years
1999 – 2022 => 23 tears
=> 40 years
The upper and lower uncertainty is based on adding the monthly uncertainty to the baseline uncertainty using RSS, i.e., adding variances. The individual uncertainties were calculated using TN 1900 methodology.
What fears? As always you seem to be arguing against phantoms.
“If you only have data since 2012, what is your base period for the anomaly?”
It’s one decade, 2012 to 2022. Put down the bottle!
The baseline is subtracted from each month’s average to get the monthly anomaly. The uncertainties of the baseline and the monthly average are then added to find the total uncertainty.
Why do you think this will produce an average anomaly of 0?
“It’s a useful value if you want to compare the rate of warming.”
It’s not useful at all if the uncertainty interval is wider than the differences you are trying to discern. Why do you *never* calculate standard deviations, variances, and uncertainties associated with the data? Why do you always assume 100% accuracy in all your stated values and that no variation exists in monthly temperature data?
” I’ve specifically told you what trend I get for the Topeka GHCN data, you so far have only made vague references to there being a trend of zero.”
And I posted you the graphs of Tmax and Tmin showing *NOT* increase or decrease in either. And you can’t explain why your use of Tmedian does show something.
Climate is determined by Tmax and Tmin. Multiple locations can have the same Tmedian with vastly different Tmax and Tmin values and, therefore, different climates.
Exactly what do you think Tmedian is telling you?
“Why do you think this will produce an average anomaly of 0?”
It’s pretty basic. If you subtract a ten year average from each value in the same ten years, and then average the differences you will get zero.
“Why do you *never* calculate standard deviations, variances, and uncertainties associated with the data?”
I’ve done that several times. See all my explanations as to why the uncertainty of your Topeka data is not ±6°C.
“Why do you always assume 100% accuracy in all your stated values and that no variation exists in monthly temperature data?”
I don’t think stated values are 100% accurate. I’ve told you this more times than is healthy. Assuming the stated values are a reasonable basis for calculations is a different thing. See that NIST example you were so keen for me to agree to. It treats the stated values as is. And you claim I think no variation exists in monthly data is a meaningless lie.
“And I posted you the graphs of Tmax and Tmin showing *NOT* increase or decrease in either.”
You claim the data shows something different to mine. I don’t know why or which is correct. I’ll look into your description later if I have time.
“And you can’t explain why your use of Tmedian does show something.”
What do you mean by Tmedian? It’s not something I’ve ever claimed to use. All I ever did was calculate TAvg by taking the mean of TMax and TMin. If you want to call that the median of max and min, so what? They will be the same as you only have two values.
“Multiple locations can have the same Tmedian with vastly different Tmax and Tmin values and, therefore, different climates. ”
But it’s not possible for max and min temperatures to stay the same, but for average temperatures to increase. Whatever the reason for the difference between out two trends it has nothing to do with using Tavg.
“It’s pretty basic. If you subtract a ten year average from each value in the same ten years, and then average the differences you will get zero.”
So what? The uncertainty of the anomaly series for january is about 2.7. Meaning the average could actually be anywhere from -2.7 to +2.7.
Why do you always forget about the uncertainty? The standard deviation of the anomalies for january is 1.76.
If you just ignore the standard deviation and uncertainty then how do you actually know *anything* about the distribution at all? Why do you assume everything is 100% accurate and there is no variability?
“I’ve done that several times”
Really? You posted *NO* standard deviation or uncertainty for USW00013920. Why not? You just assumed that all the values were 100% accurate and the only issue was the fit of the stated values to the trend line. That’s what you *always* do.
“And you claim I think no variation exists in monthly data is a meaningless lie.”
If you think there *is* variation then why do you never bother with it?
“You claim the data shows something different to mine. I don’t know why or which is correct. I’ll look into your description later if I have time.”
I claim Tmedian is *NOT* a good proxy for climate change. Multiple combinations of temperatures can result in the same Tmedian while the climates of the locations can be very different.
Tmax and Tmin are the only valid ways to measure climate changes. I’m not surprised to see that you don’t understand that basic physical fact. Physical reality is not your strong suit.
” It’s not something I’ve ever claimed to use.”
Tmedian is *NOT* an average. Since the daytime temps and the nighttime temps come from different distributions you cannot find an “average” that is physically meaningful, only a median. It’s why professionals who use degree-days have moved to using the integral method instead of the Tmedian method.
“But it’s not possible for max and min temperatures to stay the same, but for average temperatures to increase.”
I’ve given you three different locations now where Tmax and Tmin temps show no discernable increase over various time spans. Yet on at least one you show that Tavg has changed. *YOU* need to be the one to explain that.
” Whatever the reason for the difference between out two trends it has nothing to do with using Tavg.”
Delusional as usual.
“So what?”
You wouldn’t need to keep asking theses questions if you just tried to follow the train of comments. I responding to you saying
What do you think the anomaly of 0.04K is proving?
“Really? You posted *NO* standard deviation or uncertainty for USW00013920. ”
See comments from here:
https://wattsupwiththat.com/2023/02/03/the-new-pause-lengthens-again-101-months-and-counting/#comment-3679431
“You just assumed that all the values were 100% accurate and the only issue was the fit of the stated values to the trend line.”
You do realise that’s exactly what you are doing as well?
“Tmax and Tmin are the only valid ways to measure climate changes. ”
Then stop talking about the pause in UAH data.
“Tmedian is *NOT* an average.”
This may just come down to what you mean by average. I was always taught, a long time ago, that mean median and mode where all different types of average. But often average is used to mean mean.
But as I say, it makes no difference when you have just two values, as the median of an even number of values is determined by taking the mean of the two middle values.
“Since the daytime temps and the nighttime temps come from different distributions you cannot find an “average” that is physically meaningful, only a median.”
If you don’t think you can take the mean of max and min, why do you think the median is any more meaningful?
“*YOU* need to be the one to explain that.”
And as I keep telling you, any explanation will have nothing to do with using mean temperatures. Any trend in the mean will be between the trend in the max and the trend in the min. And as I’ve explained that’s exactly what I find with my data. Min not rising, max rising twice as fast.
“Delusional as usual.”
Really? You think that if you calculated the average daily temperature using your data it would suddenly show a trend that is greater than your trend of maximum values?
“What do you think the anomaly of 0.04K is proving?”
I *know* what it means but apparently you don’t have a clue!
“You do realise that’s exactly what you are doing as well?”
That is *NOT* what I’m doing. I actually calculated the standard deviation and expanded uncertainty for all of it. Using Possolo’s method in TN1900 you get a standard deviation of about 12 for the entire record and an expanded uncertainty of .18. That means the actual trend could be from +0.18 per decade to -0.18 per decade. Even at the outside positive edge of the uncertainty interval its far less than you get. Even NOAA only gives a value of 0.08/decade.
When you look at the trend and actually include the uncertainty interval the trend can be anywhere inside it. Something you absolutely refuse to consider in your calculations.
“This may just come down to what you mean by average. I was always taught, a long time ago, that mean median and mode where all different types of average. But often average is used to mean mean.”
(T1 + T2)/2 is always a median. It is *NOT* an average, i.e. mean, unless you have iid distributions.
There *is* a reason why Tmax and Tmin should be looked at separately to see what they are doing. (Tmax+Tmin)/2 is *NOT* representative of climate.
“I *know* what it means but apparently you don’t have a clue!”
And as so often, you deflect from answering the question and resort to personal insults.
“That is *NOT* what I’m doing.”
The “what” in question was fitting a trend line to the stated daily values. You do that when you claimed the trend was flat, you did not calculate standard deviations using “Possolo’s method in TN1900” .
“Using Possolo’s method in TN1900 you get a standard deviation of about 12 for the entire record and an expanded uncertainty of .18.”
You really have a problem focusing on the discussion. We were not talking at this point about your annual uncertainty values, but on the trend based on stated values.
It’s difficult to follow all the figures you keep spouting. What uncertainty are you talking about when you say 0.18? Annual, or the average of all days since 1953, or what? Is it in F or C?
“That means the actual trend could be from +0.18 per decade to -0.18 per decade.”
If true, that shows your claim of no warming is statistically meaningless.
“Even at the outside positive edge of the uncertainty interval its far less than you get.”
You still don’t want to accept the possibility that it’s your figures that are wrong.
“Even NOAA only gives a value of 0.08/decade. ”
A reference would be useful.
“When you look at the trend and actually include the uncertainty interval the trend can be anywhere inside it.”
You still don’t get how uncertainty of a trend works. But at the same time you throw precise figures for the trend with no mention of any uncertainty, and claim that this proves there has been no warming.
“(T1 + T2)/2 is always a median. It is *NOT* an average, i.e. mean, unless you have iid distributions. ”
Gibberish.
No one is saying the average of max and min is the exact value of the daily average measured as a continuous function. But it’s a reasonable approximation when all you have is the max and min values, and it is still the mean of those two values. Claiming it’s actually the median value of the continuous function of temperatures over the day is no more realistic than claiming it’s the mean of those values.
“Do you consider daytime temps and nighttime temps to be random variables?”
You can, but not in the way I suspect you think they are. The course of temperatures over the day or night is not really random. And choosing the maximum or minimum temperature is not making a random sample. The randomness is mainly to do with how those values change from day to day. And even then you have to consider the non-random seasonal variation.
And this entire rant is still a distraction from the main point. I calculate the trend of just maximum and it is bigger than your trend of maximum values. One or both of us is wrong, and this has nothing to do with calculating mean temperatures. It’s probably to do with the discrepancy between temperatures in my data and yours that occurs in the years following 1997. Until you tell me where you got your data it’s a bit difficult to understand why there is this difference.
“””””You can, but not in the way I suspect you think they are. The course of temperatures over the day or night is not really random. And choosing the maximum or minimum temperature is not making a random sample. The randomness is mainly to do with how those values change from day to day. And even then you have to consider the non-random seasonal variation.”””””
Taking the maximum value of a sine function is a consistent measurement of changes in the amplitude of the signal. Taking the minimum value of an exponential decay function is a consistent measurement of the decay value.
Combining those two readings from different functions through calculating a mean provides nothing of value for statistics. They are not independent (random) selections from the same distribution. That is, they are NOT Independent and Identical Distribution (IID) selections.
As soon as you calculate a mean you move into the realm of statistics and away from the realm of measurements. Why? Because a mean of 49, 50, 51 gives you the same mean as 40, 50, 60. A mean has no value without knowing the associated statistical descriptors like variance/standard deviation.
Each daily average has a variance. When you combine them in an average, you create a new random variable containing a new distribution. Yet you would add two days with identical temperatures and get the same mean, but vastly lower variance. Look at that distribution, same mean, same data values at the same distance from the mean. Why is the variance lower?
Basically everything points to keeping Tmax and Tmin in separate random variables. They are independent measurements and they are from the same distribution. They can be considered IID! It allows one to see what is changing whereas Tmid does not.
“And as so often, you deflect from answering the question and resort to personal insults.”
*YOU* brought it up. If you don’t know the answer then do the research. You’ll just ignore whatever explanation I offer and argue that the color blue is actually green.
“The “what” in question was fitting a trend line to the stated daily values. You do that when you claimed the trend was flat, you did not calculate standard deviations using “Possolo’s method in TN1900” .”
Of course I did! I just didn’t post it. Attached is a screen clip of the anomalies and uncertainties I calculated for January from 2013 to 2022 from my own weather station, which as I showed is very close to the values from the KFOE weather station.
Crap, I hit the wrong button. I’ll include the screenshot in the next message.
The first row is the anomaly, The second row is a direct addition of the uncertainties. The third row is the RSS addition of the uncertainties.
here’s the screenshot.
“*YOU* brought it up.”
Yes. I asked you a question. What did you think the relevance of an average anomaly of 0.04K was, when you were using the same period as your base line? Your response was “I *know* what it means but apparently you don’t have a clue!”.
“If you don’t know the answer then do the research.”
What do you think asking you what you thought it meant is, if not doing the research? There aren’t as yet any sections of the library devoted to what goes on in Tim Gorman’s head.
“Of course I did! I just didn’t post it.”
But that’s the problem. Every time I quote a trend you accuse me of all sorts of nonsense because I’m not stating the uncertaintioes and am just using the stated values. But you do the same thing all the time and expect people to guess that there may be some associated uncertainty that just exists in your own mind.
You claim that you have demonstrated there is a pause in one station since 1953. You have quoted an exact figure for the actual rate of warming since then, but you still haven’t said what the units are fro that warming rate, or given any uncertainty figures for the trend. Knowing yoiu I’m sure you will claim some ridiculously large value, but won’t accept that this large uncertainty undermines your claim that there has been no warming.
“What do you think asking you what you thought it meant is, if not doing the research? There aren’t as yet any sections of the library devoted to what goes on in Tim Gorman’s head.”
You don’t have even the slightest clue as to what the .04 means, do you? What happens when a temperature measuring station is replaced? Do you have even a clue on that?
“But that’s the problem. Every time I quote a trend you accuse me of all sorts of nonsense because I’m not stating the uncertaintioes and am just using the stated values. But you do the same thing all the time and expect people to guess that there may be some associated uncertainty that just exists in your own mind.”
So standard deviations are *not* a measure of uncertainty? I’ve *given* you the standard deviation and expanded uncertainty and you just pretend I haven’t. Go to my web site and look at the spreadsheets. You’ll find it all there! Or, better yet, DO YOUR OWN ANALYSIS!
“You claim that you have demonstrated there is a pause in one station since 1953.”
You can’t even remember that I have posted the results from THREE different measurement stations! My own, KFOE, and Appleton City, MO!
You truly do live in your own little box, don’t you?
“You have quoted an exact figure for the actual rate of warming since then, but you still haven’t said what the units are fro that warming rate”
ROFL!! Yep, I’ve never once mentioned the term KELVIN.
“but won’t accept that this large uncertainty undermines your claim that there has been no warming.”
Again ROFL!!
I’ve already told you twice that you can’t tell from the trends whether it is warming, cooling, or going sideways. Not my trends, not the UAH trends, not the NOAA trends, not the GHCN trends, and certainty not the model trends. I’ve told you this over and over and over and over and over and over and over and over and over and over and over and over and over again. And you just blow it off each and every time!
You *NEVER* consider uncertainty, be it measurement uncertainty or data variability. You *ALWAYS* assume everything is 100% accurate and is Gaussian. You can’t even admit there is a difference in measuring the same thing multiple times and measuring multiple different things one time each because it would ruin your carefully maintained delusions about your “trends”.
Bottom line: The GAT is garbage. It is not fit for purpose. It is developed by ignoring all rules concerning statistical analysis. It jams together non-iid distributions with different variances and different uncertainties and then conflates the standard deviation of the sample means with the accuracy of the sample means and the average calculated from them – as if the population mean is always 100% accurate! They, like you, think a median is also an average – because they, like you, consider everything to be Gaussian. Daytime temps are Gaussian and nighttime temps are Gaussian. They both have the same exact variance with zero covariance. The temps are 100% accurate with no measurement uncertainty whatsoever. And the average uncertainty is the uncertainty of the average!
If an engineer designing something that would be used by the public used these kind of statistics the engineer would soon be a pauper and very likely behind bars for criminal negligence.
Even those physical scientists like Hubbard ad Lin that proved you can’t use regional temperature adjustments because of differences in micro-climate among measuring stations, i.e. homogenization and infilling, are ignored by the climate science field.
And you can’t believe it when someone questions the religious dogma you live by. Unfreakingbelievable.
Everyone, including NOAA, ignores the fact that NIST has provided a STANDARD method of evaluating temperature. Apparently NIST scientists don’t have a clue when it comes to evaluating uncertainty! Maybe NIST is an agency whose responsibilities should be turned over to NOAA! We could certainly save some money in government and all the certified labs could have better direction on evaluating uncertainty.
“You don’t have even the slightest clue as to what the .04 means, do you? ”
To me it means the average of your 10 year period is very similar to the average of the same period. What meaning you attach to it is your own affair.
Rest of the rant ignored.
“We were not talking at this point about your annual uncertainty values, but on the trend based on stated values.”
The trend HAS to be considered in relation to the uncertainty! The fact that you never do that is why your assertions simply can’t be believed – EVER.
If you’ll look carefully at the screenshot I just posted you’ll see that in most months the uncertainty is much, much greater than the actual calculated anomaly! It is impossible to say what the tend is when the uncertainty is larger than the values being trended. When will you wake up and actually understand that?
“If true, that shows your claim of no warming is statistically meaningless.”
ABSOLUTELY! Just like the claim that there is warming! It’s why the whole edifice is not fit for purpose!
“You still don’t get how uncertainty of a trend works.”
I know exactly how a trend works. And I understand that you consider the residuals between the data points and the trend line to be the “uncertainty” of the trend line — ALL THE WHILE IGNORING THE UNCERTAINTIES OF THE DATA POINTS!
“We were not talking at this point about your annual uncertainty values, but on the trend based on stated values.”
AGAIN – the trend *HAS* to be considered in relation to the uncertainties. You are a total failure as a physical scientist!
“You still don’t want to accept the possibility that it’s your figures that are wrong.”
My figures are *NOT* wrong. And you can’t show how they are. They are right out of TN1900 and Libreoffice Calc. About as simple as you can get!
“A reference would be useful.”
I’m not your research assistant. Google “noaa warming per decade”.
“Gibberish.”
And you consider yourself to be a statistician? (Tmax + Tmin)/2 is a MEDIAN. It is only the average if you don’t have a skewed distribution. Since Tmax and Tmin come from different distributions, when you combine them you *will* get a skewed distribution as a result. They are *NOT* iid. They are *NOT* Gaussian. Why do you *always* circle back around to considering everything to be random and Gaussian. You say you don’t do that but you do it EVERY SINGLE TIME!
“But it’s a reasonable approximation when all you have is the max and min values, and it is still the mean of those two values”
It is *NOT* a reasonable approximation. And it is *NOT* a mean. It is a median.
“Claiming it’s actually the median value of the continuous function of temperatures over the day is no more realistic than claiming it’s the mean of those values.”
In a skewed distribution the median is *NOT* the mean. The median is, however, ALWAYS the median, even in a skewed distribution. The median is (T1 + T2)/2 – ALWAYS. The mean is not.
“The course of temperatures over the day or night is not really random.”
If they are not random then how do you treat them using statistics?
“The randomness is mainly to do with how those values change from day to day”
That is how Possolo in TN1900 treats them. Yet you reject that treatment as being valid. Possolo didn’t use “median” values, he used maximum temperatures. Apparently that just sails right over your head.
“ I calculate the trend of just maximum and it is bigger than your trend of maximum values.”
Take it up with Libreoffice Calc.
Bellman has turned into a mere troll.
Here is a picture posted by Willis E. on another thread. From this post on I’ll only be answering posts that deal with the top three categories. Can’t add an image on edit. See next post.
“It is impossible to say what the tend is when the uncertainty is larger than the values being trended. ”
Then use K rather than anomalies.
Really it doesn’t matter what the size of the values are, it’s the strength of the trend that matters. And you are just wrong to say it’s impossible to see a trend if the variation is grater than overall trend. And you don’t need to know the uncertainty in the values because that’s implicit in the variation.
We’ve been over this so many times before it’s pointless to try to explain it again. Any text book including your Taylor one will explain the equation for determining the uncertainty in the trend.
“ABSOLUTELY! Just like the claim that there is warming! It’s why the whole edifice is not fit for purpose!”
Brilliant whataboutary. This discussion isn’t about warming, it’s about your claim that one station shows no warming since 1953. If you are now accepting that that claim is meaningless, than fine. But then why spend so much time trying to defend it? You seemed to want to make a point about how this one station shows there is no global warming, but if it’s impossible to say what the actual trend is, and it may be warming faster than the global average, what point do you think you are making.
The problem is it will always be harder to see a significant trend in individual locations, because individual locations have more variability.
“I know exactly how a trend works.”
You missed of the word “uncertainty”. I said you didn’t understand how the uncertainty of a trend works. And everything you keep saying reinforces that claim.
“And I understand that you consider the residuals between the data points and the trend line to be the “uncertainty” of the trend line”
Then you still don’t understand, because that is not what I consider the uncertainty to be. What you keep describing is the uncertainty in the ability to use the trend line to predict an individual value – the prediction interval. That’s different to the confidence interval of the slope, which is what I would consider to be the uncertainty of the slope. This is based on the standard error of the slope, not the standard error of the residuals.
“ALL THE WHILE IGNORING THE UNCERTAINTIES OF THE DATA POINTS!”
And you still don’t get the fact that uncertainty in the data points is part of the variance of the data points.
“You are a total failure as a physical scientist!”
Just as well I’m not a physical scientist then. But I think it’s ironic to be described like that from someone who is incapable of accepting that they may have made a mistake in their data. You like to quote Feynman – remember “you are the easiest person to fool”. And by “you” he means “you”, not everybody over than “you”.
When I saw a discrepancy between my results and yours, I didn’t just assume that you had made a mistake, even though that’s what it looked like. I tried to check my data against other sources and asked you to detail your data. I always thought it was possible I was making a mistake – I’ve certainly made many before.
You on the other hand insist it’s impossible for you to be wrong – e.g.
“I’m not your research assistant. Google “noaa warming per decade”. ”
When I asked for a reference to your statement that “Even NOAA only gives a value of 0.08/decade. ” You would explain exactly what figure you were quoting. Over what period? Global or just for Topeka? Average, Maximum or Minimum? Telling me to google the result for you is useless if you just reject any result you don’t like.
So, the first result I get from your search term is
So I’m guessing that’s your spiel. You didn’t mention that this is a trend since 1880 – and you should know about the dangers of taking a linear trend over non-linear data. The report goes on to say
“And you consider yourself to be a statistician?”
Not really. It’s just a hobby.
” (Tmax + Tmin)/2 is a MEDIAN. It is only the average if you don’t have a skewed distribution. ”
I think you are confusing the concept of a mean as a sample of a population, which as I keep having to remind Jim, this is not. What (TMax + TMin) / 2 is, is the average of the two values. It’s the very definition of a mean average.
And if you want to consider it in relation to the actual daily temperature profile, it may or may not be reasonable approximation of the daily mean, just as it may or may not be a good approximation of the median.
“Why do you *always* circle back around to considering everything to be random and Gaussian.”
Pathetic lies again. I am specifically saying, and keep having to [point out that max and min are not a random sample. Nor do I claim they come from a gaussian distribution. Far from it.
“It is *NOT* a reasonable approximation. And it is *NOT* a mean. It is a median.”
Could you point to your unique definition of mean? Here’s one of mine
https://en.wikipedia.org/wiki/Mean
“In a skewed distribution the median is *NOT* the mean.”
”
Indeed, and the mean is not the median. But the mean is the mean and the median is the median. Do you have a point?
“The median is (T1 + T2)/2 – ALWAYS. The mean is not.”
You think the mean of T1 and T2 is not (T1 + T2) / 2? Again, if you are talking about the population, (T1 + T2) / 2 is not necessarily going to be either the population mean or the population median. E.g. say the population is 1, 2, 3, 6. Mean is 3, median is 2.5. If we have the max and min values, 1 and 6. The mean / median is (1 + 6) / 2 = 3.5.
“If they are not random then how do you treat them using statistics?”
I’m not trying to “treat” them using statistics. Jim keeps doing that by calculating an uncertainty based on their standard deviation. I’m just saying the average is a useful value, which approximates something about the temperature throughout the day. Certainly not perfect, but reasonable given the available data.
“That is how Possolo in TN1900 treats them. Yet you reject that treatment as being valid.”
How many more times, I am not rejecting that. I rejected the idea that you could take the standard deviation to determine the uncertainty in annual values, which was Jim’s idea, not TN1900. And even you and he seem to have rejected that now.
“Possolo didn’t use “median” values, he used maximum temperatures. Apparently that just sails right over your head.”
I’ve said it many times. I really which you would engage in what I say, rather than pick fights with all your straw men.
“Take it up with Libreoffice Calc.”
A bad workman blames his tools. A spreadsheet can only work with the data it’s given, and if that’s wrong it’s results will be wrong.
By the way, are you going to blame Libreoffice for the fact you reported the trend to 15 significant figures? Some here would call that fraudulent.
“What (TMax + TMin) / 2 is, is the average of the two values. It’s the very definition of a mean average.”
It isn’t. It is a median. Sometimes the median is the average but not in the case of a skewed distribution.
Why you can’t accept this is just beyond me. The average of a sine wave is .63Tmax. That is the value you should use in calculating the daily average and not Tmax! But then physical science just doesn’t mean much to you, does it?
“That is the value you should use in calculating the daily average and not Tmax!”
Good grief. This nonsense again.
So let’s test this with a day where the maximum is 100°F. That is 311K.
311K * 0.63 = 196K. That is -107°F.
Is that really the value you want to use for the average temperature on a hot August day?
You *still* don’t have a clue as to how this works, do you?
Tmax is based on the amplitude of the sine wave. Daily temperatures don’t go from 0K to 311K.
You truly do not live in reality. What is the diurnal range in summer in Kelvin?
Correct. It seemed nonsense when you first said it, and everything you’ve said since has been more nonsense. So yes, I’ve no clue as to how you think it’s meant to work. You’ve just got this single hammer of knowing that the area of the positive portion of a sine wave is 0.63 * it’s amplitude, and are trying to hammer the idea of a daily average with it.
“Tmax is based on the amplitude of the sine wave. Daily temperatures don’t go from 0K to 311K.”
Then stop saying the average is Tmax * 0.63.
The only way you can make this remotely work is to say (Tmax – Tavg) * 0.63 + Tavg. But that would mean accepting Tavg has some use. And it’s still not telling you anything particularly useful – just the average temperature for the period of the day when the temperature is above average, as long as you can assume the temperature follows a sine wave.
“What is the diurnal range in summer in Kelvin?”
From the GHCN data it would appear to be around 12°C for Topeka Forbes. Or about 12K. The standard deviation of this is 3.2K. The 5-figure statistic is
1.7, 10.0, 12.2, 13.9, 22.8
Good grief guy. Tmax * 0.63 is for a pure sine wave from 0 to π. The 0.63 is based on a pure sine wave from 0 to π. The range is actually Tmax- Tmin.
Since the sun’s insolation falls below what the earth is radiating sometime in the afternoon, the daytime average should be integrated from 0 to something like 5/8ths or 3/4ths π.
Which is the point I’ve been trying to tell Tim for the last 2 years. Tmax * 0.63 only works if the average is at zero.
go look at my spreadsheet.
Then come back and tell me Libreoffice Calc has a problem calculating a trend line!
“Then use K rather than anomalies.”
IT DOES NOT HELP! When are you going to figure that one out? The anomaly still has units of Kelvin. And the uncertainties in the baseline and in the measured value ADD. The uncertainty of the anomaly is GREATER than the uncertainty of either of the components!
“And you are just wrong to say it’s impossible to see a trend if the variation is grater than overall trend.”
Unbelievable! You’ve been given graphs multiple times that show positive, negative, and sideways trends can all fit inside the uncertainty intervals of temperature graphs. MULTIPLE TIMES. And yet you continue with the garbage that *YOU* can tell what the right trend is!
“And you don’t need to know the uncertainty in the values because that’s implicit in the variation.”
It’s the SAME THING EVERY SINGLE TIME! “You can ignore uncertainty”.
“uncertainty in the trend”
You KEEP TRYING to conflate how well the stated values fit the trend line, i.e. how big are the residuals, with the uncertainty of the stated values. THEY ARE NOT THE SAME THING! You just can’t seem to get that through your head!
“The problem is it will always be harder to see a significant trend in individual locations, because individual locations have more variability.”
Unfreakingbelievable! Variances ADD when you add random variables. The variance of the combination is BIGGER than the variance of the components. When you combine random variables from different locations THEIR VARIANCE ADDS!
At this point you need to put down your bottle and go sleep it off.
THE UNCERTAINTY IS IN THE DATA VALUES. If you can fit different trend lines within the uncertainty interval of the data values then the residuals to the trend line you *think* is the right one are meaningless! BECAUSE YOU CAN’T KNOW WHAT TREND LINE IS THE RIGHT ONE!
8 years is too short to make ANY conclusions about any patterns of weather behaviors.
Maybe you can help us convince Monckton of that when he posts his next monthly installment?
Current trends many times become long term trends. If you don’t recognize what is happening today it can slap you up side the head like a shovel.
How do you do that with 8 years, when you admit that there’s no way to know if it’s rising or falling?
Monckton is only hoisting them on their own petard! You still haven’t figured that one out, have you?
If that’s an admission that you think the pause is nonsense intended to fool the gullible, I applaud your honesty.
If not, you’re right I still have no idea what you are talking about. Who do you think Monckton is hoisting? Those who believe in it, or those who can see through trick?
“If that’s an admission that you think the pause is nonsense intended to fool the gullible, I applaud your honesty.”
I’ve *ALWAYS* said the global average temp is a tool to fool the gullible, be it the satellite record or the surface record (land + se). It’s not fit for the purpose for which it is being used. Even using daily Tmax and Tmin is not an *average*, it is a median. As a median it is *not* a good proxy for the heat anywhere in the atmosphere. And that is just one of the many problems with the global “average”.
That does *NOT* mean that those using the tool can’t be hoist on their own petard! Live by the global average then die by the global average (so to speak)!
Yet the only ones who get hoisted by this tool are people like you who say:
So which is it? Are we supposed to ignore all these short term trends and laugh at the fools who take them seriously, or would you prefer we don’t ignore them in case they turn into a long term trend?
Is the 18+ year early 21st Century pause too short? CliSciFi changes its story about pause lengths being significant (debunking GCMs) from 10 to 15 then finally 17 years. Using their criteria, CliSciFi GCMs have been invalidated.
…and yet we take them seriously.
Maybe we should just stop paying them attention, and they’ll go away.
Then again, the jobless guy never leaves before all the beer is finished…
I don’t disagree. Maybe you can convince Monckton of that the next time he posts about the pause.
Really? Now you gonna tell me you don’t have enough people. What are you people doing in those Green Jobs that we have to go hungry to sponsor in taxes??
Yes. For example, Craig & Hawkins 2020 describe the recent digitization of European weather records from 1900-1910. Cornes et al. 2020 completed their digitization of recently declassified US Navy records recently too. Many projects are still ongoing so the global average temperature will continue to change as new observations are uploaded into the repositories.
What just happened is actually a good example. Last week observations from 1850 were finally incorporated into NOAAGlobalTemp 170 years after they were recorded. [Vose et al. 2021]
Let’s look at the changes, and see how reasonable your explanation is.
You might expect the size of changes to be smaller the further into the past we are considering, because a) most of the stations will already have been uploaded; b) kriging should give not unreasonable estimates for the missing stations. Moreover, there has to be a very good reason for all the adjustments to have the same sign. It looks like warming the present to any neutral observer.
Can you provide more details about what we’re looking at here? What are the units of the y-axis? I’m assuming the x-axis is the year? What datasets and periods are do each of the x-axis categories represent?
It is a chart of the differences in the anomalies in the two charts from NOAA in the article. The units are Centigrade, as with the original charts. The data were derived by pixel measurements from each chart image.
Ah got it. That is consistent with the differences I’m seeing using the wayback machine as well. That is a pretty good indication that a large upload of observations occurred recently. BTW…NOAAGlobalTempv5 does not do a full sphere measurement or employ infilling like what the others do so it can be especially sensitive to uploads from stations in the sparsely observed areas. We’ll have to wait for the full sphere [Vose et al. 2021] or artificial intelligence [Haung et al. 2022] versions to get the full sphere results. It is possible that the website got updated recently to report on the newer versions…I don’t know. That seems unlikely, but I can’t eliminate it as a possibility.
bdgwx said: “It is possible that the website got updated recently to report on the newer versions…I don’t know. That seems unlikely, but I can’t eliminate it as a possibility.”
Turns out…that was it! They just upgraded to version 5.1.
https://www.ncei.noaa.gov/products/land-based-station/noaa-global-temp
It is obvious that the data have been updated. The question is, why do the updates push up the average values? What is the nature of the updates? Partial answer:
Input Datasets
Version 5 incorporates upgraded versions of ERSST and GHCN-M for increased land and ocean spatial coverage, and improved treatment of historical changes in observing practice.
Input Datasets
So we have two new input data sets. Now we can narrow down what is happening. Ans since the record is now complete for all land and ocean areas in 5.1 there will be no further updates for missing records. Will there?
“The question is, why do the updates push up the average values?”
Per [Vose et al. 2021] it is the full spatial coverage and inclusion of the Arctic region that has the biggest effect. They also incorporated more observations.
“Ans since the record is now complete for all land and ocean areas in 5.1 there will be no further updates for missing records. Will there?”
No. 5.1 will not be the last version. They’ve already said as much with their 2022 publication.
Richard Spinrad was sworn in as NOAA Administrator on June 22, 2021. HIs stated three objectives are (I include only the part that is relevant to the topic):
1. “…environmental products and services in the context of our changing climate,…”
2.”…climate products and services…” and
3.”Creating a more just, equitable, diverse, and inclusive workforce.”
What could possibly go wrong? Spinard/NOAA are on track to fix things, because, you know, deniers and racism and homophobia, and big oil, and…
Wouldn’t be surprised if it followed the same fate as the 2015 Karl study one day. I’m betting it will come the 2030s. They’re going to try to make 2020 warmer than 2016. What we really need to watch however is any adjustment to the USCRN. That cannot be taken away otherwise we have no good data.
Speaking of USCRN…it suggests the NOAA PHA adjustments could still be underestimating the warming [Hausfather et al. 2016]. BTW…here is the Karl et al. 2015 publication. Notice that the adjustments Karl made actually reduce the overall warming trend relative to the unadjusted data. If you think USCRN is going to follow the same fate then we should expect a reduction in the warming trend shown by USCRN over its period of record as well.
Bdgwx sure. But you forget the best thing about the USCRN: it never needs to be adjusted, because there are no sitting heat-induced problems with the thermometers. Therefore if it were to be adjusted, that would sure be sketchy.
I don’t disagree that sighting adjustments should not be necessary. But to claim that NOAA is going to reduce the USCRN warming trend of 0.60 F/decade by 2030 anyway seems illogical.
If you do not trust NOAA, which I do not, there is no logical reason to trust their USCRN numbers. That their two US temperature compilations, ClimDiv and USCRN, are so similar, in spite of huge differences in weather station siting, is proof of data manipulation. That is not a coincidence. Never trust organizations that are not trustworthy FOR ANYTHING, including USCRN.
True. If you look back at some old blog posts regarding the USCRN, you can see some adjustments have been made. February 2021 used to be the coldest anomaly on the graph but they adjusted down December 2009 so now that’s the coldest one.
Can you post a link to that?
https://wattsupwiththat.com/2021/03/13/u-s-surface-temperatures-drop-to-the-lowest-in-over-30-years-during-february/
I don’t see anything in there saying USCRN has been adjusted. In fact, the article insinuates that USCRN should be preferred over nClimDiv (superceded USHCN).
The upward trend in USCRN come purely from the 2015/16 El Nino period. being in the latter half of the data.
As time progresses that “bump” will drift to the centre of the data time period, and the trend will ease back towards zero.
And as you say, USCRN is now being used to moderate the ClimDiv warming adjustments… they cannot allow ClimDiv to drift higher, no matter how much they would like to. !
Since USCRN inception in 2006 the ONI has averaged -0.16 which includes the triple dip La Nina currently on-going.
Jeepers, dude, do you ever listen to yourself? Rather, I am sure you like listening to your own dulcet tones, what I need to know is: do you ever hear yourself?
…and you don’t feel a bit embarassed? Or are you such a committed warmunist, anything outside your dogma constitutes blasphemy?
How far must we ‘adjust’ before you feel happy? Did you calculate that number, or was it divine revelation? (Do you have plans to cleanse the unbelievers?)
What do the people in your temple say when they wish you a good trip? That to you.
Yes. I try to put myself in others shoes when proof reading my posts. I try to keep my posts on topic, devoid of emotions, and accompanied with citations. That probably makes my tone appear academic and robotic, but I’m okay with that.
Anyway, regarding the question: How far must we ‘adjust’ before you feel happy? it depends on the biases identified. I won’t be satisified unless all known biases have been addressed.
How about the known unknowns, and the unknown unkowns? Or don’t they matter, especially if you get to choose which ones you keep unknown?
They matter. That’s why pair-wise homogenization [Menne 2009] and similar techniques were developed.
All homogenization does is spread around systematic bias to other stations.
As I recollect, the crux of Karl’s paper was ‘disproving’ the almost two-decade hiatus by assuming that boiler-room intake temperatures were superior to the purpose-built, state-of-the-art ARGO buoys, and increasing the ARGO readings to agree with the not-for-purpose inlet temperatures, taken from various depths, with uncalibrated thermometers.
It was the opposite. ERSSTv4 used the superior buoy data make better adjustments.
Karl et al. observe “… that the ship data are systematically warmer than the buoy data.”
However, despite saying that “buoy data have been proven to be more accurate and reliable than ship data, with better-known instrument characteristics and automated sampling” Karl, et al. acknowledge:
“In essence, the bias correction involved calculating the average difference between collocated buoy and ship SSTs. The average difference globally was −0.12°C, a correction that is applied to the buoy SSTs at every grid cell in ERSST version 4.”
How are the adjustments “better” when the higher quality data are adjusted by the average difference with the lower quality data? The highest quality data should have been used as recorded, and then the lower quality data adjusted to align with the highest quality data.
You are being disingenuous, just like Karl et al.
Yes. I believe we’ve discussed this before. The reason why they adjust the buoy data up instead of the ship data down is because with the former you can apply adjustments with spatially specific values. If they went they other route of adjusting the ship data down they would have to apply a one-size-fits-all adjustment of -0.12 C to all of the ship data regardless of its location because there isn’t enough overlap data in the past to make location specific adjustments. That is more error prone since spatial bias aren’t all -0.12 C . They just average -0.12 C. Remember, when you are stitching two timeseries together it is equally valid to either shift the earlier one up/down or the later one down/up. Your choice does not mean that you are treating the other preferentially since they are both anomalies anyway. But in ERSST’s case there is an added benefit of doing the later. That benefit is that the adjustments can be tuned spatially. That is obviously the better choice and any other reasonable person would choose that option just like Haung et al. did.
“ they would have to apply a one-size-fits-all adjustment of -0.12 C to all of the ship data regardless of its location because there isn’t enough overlap data in the past to make location specific adjustments.”
So instead they make a one-size-fits-all adjustment to the buoy data?
You want your cake and to eat it too! Can’t adjust the ship data based on an average difference but we can adjust the buoy data using the same average difference.
ROFL!!
Convenience over rigor?
That is not true if one is looking for the actual temperature. The point of the Karl et al. excercise was to find a reason to make the hiatus disappear. The way to do that is to introduce warming into the most recent data, which was being derived from buoy data that did not show warming.
It is a shell game where one has to keep their eye on the shuffling of the pea — and hold the feet of apologists to the fire.
The point of Karl et al. 2015 was to update NOAAGlobalTemp to use ERSSTv4 instead of ERSSTv3. Note that the dataset does not have the goal of publishing the actual global average temperature; only the changes. It would be negligent and unethical to choose method #2 when it is known to result in more error than method #1. I guess I’m having a hard time understanding your position here. It sounds like you arguing for method #2 even knowing that it is not as good as method #1. If that’s not what you’re arguing for then by all means clarify your position.
“””Remember, when you are stitching two timeseries together it is equally valid to either shift the earlier one up/down or the later one down/up. “””””
Changing official, recorded data to “stich” time series together is another incorrect rationale for making a LONG RECORD! That is never a reason for changing recorded data.
If it is published as a proposed algorithm researchers can use in their research it is one thing but changing official data is not. Many researchers have neither the time or knowledge to chase down the original data if it is even kept. Your use of the way back machine is illuminating to retrieve old data. Not readily accessible, huh?
It was the typical ploy of trying to create artificially long records by “adjusting” data based on subjective criteria. What *should* have been done is to stop one record and start another. Fudging data with absolutely no actual knowledge of the measurement uncertainty in the past is just a fraud.
And as ARGO became a larger and larger portion of the dataset then the warming trend increases.
The real global temperature profile is the one represented by the regional U.S. chart, below on the left, which shows the Early Twentieth Century (1930’s) to be warmer than today. Other regional temperature charts from around the world show the same temperature profile as the U.S. chart.
The bogus, bastardized Hockey Stick global chart is one the right. It does not show the 1930’s as being warmer than today. This is the way you can tell if you are looking at a bogus, bastardized Hockey Stick Chart: If the Early Twentieth Century doesn’t show to be as warm as today, then you are looking at a big fat lie, a bogus, bastardized Hockey Stick chart.
Have the data mannipulators tell you how they get the chart on the right out of the chart on the left. The chart on the left is the data the Hockey Stick creators used (along with a lot of underhanded tricks), yet the temperature profiles of the two charts look completely different.
One, the U.S. chart, shows no warming since the 1930’s, and demonstrates that CO2 is not the control knob of the atmosphere, while the other, the bogus Hockey Stick chart shows a temperature profile that gets hotter and hotter and hotter, decade after decade, until we are at the warmest temperatures in human history (according to them)
But it’s all a Big Lie. You can’t get a Hockey Stick profile out of data that doesn’t show a Hockey Stick profile, yet the data mannipulators managed to do so. Clever little criminals, aren’t they.
You *know* the first objection you are going to get is that the US isn’t the globe.
The issue with that is that it *is* a significant part of the globe. If it’s temperature is going down from the 30’s then there has to be somewhere else where the temperature is going up by the same amount in order to offset it back to zero.
That “other place” has to be warming even *more* than the US is cooling in order to drive the global average higher. If it was warming the same amount as the US is cooling then you’d just see a flat trend for the globe.
So WHERE on the globe is it warming more than the US is cooling? Central Africa? Australia? China? Europe? Middle East? India?
If the climate models were worth anything they would be able to tell us where all this catastrophic warming is occurring outside the US. But I’ve yet to see it laid out anywhere. If you do a sampling of heating/cooling degree-days around the globe it’s hard to find where the catastrophic warming is occurring. Too many other places are cooling as well as the US. Hard to find places where the cooling degree-day values are going up catastrophically enough to offset the rest let alone drive the global average up!
‘That cannot be taken away otherwise we have no good data.’
One can always refer back to the raw data – I assume they need to keep that, but in these times, who knows?
We are scheduled for spontaneous outbreaks of violence against our useless, corrupt governments, I suspect second half 2023-2025/6.
I see more people agreeing with me, that all government record regarding financial agreements, usurious loans, “consultancy” contracts etc will burn, preventing us from suing the bastards ruining our civilisation now. They will have copies, of course…
I can only speculate on which other organisations will experience sudden, unexplained fires… I cannot see any Mann missing the opportunity.
Not sure about USCRN, but ClimDiv makes changes going back a couple of months. August and November 2022 have both changed, though both are to cooler values from the originals.
nClimDiv makes changes back to the beginning of the record. Anytime an observation is found, digitized, and uploaded to the repository it changes the final computed value. The changes are usually small because the uploads in the distant past are small. But every now and then a large digitization project completes and is uploaded all at once.
All these datasets mean nothing… Just another TOOL that the Owners use to screw modern moron slaves.
I call Betteridge’s Law.
Google: Betteridge’s law of headlines is an adage that states: “Any headline that ends in a question mark can be answered by the word no.”
Now subtract the number you first thought of…..
Of course it will be revised !
The 1998 to 2015 pause was revised away.
The 1940 to 1975 global cooling trend was “disappeared” and that had a range of over 0.5 degrees C, between the coldest and warmest months \between 1940 and 1975. See the first three of 16 average temperature charts at the link below for a view of large “revisions” of that global cooling:
Honest Climate Science and Energy: 16 average temperature charts: The first five show Inconvenient average temperature data are changed at will by goobermint bureaucrat scientists”
Now 1940 to 1975 almost a flat temperature trend.
That global cooling while CO2 increased from 1940 to 1975 allowed a few scientists to get a HUGE amount of attention by predicting a coming global cooling crisis. Which of course was short-lived, because global warming began in 1975.
But the other scientists, expecting global warming (almost all of them) noted that predictions of doom got a lot more media attention than their old scientific studies ever did. In a few years they were spouting wild guess predictions of global warming doom, which were “defined” in the 1979 Charney Roport, famous for the +1.5 to +4.5 degrees C, wild guess CO2 ECS. Which the IPCC defended until just a few years ago and then arbitrarily caged it to +2.5 to +4.0 degrees C,
Jule Gregory Charney – Wikipedia
It looks like the agency advocates and their contract PR team message managers are on the scene.
“Innocent data correction” is an oxymoron, it cannot be both.
If it’s any consolation, UAH over the same period only shows -0.06°C / decade over the same period.
Anyone that is worried about global warming can join me here in eastern Kansas. I just finished plotting Tmax and Tmin data from the Forbes Air Force Base in Topeka since 1953. No trend up or down in either that is distinguishable, something like a slope of 2 x 10^-5. I compared the FAFB temps with my own from 2012 to 2022. The anomaly difference between the data averages about .04 DegK with a mode of 0 and a standard deviation of 2.8 DegK. My data shows the same trend, 0.
I’m not too worried about CAGW here. It just doesn’t seem to be happening.
Wait. I thought quality control of the temperature records was accomplished years ago. Why are they still adjusting?
QC is the only available activity. “Nothing new under the sun”.
Such a small sample.
With interesting characteristics.
It’s not only the trend we should look at but also the temperature values themselves.they have all been adjusted upwards. Look at 2016 for instance: upper panel below 1.00, lower panel, above 1.00.
2015 did get a small adjustment downwards. See chart above your post.
Sure, down at the beginning, up at the end. Clamor about the “trend” from beginning to end. Rinse and repeat.
Wow, look at 2020.
“Is this a mere data correction/adjustment by NOAA or the beginning of something more sinister?”
It’s NOAA, so sinister.
Amazing what crawls out of the woodwork on temperature adjustments.
Cue Stokes et al.
Can we get a stat out of this? I always thought it would be great to be able to say that XX% of global warming since 1850 is because it was colder in the past than it used to be.
If the truth threatens the agenda, the truth must be altered. That is the one unalterable truth about the left.
None of this jiggery pokery with measured dara is necessary here in NZ.
We simply get declarations that ‘climate change is real, it’s here, and there’s no denying it’. End of story. No arguments. No need to provide any data to provide the more sceptical people.
I’m not sure that I’ve _ever_ seen a plot of temperature over time in the local media, although I know we’ve been told to prepare for 1.4m sea level rise, and the ‘doomsday’ glacier gets a mention from time to time (it could go any moment).
Stay tuned?? I’ll have you know Oz is about to suffer the worst heat wave in FOUR years!!
Weather forecast Australia: Fresh heatwave warnings as ‘worst heat in four years’ sweeps across Australia (9news.com.au)
Triple La Ninas tend to do that and how the ancestors ever survived without aircon is one of life’s great mysteries.