By Christopher Monckton of Brenchley
It is now almost two years since we submitted our paper on the central error perpetrated by climatologists in their attempts to derive climate sensitivity to anthropogenic greenhouse-gas forcings – namely, their failure to appreciate that such feedback processes as subsist in the climate system at any given moment must, at that moment, necessarily respond equally to each Kelvin of the entire reference temperature. Feedbacks do not, repeat not, respond solely to perturbation signals, the reference sensitivities. They also respond to the base signal, the emission temperature that would prevail even if there were no greenhouse gases in the air, because the Sun is shining. Yet one of the world’s most eminent climatologists reflected the error that is near-universal throughout his trade when after several days’ fencing, he answered a direct question from me by admitting he did not consider there was any feedback response to emission temperature.
The diagram below shows the two competing methods, as they apply to 1850. Method (a), in red, is the incomplete method that led climatologists into error. Method (b), in green, is the complete and correct method, which takes due account of the fact that the Sun is shining.
It is necessary to follow the latter method because the base signal, the 260 K emission temperature R0 (shown in sunshine yellow in the corrected diagram but omitted from the defective diagram), is about 30 times the 8 K reference sensitivity ΔR0 to (or direct warming by) the naturally-occurring, noncondensing greenhouse gases that were present in the preindustrial atmosphere of 1850. Then R1, the sum of R0 and ΔR0, is the entire input or reference signal as it stood in 1850. That year is of interest because there was then a temperature equilibrium: there would be no temperature trend for 80 years thereafter.

The feedback response to emission temperature R0 is B0. Likewise, the feedback response to ΔR0 is ΔB0. The feedback response to the entire input signal R1 in 1850 is thus B1. The differential feedback fraction or closed-loop gain factor h is the fraction of the uncorrected output signal, equilibrium sensitivity ΔE0, represented by the feedback response ΔB0. Likewise, the absolute closed-loop gain H is the fraction of the corrected output signal, equilibrium temperature E1, represented by the total feedback response B1.
Let us ask the computer to do a more sophisticated energy-budget calculation than the much-simplified version I showed earlier this month, and let it show its working:

We begin in 1850 by calculating the forcings by the principal naturally-occurring greenhouse-gas species in 1850. The data are from Meinshausen et al. (2017); the formulae are from IPCC (2007, table 6.2). The advantage of these particular formulae is that they were designed to permit calculation of forcings from zero rather than from some arbitrary concentration greater than zero. The forcings to 1850, therefore, work out at 25.3 Watts per square meter.
Next, midrange initial conditions are specified. All are standard, but for two. First, the aerosol adjustment of 0.6 Watts per square meter corrects IPCC’s excessively negative aerosol forcing to take account of a substantial body of literature on the subject. Professor Lindzen is on public record as having stated that the strongly negative aerosol forcing adopted in the models is a fudge factor calculated artificially to exaggerate climate sensitivities.
Secondly, the anthropogenic fraction M of total greenhouse-gas forcing is taken as 0.9. In reality, one might deduce by weighting the entries in table 2 in Wu et al. (2019) by reference to the relevant period lengths that, of the total period forcing of 0.96 W m–2, 0.71 W m–2 was anthropogenic and 0.25 W m–2 was natural. On that basis, some 73.5% of the forcing over the period was anthropogenic. However, we have cautiously assumed that as much as 90% of the forcing was anthropogenic.
The emission temperature is then derived via the Stefan-Boltzmann equation. Note, however, that, as is regrettably customary in climatology, no account is taken of the fact that if there were no greenhouse gases in the air there would be no clouds, so that the albedo would be half the standard value used here, and the emission temperature – even after allowing for Hoelder’s inequalities, which climatologists generally ignore – would be well above 260 K. Indeed, Professor Lindzen has estimated 271 K, in which event ECS would be a great deal less than is shown here.
It is then shown that the system-gain factor in 1850, the ratio A1 of equilibrium temperature E1 to reference temperature R1 in that year, was 1.0764, implying that – if the feedback regime has not changed since 1850 (which the le Chatellier principle and the minuscule warming since then would lead us to expect, and which climatologists implicitly assume) – equilibrium doubled-CO2 sensitivity is only 1.1 K. By the incorrect method, the system-gain factor erroneously expressed as the ratio a1 of equilibrium to reference sensitivities would be 3.712, leading us to expect 3.9 K ECS.
How do we know that this is the mistake that climatologists have made? The reason is simple. Some 15 years ago I wrote to Sir John Houghton, then chairman of IPCC’s climate “science” panel, and asked him why, given that direct warming by doubled CO2 in the air was little more than 1 K, it was imagined that final warming was 3 or 4 K. Sir John replied that the total natural greenhouse effect in 1850 was 32 K, and reference sensitivity to naturally-occurring greenhouse gases was about 8 K. Therefore, he said, the system-gain factor was about 4 and, therefore, ECS would be of order 4 K. Similar sentiments are expressed in numerous IPCC documents and peer-reviewed papers on climate sensitivity.
Next, it is necessary to conduct an energy-budget experiment for the period 1850-2022. Here, the objective is to see whether, using midrange, mainstream data throughout, the system-gain factor A2 in 2022 differs significantly from the system-gain factor A1 = 1.0764 obtained from the data for 1850. In fact, on the basis of the mainstream, midrange data shown, the two turn out to be identical. The feedback regime, then, has not changed with the increase of a mere 0.35% in global mean surface temperature since 1850. Not much of a surprise there.
A note of caution. Precisely because – whether climatologists like it or not or admit it or not – the feedbacks present at any given moment respond to the entire input signal, including the enormous 260 K sunshine temperature, even a very small change in the feedback regime would potentially lead to a very large change in global mean surface temperature, since the elevated feedback strength must act on the entire reference temperature including the dominant sunshine temperature, and not merely on the paltry reference sensitivities.
A further note of caution: the data and hence the climate sensitivities can be readily tweaked in any desired direction. For instance, IPCC has changed the midrange values and bounds of the underlying data time and again (for instance, it has raised the midrange estimate of the doubled-CO2 forcing from the mean 3.52 W m–2 in the CMIP6 models to 3.93 K, an increase
breaching the long-established ±10% bounds).
Precisely because small changes in the underlying data affect the feedback strength and hence the system-gain factor, and because the system-gain factor applies not only to anthropogenic reference sensitivity but to the entire input signal, including the emission temperature, it is simply not possible to constrain ECS by diagnosis of feedback strengths from the models’ outputs. Therefore, the notion that the high ECS predicted on the basis of such diagnoses represents “settled science” signifieth even less than the twattling of crickets outside my window here in stone-age Gozo.
Even the simple energy-balance method used by our computer is prone to this defect. Why, then, can we rule out the notion of a large change in the feedback regime since 1850? The reason is a practical one. If there had indeed been a major departure from the feedback regime as it stood in 1850 the warming since 1990 would not be – as it is – two and a half times less than what IPCC had confidently but misguidedly predicted in that year.
That is why the long Pauses in global temperature at a time when anthropogenic forcings are continuing to increase in a straight line are so significant. They provide a visual indication that global warming is not, after all, happening at anything like the originally-predicted rate, and that, therefore, there has been no change to speak of in the feedback regime.
Now, critics have commented that if one were to apply the actual changes in forcing since 1850 to IPCC’s diagrams showing predicted forcings for individual greenhouse gases from 1990, IPCC’s predictions would have been proven correct. One obvious problem with that: if the outturn in forcings since 1990 has proven to be so very much less than IPCC’s business-as-usual predictions in that year, why does IPCC continue to predict two and a half times as much warming as the outturn in forcings would lead us to expect?
Another favorite objection among critics, is that we have been guilty of illegitimate “extrapolation”. However, it should be apparent from the above calculation that there is no “extrapolation” in it at all.
It is climatologists, not we, who insisted that ECS was about 3-4 K on the basis of the data for 1850 and that it is still 3-4 K today on the basis of the data since 1850. The energy-budget method we have used does not rely upon extrapolation at all. One would not expect much, if any, change in the feedback regime given a mere 0.35% increase in absolute global mean surface temperature; and the above calculation shows that, using mainstream, midrange values, there may well have been no change at all in the system-gain factor from 1850-2022, so that ECS is of order 1.1 K.
A recent postercited four climatologists as disagreeing with us. But none of the climatologists in question has read our paper. None has any particular knowledge of control theory (any more than the poster does). Two could not even be brought to admit that there is any feedback response to emission temperature at all (Hint: there is: get used to it). The other two are not on record as having commented on our result at all. If our paper were as easy to refute as the poster suggests, it would not still be sitting before the editor of a leading climate journal, marked as “With Editor” on the editorial-management site, almost two full years after it was submitted. If it were defective, it would simply have been thrown back at us, and it has not been. Go figure.
Why does any of this matter? It matters because, if we are right, two important scientific conclusions follow. First, by the energy-budget method it is possible to demonstrate that, using mainstream, midrange data, ECS is likely to be as little as 1.1 K, and is necessarily as little as that if one adopts climatology’s own not unreasonable assumption (critics would call it an “extrapolation”) that the feedback regime has not changed since 1850.
Secondly, once the extreme sensitivity of ECS to very small changes in the feedback regime is properly understood – as it is not at present understood in climatology – it becomes immediately self-evident that models’ outputs provide no basis whatsoever for deriving ECS values any better than guesswork, because the data uncertainties exceed the very narrow interval of system-gain factors that would allow reasonable constraint of ECS.
Those conclusions matter because, as paper after paper has demonstrated, the energy-budget method suggests that ECS is a lot smaller than IPCC et hoc genus omne find it expedient to admit. Previously, climatologists have dealt with the low sensitivities found by the energy-budget method by declaring that the models’ outputs are more sophisticated and that, therefore, diagnoses of feedback strength and consequently of ECS therefrom are to be preferred. Our paper puts paid to that illusion. Just as Pat Frank has already demonstrated, the models’ predictions of future global warming are no better than rolling dice. Our results confirm his in spades, but by the distinct method of demonstrating the extreme sensitivity of all such predictions to very small perturbations in the feedback regime.
Let us end, then, by updating the estimate of just how little global warming would be abated even if the whole world went to net-zero emissions – which it won’t, since 70% of all new emissions are from so-called “developing” nations such as China and India, that are exempt from any legal obligation under the various climate treaties to reduce their emissions. Indeed, China has recently and sensibly proposed to build hundreds of new coal-fired power stations.
But let us pretend the world will actually reach net zero emissions by 2050. A first-order assessment of the “benefits” and costs of this questionable achievement is on the back of the envelope below –

In the past three decades, there has been 1 W m–2 anthropogenic greenhouse-gas forcing, arising in a near-straight line at 1/30 W m–2 per year –

Despite all the waffle at successive conferences of the parties to the framework convention on climate change, and despite the trillions already squandered by Western nations on emissions reduction, that straight line shows no flicker of a downturn. Thus, only half a Watt per square meter would be abated by 2050 even if the whole world moved in a straight line from here to net zero by that year – which it won’t, since 70% of the world is moving in a straight line in the opposite direction, and the remaining 30% are finding it a lot more difficult and expensive to attain net zero than they had originally pretended.
Now, let us imagine that IPCC is correct in its midrange estimate that there would be 3 K ECS in response to 4 K effective doubled-CO2 forcing and that, therefore, there should have been at least twice as much warming since 1990 as there has been in the mere real world of which the modelers have proven so contemptuous. If so, abating half a unit of forcing, which is all that would be abated by 2050 even if all the world got serious about net-zero emissions, would abate a whoppingly pathetic 3/8 K global warming by 2050. And that is little more than 0.1% of the prevailing absolute global mean surface temperature.
However, according to McKinsey Consulting, the capital cost alone of attaining global net zero would be £275,000 billion. And that estimate was made before the recent price hikes in energy, whose root cause was the West’s foolish insistence on shuttering coal-fired power stations generating power at $30 per MWh and replacing them with unreliables at many times that unit cost, to say nothing of the tenfold hike in Siberian gas prices that allows the Kremlin to profiteer handsomely for as long as it can keep its special military operation going in Ukraine, sanctions or no sanctions.
Our intelligence assessment is that if Moscow can keep the war running it will have made so much money from the order-of-magnitude price hikes in gas, oil, grain, nickel, cobalt, copper, lithium and other raw materials that have long been the chief earner of its resource-based economy that Mr Putin, who has a pathological (and legitimate) fear of national debt, will be able to pay down the entire Russian national debt in just two years. He has already reduced it to about 25% of annual GDP, one of the lowest rates in the world. He is aiming not for net-zero emissions (his academy of sciences has told him he need not worry about that) but for net-zero national debt. Despite the recent setback for his forces in Ukraine, it is not at all clear that he will fail in that legitimate ambition.
Let us ride with IPCC’s “mainstream” midrange estimate that each unit of forcing abated will reduce global temperature by 3/4 K. Divide the 3/8 K that would be abated up to 2050 by the half-unit abatement of forcing if the world actually went to net zero by the $275,000 billion cost of attaining net zero, and the amount of global warming abated by each $1 billion squandered on net-zero emissions would be – wait for it – less than 1/700,000 K.
Less than one seven-hundred-thousandth of a degree per $1 billion slung down the gurgler. Not exactly good value for money – indeed, it would be the worst value for money in the history of global taxation.
But now factor in the following facts. In consequence of the Ukraine war, compounded by the idiocy of governments in grossly and inefficiently interfering in the free market in energy supply by forcibly shuttering coal-fired plants and replacing them with costly unreliables, the capital cost of attaining net zero will now be many times greater than McKinseys had imagined. What is more, the current-account costs of attaining net zero, which were not included in McKinseys’ estimate, will be no less than the capital cost. Indeed, in the UK the grid authority has estimated that to achieve net zero by 2050 would cost $3,000 billion just to re-engineer the electricity grid.
One must also factor in the cost of installing enough charging-points for electric buggies, which would increase electricity demand by 70% in the UK alone. And where are the nickel, cobalt, copper and lithium for the batteries going to come from? Oh, yes, from Russia and China, whose propagandists have been undermining the West’s capacity for rational thought on this issue for decades. Putin is already laughing all the way to the Moscow Narodny Bank. Now imagine how much more he and his Communist soulmate Xi Tsin-Ping will have to laugh about when the following fact is borne in mind. If Britain alone were to replace all its real cars with electric buggies, the batteries would consume twice the world’s annual output of cobalt and almost all its output of lithium. As other Western nations idiotically follow similar lunatic policies, the price of the rare metals that make up the batteries in the buggies is bound to increase by another order of magnitude. We are looking to store some lithium carbonate in our shed and then wait five years before cashing in as billionaires.
After taking these facts into account, and after bearing in mind that ECS is not 3 K but 1.1 K at midrange, the true warming abated by each $1 billion spent on chasing the chimera of net zero emissions could be as little as one five-millionth to one ten-millionth of a degree.
Now, even if we were indeed facing the near-certainty of ECS at 3 or 4 K that the climatologists profitably imagine (and which Professor Lindzen says would be net-harmless even if it were to occur), it could not be reasonably argued that such large expenditures for such infinitesimal returns are in any degree justifiable.
Yet our result shows that official climatology’s conclusions, based as they are on the outputs of general-circulation models, are mere guesswork. They do not in any degree warrant or justify any action whatsoever to abate global warming.
On the basis of climatology’s own implicit assumption that the total feedback strength, denominated in Watts for each Kelvin of reference temperature, that obtained in 1850 also obtains today, it is proven that ECS will be only of order 1.1 K. The critics who accuse us of wrongful “extrapolation” should, therefore, address their concerns not to us but to official climatology.
Put the scientific case and the economic case together and the correct policy option is to ignore the far-Left critics, stop subsidizing unreliables, shutter the IPCC, abolish the UNFCCC, silence the costly conferences of the parties, unshutter coal-fired power stations and bring to an end the long-planned and now imminent economic hara-kiri of the West that the climate activists and those behind them have so long, and so dishonestly fostered.
NOTE FROM ANTHONY: Over the past months, there has been a running duel of back and forth postings from Joe Born vs. Christopher Monckton over this topic. Everything that could be said, has been said. Some of it has been said multiple times. I don’t agree with all the opinions expressed, but I have given both sides a fair airing of points and greivances.
This is not the Festivus channel.
Because both authors have submitted manuscripts with highly charged language, it has become a burden to edit them for publication. Therefore, this will be the very last posting on this topic from either author. Since Mr. Monckton is a long-time friend and supporter of WUWT, I’m giving him the last word on this contentious topic.
-Anthony
The first figure here shows the wrongness of the thinking here. It isn’t even wrongness about feedback, but the basic concepts of signal and amplification. Here is the figure again:
The left is conventional. Suppose ΔR₀ is zero – no input signal. Then as expected ΔE₀ is zero. No input, no output.
But on the right, the input is said to be R₀, and the output E₁. That is in the absence of anything changing. It is said to be affected in some way by feedback, but what does that mean? In electrical terms, it is just describing the operating point of the amplifier. The bias, DC state etc. It isn’t signal in any meaningful sense. It is the rest state. If it isn’t resting, in the case of zero input change, then there is a serious problem.
If the author had expanded E₁ as E₀ + ΔE₀, then the true state of affairs would be clear. The Δ parts are still related, the constant parts just express a different operating point. It is still a linear amplifier on the true signal, just differently described.
“The left is conventional. Suppose ΔR₀ is zero – no input signal. Then as expected ΔE₀ is zero. No input, no output.”
No change in input, no change in output. Green is saying “No input, then no output”
I don’t understand how you can write as if you are on top of things when so clueless.
“ Green is saying “No input, then no output””
No, it’s saying that you always have input R₀, which might then be perturbed, He later equates it to reference temperature (“sun is shining”). And you get always output E₀ (equilibrium temperature), which again might be perturbed.
But these are just state variables, like the steady DC voltages in an amplifier. You drop them when talking about signal amplification. That is all, about what happens to perturbations.
In an amplifier the peturbations are filtered out using a capacitor.
I’ve looked but I can’t find a sky capacitor anywhere.
The whole concept of amplification of just the peturbations is flawed.
BTW if the filter capacitor in an amplifier goes hard down then the entire voltage is amplified and goes pffftttzzz and blows the fuse or avalanches to the maximum power available.
I reckon any Sky Capacitor would be Electrolytic with a high leakage current and high Q-Factor
“In an amplifier the peturbations are filtered out using a capacitor.”
Then what is left to amplify?
In fact the DC is blocked with a capacitor, which passes the signal (perturbations).
Show a text that indicates op amp circuitry requires a coupling capacitor, Nitpick.
Control systems analysis doesn’t just apply to electronic circuits. For instance, in mechanical systems, we have mass, dashpot, and spring. link
For the climate, there is no sky capacitor but there is the huge heat storage of the ocean.
In any event, maybe for the last time, but I doubt it, feedback analysis doesn’t apply to the climate because it isn’t an LTI (Linear Time-Invariant) system. If I remember correctly, Joe Born insisted that he had a textbook that dealt with non-LTI feedback analysis. I asked for a citation and none was produced.
As far as I can tell, the only way to apply feedback analysis to non-LTI systems is to use it in a regime where you know for sure that the system closely approximates LTI. Given the recent greening of the globe, I think we know for sure that the climate does not approximate LTI.
What Monckton has done is to demonstrate that, even if feedback analysis were a valid approach, Hansen did it wrong in a very significant way.
CommieBob is mostly correct. Climatology uses feedback formulism in an attempt to justify its multiplying direct greenhouse-gas warming by about 4 to obtain final or equilibrium warming. Feedback theory is of universal applicability to all feedback-moderated dynamical systems, such as the climate.
We know that feedback processes are at work in the climate system because in 1850 the reference or pre-feedback temperature was the 263 K sum of the 255 K emission temperature plus the direct warming of 8 K by naturally-occurring, non-condensing greenhouse gases, and yet the observed temperature was the 287 K sum of the 255 K emission temperature and the 32 K entire natural greenhouse effect. The 24 K difference between 287 K and 263 K is entirely accounted for by temperature feedback.
The question is: feedback to what? Climatology, in paper after paper, says that the system-gain factor is 32 / 8, or 4, when the corrected system-gain factor for 1850 is (255+32) / (255+8), or less than 1.1.
“We know that feedback processes are at work in the climate system because in 1850 the reference or pre-feedback temperature was the 263 K sum of the 255 K”
Baloney Alert
A global average temperature for 1850 does not exist. At best it is a wild guess. At the time, there were mainly land weather stations in the US, Europe and Eastern Australia. Ocean measurements were haphazard, with buckets and thermometers, and mainly in Northern Hemisphere sea lanes.
There is no way that the minimal, inaccurate data from 1850, or at any time before 1900, can be used to estimate a global average temperature that’s better than a wild guess. Science is not based on wild guesses. Monckton’s claims that based on numbers from !850 (or any numbers pre-1900) are meaningless.
But they are not Moncktons claims, which is the beauty of his argument. They are the claims of the climate alarmists. By accepting those claims and showing the mis-application of control theory on them, he destroys their entire argument of their derived value of climate sensitivity.
Whether you think he has accomplished that or not is the current argument, not the numbers you don’t believe exist.
The climate alarmists destroyed their own arguments by 50+ years of wrong predictions of a coming climate criss that never showed up !
This ^
nope
The Lord High Mosher has spoken: debate no more!
Give it a rest Mosher! Nobody here thinks as highly of yourself as you do. If you have an argument to support your opinion, present it. Nobody is going to accept a single word as the final word — even from you.
Yep
Yup
“A global average temperature for 1850 does not exist. ”
It doesn’t even matter for Monckton’s case what the actual temperature was. It could have been a degree or two warmer or colder, you will still get pretty much the same feedback ratio, and end up with a similar estimate for ECS.
A global average temperature for 1850 does not exist. At best it is a wild guess.
A global average temperature during the LIA does not exist. At best it is a wild guess.
hence its not any warmer now
Hockey stick 😉
Hokey stick.
We do have three Central England weather stations that show over +2 degrees C. warming since the cold 1690s
We also have local climate proxies.
All suggest global warming since the late 1600s Maunder Minimum period. None suggest global cooling since that period.
But most of the warming since the cold 1690s occurred in the 40 years 1694-1733, as solar activity recovered after the Maunder minimum. England warmed over those 40 years at a rate equivalent to 4.33 K/century. No such rate has been seen in the Central England record since then. All those Jacobean and Georgian SUVs, one supposes.
“But most of the warming since the cold 1690s occurred in the 40 years 1694-1733, as solar activity recovered after the Maunder minimum.”
More highly selective, and wrong, analysis.
First off, it ignores the highly uncertain nature of CET in the 17th and early 18th century, and the large variability in general.
Secondly, it only looks at the trend over a cherry-picked period, and gets it wrong. As I’ve pointed out to Monckton before, you should not calculate a trend on highly seasonal data. Using annual data the trend over that period is 4.0 ± 1.3°C / century. Uncertainty interval based on a 2 sigma value, with no correction for auto-correlation.
Of course he’s looked at every 40 year period and chosen the one that gives him the fastest rate of warming.
Thirdly, he ignores the first 30 years of CET data, and starts at an abnormally cold decade.
Fourthly, he ignores the fact that after after the 1740s temperatures fell back and remained relevantly flat until the end of the 19th century. Claiming the 1730 warm spike as representing most of the warming is misleading.
I think you can get a much better understanding of the the history of CET looking at 30 year averages, rather than arbitrary trend lines.
To put some (over precise) figures on this.
First 30 years
8.81°C (1661 – 1690)
Coldest point, including the extremely cold 1690’s
8.45°C (1672-1701)
High point of the early 18th century (Moncktons “most of the warming”)
9.44°C (1720 – 1739)
After that for 150 years temperatures fluctuated between
8.98°C and 9.27°C.
The mid-20th century peak
9.63°C (1932-1961)
Falls back to
9.41 (1952 – 1981)
Most recent 30 years
10.23°C (1992-2021)
Current temperatures are 0.79°C above the early 18th century peak, 1.42°C above the start of CET, and 1.78°C above the coldest 30 years.
Monckton’s “most of the warming” peak is 0.63°C warmer than the start, and 0.99°C above the coldest point.
So yes, you could say there was slightly more warming from trough to peak in the early 18th century than there was from peak to peak over the next 300 years. But I think that’s misleading. It ignores all the other ups and downs, and starts at very low point.
You never bothered to learn anything about forecasting when we discussed it before, did you?
In forecasting, recent data carries far more weight than past data. You are stuck in the box that only linear regression over long periods of time are meaningful.
If you had ever run a hardware store and had to maintain inventory you would understand that how many shovels you sold 40 years ago has little bearing on how many shovels you will sell next year, The current sales of shovels carries far more weight for next year than the sales from 40 years ago.
It’s the same with temperature. Current trends carry far more weight that trends from the past. You are stuck in the box of Argument by Tradition and you can’t seem to punch your way out.
“In forecasting, recent data carries far more weight than past data. You are stuck in the box that only linear regression over long periods of time are meaningful.”
That’s the opposite of what I’m saying. Monckton is the one obsessed with the trend in the 18th century. I’m saying the warming over the last 50 or 100 years is a better indicator of what’s happening.
And my main point is that linear regressions over something like CET are pretty meaningless considering the huge variance in year to year temperature and short term trends.
Again, you seem to be attacking Monckton here. He’s the one who mentions the cherry picked 1694-1733 period as having some meaning.
“how many shovels you sold 40 years ago has little bearing on how many shovels you will sell next year”
Which is why I don’t expect temperatures next year to be the same as they were 40 years ago.
“Current trends carry far more weight that trends from the past.”
So you keep saying, but you never actually tell us what your predictions, or see how your, weight current trends strategy would have worked out over previous periods.
How do you determine what current trend you are using? Is it the last 8 years, where there’s been a small negative trend, or the last 10 years where there’s been a warming rate of 0.2°C / decade? Or the last 11 years where the trend has been 0.3°C / decade? How do you know that 11 years is too long but 8 years is just right?
“You are stuck in the box of Argument by Tradition and you can’t seem to punch your way out.”
You really need to learn what these fallacies actually mean.
I can give you an example from real life experience in business. One of the things I was responsible for was forecasting call volumes for telephone switches and operator requirements on an hourly basis. Forecasting those call volumes used weighted volumes from past data. Yesterday’s volume was highest weighting, then last week’s same day, last year’s volume smaller yet and further past was weighted least.
Forecasting for a two year period was done using similar type algorithms but also included many items like projected plat developments, population and business growth, etc.
Now, I realize that this example doesn’t necessarily involve long cyclical phenomena. Seasonal is about as long a cycle as there was. But, the fact remains that past growth was not as important as current growth. Temperature is not that much different. The current pause in growth is indicative of an ongoing pause in growth, at least for the near term. It also is indicative of the fact that at the very least, natural variation is a substantial factor in temperature not withstanding what CO2 growth will do.
So, there was a LIA?
And we are not in it anymore, are we?
When alarmists wet their panties over 1.5 warming since “pre-industrial times”, what they really mean is “since the LIA conditions prevailed.”
I for one am damn glad we are no longer suffering through the coldest period in the past 12,000 years.
That exactly applies to modern times.
Worse, in fact, because of the badly adjusted/sited/uncertified temperature stations, the modern “wild guess” is overbaked with climate fiddling and shenanigans!
Mr Mosher knows nothing about climatology. If he knew anything, he would know that the HadCRUT global surface temperature anomaly dataset has been kept since 1850, and that, unlike the other datasets, it routinely publishes its uncertainty interval. Ir Mr Mosher wishes to argue inexpertly that the uncertainty interval is inappropriate, let him take the matter up with the keepers of the dataset. Don’t whine here.
Sometimes even an order of magnitude estimate can be useful to establish bounds on a variable. Just don’t try to pretend that several significant figures are justified.
If Mr Greene wishes to challenge the uncertainty interval for 1850 in the HadCRUT temperature record, then there is no point in whining at me about it. Let him direct his whingeing at the keepers of that dataset and tell them their job.
If he had any mathematical competence, he would in any event have realizes that our analysis is very little affected by the precise value of temperature at the equilibrium in 1850.
Dividing temperatures yields a meaningless number. Dividing the powers creating those temperatures would have meaning.
nope
Mr. Mosher, someone has hijacked your account and started giving monosyllabic responses in an attempt to make you look like a moron.
Don’t whine.
. Feedback theory is of universal applicability to all feedback-moderated dynamical systems, such as the climate.
mere assertion
EEs have made a hash out of discussing climate feedback.
this essay just sprays more black ink into the water
Mr Mosher, like all the climate Communists, is becoming desperate as our result takes hold. Otherwise he would not attempt to assert that feedback theory is inapplicable to the climate. If it is inapplicable, then ECS is less than 1.1 K, and not the 4 K that the models currently imagine on the basis of – er – feedback analysis of the dynamical system moderated by feedback that we call the climate.
Mosher is just complaining about using a method of analysis that was proposed by Hansen to evaluate the models. I suspect he is unable to assess the program (think spaghetti code) to find where the feedback is occuring. I don’t doubt that it is “hidden” amongst various routines, but I’ll guarantee that it exists.
That ink is impenetrable to you isn’t it? To us EE’s, it is the nectar of life. We live and die by it’s quality.
Don’t expound on what you dont know! BTW, feedback theory is more applicable to many things that you also don’t understand. Governor’s on motors, electrical, steam, and ICE. Airplane control surfaces. Lots of others. Look at a modern ICE, think of the O2 sensors, knock sensors, crankshaft position sensors, mass air flow sensors, etc. These are all feedbacks to a computer running an engine. Do you think that Bode and control theory as taught in EE curriculum doesn’t apply?
And Stokes and Born still don’t understand what a summation node indicates.
Climatology uses feedback formulism in an attempt to justify its multiplying direct greenhouse-gas warming by about 4 to obtain final or equilibrium warming.
nope. nowhere. this misquotes hansen and makes a hash of his abortiive attempt to apply control theory to climate.
where feedbacks are entirely different in character from the input signals.
If there is no power supply to an amplifier there can be no amplification.
That means any feedback power is subtracted from the actual input power. P_out = P_in – P_feedback becomes the actual output.
Anything else implies a perpetual motion machine.
Before anyone says the sun is the power supply, the sun is the INPUT. It can’t be both the input and the power supply for an amplifier.
For feedback theory Hansen et al 1984 cited Bode’s 1945 book.
That book was based on vacuum tubes. I haven’t read the whole thing but, as far as I can tell, it didn’t make the input reference voltage explicit. (That said, differential amplifiers do exist in vacuum tube form.) Also, as far as I can tell, it deals with small signals and ignores energy conservation.
By 1984 there were many good undergrad control systems texts that might have saved Hansen from his grievous errors. But that would be mere engineering and apparently beneath his dignity. 🙂
btw: Control theory had its mathematical basis in Maxwell’s analysis of centrifugal governors for steam engines. link That was, of course, long before the invention of the electronic amplifier.
I sincerely doubt Nick has ever seen a working steam engine let alone have its operation explained to him.
nice attack, for a 5th grader.look you cant hold a candle to nick
Lol…says the one word attack dog.
Who you are does not matter a whit in science.
All that matters is what is correct and what is wrong.
You guys and your disproven not-even-a-clearly-enunciated-hypothesis are wrong.
Tell that to you-know-who:
<blockquote>
Pat Frank’s paper remains unrefuted in the peer-reviewed journals. Before publication, it was reviewed by Professor Wunsch. He knows what he is talking about, and is willing to be fair, while the two bloggers mentioned […] have no credibility whatsoever.
</blockquote>
https://www.drroyspencer.com/2022/10/lord-monckton-responds-to-spencers-critique/#comment-1375544
Perhaps I should have said who-cares-who.
Pat Frank’s paper remains unrefuted in the peer-reviewed journals. Instead of whining inexpertly and futilely here, the furtively anonymous “Willard” may care to try to write a paper trying to trash Pat’s result, and submit it for peer review.
This Willard identity is a rat, and the selected label/handle is quite appropriate.
> This Willard identity is a rat, and the selected label/handle is quite appropriate.
The rats in the movie are not named Willard, Monte.
Is there anything you can get straight?
Don’t whine.
Sometimes the truth hurts. Have YOU ever been around a working steam engine? Part of learning about the real world is actually experiencing the real world. It’s where good “engineering judgement” comes from.
Please stop whining, Tim.
Are you related with Jim by any chance?
Ahhh! The truth *DID* hurt you! I’m not surprised!
Who cares about who I am related to? What difference would it make anyway?
This lamer goes around trying to dox people who disagree with Stokes & Co.
Still here, Monte?
Has your confirmation ever failed you, Xim?
Nick think in terms of DC amplifiers. The set point input voltages matter as well as any delta.
Op amp circuits don’t require coupling capacitors, you vast education has failed you again.
Anyone that thinks the atmospheric climate feedback can be modeled WITHOUT a huge capacitor.. is not paying any attention to reality. !
That capacitor can be seen quite effectively by tracking the temperature curve after sunset. It is every exponential with the decay factor determined by the resistance it is discharging through (i.e. the atmosphere). The higher the resistance the slower the discharge – meaning higher Tmin values once the cycle starts over the next day. During the day the capacitor just charges to the power supply voltage, i.e. the sun, that’s all the higher it can go so you don’t see much impact on Tmax.
That means that when the temps went so high during the 30’s something drove that to happen – but it most likely wasn’t CO2 or we wouldn’t have seen cooling in the following decades.
of course it can. look climate models do not implement feedbacks directly.
NONE of you have looked at actual models
All those models…settled science indeed.
Someone is going through and giving Mosh upvotes! Amusing.
well if youre going to argue that climate models do feedbacks wrong
evidence would be looking at a damn model
Mr Mosher, in his desperation to uphold the Communist party line on the climate question, has made even more of a fool of himself than usual. A little up
Mr Mosher, in his desperation to uphold the Communist party line on the climate question, has made even more of a fool of himself than usual. A little upthread, he says, correctly but pointlessly, that models do not directly implement feedback formulism. Now he talks about whether one can argue that “climate models do feedbacks wrong”. Bah!
Mr Mosher imagines that we do not realize the models do not implement feedback formulism directly. In fact, they do not implement it at all. Feedback strengths, and consequently ECS, are diagnosed from the models’ outputs in accordance with the methods described e.g. in Soden & Held (2006) or Vial (2013).
However, feedback analysis may be used as a yardstick to assess the plausibility of such diagnoses, and that is what our paper does. We find the diagnoses, and consequently all ECS predictions, to be no better than mere guesswork.
There is certainly insufficient evidence to pretend that there is a “climate emergency”.
That is the whole point isn’t it, to make accurate predictions? Models run hot, even the IPCC knows that. That means the ECS that “emerges” from the calculations must be wrong! There can be no other conclusion. If ECS is a legitimate “thing”, evaluating it by other means is possible. A difference indicates something is not kosher with what it is claimed to be.
Hansen and others invited the evaluation of temperature rise due to feedback. It is a proper scientific enterprise to evaluate any hypothesis for accuracy and correctness. The fact that models do or don’t use feedback is truly irrelevant.
OTH, a high ECS indicates some feedback is occuring in the models whether Bode math is being used diectly or some other calculations are taking it’s place. Even though Mosher proclaims otherwise, he can’t escape the fingerprint of feedback occurring at points in the model’s calculations.
Look Ma, no capacitors!
“But these are just state variables, like the steady DC voltages in an amplifier. You drop them when talking about signal amplification. That is all, about what happens to perturbations.”
You do not make that point when you write “No change in input. No change in output”
If you are clearer about input being an oscillation in Ro, then people can go “WTF?”. Ro is analogous to a steady-state DC voltage and ΔR₀ is analogous to a frequency input???
Amplitude of …
“ If it isn’t resting, in the case of zero input change, then there is a serious problem.”
Hahah, do you actually read the stuff you write?
The ever-partisan Mr Stokes is, as usual, wrong. First, one might say, with Gauss, non notatio, sed notio. Of course the equilibrium temperature E1 in 1850 is the sum of the equilibrium responses E0 to emission temperature and dE0 to the directly-forced warming by the preindustrial noncondensing greenhouse gases. That is implicit, though not explicit, in the diagram.
More seriously, Mr Stokes fails to appreciate that the diagram may stand not only for a linear amplifier but also for a nonlinear amplifier at a particular moment.
His lack of elementary knowledge of control theory is also evident in his failure to grasp that in a feedback-moderated dynamical system in a state of equilibrium, as the climate was in 1850 (there would be no trend in global temperature for 80 years thereafter), there is indeed what, in his unscientific way, he clumsily calls “the absence of anything changing”. For the changes wrought by feedback have already occurred.
As often, his aim appears to be to sow confusion. It is likely that he understands full well the simple point being made, and knows perfectly well that it is sound, but finds it uncongenial to admit that fact, which demonstrates the Party Line on climate to be erroneous.
“His lack of elementary knowledge of control theory…”
OK, here is a real simple transistor feedback amplifier. I’ve marked it with AC voltages; normally you just assume that there are separate bias arrangements to set the DC operating point, which you don’t need to know about for feedback performance. But you can run it as shown with say, V=10 V as the steady supply; the bias won’t be optimised, but it can be made to work. The base voltage (shown as V=0), and so the steady part of Vin, will be about 0.6V for a silicon NPN transistor. The steady part of Vout will probably be set at about 5V (midrange).
Now you would say that the whole input is 0.6+perturbation, and the gain is 5/0.6, or about 8. That is your E1/R1, and it is nonsense. That ratio has nothing to do with the true gain of the amplifier. Those voltages are just what you choose as an operating point. The gain is the ratio of perturbations.
Mr Stokes again deliberately obfuscates a simple issue. Like it or not, at any given moment the feedback processes then extant must necessarily respond equally to each unit of the entire reference signal, and not merely to each unit of the perturbation signal. Since the base signal – in climate the emission temperature – comprises 97% of the reference signal, Hansen and many others thereafter were incorrect in assuming that feedback responded only to the 3% of the reference signal represented by natural and anthropogenic reference sensitivities. They were wrong to assume that, therefore, based on the data for 1850, there would be 4 K equilibrium sensitivity in response to 1 K directly-forced warming by doubled CO2.
Several of our co-authors are control theorists of more than usual integrity as well as competence. To them it is no less natural to express the system-gain factor as the ratio of the entire equilibrium signal to the entire reference signal as it is to Mr Stokes to express it as the ratio of perturbations only. In the climate, precisely because the base signal is so very large as a fraction of the entire reference signal, it cannot be ignored in the manner in which climatologists have ignored it.
Once it is realized that the Sun is indeed shining, it must also be realized that even a very small change in the feedback regime might cause a very large change in equilibrium sensitivity. For this reason, making predictions based on feedback strengths diagnosed from models’ outputs cannot constrain equilibrium sensitivities reliably, since the entire interval absolute system-gain factors falls well within the envelope of uncertainty in published feedback strengths. There is, therefore, no legitimate scientific basis for the current predictions of “climate emergency” based on the models’ outputs.
Nobody would write a climate sensitivity model assuming the Sun wasn’t shining. Can you show me a climate model that assumes the Sun not not shining?
If you want to compare the effect of climate forcing at various times you need to know the temperature at that time since equal forcing’s will produce different direct temperature changes. Knowing the temperature assumes the Sun is shining.
Try reading his post again.
nobody write sensitivity models. ecs is an emergent property. its observed
In reply to Don, the original basis for the notion of a 4 K midrange ECS was the notion that the system-gain factor at the temperature equilibrium in 1850 was the ratio of the 32 K total natural greenhouse effect to the 8 K reference sensitivity to preindustrial noncondensing greenhouse gases.
In reality, at the 1850 equilibrium the correct ratio was not 32 / 8: it was (260 + 32) / (260 + 8), or about 1.1.
Climatologists had indeed forgotten the Sun was shining. For it is the Sun that drives the emission temperature whose feedback response they had implicitly set at zero.
Perhaps we differ on the definition of feedback. The literature I am familiar with defines feedback as the result of the heating caused by the addition of CO2 to the atmosphere, but it does not include the temperature rise directly caused by the GHE. The GHE process includes CO2 returning energy to the surface which then transfers heat to the atmosphere until the TOA heats to the temperature at which radiation to space increases enough to bring the system back into equilibrium. That additional heating is the input.
The feedback is what happens next resulting from such things as change in cloud cover, reflectivity, melted permafrost etc. The feedback from these items obviously requires the Sun to be shining. This feedback theoretically could be infinite.
Does everybody here define feedback differently?
Hansen and many others thereafter were incorrect in assuming that feedback responded only to the 3% of the reference signal represented by natural and anthropogenic reference sensitivities. They were wrong to assume that, therefore, based on the data for 1850, there would be 4 K equilibrium sensitivity in response to 1 K directly-forced warming by doubled CO2.
nobody uses feedback analysis to estimate ecs. its estimated from observations
Mr Mosher seems content to continue to advertise his bottomless ignorance. In the real world, every feedback-moderated dynamical system, including the climate, must comply with the laws of control theory, which, like the laws of thermodynamics, are not up for repeal anytime soon.
Therefore, it does not matter whether climatologists derive their guesses at ECS from tea-leaves or Vegas roulette wheels. We may use feedback analysis to investigate their predictions; and when that analysis is applied it is clear that all their predictions of ECS are no better than mere guesswork, for the reasons adumbrated in the head posting.
If V=0 then how do you get anything out of the amplifier?
If V is not equal to 0 then where is the power supply coming from? It can’t be both Vin and V since there would be no voltage between the collector and base of the transistor.
The biosphere is *NOT* a transistor amplifier. Trying to turn it into one is useless.
As said, the voltages marked on the diagram are AC voltages. V=0 at the top power supply rail means the voltage is constant. V=0 at the base reflects the very low input impedance. Of course it still varies a little, but for the feedback calculation can be taken as constant.
AC voltages? What in the biosphere is an AC voltage? And you show V = 0 at the top of the diagram before R1.Since when is the power supply to a dc amp an AC VOLTAGE?
V=0 does NOT* mean the voltage is constant. If you had said ΔV = 0 then you would be describing a constant voltage. But if ΔV = 0 then what is being acted upon?
Question 1: When Vin goes up what does Vout do? Assume no feedback.
Questino 2: When Vin goes up what does Vout do? Assume Rf is in the circuit. What does Rf cause Vout to do?
He won’t answer—he’ll post and run, again.
I have spelt it out with words. But OK, here is an extended diagram. Signal (AC) voltages are in black. The DC (operating point) voltages are in red.
V=0 at the base is of course an approximation, justified by the low input impedance. If Vin rises, base current rises, collector current rises, and Vout comes down. With Rf in place, that then reduces the base current, diminishing the extent to which Vout comes down. That is why Rf provides a negative feedback.
The gain, and feedback, relates to the ratios of these increments. It has nothing to do with ratios of the DC voltages, as Lord M would have it.
Oh, malarky! Where in the biosphere does the V=10 power supply exist? How does it relate to Vin?
Negative feedback. If you think this circuit explains the greenhouse theory then you need to explain how negative feedback can INCREASE output, i.e. raise the temperature of the surface!
The power supply is the 240 W/m2 of sunlight that is converted to IR. The input signal is the variation in GHG impedance.
ROFL!! So the input signal is a varying base resistance?
Like I said, when you are in a hole, stop digging!
Mr Stokes is, as usual, wrong, and particularly so when one considers that very nearly all feedback response in the climate system is feedback response to emission temperature, for the good and sufficient reason that emission temperature, the base signal, represents 97% of the entire reference signal.
Since feedback response to the 3% of the entire reference signal is, at any given moment, 3% of the entire feedback response at that moment, ECS based on data for 1850 was about 1.1 K. The arithmetic is shown in the head posting.
However, even a minuscule change in the feedback regime between 1850 and the present would greatly alter ECS, because any such change must be applied to the entire reference signal, including emission temperature.
For this reason, ECS is simply not constrainable by any general-circulation model, for the uncertainties in feedback strength are far too great. There is no getting around that.
If the voltage across the transistor base is 0, the transistor is off.
As I said, that is the AC voltage. The DC bias voltage must be about 0.6V (for silicon NPN).
But again, this just shows the folly of Lord M’s using the ratio of DC output/DC input at the measure of gain. If you do that using 0.6V, the ratio is 5/0.6. But you can just as well regard the positive supply rail as earth. Then the ratio is (-5)/(-9.6), a very different figure. Ratios of these aspects of the resting state have no relation to gain, and nor does Lord M’s ratio of state temperatures.
Your strawman is still burning bright in the night sky, Stokes.
You have shown an amplifier with negative feedback. Is that what you *really* want to try and show? That would mean the sensitivity to CO2 is negative, not positive!
This is just one more indication that trying to use a simple transistor circuit to explain what is going on in the atmosphere is useless.
In your circuit the summing node is the base of the transistor. The transistor responds to Vin + Vf. It doesn’t just respond to Vf. That’s all Monckton is trying to show. And which you keep trying to deny using all kinds of rationalizations which make no sense.
Exactly what the (+) nodes indicate! Born also doesn’t understand this.
I am most grateful to the Gormans and to Monte Carlo for their assistance. These discussions have served to illustrate the increasingly desperate and unhinged irrationality of those who are paid, many of them, to support the anti-Western Party Line on the climate question. Some prosecutions for treason will be in order in due course. I have a little list, I have a little list, they’ll none of them be missed.
Thank you for the mention.
Personally, I don’t think feedback correctly describes what happens in the sun-earh surface-atmosphere. I think heat transfer via conduction, convection, and radiation is most appropriate. Since climate science promotes CO2 absorption/emmitance via radiation, then addressing heat transfer by radiation is needed. There is no better reference for this than Max Planck’s thesis. It is difficult slogging due to the math, but it also has never been refuted.
However, your analysis of the misapplication of Bode feedback is on point. If one is going to use feedback as a cause, then it is appropriate to use it correctly.
The problems are numerous. Stokes doesn’t realize that his circuit uses the sun (VCC) to create an operating point which is what you are proposing. As MC says, this becomes a summing point for both the sun and all feedbacks.
Very glad to help.
“This is just one more indication that trying to use a simple transistor circuit to explain what is going on in the atmosphere is useless.”
It is Lord M who uses circuits and control theory to try to explain what is going on in the atmosphere. I use them to show what is wrong with his understanding of the theory. And here I use a simple negative feedback circuit to show the wrongness of trying to infer gain (or feedback) from the simple ratios of operating point quantities. Not to prove anything about the atmosphere.
And now you are just propping up your errors with lies.
ROFL!! Who did it first? Lord M or Hansen?
Again, operating points *HAVE* to infer gain (or loss). The output power *has* to be greater than the input power for it to be an amplifier. Thus *something* has to increase, Vout>Vin or Iout>Iin.
That increase *is* defined in the operating points. It might make more sense if you consider a vacuum tube. If the plate voltage isn’t greater than the grid voltage then how do the electrons get past the grid to the plate? If the cathode is at a higher voltage than the plate what happens to the electrons being emitted? Do they get to the plate? Or do they just form a cloud around the cathode?
The physics of a transistor are different than a vacuum tube but the same logic applies. It is the operating points that define the gain. The operating points are set so that the collector-emitter voltage swing is greater than the base voltage swing for small-signals. If that wasn’t the case then you wouldn’t have an amplifier. If you tied the collector directly to the power supply and the emitter to the opposite polarity of the power supply how much gain would you get from the transistor? Go read up on Class A vs Class B transistor amplifiers. It is the *operating point* of the transistor that determines the operating class. And the operating class determines all kinds of things like distortion and efficiency. Ever hear of a Class D amplifier?
“Who did it first? Lord M or Hansen?”
Well, it wasn’t me. And it wasn’t Hansen either. You won’t find a circuit anywhere in his writings.
i think it starts here
Hansen, J., A. Lacis, D. Rind, G. Russell, P. Stone, I. Fung, R. Ruedy, and J. Lerner, 1984: Climate sensitivity: Analysis of feedback mechanisms. In Climate Processes and Climate Sensitivity, AGU Geophysical Monograph 29, Maurice Ewing Vol. 5. J.E. Hansen, and T. Takahashi, Eds. American Geophysical Union, 130-163.Hansen, J., A. Lacis, D. Rind, G. Russell, P. Stone, I. Fung, R. Ruedy, and J. Lerner, 1984: Climate sensitivity: Analysis of feedback mechanisms. In Climate Processes and Climate Sensitivity, AGU Geophysical Monograph 29, Maurice Ewing Vol. 5. J.E. Hansen, and T. Takahashi, Eds. American Geophysical Union, 130-163.
which references
Bode H, Network Analysis and Feedback Amplifier Design, 1945 assumption of external power supply and active gain, 31 section 3.2 gain equation, 32 equation 3-3 real definition of sensitivity, 52-57 (sensitivity of gain to component drift) effects of consuming input power, 56, section 4.10 impedance assumptions, 66-71, section 5.2 – 5.6 a passive circuit is always stable, 108 definition of input (forcing) 31
followed up by
M. E. Schlesinger (ed.), Physically-Based Modeling and Simulations of Climate and Climatic Change – Part II, 653-735, 1988 Michael E. Schlesinger. Physically-based Modeling and Simulation of Climate and Climatic Change (NATO Advanced Study Institute on Physical-Based Modelling ed.). Springer. p. 627. ISBN 90-277- 2789-9, 1988
found this checking the good lord for plagarism
http://www.palisad.com/co2/feedback.pdf
The useless Mosher, increasingly desperate as he sees the climate-Communist house of cards toppling, now tries to suggest I have perpetrated plagiarism. However, our paper cites those upon which our argument relies, including the deeply misguided and woefully ignorant papers by Hansen and by Schlesinger. To cite such papers is not plagiarism, though Mr Mosher, who seems to have very little knowledge of the physical sciences or of the norms of scientific publication, perhaps does not know this.
https://pubs.giss.nasa.gov/docs/1984/1984_Hansen_ha07600n.pdf
he mentions using bode writings in analyzing not representing the system.
huge difference
Word salad argument!
If Bode is used to ANALYZE the system, then BODE must also represent the system interactions.
Us EE’s learn how to analyze a “black box” by inputting a step function and analyzing the output to determine the transfer function INCLUDING feedback.
Too bad climate science can’t determine a transfer function based on the sun’s insolation beginning each morning at sunrise for all individual places on the globe and then combine them.
If Mr Mosher were to get his kindgarten mistress to read our own writings on this subject, we have made it plain that we too use feedback analysis not so much to generate estimates of ECS as to investigate the plausibility of the official ECS guesses. The difference is that we use control theory correctly.
Mr Stokes is being silly. Hansen expressly appeals to feedback formulism in his silly paper of 1984 (an appropriate year). One of the many control theorists we have consulted, who has four degrees in the subject, has said he would never have passed that paper for peer review.
Mr Stokes is wrong.
Mr Stokes continues wilfully to confuse the issue. The problem with the climate system is that the base signal is so very large a fraction (97%) of the entire reference signal. For this reason, constraint of ECS by current methodologies is no better than guesswork.
Nick clearly knows sweet stuff all about electronics as well as physics .. V = 0 is impossible.
Current runs thru R1 then the Rf and then thru the base-emitter junction and the lowest voltage possible is Vbe on the circuit shown
The f in Rf stands for feedback which is positive in this example … just a FYI.
You don’t read. The voltages marked are the signal voltages. V=0 (almost) at the base is a consequence of the low input impedance. But as I said, the DC voltage there must be about 0.6 V (Vbe)
.The feedback is negative; the grounded emitter transistor is an inverting amplifier.
The circuit comes from here, where the gain is calculated.
How many transistors are inside an LM741 DIP, Stokes?
I sincerely doubt if he even cares.
Nope…
If the feedback is negative then does that mean the impact of CO2 in the atmosphere is negative as well?
Or are you just lost in the weeds like usual?
So a single-transistor amplifier is the only circuit available in your repertoire, Stokes?
It is quite enough to show the difference between signal and state variables. And to show the nonsense of picking out ratios of operating point quantities and interpreting them as gain.
Total strawman, Stokes, CMoB’s work does not use the mathematics of single-transistor amplifiers.
The question from which you ran away in a fast and furious fashion:
How many transistors are inside an LM741 DIP, Stokes?
Give it up, please! System gain is Output/Input – A RATIO!
If the operating points are not related to gain then what *are* they related to? If Vin isn’t less than Vout then what do you have? If Iin isn’t less than Iout then what do you have? You *must* have operating points that demonstrate gain in order to have an *amplifier*. In an electrical circuit you *need* to consider power in and power out because of input/output impedances.
“System gain is Output/Input – A RATIO!”
Yes, if it is a ratio of increments. But not of absolute voltages. That should never be done. A reason is that voltages are always relative to something, and there is no unique something that they should be relative to.
My circuit shows that. Input DC is an 0.6V, output at 5V. Ratio 5/0.6=8.33
But those voltages are by convention relative to the negative supply rail. You could equally use the positive rail:
Input -9.4V, output -5V, Ratio 5/9.4=0.53
Same circuit, two very different answers.
Taking ratios of temperatures, as in Lord M’s gain=E1/R1= 287/267 is also almost always wrong. Again the result depends on what the temperature is relative to. C or F? It’s true that K does have a thermodynamic zero, but it is way beyond anything you get in climate. And including it in a gain calculation ignores that long before you get there, gases have liquefied etc.
But that is just a symptom; the basic wrongness is the understanding of signal vs operating point.
When you are in a hole, stop digging!
“ If you flip from an npn to a pnp you would have -0.6 vs -5, the same ratio.”
You are big on making up rules to fit the occasion. But I don’t think many would follow that one. You would switch the earth convention because you have a grounded emitter PNP somewhere in the circuit? What if you have a NPN stage followed by a PNP stage, both grounded emitters?
But whatever, these are conventions. If changing convention gives differing answers for something that should not depend on convention, like gain, than something is wrong.
Nick,
You are lost in the weeds, man. You come up with some method of calculating gain which shows an amplifier is actually a loss element. They you speak of combining npn and pnp transistors without a clue that such arrangements exist, e.g. using a pnp stage as a gain control for an npn amplifier. You *still* calculate the gain of the amplifier in the normal way. You can’t even address how the different classes of amplifier work – which is determined by their operating points – such as a Class B which is one more example of using an npn and pnp transistor to form an audio amplifier.
You are trying to teach an old electrical engineer how to suck eggs. You know enough to be dangerous. And I know more about electrical stuff than you ever will.
You’re in a hole. Stop digging.
“ You come up with some method of calculating gain which shows an amplifier is actually a loss element. “
It isn’t my method. It is yours and Lord M’s. Divide the output DC voltage by the input DC. The main objection is that this is not gain. But an illustration of the absurdity is that the base (zero) to which voltages are measured is arbitrary. And you can, by your method, get any gain you like by changing base, including loss.
“They you speak of combining npn and pnp transistors without a clue that such arrangements exist”
Of course I know such arrangements exist; that’s why I raised it. You made up a rule that the voltage base changes from one supply rail to another if the transistor is PNP. To show this is nonsense, I asked what your rule is if there are two different stages. No answer.
Oh, MALARKY!
This is all BS. You claim operating point doesn’t determine amplifier response. Meaning you obviously don’t know anything about Classes of amplifiers. The fact that you can’t even address a question about them stands as mute proof you actually know nothing.
You are trying to baffle everyone with BS. It’s not working.
Mr Stokes continues pointlessly to push the feedback-circuit analogy beyond the point of breakdown, apparently in the vain hope of obfuscating the issue. However, more and more readers of this column have come to realize that he is not an honest broker here, and that he is spectacularly ignorant both of climatology and of control theory, otherwise he would not write as he does.
Absolutely correct, he’s got his strawman all set up and isn’t going tear him down.
Mr Stokes should understand that a feedback-amplifier circuit is an analogy. It is the characteristic of any analogy that, ex definitione, it will break down at some point, for otherwise it would not be an analogy but an identity.
The climate is not an electronic circuit: but, since control theory applies to every dynamical system moderated by feedback, its principles apply no less to the climate than to an electronic circuit.
One of those principles is that, if the base signal (emission temperature in the climate) exceeds the reference signal (reference sensitivity to greenhouse gases) by orders of magnitude, one cannot predict how the output signal may change over time as the feedback regime changes unless one is able to constrain the feedback strength to a precision that is wholly unattainable in climate.
Mr Stokes is showing himself to be more than usually accident-prone. In climatology, temperatures are measured in Kelvin, the measure of absolute temperature. The Stefan-Boltzmann equation does not work correctly except in Kelvin, for the relevant constant is set by reference to Kelvin.
And twattling on about thermodynamic zero not being close to any real climatic condition is way off the point. For, as I have explained many times, the feedback processes that subsist at any moment in the climate must perforce respond equally to each Kelvin of the total reference temperature then obtaining, without distinction between a Kelvin of emission temperature and a Kelvin of reference greenhouse-gas sensitivity. A Kelvin is a Kelvin is a Kelvin, and the feedback processes, being inanimate, cannot and do not distinguish between one Kelvin and another at any given moment. They respond equally to each Kelvin of reference temperature then subsisting.
“A Kelvin is a Kelvin is a Kelvin, and the feedback processes, being inanimate, cannot and do not distinguish between one Kelvin and another at any given moment.”
This is one of the most telling arguments in your thesis. Once the input signal and the feedback signal are summed there is no way to distinguish between them. The summing node does not tag each one with a different identification. Even the most simple of dimensional analysis verifies this conclusion. The dimensions of both signals are exactly the same both before and after the summing.
I would also point out that if Hansen referred to Bode’s work to drive his feedback analysis then he didn’t understand Bode’s work at all. Without a power supply to provide energy providing amplification, i.e. u > 0, there can be no feedback.
Assume Er/Eo = 1, i.e. no gain. This implies a short circuit between the input and output and no passive network can provide any feedback since its impedance would be higher than 0, the short circuit between Eo and Er. So Er will equal Eo always and everywhere.
What did Hansen describe as the gain element? I can’t quite figure that one out. It can’t be just CO2 because CO2 appears to provide just about the same amount of cooling as it does warming. Nor can it be just water vapor for the same reason. Thus their net feedback is effectively zero.
What they do provide is insulation just like the cellulose or fiberglass insulation in the attic of your house. Insulation doesn’t provide feedback, per se, it just changes the thermal gradient between the interior and the exterior.
If the rate of heat loss is given by Fourier’s law as
q = -kA(dt/dL) where L is the perpendicular distance of travel.
Then increased CO2 and water vapor increases the effective distance the heat must travel which reduces the transmission of heat.
This is for the conduction/convection terms of heat loss. However, radiant heat loss is not significantly different. The transiting material can not provide “gain” since there is no external power source to provide it but it *can* reduce the rate of heat transmission. Over time this will tend to raise the minimum temperature involved which affects any average associated with it.
Since many temperature stations since 1980 have recorded temperature at 2 minute intervals you should be able to track this change in the rate of heat loss by analyzing the exponential decay of temperature at night. This would give you thirty years worth of data that could be used to determine if the rate of heat loss has changed. If it has then more research would be needed to determine the actual causes and the contribution of each. If it has not then the whole climate science edifice needs to be examined.
It is Mr Stokes who, as usual, is peddling nonsense. He is well out of his depth here. In 1850, for instance, the reference signal was the 267.1 K sum of the 259.6 K base signal, emission temperature, plus the 7.5 K perturbation signal, reference sensitivity to the preindustrial noncondensing greenhouse gases. However, the equilibrium temperature that year was 287.5 K. The ratio 1.0764 of the equilibrium to reference temperatures fully accounts for the entire influence of feedback on the system, and it is childish to continue to try to suggest otherwise.
I’m confused. Is energy dissipated when GTA oscillates?
The temperature of the Earth is postulated to go up so that output doesn’t drop. So you calculate a feedback that is the extra energy bouncing around the system, and that extra Q gives you the increase in temperature. Surely this is taking an analogy with an amplifier, where the output depends on an oscillating voltage, too far?
At least Monkton does a proper job for a back of envelope. How much water vapour and clouds were in the atmosphere depended on temperature at the beginning of the IR as much as it does now. Any analogy with an amplifier to argue otherwise is stupid.
he ever-partisan Mr Stokes is, as usual, wrong.
look mom thats a personal attack and arguement by assertion!
the good lords errors always come in twos.
Oh look…Mosh can’t understand
Mosh won’t understand, just as Stokes won’t tell the truth.
Mr Mosher, as usual, quotes me out of context. I explained why the partisan Mr Stokes, who is paid to disrupt these threads but does not disclose that fact, is wrong. Therefore, there is no argumentum ad hominem, and the assertion that Mr Stokes is wrong is amply and repeatedly proven.
I noticed that in the thread below your reply to Roy Spencer, Stokes was advocating science-by-consensus when he claimed Pat Frank’s paper was invalid due to not having a sufficient number of citations to please the Almighty Nitpick Nick Stokes.
Cold air provides no amplification in the temperature of hot solids.
Do you know how an air-cooled engine works? The atmosphere cools the engine by absorbing the heat from the surface of the cylinder. Sounds familiar? That cold air absorbs heat from a surface?
So, why would the atmosphere have the OPPOSITE effect on the surface itself, compared to all hot objects that exists ON the surface?
Cold air cools. Kids know this, but you don´t.
” the atmosphere have the OPPOSITE effect on the surface itself, compared to all hot objects that exists ON the surface?”
Greenhouse gases in the atmosphere, primarily water vapor, impede Earth’s ability to cool itself with upwelling infrared radiation. The atmosphere’s greenhouse gases do not “heat” the surface — they prevent some surface heat from escaping into the infinite heat sink or space.
I’m not sure everyone around here agrees with that. It is said that greenhouse gases radiate downward and those photons are just as capable of heating as any other downward photons flying down with them – even if they strike an object already warmer than the gas that radiated the photon.
The argument has often been made on this site that, just because a relatively cold item cannot heat a warmer item overall, that doesn’t mean some heat doesn’t travel from colder items to hotter items.
If a billionaire and a millionaire decide to give 1% of their wealth to the other person, the millionaire will end up richer after the exchange and the billionaire will end up poorer. But the billionaire will, in fact, receive income from the millionaire. Each will BOTH end up with something more than 99% of his original wealth, though they both gave away 1% of it.
Those downward photons are just replacing photons that have already been lost from the surface by going upwards.
They don’t “add* to the total heat of the surface, they just change the gradient of the heat exchange. You can’t stop the surface from cooling, that would violate the laws of thermodynamics. The surface cools even during the day, not just at night. As the sun drives its temperature up it radiates more intensely, it doesn’t stop radiating just because the sun is above the horizon.
The photons returning to the surface reduce the net heat flow from the surface, hence the surface warms.
No, the gradient changes. You may say that the surface is warmer than it would be without the colder radiation but you can’t say that it warms the already hot body.
Without the cold body, the hot body’s gradient may be -1° per second. With the cold body the gradient may change to -0.5° per second. But there is no way the cold body can turn the gradient of the hot body to a positive value.
Now as the hot body warms the cold body, there will come a time when the gradients become zero. That is known as equilibrium. From that, you can see that if the cold body could change the sign of the gradient to positive, you could never achieve equilibrium. Entropy would be violated, making that process not possible.
There is no such thing as colder radiation, the excited CO2 vibrational temperature is higher than the surface. The excited CO2 molecule will lose energy either by radiation or by collisional deactivation with surrounding molecules. Either way it warms its surroundings.
Sorry, but there is such a thing as colder radiation. Bodies radiate power based upon their temperature. The lower the temperature, the less the power radiated. Power = σT^4. The colder body means there is less power in the emitted in the EM wave and a reduction in the number of photons that are “carried” by that EM wave. As explained several times, a hot body can absorb power (energy) from a cold body, but it doesn’t change the amount of radiation it is emitting. The hot body compensates by reducing its cooling gradient.
We’re not talking about emission from ‘bodies’ we’re talking about emission from ‘gas molecules’, a subject you apparently know nothing about. Excited CO2 molecules in the atmosphere are excited from their ground state to the first excited state of the bending mode, which means they are ~8kJ/mole above unexcited molecules in the atmosphere. That is, their vibrational temperature is above the temperature of surrounding molecules. This excess energy is lost to their surroundings by either radiation (the emission of a single photon), or collisional deactivation by surrounding molecules (thereby raising the temperature of those molecules).
I hate to tell you but MOLECULES radiate based upon their temperature.
If the absorption/emission didn’t depend on temperature there would not be a lapse rate and CO2 at altitude would radiate at the same power as those next to the surface.
You’ll notice I said nothing about thermalization resulting from collisions. That has nothing to do with radiation.
Here is some info from a paper.
https://climateauditor.com/co2-infrared-absorption/
No, gas molecules radiate based on their internal energy which in the case of CO2 in the atmosphere depends on its rotational and vibrational energy. Again you indicate that you know nothing about the subject. Yes, a vibrationally excited CO2 molecule at altitude will indeed radiate at exactly the same power as one near the surface. That paper you referenced is junk I suggest you read a real text book. It is based on the nonsense that the only source that emits at 667cm-1 must be at -80ºC which is garbage!
So you don’t believe that S-B or Planck’s derivation of temperature relationship to emission power is correct? You might explain how your assertion dovetails with those.
Also, the paper you call “junk” was written by a professor utilizing the HITRAN information. I’m sure you are in a good position to explain why it is “junk”. Simple assertions like that mean little without backup.
“So you don’t believe that S-B or Planck’s derivation of temperature relationship to emission power is correct? You might explain how your assertion dovetails with those.”
Because they don’t apply to the emission of gaseous molecules in their excited states. The emission of which depends on the internal energy not the translational temperature and in the case of CO2 in the atmosphere on the vibrational temperature. Stefan-Boltzmann describes the power radiated from a black body, gas molecules are not black bodies! Planck’s law also applies to black bodies, not gas molecules.
“Also, the paper you call “junk” was written by a professor utilizing the HITRAN information. I’m sure you are in a good position to explain why it is “junk”. Simple assertions like that mean little without backup.”
Nothing wrong with the HITRAN data, however the statement:

“The source temperatures that radiate at the CO2 absorption peaks are:
a. 193.5̊K, ie. -79.5̊C,
b. 685̊K, ie. 412̊C,
c. 1080̊K, ie. 807̊C, and
d. 1446̊K, ie. 1173̊C.
Since 99.83% of the photons that may be absorbed by the atmospheric CO2 molecules will be from the 15 micron absorption band and these represent radiation from a source at 193.5̊K,”
indicates that the author doesn’t have a clue about S-B law.
What is meant is that a black body at a temperature of -79.5ºC has its peak emission at 667cm-1, not that that’s the only source of that frequency. In fact a black body emits a continuum of radiation and a black body at 300K will emit much more radiation at 667cm-1 than one at -79.5ºC!
In fact using the range quoted in that ‘paper’ a bb will emit
4.4W/m2/sr at -79.5ºC compared with 26.9W/m2/sr at 300K, which is more than 5x as much!
I strongly doubt whether it was written by a professor but it is indeed junk. I’ve explained numerous times before on here why such a statement is junk.
Then read this site.
Absorption coefficient of carbon dioxide across atmospheric troposphere layer – PMC (nih.gov)
Notice sections 2.1 & 2.2 and others. They discuss the absorption coefficients and heat equations of the atmosphere. You will notice that temperature is a prominent term.
In addition, from Planck’s book The Theory of Heat Radiation:
Max Planck. The Theory of Heat Radiation by Max Planck (pp. 50-51). Prabhat Prakashan. Kindle Edition.
Notice that temperature is a very dependent value for determining radiation quantity. It applies not only to volumes, but also the independent quantities making up that volume. Consequently, each similar molecule in a volume must radiate similarly.
Your insistence that a CO2 molecule only absorbs and emits a single photon with a unique energy signature regardless of its temperature is just not the case.
Again, if temperature did not matter, then CO2 at the top of the atmosphere would be radiating the same amount as CO2 at the surface. I have never seen that claimed, in fact, just the opposite.
Again you fail to realize that you’re talking about different things, CO2 molecules are not black bodies! Planck is referring to black bodies not molecular spectra. The NIH paper you link to is talking about the absorption bands in the atmosphere, not black bodies, the influence of temperature is to broaden those bands. A CO2 molecule absorbs in a narrow band of wavelengths centered about a single vibrational energy with a range of rotational fine structure. In the atmosphere the absorption band is centered on 667cm-1. As I said before an excited CO2 molecule will radiate a photon of the same energy whether it’s at the top or bottom of the atmosphere. Here’s the CO2 spectrum for you, the only effect of temperature is to broaden the fine structure of the bands.
https://webbook.nist.gov/cgi/cbook.cgi?ID=C124389&Type=IR-SPEC&Index=1
Transmittance at surface:
rte-lbl-1013mb-1meter-600-750.png
Transmittance at tropopause:
rte-lbl-200mb-216k-3-7meter-600-750.png
I understand your argument, but you are, to maintain the theme, ignoring the sunshine. The surface is constantly being heated to some temperature by some external source. The body in equilibrium with that source is radiating an equal amount of energy. If I now add additional energy from the returning photons the body will increase its temperature until it once again obtains temperature equilibrium.
Discussing hot bodies and cold bodies is misleading for this scenario. A 15 micron photon has energy 2.20 x 10^-26 w sec leaving a body or arriving at a body regardless of the temperature of the source.
“ If I now add additional energy from the returning photons the body will increase its temperature until it once again obtains temperature equilibrium.”
The receiving body had to heat first before it could send anything back. That heat added to the second body comes from the first body which then cooled from the loss of heat. If *all* the energy from the first body was returned it would only return to its original temperature.
Think carefully about the words “additional energy”. Where did the “additional energy come from?
If we are talking about the GHE then the receiving body does not have to be heated by incoming radiation before it sends back the incoming radiation.. In fact the atmosphere is not heated by the IR radiation, it is heated by convection and conduction from the surface.
But you have been talking about the surface as a closed system. Energy radiated from the hot surface that later returns cannot increase the temperature of the surface you say. I only pointed out that the hot surface is hot because there is a source heating it with witch it is presumably in thermal equilibrium. In that case adding the returning previously radiated energy will raise the surface temperature.
The total energy consists of the energy from the sun heating the hot body, the IR energy radiated by the hot body, and a portion of the energy radiated by the hot body returned to the surface. No other energy is involved.
While that source is heating body 1, body 1 is also radiating heat away. It is not returned radiation that heats body 1 beyond where it started, it is the other source of heat.
It’s why the temperature of the earth doesn’t go up at night!
It’s still getting returned energy from the atmosphere so why doesn’t it’s temperature go up?
But, the argument goes, they were already lost to the surface. The surface cooled because of the outgoing photons. Now some photons return a second time. They mingle among the other photons striking the surface, doing what photons do. They aren’t too tired from their first trip, nor are they on strike, thinking “I’ve already done my warming”. The surface doesn’t say, “I’ve already received warmth from you, I’m not receiving any more.”
The surface of the earth is warmed as it is struck by photons. Why does it matter where that photon originated from? I’m not creating a perpetual motion machine; I’m warming the surface of the planet. I live on the surface. I’m very interested in the temps around me. Am I interested in the temperature at 10,000 feet? Not so much.
I get it, I need to be concerned somewhat about temps aloft, because the earth is a whole and complex system. But, for the most part, I’m interested in the surface temp and that is heated by photons raining down from above. I really don’t care what fired them at me, I’m just thankful for them.
“The surface of the earth is warmed as it is struck by photons. Why does it matter where that photon originated from? “
It doesn’t matter. What matters is what happens over time. Using an average aggregate hides what actually happens.
If the earth loses Photon1 then it cools. If Photon1 is intercepted by CO2 and sent back then the earth doesn’t get “warmer” than it was, at most it can only return to the previous temperature. Since some of those intercepted photons actually do escape, there aren’t enough coming back to warm the earth back to where it was to begin with.
New photons from the sun *can* warm the earth, it happens every day. There are enough of those photons from the sun to make up for what the earth loses to space plus additional more. At night, however, there isn’t a source replacing the photons being lost and the earth cools. All the “back radiation” can do is modify the rate of cooling.
This is all quite complicated. If CO2 at height X100 intercepts a photon from earth and radiates it back why isn’t that “back photon” intercepted by the CO2 from X0 to X99 and radiated back toward space?
It all needs to be integrated over time as a time dependent gradient of some kind. CO2 isn’t an infinitely thin mirror somewhere in the atmosphere letting some photons pass while reflecting others back. But that seems to be how climate scientists look at it.
Indeed. Not to detract anything from the monumental amount of effort that Lord Monckton et. al. have put into this analysis, nevertheless I think they are arguing the wrong point entirely. (Notwithstanding that anything that shoots holes in the CAGW theory, as admitted by CAGW proponents themselves, is to be commended.) But I think official climatology went off the rails long before they got to trying to calculate feedbacks. Somewhere around here, in fact: “The forcings to 1850, therefore, work out at 25.3 Watts per square meter.” No they don’t! There is no downward “forcing” (in the sense of power from radiation) at night time, i.e. from the atmosphere as opposed to from the sun. And since that is fictional, the rest constitutes either counting the angels on the head of a pin, or rearranging the deck chairs on the Titanic, ’cause that ship is sinking fast… actually it sank decades ago, but not everyone got the memo…
(I would not try to tell Lord Monckton how to spend his time, but for my money, the best bet would be to start with the most fundamental error, and work upwards from there… no point worrying about the crenellations on the towers, or the chains on the drawbridge, when the foundation is made of sand)
Radiative forcing exists, and is not realistically impugnable. However, climatology’s feedback analysis is demonstrably incorrect. And it is that feedback analysis that, in the current misguided understanding, accounts for between three-quarters and nine-tenths of all predicted global warming. Where, then, should one concentrate one’s effort? On the direct forcings, which are not provably wrong, or on the feedback responses, which are very likely to have been grossly exaggerated?
Well, it’s difficult to predict how to get the most bang for one’s analysis buck when faced with a corrupt establishment. However, I would disagree that “radiative forcing exists, and is not realistically impugnable”. Downwelling radiation (as longwave IR from the atmosphere) exists, yes, but is not measured in power units (Watts). This is as fundamental an error as you can get in thermodynamics. Yet official climatology insists on doing so anyway. Proving that they are incorrect to do this is very straightforward. And does not require constructing elaborate feedback test beds out of electronics either, not to say that that isn’t fun in itself. So, it seems to me that you would get a much bigger bang for your analysis buck by starting with the more fundamental error.
Ask yourself this question: what kind of fools would the official climatologists look like if they didn’t have their 350 W/m2 of atmospheric DWLWIR to stand on? Take their platform away…
Mr Schilling appears unaware that forcings are indeed measured in terms of radiative flux density: i.e., in Watts per square meter of the emitting surface, which is in the upper mid-troposphere.
Our approach is to accept all of official climatology, including the radiative forcings from the Sun and from greenhouse gases, except what we can prove to be wrong. We cannot prove the forcings to be wrong, but we can and do prove the feedback analysis that originally led to the prediction of large and dangerous rather than small and net-beneficial warming to have been incompatible with long-established control theory.
There is, in the present context, no point in trying to pretend that such forcings do not exist.
Well, as I said, I do think there is certainly value in pointing out as many flaws in official climatology as possible. No argument there.
But if you are referring to me instead of to Mr. Schilling, who is also contributing to this thread but independently of my line of reasoning, then I can respond that the only pretending is being done by the climatologists. They do a lot. Accepting their pretenses for the sake of argument is fine, but I do recommend being aware of the pretenses as you accept them. And I believe you could be a lot more effective by demolishing the pretenses rather than just accepting them at face value, and it would be a lot less work for you, to boot.
For instance, the term “forcing” is not a physics term – it was made up by climatologists in order to attract more grant money. They use it as a drunkard uses a lamp-post – for support rather than illumination.
“Force” is a physics term, but it refers to the ability to change another object’s momentum. Technically photons do apply force when they are absorbed, but that is not what the climatologists are talking about.
“Radiative flux density” is a sketchy term too, and one that climatologists would prefer you not to examine too closely with your physicist hat on. “Flux” is a term most commonly used for liquids or semi-liquids, or even electrons, when they flow according to a potential gradient. Radiation as realized in photons isn’t really analogous to anything that flows. It is a form of energy, basically a consequence of temperature (and measured in the same units). It can certainly travel from point A to point B, and do a lot of weird things in the middle, and it doesn’t matter as much as you’d think where points A and B are either, but: that occurrence must be kept entirely separate from the notion of power. So don’t be using Watts for this phenomenon at all. It is safer to think of it as a potential, even while it is in transit. Measure it in Kelvins and you won’t go wrong.
Of course radiation is indeed one way to move energy at a macroscopic scale from place to place, always from lower entropy to higher entropy, i.e. hotter objects to colder objects. That will result in work being done and power being developed. But that work and power can only occur while increasing entropy. Radiation can travel in more or less any direction, but not while doing work.
If you are referring to diagrams like Trenberth’s radiant energy flow diagrams, with radiation arrows all over the place labeled in W/m^2, those arrows are almost all imagined. Practically none of them are measured, other than at the surface and top of atmosphere. (Not too many people are quibbling about those ToA measurements, so I will leave them alone, although there is quite a bit of uncertainty there too.) But no one has measured any radiative Watts in the mid troposphere, at night, that’s for sure. If they did, they would get some very small numbers, and none of those numbers would be directly attributable to CO2, and they would all be negative numbers if looking upward (as energy makes its way from the surface back to cold molecules in space).
(Remember that a measurement involves using some sort of tool, like a ruler or a thermometer or a thermopile, to detect an intrinsic characteristic of some system, such as length, or temperature, or voltage.)
People have measured energy loss (cooling) at the surface at night, when isolated from conductive and convective loss, i.e. the radiative part only, and of course that will be primarily in the longwave infrared frequencies.
And these measurements (of voltage from a thermopile, which produces a voltage when subjected to a temperature differential, itself resulting from some sort of energy gain or loss, i.e. heating or cooling) show an energy transfer (heat loss) (“radiant greenhouse effect”) of between 0 and ~100 W/m^2, from the surface upward to the colder atmosphere, in accord with the laws of thermodynamics. (The difference depends on the humidity level, since water vapour inhibits radiative heat loss very effectively. We can learn a lot about the relative rate of energy loss via radiation vs. conduction and convection from this measurement, but that’s a separate discussion.)
However, that’s not what the climatologists tell us! They claim that there are 300 or so W/m^2 of downwelling longwave infrared power (I can’t even type that without cringing, the claim is so badly formulated) at the surface, at night, constantly. That is not a measurement, it is not physics, it is an imagination. It is entirely false. But the entire radiant greenhouse effect is based on this. So you could try pointing that out to them, and then watch them get all red-faced and huff and puff and try to defend their false physics with a mishmash of technical-sounding words that they don’t actually understand. Try it and see!
TL;DR: Power is not an intrinsic characteristic of electromagnetic radiation. But energy is (whether you measure it in electron-volts, Joules, or degrees). So in order to think about power, you first have to start with an entropy differential (possibly a temperature differential), and then you can think about the energy moving in one direction only, according to the laws of thermodynamics, and then think about the power developed that way.
Looks like you still haven’t figured out how a basic non-inverting op amp circuit works yet, Nitpick.
Hint—no coupling capacitor.
So without feedback, and with the sun shining, you say the Earth should be at absolute zero. You confirm the Lord Monckton’s argument.
Here again the feedback model is not understood. Nick has seen the error, but not quite explained it very well.Forget this “voltage” model, look at power transfer instead. Power transfer requires that something is not in a steady state, in an amplifier input power leads to output power x the circuit gain. In principle this has nothing to do with assumed voltages, and the additional output power due to gain can only come from the electrical power supply!
Where in the atmosphere is this power supply, allegedly we have already accounted for all the energy? The Green model above is erroneous, simply because there is NO power supply available to boost the steady state condition Rsub0.
In fact I have pointed this out a number of times in personal communications to the authors, but seeing the wood for the trees is I agree very difficult. Many of the system diagrams we have been shown get extra energy by false accounting, again there is no source for any additional energy from the feedback amplifier gain, so the outcome must be that the feedback effect does not exist, and therefore an atmospheric “Greenhouse effect” does not exist, certainly not due to gases anyway. Clouds and convection clearly do have a huge effect, often of many degrees, but this is not new energy, it is simply what we have already being partly prevented from escape to space!
I should have also pointed out that Energy is expressed directly as power, but I am sure you knew that.
Since R0 is emission temperature, the Sun provides the temperature.
Christopher, you are still seeing temperature in the wrong way. I see exactly why you attempt to make your argument in the way you do, but the problem is not really because of a “feedback” amplifier, which I suggested to you a number of years ago.
Perhaps I may restate the problem, which may clarify why: The sun provides a heat input H by radiation only. The Earth looses heat by several processes, many of which are complex and potentially chaotic. This is obvious from weather process which have the same characteristics, and are equally difficult to reduce to a simple picture, and cannot be done accurately.
The Earth loses some heat from the surface by radiation, into the cold sink provided by space. It loses more heat by convection flow of atmospheric gases. These gases cool as they rise, losing more heat to space. The gases are also heated by direct sunlight (sunheat actually) with wavelengths in the absorption bands, rise somewhat faster and lose heat to space, cooling, become less dense and falling back to collect more heat. Water does the same cycle, as water vapour, again moving heat to space. Essentially the system loses just as much heat as it gains overall, so temperatures are fairly stable on a global scale.
The question is simple, what proportion of these processes can be changed by a trace gas in the atmosphere? How is its energy transport mechanism different to all the other gases, including water vapour? The real answer is that they are not, it is all about energy transport, and nothing else. The Solar intensity also changes fairly radically in energy terms over long periods, but of course this is ignored as unhelpful too.
You haven’t grasped the why for CMoB’s analysis, try reading it again.
“The Real Engineer” is entitled to his theories, but they have no bearing on our argument. We accept ad argumentum all of official climatology except what we can prove, and have proven, to be incorrect.
“therefore an atmospheric “Greenhouse effect” does not exist, certainly not due to gases anyway.’
That ‘no greenhouse effect’ claim implies that you are right and virtually every scientist in the world, include “skeptic” scientists, is wrong. I’m betting on the scientists. One of them discovered the greenhouse effect in the late 1800s, in a laboratory. You have some catch-up reading to do.
“Where in the atmosphere is this power supply”
The “power supply” for Earth’s climate is the sun. NASA claims incoming solar energy measured at the TOA has declined slightly since about 1960. The next question is whether a change in cloudiness has allowed more solar energy to reach Earth’s surface since 1960. Does anyone here have an answer to that question?
Enough with this “every scientist in the world” foolishness. Virtually every scientist in the world at one time believed in the Ptolemaic model. There was a time when hardly any scientists in the world believed in plate tectonics, or that bacteria could possibly cause ulcers… that is, until they did.
Most human endeavors are rife with lemmings following other lemmings simply because those other lemmings are following someone. Science is just one more human endeavor that is rife with lemmings.
Give me one Newton sitting under a tree looking up at the sky, or one Einstein alone in an elevator letting his imagination run free, to ten thousand technicians as busy patting each other on the backs as they are tinkering for decades around the edges of a better person’s work.
You got it. I tried in another thread to show that we are taking POWER GAIN, and not voltage gain. I^2R = VI.
As in earlier posts, the sun can not be both an input and a power source to a an amplifier.
I know Monckton is trying to show how the original “feedback” theory is wrong using similar design. However, the whole “feedback” and amplification is hosed. It is based on the radiation from a cold body adds to the hot body to make it warmer.
The Earth’s system is a thermodynamic system made up of a hot surface and a cold insulating atmosphere.
‘The Earth’s system is a thermodynamic system made up of a hot surface and a cold insulating atmosphere.‘
Ta da! But there are feedbacks in the ‘system’ and they have to be sufficiently net negative to maintain stability around whatever base conditions pertain over geological time.
No, feedback in the climate is not feedback “based on radiation from a cold body” to a warmer body. That would violate the second law of thermodynamics. However, if one puts a blanket around a pot of Arabic rice after boiling it and leaves it to stand, the rice will cool more slowly than if there were no blanket. It is that slower cooling that gives the Arabic rice its unique texture. If Mr Gorman were to do an experiment with two identical pots of rice both brought to boiling point and then stood to cool, one with a blanket and one without, at all points until both pots had reached ambient temperature the rice in the pot with the blanket would be warmer than the rice in the blanket.
But how can this be? The blanket is cooler than the pot. Have we breached the laws of thermodynamics? No, of course not. The blanket, though cooler than the pot, inhibits the cooling of the pot, which is, therefore, warmer than the pot without the blanket. Haud secus the Earth and its blanket, the atmosphere.
The blanket provides no feedback. It merely changes the coefficient of thermal conductivity of the material surrounding the pot. This changes the rate of heat transmission away from the pot. It is most definitely not feedback. It’s no different than changing the R-value of the insulation in the walls of your house.
Please don’t misunderstand what I am saying.
I perhaps didn’t say this in the most accurate manner. What I should have said more explicitly is that feedback from a colder body can not change the sign of the cooling gradient of the hot body. The feedback may decrease the magnitude of the cooling gradient, but can not change the sign from negative to positive which would be necessary to make the hot body hotter.
As such you are correct that the blanket will make the pot warmer at a future time than it would have been without the blanket. However, it can not increase the temperature of the pot unless it becomes hotter than the pot. Yet, the blanket can only ever reach an equilibrium temperature with the pot and can warm it no further. At most that equilibrium temperature could be whatever the pot started at, assuming the pot is at equilibrium with it’s heat source.
This is why thermodynamics is of importance. Entropy rules here. Heat must be analyzed in terms of what entropy will allow. Work must be done to have a decrease in entropy, such as in an amplifier with gain. If there is no power source capable of providing additional work energy, the gain can never exceed more than 1, and the output must be diminished by the power being used in feedback, voila, no gain.
“However, it can not increase the temperature of the pot unless it becomes hotter than the pot. Yet, the blanket can only ever reach an equilibrium temperature with the pot and can warm it no further. At most that equilibrium temperature could be whatever the pot started at, assuming the pot is at equilibrium with it’s heat source.”
You forgot the sun is shining.
If energy is going in to the pot, and you reduce the energy leaving the pot, it will get hotter.
As explained to you above an excited gas molecule is not a ‘colder body’. Your whole argument is based on a flawed understanding of molecular spectroscopy and thermodynamics.
I have been meticulous in showing references that you have yet to factually explain what is wrong. You making assertions without supplying supporting information is not what one does when making an argument.
Show some supporting references that dispute my claim that temperature is a factor in absorption/emission of radiation if you want to make a cogent argument.
“I have been meticulous in showing references that you have yet to factually explain what is wrong. You making assertions without supplying supporting information is not what one does when making an argument.”
I have been very clear in explaining what you don’t understand, you think molecules are black bodies!
Your one reference which you claimed was by a professor was actually by a retiree who has a batchelor’s degree in math. Who made the classic error of misunderstanding Planck’s law which I explained to you.
“Show some supporting references that dispute my claim that temperature is a factor in absorption/emission of radiation if you want to make a cogent argument.”
I have, I note that you’ve also misrepresented your problem again, you think molecules absorb/emit as black bodies. Even the papers you’ve linked show that they don’t.
You have made assertions with no references at all. Your explanations mean nothing without references. I have provided references that you merely dismissed with ad hominem attacks.
Here are some more references from:
Dependence of Earth’s Thermal Radiation on Five Most Abundant Greenhouse Gases, December 22, 2020
by Wijngaarden and Happer
Section 3.1 – Line Intensities
Equations (3) thru (15) all have explicit (T) temperatures in their relationship.
Section 3.2 – Lineshapes
Eq (17), (18), and (19) all include a temperature component.
Section 4 – Radiation
I(tilde) is the spectral intensity of a pencil of radiation. In thermal equilibrium, the intensity I(bar) equals the Planck intensity from Eq (9). Eq (9) has a temperature component.
Look at equation (39). Wonder of wonders, the Stefan-Boltzmann equation appears. Temperature is VERY important in this equation.
Section 5 – Intensity and flux
Setion 7 – Temperature and Forcing
I have tried to point out just a few of the uses of temperature in this paper. If CO2 had no variabilities with temperature (and pressure), then a lot of the paper would be greatly simplified. Forcing could be simply calculated by integrating the concentrations over a given height to determine the total forcing.
Your assertion is a very simplistic explanation with no mention of temperature and pressure affecting absorption/emission. You should read this paper to get a better understanding of the physical effects of an atmosphere.
Your attempt to denigrate my knowledge and education is an ad hominem attack. It carries no weight with anyone familiar with making a cogent scientific argument. That requires facts gathered from references.
“You have made assertions with no references at all. Your explanations mean nothing without references. I have provided references that you merely dismissed with ad hominem attacks.”
I have provided references and data, one reference you gave had the nonsense link between 667cm-1 and temperature of -80ºC which is rubbish.
“I hate to tell you but MOLECULES radiate based upon their temperature.”
This was your assertion and you claimed that S-B and Planck described the dependence of CO2 molecules emission/absorption which is blatently false, as I have pointed out.
Will’s paper is a good one on the subject which I have read before and it quite clearly shows that CO2 emission/absorption is not governed by S-B! He does point out that there is a small temperature effect on line width and broadening which agrees with my point earlier (and the graphs I provided). Figure 2 clearly shows the Planck spectrum from a black body (T=296K) compared with the CO2 spectral lines which verifies my statement.
You make the assertion that equation 39 refers to the Stefan-Boltzmann equation, not in the version of Will’s paper that I have:
E3(τ∞ − τe) = 1/4, or τ∞ − τe = 0.41904. (39)
“Your attempt to denigrate my knowledge and education is an ad hominem attack.”
It certainly is not, I’m just pointing out that you don’t understand how gaseous molecular emission/absorption works, you keep digging deeper and deeper and providing references that prove you are wrong!
What you are basically doing is denigrating a macro examination of heat in the atmosphere by implying that only an examination at an atomic level is worthwhile. You are wrong in that assumption. Assuming an homogenous body of a not too large or too small a volume (atomic) allows a macro examination of the radiant associated with heat transfer in that volume. By being homogenous, all elements of that body must act similarly.
Temperature and pressure are fundamental properties concerning absorption of radiant heat.
Heat is another subject when discussing absorption coefficients of CO2 in the troposphere. See the following paper at:
https://www.ncbi.nlm.nih.gov/pmc/articles/PMC6174548/
See equations 5, 6, 7, 8, and 9. Especially eq 8 has a temperature relation. Temperature is used throughout this paper.
Please provide some references that CO2 (along with N2/O2) does not embody the characteristics of an insulator with a temperature gradient. Without references supporting your position you are not presenting a cogent scientific argument.
“What you are basically doing is denigrating a macro examination of heat in the atmosphere by implying that only an examination at an atomic level is worthwhile.”
No what I did was refute your erroneous statement that the emission from excited CO2 molecules was subject to S-B and Planck’s Laws. I provided adequate justification and you even provided links which justified my point! I never disputed that the absorption coefficient of gaseous molecules had a small dependence on temperature, in fact I pointed out that there was line broadening, nothing to do with emission though. You continue to make it clear that you don’t understand molecular emission/absorption.
It is not an “operating point“!
Those little circles with the plus signs inside should be a clue for you.
Mr Stokes appears to be unfamiliar with the diagrammatic representation of a summative node.
While I think the accepted Climate Science™ is horse shit, I can’t see the climate response having to respond to each additional degree in the exact same way. W.E. has published some great articles here on emergent phenomena, where the atmosphere and tropical ocean’s response was dramatically different over just a few degrees.
With water changing phases at 0°C, basically in the middle of the Earth’s temperature range, isn’t it impossible to have a linear response to inputs, or the response to increasing temperatures being the same at 270, 280,….300K?
I definitely think, however, that the environment is more likely to act as a damper than an amplifier.
It would be helpful if PCman999 were to read the head posting. There, he will find it made explicit that, since feedback processes respond to the entire reference temperature, the sum of emission temperature and the minuscule natural and anthropogenic perturbations thereof, even a very small change in the feedback regime would engender a very large change in equilibrium sensitivity.
The fact that at any given moment the feedback processes then extant must perforce respond equally to each Kelvin of reference temperature then subsisting does not necessarily require that the system be linear.
Saying that feedback processes must respond “equally” to each Kelvin, implies to me a linear response. I’m not sure what else it could mean.
If you are saying this only applys to the temperature “then subsisting”, and that it may respond differently to future rises then I think that’s what people have been trying to tell Monckton. You simply cannot assume that the ratio of feedback response to the entire reference temperature will be the same for any additional warming.
Bellman, as usual, writes without knowledge and without intention to attain the objective truth. Precisely because in this respect he reflects climatology at large, and because climatologists have little or no knowledge of control theory, we not only built our own test rig to ensure that what the equations in any event mandate will indeed occur in reality, but we invited a national laboratory to build its own rig. The lab came to the same conclusion.
Whether Bellman or any other climate Communist likes it or not, at any given moment the feedback processes then subsisting must respond equally to each Kelvin of the entire reference temperature then obtaining. They can do no other, for they are inanimate and they have no way of distinguishing between a Kelvin of emission temperature and a Kelvin of reference sensitivity to greenhouse gases.
However, nothing in that statement in any way implies that the unit feedback response and hence the system-gain factor will be invariant with temperature. The head posting, which “Bellman” ought perhaps to have read before seeking to comment inexpertly on it, explicitly draws attention to the fact that, precisely because emission temperature constitutes 97% of reference temperature, even a very small change in the feedback regime over time might exercise a very large change in equilibrium sensitivity. Anyone less ill-educated than Bellman would recognize that this fact is equivalent to the statement that unit feedback response is not necessarily invariant with temperature.
I’m not claiming to be any sort of expert. I’m just trying to understand your logic.
“The head posting … explicitly draws attention to the fact that… even a very small change in the feedback regime over time might exercise a very large change in equilibrium sensitivity.”
I think this is the point where we keep talking past each other. Monckton is talking about a change over time, but I’m saying the feedback response does not have to be linear, or proportional, to temperature.
What Monckton is arguing is that the feedback response must be given by kt, where t is the absolute temperature before feedbacks, and k is some specific fraction. This is the only interpretation for the claim that feedback response has to be the same for each Kelvin, and is required to make the assessment for k of around 0.1, based on previous temperatures.
Now what Monckton seems to mean when he says the feedback regime over time, is that you could have a new value for k, say k_1, but it still would be just a different linear function k_1*t. In which case a small change in the value produces a large response as it’s multiplying a large value of t.
But all of this is still on the unproven assumption that this is the only possible equation for feedback response. What I’m saying is that the the equation might not be directly proportional to t. Irrespective of time.
If the actual response was kt^2, or ke^t, or even kt + b, any calculation based on just assuming a proportional response and extrapolating it from one specific value for t will not give you a correct response for future temperature changes.
You are making stuff up. What do you think these “tipping points” would be that cause such a “jump” to an entirely new climate with new feedback functions? You make a hypothetical claim but provide no factual basis to explain your hypothesis. Hard to formulate a response to such an “Argumentum Ad Speculum”!
“What do you think these “tipping points” would be that cause such a “jump” to an entirely new climate with new feedback functions?”
It was Monckton who was claiming the feedback regime might change over time. I’m saying the function doesn’t have to change over time, it just has to be no linear with respect to temperature.
“You make a hypothetical claim but provide no factual basis to explain your hypothesis.”
I’m not the one making a claim. I’m not saying I know how the feedback function works, or even saying for certain that it isn’t linear, though that seems very unlikely.
All I’m pointing out is the Monckton doesn’t provide a factual basis for his claim that all feedback responses must perforce be linear and proportional to the entire absolute temperature range.
“ I’m saying the function doesn’t have to change over time, it just has to be no linear with respect to temperature.”
Yet you can’t give even a single example of an atmospheric process that is non-linear.
Utter lies now. I’ve mentioned several, including the most important, water vapour.
And again, the onus is not on me to prove that nonlinear feedbacks exist. It’s for Monckton to prove that all feedbacks must be linear.
Exactly what do you think exists in the atmosphere that could give a k^2 or ke^t response? It’s not aliens. Be specific.
“Exactly what do you think exists in the atmosphere that could give a k^2 or ke^t response? It’s not aliens. Be specific.”
They were examples of non-linear functions, not an assessment of actual feedback responses. It’s not up to me to model how the actual atmosphere works – it’s up to Monckton to justify his assertion that the only possible function is kt .
I doubt if there’s a simple equation that describes all the complexity climatic feedbacks. That’s why there is still so much uncertainty about the correct ECS.
“They were examples of non-linear functions, not an assessment of actual feedback responses”
In other words you *were* just trying to muddy the waters.
Stop it.
I see “muddy the water” is your new catch phrase. I wonder where you got it from.
Really, do I have to spell out to you that when I said “if” I meant the equations were just examples of what a non-linear equation might look like, rather than a detailed real world model of the entire feedback response? I apologise if I credited you with too much intelligence.
“Really, do I have to spell out to you that when I said “if” I meant the equations were just examples of what a non-linear equation might look like, rather than a detailed real world model of the entire feedback response? I apologise if I credited you with too much intelligence.”
In other words, you are *STILL* trying to rationalize your attempt at muddying the waters as being something “good”. Stop it!
As usual, you are stuck in a little world of your own making which has no relationship to the real world.
“You are trying to muddy the waters” says someone who has spent multiple posts debating whether kt^2 is an accurate model for a feedback response, whilst completely ignoring the substantive point I was making. If the feedback response is not linear then Monckton’s claim is wrong.
So what? If pigs could fly …
If you can’t give a reason for claiming the feedback response is not linear then why even bring up the subject other than to muddy the waters?
Correct – The response is highly non-linear. Once ice forms on an ocean surface it no longer responds to forcing in the same way as it did before. It takes a change 198W/m^2 of solar forcing to move the Southern Ocean 1C. A combination of sea ice and persistent condensing cloud.
Within most of the tropics, the response to solar forcing is negative. More sunlight results in cooler temperature once the ocean surface gets above 26C. Ocean surface cannot sustain a temperature above 30C. It is hard limit set by the atmospheric mass and physical properties of water. Most people who live or have lived in the tropics are aware of only two season – wet and dry. I looked forward to January/February in northern Australia because that is when the monsoon set in and the relentless sun was often behind cloud.
Snow covered land reflects much more sunlight than land covered with growth or barren dry land.
The temperature response to solar forcing on land in mid latitudes is twice that of water at the same latitude. Central USA requires a change of just 13.5W/m^2 to move the temperature 1C. The Mediterranean requires a change of 28W/m^2 to shift the temperature 1C.
Biomass makes a huge difference to the response of land. The tropical rain forests respond more like ocean surface than barren land mid latitude land surface.
“They can do no other, for they are inanimate and they have no way of distinguishing between a Kelvin of emission temperature and a Kelvin of reference sensitivity to greenhouse gases.”
Nobody is saying they have to know what to do. They a physical responses to specific temperatures. A pot of water doesn;t need to know it has to respond differently at 272K verses 372K, and not knowing does not mean that if water boils at 372K, it must half-boil at 186K.
Bellman appears to be deliberately trying to muddy the waters. We are not dealing with 272 K vs. 372 K. We are dealing with a single moment at which, whatever the reference temperature is, the feedback processes then extant must perforce respond equally to each Kelvin of the reference temperature at that moment.
However, the unit feedback response at that moment is not necessarily identical to the unit feedback response to a different reference temperature obtaining at a different moment.
All he knows how to do is muddy the water.
I think you typed a little too fast here. The feedback processes respond to the output which, in turn, is a response to both the input and the feedback signals.
“Bellman appears to be deliberately trying to muddy the waters.”
I thought my point was clear enough. Monckton claims that inanimate objects cannot respond differently at different temperatures, but must to every Kelvin in exactly the same way. Whatever he claims, this implies a linear proportional response.
If inanimate objects behave differently at different temperatures then there is no point in dividing the response at a specific temperature by that temperature in order to predict how it will behave at a different temperature.
“However, the unit feedback response at that moment is not necessarily identical to the unit feedback response to a different reference temperature obtaining at a different moment.”
Yet that’s the assumption that Monckton makes when he tries to calculate sensitivity from past values. What does
287.5 / 267.1, = 1.0764
tell you about climate sensitivity if another degree rise gave you, hypothetically
290.5 / 268.1 = 1.0836
If you admit the feedback response may be non-linear with respect to temperature, the the ratio of feedback to any specific absolute temperature is useless.
“If inanimate objects behave differently at different temperatures then there is no point in dividing the response at a specific temperature by that temperature in order to predict how it will behave at a different temperature.”
Please give us a specific example of something in the atmosphere that responds differently at temperature T1 then it does at temperature T2.
If you can’t then you *are* just trying to muddy the waters.
“Please give us a specific example of something in the atmosphere that responds differently at temperature T1 then it does at temperature T2.”
Water vapour.
ROFL!! And exactly what does this have to do with feedback in the atmosphere from CO2? What does it have to do with the ECS? What does it have to do with feedback at all?
You are *still* throwing out crap hoping some of it sticks to the wall. Stop it!
I sure if you stopped rolling about the floor and instead tried to think, you could figure it out for yourself.
You asked for a specific example of something in the atmosphere that responded differently at different temperatures. Water vapour was my specific example.
You want to now move the goal posts and relate it to feedbacks, which results in an own goal for yourself, as water vapour is related to climatic feedbacks. Indeed it may be one of the most important.
So do I need to draw any more dots for you? I’m guessing I do from past experience. So, if water vapour does not increase in the atmosphere proportionally to absolute temperature, and if it’s feedback effect is related to the proportion of water in the atmosphere, do you think it’s reasonable to assume that this feedback response will be proportional to absolute temperature?
“You asked for a specific example of something in the atmosphere that responded differently at different temperatures. Water vapour was my specific example.”
And you were wrong. Water vapor doesn’t respond differently at different temperatures unless you are speaking about a phase change point. Relative humidity might change but the water vapor response causing that relative humidity won’t change its response.
The entire subject is concerned with feedback response in the atmosphere. It is *YOU* that is wanting to discuss something different.
“So, if water vapour does not increase in the atmosphere proportionally to absolute temperature”
Water vapor in the atmosphere is *NOT* determined by temperature. If it was then the air over a desert would be very humid. You *really* need to stop and think once in a while instead of just throwing out stuff you hope will stick and then trying to defend it.
“do you think it’s reasonable to assume that this feedback response will be proportional to absolute temperature?”
A function that is “proportional” is LINEAR by definition. You can’t prove a function is non-linear by claiming it is linear. You are in a hole, stop digging.
“And you were wrong. Water vapor doesn’t respond differently at different temperatures unless you are speaking about a phase change point.”
Do you really not understand how these feedbacks work, or are you just trying to distract from Monckton’s inability to support his claim?
It has nothing to do with water changing it’s properties at higher temperature. It’s just that the warmer the atmosphere the more water can be held, and hence the greater the greenhouse effect.
“The entire subject is concerned with feedback response in the atmosphere.”
No. It’s about all feedbacks on temperature, regardless of where they occur.
“Water vapor in the atmosphere is *NOT* determined by temperature.”
Every thing I’ve seen on the subject says it is.
“You *really* need to stop and think once in a while instead of just throwing out stuff you hope will stick and then trying to defend it.”
You really need to stop these cheap ad homs if you want anyone to think you are making a serious point.
“A function that is “proportional” is LINEAR by definition.”
Yes that’s what I’m saying. But it’s important to distinguish between a general linear function, and what Monckton claims, which is one that is proportional, i.e. goes through zero zero.
“You can’t prove a function is non-linear by claiming it is linear.”
Of course not. What a weird thing to say.
“. It’s just that the warmer the atmosphere the more water can be held, and hence the greater the greenhouse effect.”
The operative words here are *CAN BE”! Warmer air *can* hold more water. But it is *NOT* the temperature that determines the humidity! It is the amount of water vapor available that determines the humidity. You can’t even get this relationship correct!
Humidity ≠ C * T.
Humidity = Mass_wv/Mass_saturated-air
There is no Temperature in this equation!
“Every thing I’ve seen on the subject says it is.”
You never *see* anything except your pre-determined conclusions based on no actual knowledge at all.
“Yes that’s what I’m saying. But it’s important to distinguish between a general linear function, and what Monckton claims, which is one that is proportional, i.e. goes through zero zero.”
More meaningless word salad.
As usual, you just show yourself to be a troll who is unwilling to learn anything.
Bye!
Consider the claimed water vapour feedback. Multiple sources assert to me, with a straight face, that the total effect caused by (non-condensing) greenhouse gases has to take into account water vapour responding to the greenhouse forcing.
Somehow water vapour is supposed to amplify the back-radiation of non-condensing greenhouse gases such as carbon dioxide WITHOUT responding to the thermal radiation of the earth, the back radiation of the water vapour itself (or that coming in from the sun itself). Exactly how would this magical property come to be?
IF there is any feedback to the enhanced greenhouse effect, it is inconceivable that there is not ALSO some feedback to the base signal.
You are making arguments with no basis in facts. Argumentum Ad Speculum. These don’t deserve any attempt to answer.
“ A pot of water doesn;t need to know it has to respond differently at 272K verses 372K, and not knowing does not mean that if water boils at 372K, it must half-boil at 186K.”
Put down the bottle. This makes no sense at all.
“They a physical responses to specific temperatures.”
I’ll ask again. Exactly what in the atmosphere do you think responds differently at 272K than it does at 372K?
I know it makes no senses. That’s why the the claim that inanimate objects must behave in a proportional way to temperature makes no sense. Thanks for agreeing with me.
“Exactly what in the atmosphere do you think responds differently at 272K than it does at 372K?”
Water vapour, clouds, and ice coverage for a start. Maybe things like the jet stream and ocean currents. It’s irrelevant because hopefully we are not going to warm to 372K.
Water vapor responds the same at different temperatures. If it didn’t it would violate Planck and S-B.
And ice coverage? Do you think ice somehow acts differently at 0C then it does at -10C? Once the water is frozen how do you make it *more* frozen?
The jet stream is wind. Wind is a fluid. It can be analyzed as a fluid. The only difference temperature might make is in its density. At the same altitude, i.e. in the jet stream, how much do you think its density varies?
Do you *really* think ocean water acts differently at 10C than it does at 20C? Have you ever jumped in a cold swimming pool? Did the water act any differently then why you jumped in when it was warm?
You are, as usual, throwing crap against the wall hoping something will stick. Stop it
“Water vapor responds the same at different temperatures.”
You think atmospheric water vapour increases linearly from 0K to 372K?
“Do you think ice somehow acts differently at 0C then it does at -10C?”
The question is if ice coverage is proportional to absolute temperature. Don’t you think it’s possible that below a certain temperature there will be 100% ice coverage, and above a certain temperature there will be 0%?
“Do you *really* think ocean water acts differently at 10C than it does at 20C?”
You were asking about the difference between 0°C and 100°C. And again the claim by Monckton is any feedbacks have to be proportional to the absolute temperature.
I think the response of water vapor is the same. It’s radiation is set by Planck and S-B. Are you trying to imply that that Planck and S-B are wrong?
The coverage of ice changes the albedo. Is the change in albedo directly related to the amount of ice?
And where did I talk about 0C and 100C? Do you think water boils in the ocean, on land, or in the atmosphere? You are, once again, living in a personal la-la land instead of reality.
Talk about muddying the waters. All I’m trying to get you or Monckton to explain is why you think the feedback response has to be proportional to absolute temperature. I.e. justify the assertion that feedbacks must perforce respond equally to each Kelvin. I give several examples of physical systems that are clearly not responding equally to each Kelvin, and all you can do is try to argue the toss about radiation and albedo.
It doesn’t matter. You or Monckton are the ones claiming every feedback must be proportional to the absolute temperature. If you can explain how Planck and S-B can result in the feedback from increased water vapour is proportional to the absolute temperature, or how the albedo of the planet will change proportionally to every Kelvin, then by all means do. Otherwise you are just, to use one of your cliches, throwing crap against the wall and hoping it will stick.
“ All I’m trying to get you or Monckton to explain is why you think the feedback response has to be proportional to absolute temperature.”
You won’t listen, no matter how many times you are told. See the attached image ONE MORE TIME!
“All I’m trying to get you or Monckton to explain is why you think the feedback response has to be proportional to absolute temperature. I.e. justify the assertion that feedbacks must perforce respond equally to each Kelvin.”
You’ve been shown this and told this multiple times. Yet you just keep on refusing to learn. See the attached image. Once B1 and R1 enter the summing node HOW DOES THE SYSTEM SEPARATE THEM OUT? The “Kelvin’s” associated with each are not tagged somehow with their origination source! So to the system a Kelvin from one is just like the Kelvin from the other.
” I give several examples of physical systems that are clearly not responding equally to each Kelvin, and all you can do is try to argue the toss about radiation and albedo.”
You’ve given examples that do *NOT* depend on temperature while trying to get everyone to believe they do. Relative humidity does *NOT* depend on temperature. If it did then the air over the Mojave Desert would be more humid than the air over Milwaukee because the air over the Mojave Desert has a higher temperature. Somehow you can’t seem to figure that one out at all!
You have demonstrated over and over again that you have no understanding of the physical world at all. Stop trying to prove you do. You just confirm that you don’t with every claim you make.
“See the attached image. Once B1 and R1 enter the summing node HOW DOES THE SYSTEM SEPARATE THEM OUT? The “Kelvin’s” associated with each are not tagged somehow with their origination source!”
It doesn’t have to. It just has to respond differently at different temperatures.
“Relative humidity does *NOT* depend on temperature.”
Another feeble attempt at a distraction. I said nothing about relative humidity. It’s absolute humidity that matters – how many water molecules there are in the atmosphere.
“It doesn’t have to. It just has to respond differently at different temperatures.”
Exactly WHAT has to respond differently? Water vapor? CO2? Do you have any links that show that either operate differently at different temperatures? Does their absorption frequency change? Does their emission frequency change?
“Another feeble attempt at a distraction. I said nothing about relative humidity. It’s absolute humidity that matters – how many water molecules there are in the atmosphere.”
Do you love making a fool out of yourself?
Absolute Humidity: The absolute value of Humidity value gives us the total weight of water vapor per volume of air without considering the temperature. It can be calculated by dividing the total amount of water vapor mw by the given volume V of air. (bolding mine, tg)
Go away troll. No more replies from me.
“And where did I talk about 0C and 100C?”
Your exact words
Actually, 372K is *NOT* 100C. Go look it up!
OK nitpicker. It’s 373.15K. Happy now, or do you want to bring up any more distractions?
You have gone off your rocker.
You would be taken more seriously if you responded to Bellman politely and spent less time insulting him.
When you make specious arguments what should you expect in return as a reply?
Do *you* know what in the atmosphere gives a feedback response like kt^2 or ke^t?
When someone furtively anonymous is paid to talk nonsense and to divert attention from the objective truth, I shall not be polite to him. Precisely because he is anonymous, I can call him all the names I like without doing him any harm. That is the price he pays for his poltroonish anonymity.
Regrettably, you would less than wise to respond to Bellman politely, as Bellman has proven to be aggressively mendacious ( or is that mendaciously aggressive) in his postings. Polite response may be mistaken for respect for the poster and his arguments, neither of which deserves any.
Stand aside, the expert has arrived!
“You simply cannot assume that the ratio of feedback response to the entire reference temperature will be the same for any additional warming.”
The positive feedback of a warmer troposphere holding more water vapor obviously has a limiting factor, otherwise there would have been runaway global warming in the past. We know that CO2 levels have been up to 10x higher than today. We also know that fact did not lead to runaway warming. The obvious conclusion is that something limits the water vapor positive feedback — and the CAGW that Climate Howlers fear. My guess is that more water vapor in the troposphere leads to more clouds, which reduce incoming solar energy. Your guess is as good as mine.
You so badly want to have CAGW be true that you create things in your mind that are not possible.
To have non-linear feed back means there is an asymptotic curve either going up or going down. If we are on an increasing curve then the current ECS range is way too small. If we are on a decending curve, then the ECS range is way too big. You can’t have it any other way without saying there are limits. The basic limits would be an ice covered earth or a boiling surface with no surface water whatever. Take your pick.
“You so badly want to have CAGW be true…”
I absolutely do not want anything catastrophic to happen.
“To have non-linear feed back means there is an asymptotic curve either going up or going down.”
I’m not sure you know what you are talking about at this point. What has asymptotic curves got to do with this? Why do you think a non linear feed back will inevitably lead to a much greater ECS value the ones currently estimated? Why would you think there aren’t limits to any real world feedback response?
Show us something non-linear that doesn’t have an exponential term in it. What occurs with exponential graphs? You might discuss the hockey stick temperature graphs. Do you think the go on forever? They are certainly designed to look that way!
I didn’t there were no limits. I said the BASIC limits are an ice covered earth or a boiling earth. If you want limits between those, establish what they are and why they operate as limits.
“Show us something non-linear that doesn’t have an exponential term in it. What occurs with exponential graphs?”
A polynomial, a sine function, a sigmoid function, a linear piecewise function, etc.
“If you want limits between those, establish what they are and why they operate as limits.”
You keep confusing me with someone who has a radical new hypothesis and is eager to prove it. I don;t have to do any such thing. This is Monckton’s project, his claim, he’s been making it for 5 years now, but still won’t offer any evidence that all feedbacks must be linear. His only argument is that Control Theory says so, but won;t provide a reference, or explain why there’s a whole section of CT dedicated to nonlinear systems.
“A polynomial, a sine function, a sigmoid function, a linear piecewise function, etc.”
What kind of polynomial is not linear? Is y = mx + b a polynomial?
sine function?
sin(θ) = (e^jθ + e^-jθ)/2
Tell me again how the sine wave has no exponential associated with it?
A piece-wise linear function? Tell me again what in the atmospheric temperature is represented by a piecewise linear function.
Your math skills are no better than they were a year ago. Why do you insist on making a fool of yourself and then complain when it is pointed out to you?
“What kind of polynomial is not linear?”
Any with a degree greater than 1.
“Is y = mx + b a polynomial?”
That’s a linear polynomial with degree 1.
“Tell me again how the sine wave has no exponential associated with it?”
Of course you can define a sine wave in terms of imaginary exponential terms. I assumed you were talking about real exponential terms, in the context of “What occurs with exponential graphs?”.
You still haven’t begun to explain your point, about how non linear feedbacks will force the temperature to get very hot or very cold, but instead keep using your usual distractions, and then refusing to ask any more questions.
I can’t help it if you don’t know basic trig equalities. And whether the exponential is real or imaginary makes no difference.
You don’t even understand that x^2 is asymptotic as x approaches infinity. It’s no wonder you don’t understand that the limit of such a function means the temperature will approach infinity, i.e. very hot.
“You don’t even understand that x^2 is asymptotic as x approaches infinity.”
Asymptotic to what? Could you provide some reference to exactly what you are trying to say, as you seem to be using the word in a way I’m unfamilar with.
To me asymptotic meas that function g is asymptotic to function f if f(x) / g(x) -> 1 as x -> infinity.
x^2 is asymptotic to any quadratic function with a coefficient on the x^2 of 1. e.g. x^ is asymptotic to x^2 + 5x – 20.
But if, you mean is there a linear asymptote to x^2, the answer is obviously no.
“It’s no wonder you don’t understand that the limit of such a function means the temperature will approach infinity, i.e. very hot.”
You do realise that a linear function will also approach infinity as x tends to infinity?
The graph approaches a vertical line. It’s just that simple.
You do not understand derivatives or integrals. The SLOPE of x^2 goes to infinity as x grows. The SLOPE of a linear function stays the same.
Why do you think I asked about the derivative?
Stop trying to defend your indefensible claims. You just look more and more foolish.
“The graph approaches a vertical line. It’s just that simple.”
You clearly didn’t understand the maths classes you did take.
I’ll ask again, if there’s a vertical asymptote, tell me what it is and prove the function approaches it.
“Why do you think I asked about the derivative?”
Because you wanted to distract from the fact you didn’t understand what an asymptote was?
Seriously, this argument by riddles is getting very old. You made a claim about nonlinear feedbacks, that they would inevitably get very hot or cold, and so far have done absolutely nothing to justify that claim, apart from some hand waving about asymptotes and differentials. Instead you’ve just asked me inane questions, attacked my education and understanding, and otherwise insulted me, as you always do. If you had a coherent argument you would make it rather than waste both our times.
Stop whining.
“You don’t even understand that x^2 is asymptotic as x approaches infinity.”
Bellman, who clearly has a good knowledge of calculus, is of course right. That statement is nonsense. Asymptotic to what?
Stokes shows up to defend one of his groupies…
See if you can sort out the right answer, Nitpick.
Here is the Wolfram definition:
“Informally, the term asymptotic means approaching a value or curve arbitrarily closely (i.e., as some sort of limit is taken). A line or curve A that is asymptotic to given curve C is called the asymptote of C.”
You can’t just say that a curve A is asymptotic; you have to say what C it is asymptotic to.
So you could say x²+1/x is asymptotic to x² as x→∞.
But to say that x² is asymptotic is just painful nonsense. Like saying its derivative is equal.
Asymptotic to reality. See the attached graph.
“I’m not sure you know what you are talking about at this point. What has asymptotic curves got to do with this?”
Is anyone surprised that bellman doesn’t know what an asymptotic curve is?
More ad homs in place of an argument. I didn’t ask what an asymptotic curve was, I asked how it was relevant.
Is a quadratic function asymptotic? Is an exponential function asymptotic?
*YOUR were the one that suggested the feedback function could be a quadratic or exponential function.
And now you are whining about it when someone points out what that implies?
ROFL!!
All functions are asymptotic to some function if that’s what you mean. If you mean do they have vertical or horizontal asymptotes, the answer, I think, is that a quadratic function has neither and an exponential function has a horizontal but not a vertical one. If I’m wrong feel free to post a reference.
Now will you quite these stupid games and just explain what you are trying to prove.
What is the derivative of x^2? What does the derivative of x^2 go to as x goes to infinity?
I’ve told you in the past that you need to take a basic calculus course. That still stands.
“What is the derivative of x^2? What does the derivative of x^2 go to as x goes to infinity?”
2x, infinity. Need any more help with your homework.
“I’ve told you in the past that you need to take a basic calculus course. That still stands.”
Yes, because you gets off on putting down anyone you imagine knows less about a subject than you. The fact that this includes anyone who disagrees with your mistakes just illustrates the hole you are in.
If you could only devote the same energy explaining what you are actually trying to say, maybe this would be over much quicker.
“2x, infinity. Need any more help with your homework.”
In other words the slope goes up faster than x goes up. When the slope of a function approaches infinity isn’t it approaching a vertical line? That is a perfect example of an asymptotic function!
Yet you said: “If you mean do they have vertical or horizontal asymptotes, the answer, I think, is that a quadratic function has neither “
You *really* do not understand basic calculus.
“Yes, because you gets off on putting down anyone you imagine knows less about a subject than you.”
When you CONTINUALLY lecture us on things you know nothing about yet are absolutely positive of there isn’t anything one can do except tell you to get an education. You refuse to learn from *anything* people point out to you, remaining sure that what you believe from a zero knowledge base is absolutely correct.
Saying that a quadratic equation is not asymptotic is just one more example. Just like saying that temperature determines humidity. Just like saying that data from 40 years ago for a cyclical process carries equal weight as current data. Just like saying that uncertainty always cancels and that the standard deviation of the sample means is the uncertainty of the average.
If you get tired of people correcting you all the time then perhaps you should actually listen and learn instead of just making up crap to throw against the wall in the faint hope something will stick!
“In other words the slope goes up faster than x goes up.”
That’s why it’s an example of a nonlinear function. But other nonlinear functions are available, not all have slopes that go to infinity. This is probably true for most if not all real world functions as nothing goes on to infinity. (Apart from these arguments).
“When the slope of a function approaches infinity isn’t it approaching a vertical line?”
Nope. A bit of thinking should suggest this is impossible. Assume there was a vertical x = w which was an asymptote for x^2. That would imply that x could never be bigger than w, but in fact x can tend to infinity.
“You *really* do not understand basic calculus.”
If you can find a citation for a quadratic equation having a vertical linear asymptote, present it. Until then consider you may be mistaken.
“When you CONTINUALLY lecture us on things you know nothing about yet are absolutely positive of there isn’t anything one can do except tell you to get an education.”
You could try justifying your claims, or consider you may be wrong.
“Saying that a quadratic equation is not asymptotic is just one more example.”
I said it was asymptotic to a quadratic equation. It’s not asymptotic to a line. If you disagree show your work. Tell me exactly which line it is asymptotic to.
“Just like saying that temperature determines humidity.”
It has an effect on humidity. If you increase temperature you either need more absolute humidity of less relative humidity. Even if you have some untested hypothesis that overall water vapour won;t increase as the world currently warms, you are still seeing water vapour as a nonlinear feedback. It’s not possible for there to have been half as much water vapour at 140K as there is at 280K.
“Just like saying that data from 40 years ago for a cyclical process carries equal weight as current data.”
I’ve never said that. I’ve made no predictions of what future warming will be like. I just prefer to look at all the data, rather than looking just at the last 8 years, whilst ignoring the last 15. What would your forecast have been in 2014 based on the most recent data?
“Just like saying that uncertainty always cancels and that the standard deviation of the sample means is the uncertainty of the average. ”
I’ve never said uncertainty always cancels. How many more of these strawmen do you have. What I disagreed with is your assertion that uncertainties increase with bigger the sample.
And I don’t say that the standard error of the mean is always the uncertainty of the mean, but that it’s a good starting point. A lot of statistics is understanding the basics and then worrying about why they might not always apply. SEM is a description of the uncertainty of the mean, subject to a large number of assumptions, for instance that there is no bias in the sampling.
“That’s why it’s an example of a nonlinear function. But other nonlinear functions are available, not all have slopes that go to infinity. This is probably true for most if not all real world functions as nothing goes on to infinity. (Apart from these arguments).”
“Nope. A bit of thinking should suggest this is impossible. Assume there was a vertical x = w which was an asymptote for x^2. That would imply that x could never be bigger than w, but in fact x can tend to infinity.”
We are back to talking about the theoretical world vs the practical world. Since the slope of the curve grows without bounds it approaches vertical, see the attached graph. This means that there is no bound on the growth of the heat or the cold temperature.
“We are back to talking about the theoretical world vs the practical world.”
Translation: You didn’t know what asymptotic meant, but thought it sounded impressive.
“We aren’t talking about other non-linear functions.”
Why not. I am. I keep suggesting a sigmoid curve as an example of a non linear function. That seems much more likely than an unbounded quadratic equation.
And it really doesn’t matter what the actual nonlinear function is, as long as it’s close to linear over a reasonable range of values. The issue is that it’s unlikely to be proportional to the total temperature.
“It has an effect on humidity”
Nope. It sets a bound on the maximum humidity but it has no affect on the humidity.
I gave you the definition of absolute humidity. Apparently you didn’t read it!
“I’ve never said that. I’ve made no predictions of what future warming will be like. “
Malarky! When you denigrate the eight year pause because it doesn’t give any weight to the past 40 years ago you *are* saying that the future depends on the past 40 years ago just as much as it does on the past eight years.
If the past data does *NOT* carry equal weight with current data then what is wrong with the trend line over the past eight years? Answer: nothing.
If a process is cyclical and you do *NOT* give current data more weight than past data then you will totally miss the inflection point where the cyclical process changes slope.
If you have no problem with the trend line of CoM then why are you complaining about it?
“I’ve never said uncertainty always cancels.”
Every time you claim the uncertainty of the average is the standard deviation of the sample means you *ARE* claiming uncertainty cancels. You are claiming the variation of the stated values of the data are what determines the uncertainty of the average and not the uncertainty of the component values.
You are never going to change your assumption that uncertainty always cancels so there is no reason to belabor this any further in this thread.
“What I disagreed with is your assertion that uncertainties increase with bigger the sample.”
It’s true. It will always be true. I’ve given you the proof from three different professors that this is true when you are combining multiple measurements of different things. It’s *exactly* what happens with variance when you combine independent, random variables. And you’ve never accepted that either although I’ve given you statements from at least three different textbooks that show it.
You simply refuse to admit that multiple measurements of the same thing are different than multiple measurements of different things. You do not live in the real world. You’ve even outright admitted that!
I’m not going down anymore of these rabbit holes at this time. You have demonstrated over and over that you are incapable of learning anything. The fact that you still haven’t figured out how to calculate the variance of the average of random variables is testament to that.
Irony overload.
There can be no ad hominem argument when the paid climate Communist in question lacks the courage to say who he is, but lurks behind a furtive pseudonym.
That’s a strange definition of “ad hominem“. Do you have a reference that says it can only be used against people who’s name you know.
In the modern sense an ad hominem is an attempt to suggest someone’s argument is wrong by attacking some aspect of the person, e.g. saying they are a communist, or claiming they are being paid to say what they say. It doesn’t matter if you know who that person is. Saying you don;t know who the person really is just makes it clear you have no basis for your claim.
To be fair, the comment I was responding to above wasn’t strictly an argument ad hominem, just the usual insulting language used as a substitute for an argument.
Probably unnecessarily complex.
If one proposes two complementary energy transfer loops namely radiative transfers within an atmosphere running in parallel with atmospheric mass motion transfers via convection and surface winds then any imbalance in one loop will be neutralised by an adjustment in the other loop so that ECS will be zero.
The only change will be in the distribution of energy in the system and not the quantity.
Mr Wilde may well be correct that the climate system is governed by the le Chatellier principle, whereupon – at least across the narrow interval of temperatures in the industrial era – changes in one part of the system are canceled by changes in other parts thereof. But that is an argument that requires proof. And proof requires a certain minimum of mathematical or logical effort. Hand-waving won’t do.
It’s not that hard, Christopher. Study up on the adiabatic temperature profile, how the function of convection is to restore it when it has been perturbed. There goes most of your sensitivity calculations.
Pochas94 is wrong. We make no sensitivity calculations. It is climatology that does those. We merely point out that, because emission temperature is so much larger than the natural greenhouse-gas perturbation, and because the natural perturbation is so much larger than the anthropogenic perturbation, it is impossible to use outputs from general-circulation models to diagnose feedback strengths properly and, from them, to obtain a reliable interval of equilibrium sensitivity.
And control theory is hard – very hard. That is why we have so many control theorists, and a national laboratory of physics, to assist us.
Christopher, it seems that you are not yet familiar with the work of myself and Philip Mulholland:
Return to Earth: A New Mathematical Model of the Earth’s Climate :: Science Publishing Group
All the maths and logic you need.
Time to get it peer-reviewed, then
If only.
I would only add that the only energy in the system is provided by the sun. Any increase over time must be the result of storage, i.e., a capacitor or inductor, and one must show how this is not a continuous process or we would have already burned up.
“The only energy in the system is provided by the sun”. Is that really true? One could argue we can dismiss other inputs as rounding errors, but that’s not the same as saying there are no other inputs.
Old Faithful is tiny, but it is constantly burping heat into the atmosphere. I concede that is a rounding error. But what about the volcanic activity deep in the ocean near Antarctica? Isn’t that a measurable, non-solar input? Isn’t there still underwater volcanic activity near the Hawaiian islands?
I think it is correct to say that deep mines are warm. Isn’t there reason to believe the earth is radiating heat and that heat has an impact on the surface and the atmosphere. (Again, I’m open to being shown how all of my examples only add up to a dismissible rounding error)
Mr Schilling’s instinct is correct, as a paper of some 14 years ago by Professor David Douglass of Rochester University makes clear. The heat from below us is significant and cannot safely be ignored. There are some 3.5 million subsea volcanoes, most of which have never been explored by Man. Professor Arthur Viterito is also doing some very interesting work in this field.
Let me add that I am discussing heat RADIATION, not conduction or other inputs. I grant that there are other inputs that can raise the temperature of the land/oceans.
That conduction conducted heat to the surface, from there it radiated. Some of that radiation was intercepted in the atmosphere and re-radiated back downward. Some of the conducted heat also got swept aloft by convection, only to then radiate, with some of that radiation also heading back downward.
Therefore, there are some photons coming downward today, heating the surface, whose lineage reaches back to the center of the earth, not to the sun.
I searched this document for the word “convection” and found it in your response, Stephen. Congratulations! You are one of the few that recognizes the elephant in the room of ignored physics. If there is any greenhouse effect it is due to the fact that the radiating zone is not the surface but at altitude, and that altitude can change.
The mean emission altitude, described by Professor Lindzen as the characteristic emission level, will tend to increase with temperature. That fact is, however, irrelevant to the argument in the head posting.
Well it’s not irrelevant to the question of Climate. If you want to know how the climate is changing, look at a weather service 500 mb height chart. The high pressure areas (high equivalent emissions height) are warm and the low pressure areas are cold. Leave a high pressure area in place long enough and you have a 1930’s draught.
Pochas94 is perhaps unaware that a warmer atmosphere tends also to be a moister atmosphere, thanks to the Clausius-Clapeyron relation. That is why the most comprehensive study of drought worldwide, Hao et al. (2014), showed a decline in land area under drought throughout the past 30 years. The droughts of the 1930s in America were far worse than anything since, except in some locations (such as downstream of Lake Mead) where excessive extraction has emptied the lake even though the inflow shows no trend.
Brother Moncton, I’m talking about high pressure systems, not “warmer atmospheres”. From Wikipedia “In meteorology, a low-pressure area, low area or low is a region where the atmospheric pressure is lower than that of surrounding locations. Low-pressure areas are commonly associated with inclement weather (such as cloudy, windy, with possible rain or storms),[1] while high-pressure areas are associated with lighter winds and clear skies.” Warmer atmospheres, if we ever see one, might carry more moisture, but I doubt it since evaporation depends on insolation which varies very little over vast time frames. Your moisture feedback is merely a warmist’s fiction.
The earth is not a greenhouse
Correct. To see the greenhouse effect you need a greenhouse. In the free atmosphere convection acts to remove the greenhouse effect and restore the adiabatic temperature profile. That’s all the negative feedback you need.
Pochas94 seems not to comprehend the entire climate system. Yes, there are negative feedbacks, but there is also positive feedback. And, as the head posting explains, the net feedback in the climate is weakly positive (not strongly positive, as had hitherto been imagined).
If feedbacks exceed about 1.2x the whole system blows up. Read your control theory text. Strong feedbacks are another pseudoscience fiction. If we’d ever been there, we wouldn’t be here.
You may wish to muse on Ole Humlum’s excellent website
http://www.climate4you.com/images/TotalColumnWaterVapourDifferentAltitudesObservationsSince1983.gif
which shows an actual decrease in column water vapor over the period of supposed accelerated global warming.
I think there is a clearer, more understandable way forward to illustrate this problem. We only just need to consider how planets and moons within our solar system are behaving, as opposed to how Earth is meant to behave with feedbacks.
Average temperatures (blue) and max tamperatures (red) from Mercury (left) to Neptune (right).
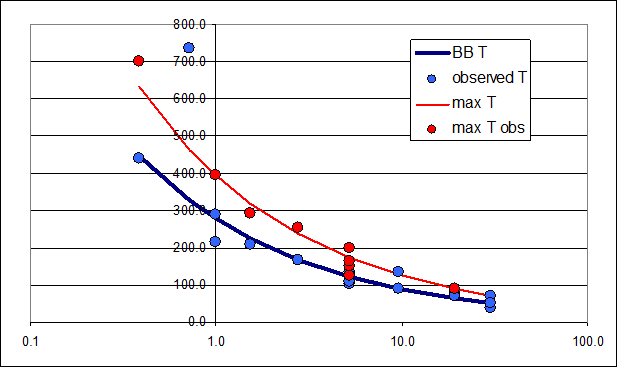
Earth with (only) a 2x feedback in red. Light blue dots: temperature of Venus at 1bar vs. Jupiter and Saturn at 92bar.
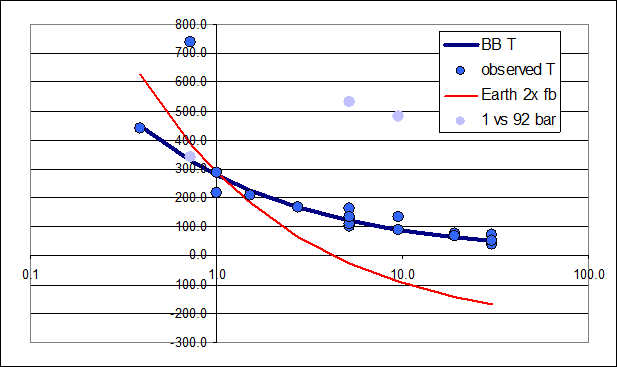
https://greenhousedefect.com/about-the-physical-impossibility-of-feedbacks
I find your planetary argument strongly convincing, Erich. Feedbacks are the foundation and the damnation of modern climate theory.
ES,
I’m not as convinced as Javier is. I get the ‘BB T’ line, but don’t find any anything anomalous re. Venus’ high surface temperature given that planet’s high albedo (lower T) versus its very dense CO2 atmosphere (much higher T). And if it doesn’t work for Venus, I don’t see why your simple 3x feedback curve for Earth (i.e., E2 = E1+ 3*(P1 – E1)) has any physical / logical meaning.
As for the gas giants and their moons, I have no idea how they (Wikipedia) derived their surface temperatures given that the former have no surface (as you pointed out, hence S-B doesn’t apply there) and the latter may be heated by tidal effects.
The S-B law does apply to gas giants, the question is just about what you regard as surface. The common definition is a surface at 1 bar pressure level.
As with “tidal effects” – yes they do heat moons, but that is their interior. There even tiny amounts of energy can accumulate over millions of years, similar to nuclear fission heating Earth. For surface temperatures this is highly irrelevant.
Well, that was quick! But I have a question re. this:
‘The common definition is a surface at 1 bar pressure level.’
I would think that for a gas giant, 1 bar pressure would be a reasonable approximation for the outer boundary of the atmosphere, so for all practical purposes, I_out = I_in. Therefore, wouldn’t it just be a tautology that the ‘surface’ temperature of the gas giants would be strictly a function of its solar distance based on the 1 bar criteria?
Not quite. Also the surface of Earth is mainly at 1 bar pressure level, but still deviates from the BB temperature of 278.5K. So there is a little “atmosphere effect” of ~8K, and of course a “greenhouse effect” of about 27K (not 33K!). The difference is in the latter only considering the LW effect of the atmosphere.
I’ll accept your ‘not quite’ as roughly equivalent to my ‘reasonable approximation’.
“…as it stood in 1850. That year is of interest because there was then a temperature equilibrium: there would be no temperature trend for 80 years thereafter.”
Interesting that there was no temperature trend for those 80 years, because those years were of tremendous industrial growth, all over the world. The building of the first skyscrapers, railroads, steel bridges, huge navies of the first dreadnaughts, mass produced cars and planes.
No reaction at all then to all that CO2 input.
PCman999 makes an excellent point. The usual suspects will try to argue that during the industrial revolution so much particulate matter was emitted that the temperature was kept constant notwithstanding the greenhouse forcing. But the truth is that the impact of greenhouse gases on temperature, though it exists, is a great deal smaller than official climatology, misled by its error, profitably imagines.
We have no idea if the global average temperature remained constant during the Industrial Revolution. The temperature data are too sparse to come to any meaningful conclusion about the global average temperature of that period.
If Mr Greene wishes to argue that the HadCRUT temperature record is incorrect, or its uncertainty interval inappropriate, then he should address his complaint not to us but to the keepers of the dataset. We simply accept ad argumentum all of official climatology except what we can prove to be false. Mr Greene cannot prove the HadCRUT record to be false; but we can prove climatology’s implrementation of feedback formulism to be false.
“No reaction at all then to all that CO2 input.”
Annual CO2 emissions were small before 1940, and not very important until after1950. The claimed global average temperature for most of those decades (pre-1900) is close to a wild guess, with insufficient accuracy for any conclusion. At best we can claim the average temperature appears to have been rising since the 1690s, which were the coldest decade of the Maunder Sunspot Minimum period. There are no accurate data for compiling a global average temperature in the 1850 to 1900 period. Whether the average temperature rose or fell a few tenths of a degree in that period is unknown. Those government agencies that claim to know are lying.
In fact, it is possible to reconstruct sea level over the past 1000 years quite reliably using multiple sources of sound data. What that reconstruction shows is that sea level was higher, and therefore the Earth warmer, in the mediaeval warm period than today; and that sea level was lower, and therefore the Earth cooler, in the little ice age than today. Sea level is arguably the best proxy for pre-thermometric global temperature change.
What CO2 input? CO2 emissions during those 80 years were almost negligible compared to current emissions. Even in 1950, human annual emissions were less than 15% of today’s emissions. In 1900 it was around 5%. In 1850 it was basically zero.
https://ourworldindata.org/grapher/exports/annual-co-emissions-by-region.svg
If CO2 is the control knob, then where did the warming of the 30s come from?
Not only is CO2 not the control knob, but it has no (significant) effect on surface temperature at all, IMO. I don’t know what caused the early 20th century warming, but there is evidence that absorbed solar (clouds) caused the warming of the last few decades, so I conclude cloud variability is the main cause of the multidecadal temperature change. Another thing that looks clear to me is that the variability is periodic/oscillatory with (~60 years cycle), with another longer cycle superimposed.
On longer multicentennial timescales, solar variability (grand minima/maxima) seems to be an important factor…
This ^
You realize that currently 97% of all CO2 is natural and only 3% is caused by human emission. And, there was similar CO2 natural emission in those 80 years – ergo your CO2 input. Beware that the level of CO2 in air was lower but this is a subject for a different discussion.
Re the pause, UAH result for September 2022 version 6.0 for lower troposphere over Australia extends the pause to 10 years 3 months.
If there are a few more months ahead of the Sept type (-0.29C) then this pause will start chewing back into many months before Aug 2012, the present start. Cheers Chris, Geoff S.
http://www.geoffstuff.com/uahsep.jpg
Sorry, Please make that
http://www.geoffstuff.com/uahoct.jpg
Christopher, what is the most common reason given for not including the whole T in the feedback equation? Do you elicit a response, or just a vacant look as if the answer is well-known and you are a dunce for not knowing about it?
More and more, even in everyday life. an answer to my question seems to be that stare of voluntary uncomprehension, followed by a sneer. I met it again yesterday when I asked my pharmacist why she dispensed my medications to the rules of an unseen, unelected bureaucrat, rather than the usual way of doing what the GP directed.
Anthony, thank you for hosting this discussion month by month. I am not seeking to bypass your preferences, merely doing a tidy of some loose ends. Geoff S
Geoff,
The standard answer is that feedbacks are nothing more than Taylor series
written differently. See Roe’s article for the details:
https://climate-dynamics.org/wp-content/uploads/2016/06/roe09a.pdf
The fact that Mr. Monkton appears incapable of understanding this would also appear to be a case of voluntary uncomprehension.
Maybe it’s your misunderstanding of feedbacks 🤔
Go back and read the paper with some understanding. The basic equation used at the start of the paper is:
λ = ΔT / ΔRf
This is a linear equation between temperature and radiation. Would you tell us how this was derived while knowing full well that Stefan-Boltzmann shows a 4th power relationship instead?
I could find nothing in the paper to give that derivation. Perhaps you know of one that starts with the S-B relation. Hint: read Planck’s thesis where he derives the S-B equation using heat radiation.
Control systems with feedbacks are much much, more complex than Taylor series, especially non-linear, chaotically coupled, multiple layers, multi-input systems.
Mr Sherrington is right and Mr “Walton” wrong. It is very clear from reading the early papers on climate sensitivity that it was generally considered that ECS must be high because – in round numbers – there was 32 K natural greenhouse effect in 1850 and 8 K direct warming by preindustrial noncondensing greenhouse gases, from which climatologists (including Sir John Houghton and James Hansen) drew the erroneous conclusion that ECS must necessarily be of order 32 / 8 = 4 K in response to 1 K direct warming by doubled CO2.
Once the necessary correction is made, ECS – which was definitely only 1.1 K based on the data for 1850 – could have any value today, because the emission tempeature of 260 K is 30 times the entire reference sensitivity to natural and anthropogenic greenhouse gases, so that even a tiny change in the feedback regime compared with 1850 will cause a large change in feedback response. For instance, just 1% increase in the system-gain factor compared with 1850 would entail a 300% increase in ECS compared with the value based on 1850 data.
Therefore, the models’ outputs cannot be used to derive equilibrium sensitivities, since the system-gain factors based on current data fall well within the giant feedback-strength uncertainty envelope. Accordingly, the fact that the world is warming at a small fraction of the originally-predicted midrange rate becomes of great signiicance. Globally, there has been no warming for eight years (my update on the New Pause should appear here shortly).
Mr “Walton” cites Roe (2009) with approval. It is a good and informative paper, and of course we are familiar with Taylor-series approximations. However, Roe makes the same mistake as all of us have in the past made: he does not take explicit account of the fact that at any particular moment the feedbacks then extant respond equally to each Kelvin of reference temperature, and not (as is currently imagined) solely to each Kelvin of reference sensitivities to greenhouse warming.
“Therefore, the models’ outputs cannot be used to derive equilibrium sensitivities, since the system-gain factors based on current data fall well within the giant feedback-strength uncertainty envelope.”
This is the entire crux of the problem! Uncertainty. We simply don’t know enough with small enough uncertainty to actually venture a guess at reality when it comes to ECS.
Geoff … a note on the UAH pause since August 2012 for Australia.
There have been 122 months since then. For Australia, the first 61 months have a UAH mean temperature anomaly average of 0.244C. The latter 61 months to September 2022 have an average of 0.226C.
In ACORN 2.2, the first 61 months average 1.059C and the latter 61 months average 1.045C.
Similar pause with a teensy decline in both datasets across Australia over the past 10 years.
There are plenty of reasons for the big difference between the two datasets (particularly as of July 2013), largely relating to 1972 metrication and the advent of AWS one second observations, but that’s a different story.
In the meantime, it would be wonderful if our media told the public that the mean temperature of Australia’s climate hasn’t changed for the past decade.
“for lower troposphere over Australia extends the pause to 10 years 3 months.”
Proof that Nut Zero is working in Australia !
Does anyone in Australia have any idea what UAH data are saying?
Or are they too concerned about the alleged “coming climate emergency” to care about actual climate measurements in the past 10 years?
CO2 has zero direct influence on earth’s energy balance. Climate of the past million years is entirely driven by earth’s orbit and the two powerful feedback processes that limit ocean water surface to the range -1.8C to 30C..
The attached is the frequency analysis of the 800kyr sea level reconstruction by Spratt. The peaks all align with orbital phenomena – precession in centennial scale; obliquity in millennia scale and eccentricity in 10kyr scale.
Antarctica and the Southern Ocean has been cooling since reliable records have been available. That alone contradicts any notion that CO2 causes warming. Likewise the Nino34 region has not budged in the satellite era – no trend over more than 4 decades.
All this feedback response to CO2 is just BS.
The Northern Hemisphere will continue to experience greater extremes; hotter drier summers and wetter winters. The SH will continue to moderate; cooler, wetter summers and drier winters.
Though it would be good to imagine that there is no feedback response, it is clear that in 1850 the reference temperature – the sum of emission temperature and directly-forced warming by the preindustrial noncondensing greenhouse gases – was about 267.1 K, while measured global mean surface temperature was more like 287.5 K. The difference, like it or not, is feedback response. However, nearly all of the feedback response is to emission temperature and very little of it is to the greenhouse gases.
MoB says”…directly-forced warming by the preindustrial noncondensing greenhouse gases…”.
There is no “directly-forced warming” caused by CO2. The emissivity of CO2 is so low at normal atmospheric pressure that it cannot cause warming.
Laboratory experiments dating back to 1851 show mkelly to be wrong.
We have no CO2 measurements before 1958. We only have rough estimates from ice core proxies before 1958. We also have no accurate global average temperatures for the Industrial Revolution decades.
But we do have lab experiments since the late 1800s that identify CO2 as a greenhouse gas. Greenhouse gases impede cooling, and the result is a warmer planet surface than would exist without greenhouse gases. Impedes cooling is more accurate than “causes warming”.
It’s a good thing the earth is not a greenhouse
(for 1850) “measured global mean surface temperature was more like 287.5 K”
You have no idea what the global average temperature was in 1850. Data are sparse, with almost no data for the Southern Hemisphere. You might as well pull a number out of a hat.
Mr Greene’s quarrel is not with me but with official climatology. If he regards the HadCRUT temperature series as incompetent, let him address his concerns to the keepers of that dataset, not to me. Our approach is to accept all methods and data in official climatology except those we can disprove. That minimizes the scope for useless argument or evasion.
I am going to disagree that this is , “feedback”. The difference in temperature is due to a couple of things. H2O absorbs near IR from the sun, even water vapor in the air. This warms the atmosphere directly when the vapor condenses. The atmosphere (N2/O2) is thermalized by CO2. This contributes to the warming of the atmosphere by means other than conduction with the surface. In essence, it decreases the conductivity of the atmosphere and makes it a better insulator. This is better dealt with using thermodynamics and entropy. Feedback doesn’t allow for these processes.
Mathematically, feedback formulism is more than capable of modeling feedback response to a direct reference signal, whatever the mechanisms of the signal or of the feedback processes.
I respectfully disagree that feedback can be used to describe what actually happens in the atmosphere in regards to energy power. Feedback requires a power combiner that either adds or subtracts to the input.
Heat transfer does not work this way. Planck uses the term “compensation” to describe the interaction between a hot and cold body. The hot body radiates at its temperature regardless of the presence of a cold body. Any radiation absorbed by the hot body from the cold body is compensated for by a reduced cooling rate of the hot body. The temperature of the hot body DOES NOT rise in the amount of the cold body radiation. If it did, the continual temperature rise of the hot body would never allow equilibrium.
To simulate this, you would need a power combiner that has a constant output regardless of the amount of the power of the feedback.
Yet 99% of climate science refers to power as “energy”.
We have several competent control theorists on our team. Feedback theory is applicable to all feedback-moderated dynamical systems, including climate, and there is no point in trying to pretend otherwise. The underlying mathematics is 200 years old at least.
Sure there are feedback responses. Very powerful with sharp temperature cut offs at -1.8C and 30C for ocean surfaces. But CO2 has zero influence on those feedback processes.
Earth’s temperature is regulated by two powerful thermostatic processes that operate near the tropics at the upper limit and near the poles at lower limit.
The Southern Ocean is cooling because the solar intensity is reducing, the tropics are stuck near 30C and the NH warming because solar intensity is increasing.
Rick,
‘CO2 has zero direct influence on earth’s energy balance.’
‘Climate of the past million years is entirely driven by earth’s orbit and the two powerful feedback processes that limit ocean water surface to the range -1.8C to 30C.’
I have not yet been able to link the LIA to orbital changes but it did occur when NH solar intensity was near its minimum in the current precession cycle. Till that time, the NH was in a long cooling trend. It is now in a warming trend overall but spring getting more sunlight and autumn less.
The solar output is not constant over decadal time frame. The two significant variations in the Nino34 region temperature, that drive global weather, are the switch in ENSO and the solar activity beat in the temperature that lags sunspot by 31 months and inverse of cosmic rays by 24 months. ENSO is most likely driven by salinity changes that cause Pacific warm pools to switch from west to mid Tropical Pacific. But these are decadal changes that drive weather.
The long term rise in deep ocean temperature that is driving sea level rise is due to the increasing spring solar intensity in the NH. That is reducing net evaporation from ocean to land during the NH summers and slowing down the water cycle; leaving more heat in the oceans. That will continue for a long time but will eventually be balanced by ice accumulation on land around the North Atlantic resulting in the ocean level falling again.
Thanks Rick. Like I said, the climate impact of orbital mechanics makes sense to me, as does the climate impact of plate tectonics on a much longer scale. What’s ‘missing’ is a coherent theory of (relatively) short-term climate change, which is why the ‘circular firing squads’ that form every time someone mentions solar impacts is frustrating, at least to me. Of course, we really don’t need to explain climate change on all time scales to negate climate alarmism – from my perspective, there is sufficient paleo data to bury any conjecture that CO2 is the climate ‘control knob.
When climate really changes, ocean surface level can rise or fall at a rate of up to 70m/kyr or 70mm/yr. This is serious climate change.
Last time perihelion occurred before the austral summer solstice was 500 years ago. Since then, the peak solar intensity has been moving north. Even with the current eccentricity near a minimum, the solar variation from perihelion to aphelion is 80W/m^2. Or about 25% variation of the average solar intensity.
So Earth right now is in the lowest rate of change because the SH is jut past maximum intensity and NH just past minimum intensity. The changes are accelerating and the NH will experience greater extremes.
The only way forward is adaption. Reducing CO2 is no different than burning virgins in the forests trying to stop climate change.
“CO2 has zero direct influence on earth’s energy balance.”
And perhaps you are right, and virtually every climate scientist in the world is wrong. But I’m betting on the scientists.
That’s an argumentum ad verecundiam, which has no place in science. Actually, 99.3% of scientific papers on the climate and related questions published from 1991-2001 did not state that our sins of emission were the principal cause of recent global warming (Legates et al. 2013). And that is one of the many reasons why the argument from the supposed reputation of imagined “experts” is an elementary logical fallacy. It is all too easy to assert that “scientists say” something or other when in reality they either don’t say it or even say the opposite.
In 25 years of reading climate science, with a STRONG focus on articles by “skeptic” scientists that refute CAGW, I have only found two scientists who appear to dismiss the greenhouse effect: Ed Berry and Murray Salby.
Based on my own experience, which is strongly biased toward finding skeptics, I believe 99.9% of climate scientists in the world believe there is a greenhouse effect.
So when a commenter comes here to declare there is no effect from CO2, or there is no greenhouse effect, I am entitled to question that claim.
Whether or not there is a greenhouse effect has nothing to do with manmade CO2 emissions. There was a greenhouse effect billions of years before there were manmade CO2 emissions.
One may question any scientific claim, provided that there is a scientific basis for one’s questioning. But one may not question a scientific claim by saying that n% of scientists support that claim. That is the argumentum ad populum, the logical fallacy of mere headcount.
I’ll go with Happer & Wingaarden’s latest paper on the subject, if nothing else. We need to move beyond the “there is no GHE” bullshit. The realistic arguments are about the direction and magnitude of the various feedback mechanisms.
The UN IPCC CliSciFi CMIP6 GCMs are acknowledged by researchers to run hot. A recent study demonstrated that the models with medium and high ECSs could not hindcast (replicate) past temperature measurements with any accuracy, especially those of UAH6. Low ECS models were better able to track measured temperatures, but nothing is perfect. Even the pollution (excess warming) of land surface records by the improper siting of measuring devices (see Anthony Watts and others’ work on siting issues) and UHI in general could not disguise the deficiencies of GCMs.
Okay, but what exactly does the term ‘deny the greenhouse effect’ mean? So far, the greenhouse effect seems to mean either of the following:
For (1) and (2) to be regarded as equivalent would require a substantive argument which I am reasonably sure does not exist. The model error of a model for an airless planet applied to an ocean planet covered with clouds does not seem like a reasonable estimate for the total effect of the greenhouse gases.
Dave Fair is correct that there is indeed a greenhouse effect, as may be readily discerned, and has been demonstrated, by experiment, and is understood down to the subatomic level. Happer and van Wijngaarden have correctly described the relevant science.
Luke B should know that climate science distinguishes between directly-forced warming by noncondensing greenhouse gases and the indirectly-forced warming directly proportional to the direct reference temperature that is known as temperature feedback.
To make the record clear, I am not in the “slaying the sky dragon” camp as everyone calls it: those that deny that IR active gases could change the distribution of heat in an atmosphere (what I called GHE #2.) I’ve reading enough material from that camp to have a pretty good idea of where it goes off the rails. Regarding there being a real phenomenon here, Happer and van Wijngaarden look far more careful than many others I have seen cited and I will probably study some of their work at some point in the future.
I am tired, however, of the continual use of a carelessly calculated 33K (GHE #1) in nearly every discussion on the greenhouse effect. Having looked again at your article, I see that you seem to have at least some agreement with me on this point. (It looks like Andy May and E. Schaffer in the past have questioned the reliability of the usual figure as well.)
Understanding this to be the case, I am curious as to whether you have also carried out this type of analysis of your article assuming more plausible values for some of the parameters. I am aware, of course, that for strategic reasons you would take estimates the alarmist camp would have a harder time contesting for the calculation, but would be curious what your conclusion are when using the most probable parameters.
So clearly unable to do your own research and verify or refute what I have stated.
Most of these scientific clowns believe in a “greenhouse effect” and “back radiation” and use models with cloud parameterisation. So I know they do not have a clue.
I do have regard for the late Michael Mishchenko, the NASA/GISS physicists who went to the trouble of proving that back radiation does not exist because he simply found Hansen’s energy balance diagram a joke..
People who think that radiation “photons” shoot about in all direction have asked how does an object in space communicate with another object in space to know which way to send the photons. The “photons” exist in the electromagnetic field and that field is a function of the objects and space between them. It is the same as Earth communicating with the sun in the gravity field. If they did not communicate in the gravity field Earth would not orbit the sun.
Back radiation has been measured and is increasing.
It could even be measured at night with a handheld instrument in your own back yard. You are spouting alt-non-science.
Climate of the past million years is entirely driven by earth’s orbit”
True, and so what?
Manmade CO2 emissions were small until about 50 years ago,
so could not possibly have any effect on almost all of those million years.
That does not mean the +48% increase of CO2 estimated since 1850, 100% from manmade CO2 emissions, has had no effect on the climate. Orbital variations and manmade CO2 emissions are two different climate change variables that happen at the same time. Orbital variations are a long term climate variable that probably have no measurable effect over a 50 to 100 year period.
Anthropogenic CO2 emissions are still small with respect to total CO2 emissions.
“Small” only if you consider 100% to be small !
The entire CO2 increase since 1850 (about +48%) was from manmade CO2 emissions. Nature is a net CO2 absorber.
The only source of the increased CO2 in the atmosphere since 1850 has been manmade emissions, mainly from burning fossil fuels.
You dismiss entirely all of the myriad naturally variable CO2 sources.
Oceans, jungles, underwater and surface volcanos? None of those vary, at all? It’s entirely anthropogenic? Amazing.
Nature is a net CO2 absorber
Nature has always been a net CO2 absorber
An estimated +200ppm of CO2 emissions from burning fossil fuels since the 1800s. But the actual CO2 level only increased by about +135ppm since 1850. The difference is the CO2 absorbed by nature.
That’s just silly. If nature was always and only a net CO2 absorber then there wouldn’t have been any atmospheric CO2 in 1850. In which case, there wouldn’t have been any humans in 1850. In which case, it wouldn’t have been the year 1850, since there wouldn’t have been anyone to read a calendar or turn its pages.
+100
I think you and I have been asking Rick the same questions for a while now.
It’s a bit much to baldly state man is responsible for 100% of the increase in atmospheric CO2. Man didn’t cause the uptick in volcanism near the Antarctic. How much CO2 is bubbling out from that? If the oceans are warming, then they ought to outgas more CO2, right? I’m not sure what other geologic processes might be adding more atmospheric CO2 today than a century ago, but neither are you.
I suspect a significant source that is ignored is increased Winter respiration from the roots of boreal trees and bacterial decomposition of Pleistocene organic material as the Arctic warms.
I gotta admit, I love the down vote! What possible reason could there be for a downvote on that comment? People are funny.
But over those million years, CO2 changed dramatically always in response to orbital changes. CO2 had no influence on the temperature then and no influence now. If CO2 was a temperature control knob why did Earth recover from glaciation when CO2 was 180ppm and why didn’t it keep warming when it got to 280ppm.
All the current temperature trends align with the change in solar intensity and the hard limits on tropical ocean of 30C and high latitude oceans of -1.8C.
The GLOBE is not warming. Some parts are cooling, some static and some warming. The warming regions are not exhibiting even monthly warming trends. In fact, some regions, that have average annual warming trends, show some months with cooling trends. The change in solar intensity explains all those subtleties. CO2 has no involvement.
All climate models show the GLOBAL warming at the same rate everywhere for every month. That is what they arrive at when they dream up nonsense like the ‘greenhouse effect”.
If CO2 was a temperature control knob
Who said CO2 was a control knob?
For most of our planet’s history rising atmospheric CO2 was mainly caused by warming oceans and volcanoes.
Manmade CO2 emissions are one of many climate change variables. We know rising CO2 did not cause global warming from 1940 to 1975, and also in the past seven years (UAH data). That proves CO2 is not a control knob.
All climate models show the GLOBAL warming at the same rate everywhere for every month.
So what? They are computer games that have been making wrong climate predictions for over 40 years!
It seems to me Climastrologists insist atmospheric CO2 is the dominant, preeminent, overarching control knob.
how can you say “true, so what?” when CO2 in the last 500 ma was above 2000 ppm for most of the time and there was no runaway greenhouse effect etc ?
These values are also based on the premise, that the earth behaves like a conventional black body, where greenhouse gases have their effect. In reality, there are so many other phenomenon where much of the heat is dissipated, not through radiation, but via mechanical energy, and convection (e.g. ocean circulation of millions of tons of water, and thunderstorms (Ian just showed us how “energetic” that can be …). I get ever more the impression that we’re discussing how many angels fit on a pin head. I would stick to the fact that these models do not fit observations because all the physics involved are not appropriately taken into account, and thus their predictions are wrong, period. In the science of climate change, “partly right” is just not enough, in view of the wide reaching economic consequences. The money should be used for mitigation of these effects, should they happen. Up to now, these changes are more beneficial than catastrophic, and leave it at that. We should concentrate on calling the alarmists and politicians out for their deception and lies, and see to it that funding gets funneled from this “Voodoo discipine” into other serious scientific research again.
In response to Mr Vieira, climatologists have not understood control theory correctly and have perpetrated the large error of assuming that feedbacks necessarily increase direct warming by a factor 4 at midrange. That, however, is only one possible outcome, and a not particularly likely outcome at that. The case for panic is based chiefly on feedback strengths diagnosed incorrectly from the outputs of models. As the realization of climatology’s error grows, so the possibility of ending the economic hara-kiri of the West also grows.
Lord Monckton uses an emissivity of 0.94. So dark gray body.
Climatologists investigating why there’s no light in the room forgot to check if the switch has been turned on (and so decided to blame the occupants 🙂 )
🙂
“Some 15 years ago I wrote to Sir John Houghton, …“
________________________________________
Isn’t he the same guy that came up with the Global Warming Potential (GWP) numbers for Methane, Nitrous Oxide and all the other “Lesser” greenhouse gases?
Whilst I have quite a lot of respect for both participants, I an afraid I consider both have lost the plot. The plot is that the atmosphere (in alleged Greenhouse gases) has gain of heat due to feedbacks. I have recently written about thermodynamics, because ALL these feedback models ignore the First Law, heat can only move from hotter objects to colder ones. They also imply that heat can only move by a radiative process, again incorrect. Moving in the other direction is directly in contradiction of Entropy, which can only increase. I would like both participants (or anyonne else) to explain in Scientific terms why they think that cold CO2 in the atmosphere can radiate heat to a hot Earth surface, and cannot explain where the obvious convective process which we observe with cloud cover, where less heat is lost from the surface is included in the “feedback” equation.
I can see that the CO2 in the bottom few thousand feet of the atmosphere may be able to radiate some heat to the surface if the atmosphere is very warm, but the rest of the atmosphere is very cold, so can only loose the heat radiated upwards, as can normal convective processes (Heat rises, moving towards cold).
There is also confusion over temperature and the molecular meaning of this. If I add heat to a gas its molecules will vibrate in response to the energy, but this is not a stable condition. This energy will be lost (by radiation) as soon as a slightly colder molecule is nearby, it is not “held” in any way. Temperature is only an indication of molecular activity, and any discussion we must refrain from making this any kind of variable. It may be compared to voltage in electrical circuits where currents not voltage indicate energy transfer.
I would like both participants to explain their theories in terms of energy transfer only, sticking entirely to thermodynamics laws, and I think they will find that the “Greenhouse” effect (actually constraint on convection) has no meaning in terms of climate.
“The ‘real’ Engineer” is perhaps no chemist, and he also has a poor understanding of the laws of thermodynamics. When solar radiation strikes the Earth it is displaced so that the outgoing radiation peaks in the near-infrared, within the principal absorption wavelength of CO2. When a photon of this near-infrared radiation interacts with a CO2 molecule, the CO2 molecule oscillates in its bending vibrational mode, so that heat is emitted. The heat may be transferred in any direction by radiation or by any of the non-radiative transports. Whatever the temperature of the CO2 molecule, it is at a greater temperature than before. That is how warming occurs. The question is not whether CO2 can cause warming in this way. It can – get over it it. The question is how much – or, rather, how little – warming will thus be caused.
The direct effect is widely accepted. A forcing equivalent to doubling the CO2 concentration in the atmosphere will raise the temperature of the atmosphere by about 1 K. The head posting does not, therefore, concern itself with whether there is a greenhouse effect, for it is well established that there is. It concerns itself with whether climatology has good grounds for multipling the directly forced warming by greenhouse gases by four to allow for temperature feedbacks.
MoB says:”… so that heat is emitted. ”.
By definition heat is a transient phenomenon that is only recognized at the boundary between a system and its surrounding. Until then it is internal energy. And there must exist a thermal gradient.
If you are correct then specific heat tables are wrong because they only show one energy value for each temperature. There should be according to you at least two columns. One column for without infrared and a column for with infrared. And there could be a 4 K difference in the outcome.
The belief that the earth would be 32 K cooler without infrared is absurd.
mkelly does not believe that there is a greenhouse effect, contrary to the many experiments establishing that it does exist and demonstrating its mechanism down to the subatomic level. He should not waste my time with his theories, but should instead address them to IPCC.
“The direct effect is widely accepted. A forcing equivalent to doubling the CO2 concentration in the atmosphere will raise the temperature of the atmosphere by about 1 K.”
The correct ECS is unknown. 1K is a reasonable guess. It would be more reasonable to state a range of possibilities, such as +0.5 to +1.5 degrees K. Ot better yet, admit the correct answer is no one knows. To know the correct ECS, you would have to know the exact effect of every climate change variable. Without that knowledge any ECS estimate would have to be a worst case ECS — assuming all measured warming was caused by CO2 increases. There’s no logical reason to make that assumption. Some, or all, of the measured warming could be caused by variables other than CO2.
” the directly forced warming by greenhouse gases by four to allow for temperature feedbacks.”
If you consider ALL he CMIP6 climate models, and assume CO2 is the main variable causing warming, the water vapor positive feedback amplification seems to be in the 2x to 4x range, not “4x”.
Midrange reference doubled-CO2 sensitivity is of order 1 K. Midrange equilibrium doubled-CO2 sensitivity in the CMIP6 ensemble (Zelinka+ 2020) is almost 4 K. Mr Greene has neglected the feedbacks other than the water-vapor feedback.
Are you considering the Russian INM model with its low ECS? It’s the only model that resembles reality. Perhaps just a lucky guess model, but with a low CO2 ECS. So it could not be assuming a 4x water vapor positive feedback. That model deserves 99% of the attention paid to climate models.
All the models share the problem of increasing uncertainty with iteration steps.
MOB –>
Heat is only emitted as an EM wave when the energy is lost through the molecule losing it’s vibration state and going back to a non-excited state. The molecule can also transfer energy to another molecule thru collision. These are thermodynamic processes, not feedback.
One must also be careful about what the surface is. When discussing SW insolation we are talking land/ocean. This makes it THE hot body in the system.
One must remember that the surface atmosphere is THE cold body. Thermodynamically it acts like an insulator. However, temperatures are measured at this location. CO2 can modify the conductivity of the insulator reducing the gradient across it.
Mr Gorman’s point has some force, but we are not concerning ourselves with the warming directly forced by CO2 or other greenhouse gases. Our argument concerns the feedback response to that direct warming.
Think of CO2 as resistance to heat transfer. The hotter earth still radiates to cold space, so the Second Law is not violated.
Correct!
“cold CO2 in the atmosphere can radiate heat to a hot Earth surface?”
CO2 deflects some upwelling radiation that was heading toward the infinite heat sink of outer space. It’s that simple. There is no violation of any laws of thermodynamics.
CO2 actually deflects some radiation toward molecules that have limited radiation, i.e., N2/O2. If a CO2 molecule loses energy through a collision, it is available to absorb additional radiation and pass it on. That is how the temperature of the atmosphere is raised. In other words, the heat energy is stored until reverse collisions can occur whereby energy is released from N2/O2 by colliding with CO2. This is what happens at a faster and faster rate as the sun sets. So the atmosphere cools.
So outgoing energy released via CO2 is simply moved to another, later time. Therefore, no violation of conservation of energy.
In the head posted article here, Christopher Monckton restates his persistent theme as follows:
“A note of caution. Precisely because – whether climatologists like it or not or admit it or not – the feedbacks present at any given moment respond to the entire input signal, including the enormous 260 K sunshine temperature, even a very small change in the feedback regime would potentially lead to a very large change in global mean surface temperature, since the elevated feedback strength must act on the entire reference temperature including the dominant sunshine temperature..”
What I note here is that this a view, or a “take’ on the situation of what forcings and/or feedback ought to imply in the climate situation, as opposed to a sure thing direct from feedback theory. The viewpoint here is the generally plausible conception that the Greenhouse Effect ought to apply conceptually to each and every point on a continuum of averaged earth surface temperatures, starting from absolute zero on up to a specially significant radiative emission temperature (be it 255 k or 260 K or whatever), *then* with the full forced and/or feedbacked effect continuing from *there* up to the actual surface temperature (the actual or ‘now’ temperature then being a fully leveraged or feedbacked energy flow equilibrium of sorts). It is via this kind of mathematical conception that running the “whole” temperature through a feedback ‘amp up’ or ‘boost up’ really makes sense. However, if someone wants to say that either forcings or feedbacks, or both, are really only a ‘kick up’ from a much more nearby equilibrium than absolute zero, that’s still not an obviously wrong viewpoint in itself!
One thing that bothers me a bit about the ‘whole signal’ thesis is simply that we’ll never have a disequilibriized planet Earth sitting at 0 K or at 260 K or whatever, so we’ll never get to see directly whether such an ‘out of balance’ Earth would naturally advance it’s temperature upward in a whole signal response. In the end, it’s all abstract reasoning that can only be supported indirectly — much the same as many another effort to picture why the earth’s temperature is as stable (or as quasi-stable) as it actually is.
Mr Blenkinsop has misunderstood the point. We are not expressing a “view”. We are expressing a conclusion from well established principles of control theory. Consider the position in 1850. About 29/30ths of the reference or pre-feedback temperature that year was the emission temperature that would be present even if there were no greenhouse gases in the air, simply because the Sun is shining. The remaining 1/30th of reference temperature is reference sensitivity to, or direct warming by, the preindustrial noncondensing greenhouse gases.
Climatology, in paper after paper, tries to maintain that because the direct warming from preindustrial noncondensing greenhouse gases was about 8 K, and because the total natural greenhouse effect in 1850 was about 32 K, therefore the equilibrium warming to be expected from the 1 K direct warming by doubled CO2 in the atmosphere is 32 / 8, or 4 K.
However, the correct calculation for 1850 allows for the fact that, in that year, the feedback processes then extant must perforce be responding equally to each 1 K of reference temperature, regardless of whether that 1 K came from the Sun shining or from the direct influence of greenhouse gases. therefore, in that year, the system-gain factor was not 32 / 8, or 4, but (255 + 32) / (255 + 8), or less than 1.1. Subject only to the uncertainties in the underlying data, which cannot alter this result very much, ECS based on the equilibrium in 1850 would indeed be of order 1.1 K, and not 4 K.
That said, even a very small change in the feedback regime since 1850 would greatly increase equilibrium sensitivity to doubled CO2 compared with the value derivable from the 1850 data. Therefore, it remains possible that ECS is as high as official climatology says it is, but that is no longer the likely midrange outcome. Given that the world is warming 2.4 times more slowly than IPCC’s midrange prediction in 1990, the head posting demonstrates that it is perfectly possible that there has been no change in the feedback regime at all since that year.
This is not merely “abstract reasoning”: it is readily verifiable by building a test rig.
Thanks for the reply! In retrospect, I must admit that my previous comment may have been overly negative, in a sense coloured by my own thought that (quoting myself here) that “the Greenhouse Effect ought to apply conceptually to each and every point on a continuum of averaged earth surface temperatures, starting from absolute zero on up to a specially significant radiative emission temperature [etc]”.
Reading between my own lines above, I was trying to think of a kind of basic ‘differential equations’ way of building up the whole signal response (starting from scratch, with the earth conceptually mapped at absolute zero), by building any temperature forcing up from zero, differential bit by bit. However, the problem with this way of looking at the situation is that then, my perception of how to do overall signal response might seem to contain a false sensitivity to initial conditions (just by my own choice of imagery and/or method). If there is a more all at once”, or integrative way of looking at things, based on the steady quality of the solar power flow through the system, I just might be able to give myself a more positive outlook on how whole signal leveraging should really apply here!
In your comments about how mistaken some climatologists have been, by calculating the climate system gain factor as a factor of ‘4’, you do seem to go very far the other way, bringing that factor all the way down to ‘1.1’ !
One wonders if there is truly subtle kind of integrative nonlinear math that would arrive at a compromise between those two extremes?
In response to Mr Blenkinsop, it is very simple to establish beyond doubt that ECS based on the data for 1850 is of order 1.1 K. Here goes:
As the head posting shows, using mainstream, midrange data it is possible to conclude that the system-gain factor today is still about 1.0764, so that ECS may well still be 1.1 K.
However, one should also be aware that even a change of just 1% in the feedback regime compared with 1850 would be enough to justify the current midrange 4 K ECS in the CMIP6 general-circulation models.
For this reason, it is not possible to make definitive ECS projections. Therefore, the high ECS imagined by the usual suspects is merely one, and a not particularly likely one, of a spectrum of possibilities. Therefore, there is no basis for the suggestion that there will be anything like enough warming to be dangerous.
> “respond to the base signal, the emission temperature that would prevail even if there were no greenhouse gases in the air, because the Sun is shining.”
My favorite way to drive this home is to ask climate alarmists why it is colder at night. The looks on their faces is that of the dawn breaking and blinding them.
Still. You need to clarify that R0 is not a constant.
R0 is emission temperature – i.e., the global mean surface temperature that would prevail on Earth if there were no greenhouse gases in the air. It is, therefore, constant, or very close to constant. Within about 15-20 K either side of the midrange 260 K, there is little effect on our result.
±5-8% is worth mentioning was my only point. If we are entering a Grand Minimum (above my pay grade) we might see the effects over a short span.
Dear Viscount Monckton of Brenchley,
What an intelligent, clever and informative post. I have followed carefully every step of your energy balance model section in the posting and recognised you had used the official IPCC figures and methodology to come up with an ECS value of 1.15K. I agree with your methodology and also the fact that the IPCC aerosol forcing is greatly exaggerated as per the peer review literature between AR5 and AR6. It should therefore be revised downwards, not to mention that the northern hemisphere has warmed more than the southern hemisphere. Yet the northern hemisphere has had a greater increase in aerosols – a contradiction they need to explain.
I have been following your “Climatologists Forgot the Sun Was Shining” argument since you had first discovered it in 2017. Before then I was fooled like the rest of the climatologist that feedbacks only respond to perturbations e.g forcings until you made your discovery. I was a little shocked when I first read about it so I (I had partially completed an engineering degree) decided to check for myself and found that indeed feedbacks respond to the entire input signal. I then came to my own conclusion that it makes sense in the climate because, after spending time in Northern Australia, I have seen many heavy down pours and once the rain had stopped and the hot tropical sun popped out I had observed steam coming off the road. This steam is a feedback from the suns input to the climate system!!!
Your team is right about it you only need to go to the tropics or (a hot humid summers day in the UK) and observe a heavy downpour followed by sunshine and you can actually see the feedback steaming off.
As per your argument; in 1850 the total feedback response is 20K off a massive (259.5K emission temperature + 7.5K Non condensing GHG)= 267K.
Theoretically the maximum increase in water vapour per degree C is 6 percent as per Clausius–Clapeyron relationship. So if the 20K response was purely from water vapour that means the feedback response per degree (Recalling the 6% per degree divided by 20K) becomes 1.2K per degree yielding an ECS value of 2.3K. However the feedback response will be less that a quarter of 1.2K (0.3K) because of the logarithmic relationship between concentration and forcing (agreed and well understood on both sides of the debate). So theoretically the ECS must not be more that 1.05 x 1.3 = < 1.4 K. This is my understanding and view on your teams excellent work along with other theoretical climatology results and figures.
Thankyou for taking the time to read this lengthy post!!
Best Regards
TheSunDoesShine
TheSunDoesShine has taken the trouble to follow our argument and our understanding as it has developed over time. And he has not been diverted by the numerous and increasingly panicky and bad-tempered attempts to confuse the issue by supporters of the Party Line.
As for the Clausius-Clapeyron response, its magnitude varies greatly with temperature. However, there is a difference of only 0.35% between absolute reference temperatures in 1850 and today, so the formula mentioned by TheSunDoesShine is reasonable.
Thankyou for your reply. I would like to add the way one should visualise the earths feedback climate system are as follows;
The sun is switched off and the earth is frozen solid at 0K. Turn the sun on at 1363.5 W/m2 the ice will melt on the equator and eventually poleward to include the rest of the tropics. The earth in now a water belt with an average temperature of 260K without any feedbacks kicking in. The feedbacks then kicks in by evaporation and hence water vapour becoming present in the atmosphere along with cloud formation. The earth warms a further from these positive feedbacks and becomes an equilibrium climate system.
With a reference temperature of just 260K what would be your guest of the final equilibrium temperature at that point?
Finally we had in the non condensing greenhouse gases we will know that the earth temperature will warm by a further 7.5 K plus some feedback to settle at 287K. Obviously the feedbacks will respond to the entire 267K reference equally an not caring about each component of the reference signal.
Thankyou again
TheSunDoesShine
Fortunately, we do not need to know what the global mean surface temperature would be if there were no greenhouse gases in the air. But Professor Lindzen has concluded that it would be 271 K. We need to look no further back than 1850, when temperature was about 287.5 K.
Readers may want to consult the September 12th refutation of Lord Monckton’s forgotten-sunshine theory for a list of some nineteen head posts that he has written on the subject. That refutation also includes a summary of his theory’s salient points that some may find more convenient that slogging through all those posts.
Readers may prefer to read the head posting, which carries the argument a little further and provides more detail. Mr Born is not a trustworthy source.
You don’t understand analog electronics any better than Stokes or Hansen.
Your abuses are boring, Monte.
God I miss Bender.
Monte stating the obvious 😉
Thanks you. Just click and move on.
Derg, you are a pearl:
https://csiropedia.csiro.au/csiro-medals-1992-research-achievement-dr-nick-stokes-and-the-fastflo-team/
If you can point me to something similar you did, or if you got our Lordship’s code, that would great.
So we are to now bow before the visage of Nitpick Nick Stokes, expert on everything?
The detailed printout in the head posting will allow anyone to reconstruct the straightforward algorithm we have developed. It is a corrected and modified version of the energy-budget method.
Thanks for the link. As one who ‘studied’ fluid mechanics as an undergrad, I would defer to Nick Stokes’ knowledge of same regarding applications to industrial processes. However, climate change is a lot more complex, and as Nick, MoB and the usual circuit guys are busy debating how an amplifier works, maybe you can answer a couple of questions on Nick’s behalf:
With respect to the second question, please provide links to IPCC-approved sources. Fyi, I’ve looked and haven’t come across these.
Climate change is indeed more complex than a mere circuit diagram over which our Viscount fumbles, Frank. Simpler would be to give links to the repository of the manuscript and the code.
Nick’s contributions to climate science go beyond trying to hijack an international conference with reactionary talking points, e.g.:
https://moyhu.blogspot.com/2022/09/giss-august-global-temperature-up-by.html
As for your leading question, please stay thirsty.
Yes, indeed, one of Nick’s ‘contributions’ to climate science also includes producing scary ‘burn in hell’ visualizations, based on fraudulent GISS data tampering.
As for not replying to my leading question, congratulations! – you have firmly confirmed that you belong to a cult, whose members have closely held beliefs that are unsupported by physical data. Enjoy!
“But CAGW” and “But Religion” might not get you very far against me, Frank.
A Stokes groupie, *yawn*.
I thought you asked people to move on, Monte.
Color commentators are supposed to be colorful. Try it.
Or a sockpuppet.
That word might not mean what you make it mean, Monte. Unless you’re new to Climateball? Ask around, and please stop whining.
A Pee Wee, how original.
I know you are, Monte, but what am I?
The head post is no answer to the September 12th refutation of the forgotten-sunshine theory. To the extent that it’s relevant it merely repeats assertions that the September 12th post thoroughly refuted.
In essence the head post’s first diagram merely repeats Lord Monckton’s contention that in calculating ECS the extrapolation coefficient should be the closed-loop gain’s large-signal version E/R rather than its small-signal version ΔE/ΔR. (What I call the “closed-loop gain” he calls the “system-gain factor,” and he confusingly uses “closed-loop gain” to refer instead to the loop gains H ≡ 1 – R/E and h ≡ 1 – ΔR/ΔE.) Merely making that bald assertion is no answer to the demonstration in the refutation’s Fig. 5 of what we all learned in high-school analytic geometry: that the small-signal version is the one to use.
So modelers’ error would not have been their use of small-signal quantities even if they had calculated ECS in the manner that Lord Monckton describes. Their error presumably would instead have a poor choice of the fudge factors they used to determine what those small-signal quantities’ values are.
Mr Born continues to be unaware, that where the base signal – in climate, emission temperature – constitutes as much as 97% of the entire reference signal, the inevitable consequence is that even a minuscule perturbation in the feedback regime will exercise a disproportionately large influence on equilibrium sensitivity. Based on the position at the temperature equilibrium in 1850, ECS is 1.1 K, and not the 4 K derived by Hansen and many others based on the data for that year.
If there has been no change in the feedback regime since 1850, then ECS remains 1.1 K. If, however, there has been a 1% increase in the system-gain factor, which Mr Born calls the closed-loop gain factor, then that would imply 4 K ECS today. But, as the head posting points out, uncertainties in feedback strength are far greater than 1%, wherefore diagnosis of feedback strengths from models’ outputs cannot reliably constrain ECS.
Lord Monckton provides no support for this bald assertion, and the head post’s 46 calculation lines that depict his “energy-budget method” show that the assertion is false. By graphing his July 2nd slide’s entries the September 12th refutation showed that his “correction” did indeed amount to extrapolation from the origin and thereby imposed linear proportionality between the equilibrium global-average surface temperature and what that temperature would have been without feedback. And the relevant portions of the instant head post’s “energy-budget method” boil down to merely replacing the July 2nd slide’s entries with values that as the nearby spreadsheet image shows are a little different but don’t change the fact the “corrections” implement linear-proportionality-imposing extrapolation. The spreadsheet image nearby illustrates this.
In other words, Lord Monckton’s “correction” still amounts to extrapolation from the origin and thereby linear proportionality—and feedback theory doesn’t require linear proportionality. Failure to observe the linear proportionality that his “energy budget method” imposes therefore wasn’t an “elementary error of physics.” Instead of “an elementary error of physics” the cause of high ECS estimates was more likely poor fudge-factor choices.
Mr Born says we extrapolate. No: we merely calculate on the basis of the initial conditions whose origin and values we have explicitly stated. We have shown in the worked example that one can plausibly obtain the same system-gain factor today as in 1850 using midrange, mainstream data. We have also pointed out, correctly, that even small changes in those data would produce very different results. That is not extrapolation: it is fact.
We know feedback vs temperature is not linear because vapor vs temperature is not linear.
7% increase per deg.
https://www.engineeringtoolbox.com/maximum-moisture-content-air-d_1403.html
At the very least that relationship means that nothing in feedback theory requires what Lord Monckton’s theory is based on: that global-average temperature has to be a linear function of what it would have been without feedback.
Mr Born has been told time and again that our theory is not based on the notion that global mean surface temperature “has to be a linear function of what it would have been without feedback”. The head posting states the contrary. Try reading it.
Again, the head post is no answer to the September 12th refutation of the forgotten-sunshine theory. To the extent that it’s relevant it merely repeats assertions that the September 12th post thoroughly refuted:
Here Lord Monckton seems to be repeating the mistake that the September 12th refutation’s “The Third Line” section described: “Lord Monckton ignored the fact that thus extending the slope change over the entire domain would increase not only E’s doubled-carbon-dioxide, Point C value but also its pre-industrial, Point B value. So instead of correctly calculating the new ECS value by taking the E-value difference between the new Points B and C he calculated it erroneously by taking the E-value difference between the old Point B and the new Point C. ”
Mr Born’s assertion here is nonsense. Today’s values of the key variables do not alter the values of those key variables as they stood in 1850.
Here Lord Monckton is exploiting a semantic difference to imply an error in substance.
I believe that on this particular nomenclature question my view coincides with Lord Monckton’s. In the way I use the term, temperature feedback is broad enough to include any effects of temperature determinants that in turn depend on temperature. Water vapor and clouds, for example, affect temperature, which in turn affects evaporation and thereby water vapor and clouds. Similarly, albedo—i.e., the fraction of solar radiation that the earth reflects rather than absorbs—affects temperature, which in turn affects ice and snow cover and thereby albedo.
Although I also believe I’m justified in questioning Lord Monckton’s characterizations of events, it’s certainly plausible that “one of the world’s most eminent climatologists” wouldn’t share my view of what the term feedback means. But we still have no reason to believe the climatologist in question denies that even if the global-average surface temperature fell to the emission temperature water vapor and clouds would affect temperature and temperature would in turn affect evaporation and thereby water vapor and clouds. Nor is it likely that he denies similarly mutual effects between albedo and temperature.
So although he may not call those phenomena feedback he probably never denied that the phenomena that I do call feedback would occur at the emission temperature—any more than the 2010 Lacis et al. paper did. In short, we have no reason to believe that in his treatment of what we call feedback but he forgot that the sun is shining. So Lord Monckton’s support for that proposition is weak.
The climatologist in question, who shall remain nameless, indeed did not consider that there was any feedback response to emission temperature. He considers that in 1850 ECS was approximately the ratio of the 32 K natural greenhouse effect to the 8 K directly-forced warming by the preindustrial noncondensing greenhouse gases. That view, wrong though it be, is widespread in the climatological journals.
Here’s another case in which Lord Monckton seems to cloak a non sequitur in ambiguity. It’s anybody’s guess what he means by “feedback regime.”
But let’s say that by contending there’s been no change in the “feedback regime” he means that the feedback response hΔE (where h ≡ 1 – dR/dE) caused by a given small equilibrium-temperature change ΔE would be the same under current conditions as under year-1850 conditions. Nothing about that equality assumption requires ECS to be as low as E/R, because nothing in feedback theory requires dE/dR to approximate E/R under year-1850 conditions.
Fig. 5 of the September 12th refutation illustrates this. Points B and C respectively represent (but not to scale) year-1850 and doubled-carbon-dioxide conditions. Note that slope values dE/dR at those points are approximately equal but differ significantly from the E/R value that the linear proportionality imposed by Lord Monckton’s “corrections” would dictate.
In short, low ECS values don’t logically follow from an absence of “feedback regime” change, at least under this interpretation of “regime change.” Of course, Lord Monckton could have meant something else. But that’s a problem with much that he’s written about the forgotten-feedback theory; it’s too vague to admit of clear analysis.
There is nothing “vague” about what we have written. We have set out the calculation step by step in a transparent manner that Mr Born would envy, for he has never been able to approach such levels of clarity. Of course it is a truism that “nothing in feedback theory” requires the ratio of equilibrium to reference temperature today to be equal to the ratio of equilibrium to reference temperature in 1850. However, as the head posting explicitly points out, even a small change in that ratio would exercise a disproportionately large change in equilibrium sensitivity compared with the 1.1 K derivable from the 1850 data.
The head posting correctly points out that if the feedback regime today is as it was in 1850 then ECS is much as it was in 1850. However, the head posting contains an express warning that one cannot assume that the feedback regime today is as it was in 1850, though climatology itself makes that not unreasonable assumption.
though climatology itself makes that not unreasonable assumption.
This is the point he is not getting.
Again, the head post is no answer to the September 12th refutation of the forgotten-sunshine theory. To the extent that it’s relevant it merely repeats assertions that the September 12th post thoroughly refuted.
Here is the head post’s formulation of the purported feedback law Lord Monckton says rules high ECS values out:
Despite the difference in wording the substance of this formulation doesn’t seem much different from the formulation he gave us only two and a half months ago:
And the “Nose of Wax” section of the forgotten-sunshine theory’s September 12th refutation explained that his purported proof based on that formulation fails because it presents the following situation. If, as it appears to, that language requires the linear proportionality imposed by his numerical example above, then it does rule out high ECS values—but Lord Monckton’s purported proof based on feedback theory that ECS is low fails because, as “An Electronic Analog to Climate Feedback” demonstrated, the formulation states an erroneous law: feedback theory doesn’t require such linear proportionality. If that formulation doesn’t require linear proportionality, on the other hand, then, as “Electronic Analog” also demonstrated, the proof fails because it doesn’t rule high ECS values out.
Now, the head post supplements its above-quoted formulation with the following:
But Lord Monckton’s only basis for his contention that modelers don’t implement feedback at the emission temperature is a communication he once had with John Houghton. In contrast, the September 12th refutation demonstrated that the 2010 Lacis et al. paper Lord Monckton had until then cited in support of that contention actually states the opposite: that evaporation and albedo feedback would persist even if the complete loss of carbon dioxide and other “noncondensable constituents of the atmospheric greenhouse” were to reduce the surface temperature to a value as low as the 255 K emission temperature.
The Born droid is stuck in a loop, someone needs to hit the Big Red Switch.
If that formulation doesn’t require linear proportionality, on the other hand, then, as “Electronic Analog” also demonstrated, the proof fails because it doesn’t rule high ECS values out.
He’s not “ruling out” anything. He’s taking the accepted data and calculating ECS using proper feedback formulas.
Bingo
Mr Born is on a losing wicket. He has been told, repeatedly, that ex definitione the fact that at any given moment the feedback processes then extant must perforce respond equally to each degree of that reference temperature does not necessarily entail a constant unit feedback response over time and consequently a nonlinear system.
Mr Born, who has little to knowledge of the peer-reviewed journals of climatology, is blissfully unaware that in paper after paper the error described in the head posting is explicitly and repeatedly perpetrated.
As Monckton comes up with the same approximate ECS as Linzen and Choi, or Lewis and Curry, all using different methods, I presume he is coming close to a real value.
Had not considered this>
“Mr Putin, who has a pathological (and legitimate) fear of national debt, will be able to pay down the entire Russian national debt in just two years. He has already reduced it to about 25% of annual GDP, one of the lowest rates in the world. He is aiming not for net-zero emissions (his academy of sciences has told him he need not worry about that) but for net-zero national debt.”
Puts a whole different aspect on Russia’s actions. And a clear reason for them to continue win or lose.
Mr Stevens has gotten the main point. The prolongation of the special military massacre in Ukraine suits the regime in the Kremlin because it keeps the prices of the commodities at the heart of the Kremlin’s economy high. The futile Western sanctions make little difference, because the Kremlin is making so much extra money from gas, oil, grain, coal, chromium, lithium, cobalt, copper etc. etc.
Much winning –
https://en.wikipedia.org/wiki/2022_Russian_debt_default
Also, commodities are correcting these days. Some belief updates might be in order,
Did you finally sell off the stately home in Aberdeenshire to pay for the Eternity Game debt, my Lord?
Indeed, having bought the stately pile for a song we sold it for a fortune, for we had restored it most beautifully and we won an award for the restoration from the North-East Scotland Preservation Trust, as well as commendations from the local authority and from Historic Scotland, both of which worked actively with us on the restoration.
And yes, the prize was paid out in full to the winners. But that was not a problem, for we had sold half a million puzzles at $50 each. Do the math.
> Do the maths.
Good idea, Christopher. Here’s what I could glean so far (sources on demand):
You bought the estate in 1996 for 250K and paid 500K in renovation. It was costing 30K a year to run, hopefully notwithstanding the six workers to take care of it (and you). It was earning about 18K through agriculture, rent and flowers. So 12K in running costs.
You put up the property for sale on Ebay with a starting price of 1.2M. No bid by the closing date. You got one personal call, presumably by the buyers. The domain was sold in 2001, the 1M paid to Alex and Oliver in 2000. You had to pony up 500K for the prize, 500K provided by your insurer. That means 250K + 500K + 500K + 60K (5 times 12K) = 1,31M, excluding six salaries for five years.
You must have made a smol fortune, very smol indeed.
I wonder how much the estate would be worth today. Around there I saw 3 bedrooms and land at 1,3M. There is also the Pittodrie Estate at 7,5M. It has 27 rooms, you had how many again, 67? Your 250K on the SPY in 1996 would have turned into 2.3M today. A 10M fortune in 1996 would now be worth 93M. Nothing to do. Just hodling.
As for your puzzles, I could run some numbers with you for production, distribution, promotion, retail, and the insurance premium you paid for your <em>PR stunt</em>! No idea how much the actuary calculated that.
Willard is way, way off beam. The Eternity project was handsomely profitable.
Christopher moves goalposts with the elegance of Gordon Ramsey playing soccer.
He already tried to claim all revenues of the games at Roy’s, whence public records indicate that it has been published by a company that was not his:
https://www.drroyspencer.com/2022/10/no-climatologists-did-not-forget-the-sun-was-shining/#comment-1374922
He should reissue his challenge for his latest puzzle. I am sure blockchain cryptographers will applaud his audacity.
Willard is maliciously off topic and, as usual, poisonously inaccurate. But then, jealousy is the root of all Socialism. Jealousy is the root of all evil. Socialism is evil.
Christopher sloganeers instead of owning the fact that he should be more parsimonious with family’s money than he is with the truth.
He challenged me to do maths. He got served. All the figures I mentioned are public record.
This is, of course, due to parameterized fudge factors. It says nothing of future predictive ability.
The obvious conclusion is that there may be forcings acting upon the system not yet considered, such as humanity’s direct impact to surface emission by massive desiccation of landscapes and the subsequent forced response aloft (reduced cloud albedo).
A lower CO2 ECS does not rule out anthropogenic impacts to our various climates. However, a low CO2 ECS is critically important to policy recommendation. As we look to smoke stacks and tailpipes we ignore the reality of what’s happening beneath our very own feet.
Haha. The last line cracked me up.
I thought only greta could see CO2.
…what you “see” in tailpipes and smokestacks ain’t CO2
whoa whoa whoa back up the truck. gold star awarded to Macha for this crafty rebuttal.
Much ado about nothing. The argument over feedback to downwelling IR (AKA warming) is looking at a problem that doesn’t exist. The additional DWIR above the point of IR absorption saturation is handled by boundary layer feedback (BLF). There is no additional warming. BLF is immediate and eliminates potential warming.
Most of the BLF is due to latent heat and conduction increases and thus will never show up in any radiation model. Here’s a key diagram of the saturation situation.
https://qph.cf2.quoracdn.net/main-qimg-eb091259a205b597f832adfd61707ca1-pjlq
Notice that absorption under the blue surface emissions (IR) is near saturation everywhere except the atmospheric window. While increases in CO2 and CH4 have a small expansion into the window due to pressure broadening, the amounts are small and likely are compensating for the extra cooling caused by increases in evaporation.
What drives the BLF? It is a side effect of the ongoing energy exchanges between the surface and the lowest layer of the atmosphere. These energy exchanges keep the two layers in a steady state equilibrium. Changes to DWIR simply modify the energy exchanges slightly to maintain the steady state.
Why a steady state? The 2nd Law of Thermodynamics in action.
You seem to confuse heat with temperature. WHATEVER temperature, if heat out = heat in, and if the hot earth radiates to space, then you are good. And if you add resistance to heat transfer, the surface temperature will increase until heat out=heat in again.
I do agree that convection and evaporation play huge roles in determining the surface temperature, and that climate “science” does not capture that affect in any degree of accuracy to make predictions.
No confusion here. I just didn’t go through the entire story.
First of all one has to understand all the surface energy that CO2 can absorb is already being absorbed. It’s referred to as saturation as I mentioned. Adding CO2 to the atmosphere cannot provide more than 100% resistance. We’re already there.
Second, this means the extra energy CO2 is radiating downward towards the surface is coming from collisions with other molecules. It is heat converted to energy. That energy is absorbed by the surface and once again converted to heat.
Next, the heat is conducted back to an atmospheric molecule that collides with the surface. We are right back where we started.
Or, the energy is absorbed by a water molecule and enhances evaporation moving a new water vapor molecule back to the atmosphere. Once again the energy is right back where it started. No warming has occurred.
But the “resistance” is not feedback. It is reduced conductivity which does result in a higher temperature, just like a higher R value insulation in your wall. What happens is heat storage in N2/O2, like a thermal capacitor, that is released at night resulting in higher Timing.
Where do you get reduced conductivity to space? Your analogy does not hold for the atmosphere. Sorry.
The big problem I see is folks only see CO2 as an energy absorber. If that were true then more CO2 would produce warming. CO2 is also an energy emitter. How this works in the atmosphere is not generally what most people expect. In general the combination of absorption and emission leads to increases in upward radiation as CO2 increases.
What is the relationship between resistance and conductivity?
(hint: G = 1/R)
So how do you compute R?.
You said: “Where do you get reduced conductivity to space? Your analogy does not hold for the atmosphere. Sorry.”
If G went down (reduced) then it means R went up. How do you compute R?
If you look at the nighttime temps the temperature curve is very close to an exponential discharge through a resistor. The decay constant is set by the resistor. Calculate that decay factor and you should be able to get very close to the resistance the atmosphere offers. Based on my records that exponential decay is pretty close to the same no matter the season. It *is* affected by cloud cover, smoke, etc.
Some day if I ever get the time I might try calculating the decay factor for clear and cloudy nights and see what the difference is. I’ve actually looked to see if anyone has ever done this and so far I haven’t found anything on the internet that applies.
Climate science today is stuck in the same old box of trying to get a daily average using Tmax and Tmin and then extending those mid-range values into ever increasing averages while compounding their uncertainty with each average they take.
They miss the easy stuff that you can do when you collect 2 minute data like I have since 2012. (I’ve actually got data back to 2002 somewhere but I can’t find the right hard disk!).
If CO2 *was* actually providing positive feedback you would expect to see Tmax values going up, that’s what CoM’s analysis really implies. The ECS would operate to increase both Tmax and Tmin, but it doesn’t seem to do that in reality. We see the GAT going up because of increasing Tmin values, not because of increasing Tmax values. Tmax can only go up to the point the sun drives it to. Constant value for input (the sun) means constant value for Tmax.
The atmosphere is complicated because there are many heat transfer mechanisms at work. Normally, people only think of conductivity or resistance in terms of electrical properties in a conductor but they also exist for thermal conditions.
Wiki has a simple explanation for these.
https://en.wikipedia.org/wiki/Thermal_conductivity
Please note that ∇T is not ΔT. It is a tensor, i.e., a vector with magnitude and direction. Again, from wiki.
Look at this page and the image on it closely.
https://cmacn.org/energy/basics/thermal-movements/temperature-gradients/
Although this site uses a step change from 70° to 100°, a similar thing happens as CO2 intercepts part of the IR from the earth’s surface and conducts it to N2/O2. The temperature rises. N2/O2 becomes a thermal capacitor.
Now the question becomes if current CO2 concentration is already intercepting all the 1500 um radiation that is emitted by the earth’s surface, will additional CO2 capture more? If saturation is already a fact, then more CO2 won’t affect Tmax at all.
Richard M is incorrect, as a simple gedankenexperiment will demonstrate. In 1850, in round numbers, the reference temperature was the 263 K sum of about 255 K emission temperature and 8 K reference sensitivity to preindustrial noncondensing greenhouse gases. Yet the observed equilibrium global mean surface temperature that year was 287 K. The 24 K difference is not fairy-dust: it is feedback response.
I’ve said nothing about preindustrial times. You need to spend some time understand what I am saying. BLF was also present in 1850 and acted much the same as it does today. That means none of the warming since that time was caused by increasing CO2.
All I’ve done is accepted that the CO2 greenhouse effect is saturated. I then show why adding CO2 cannot provide additional warming. The warming you mentioned is the from no GHGs in the atmosphere up to saturation.
“That means none of the warming since that time (1850) was caused by increasing CO2.”
An estimated 48% CO2 increase since 1850 caused no global warming? That’s a bold statement. I don’t believe it.
Did you make an attempt to understand the earlier comment where I explain why warming does not occur?
I get lots of drive by comments.
I understand what you are saying but I think you leave an important question unanswered. It is true than when a photon interacts with a CO2 molecule it give the molecule kinetic energy that within billionths of a second is passed to other atmospheric molecules in the form of kinetic energy. That KE is then rapidly reradiated with some returning to the surface and some radiated toward space.
The unanswered question is does any of the upward radiation interact with CO2? If it does then concentration becomes important. The large CO2 absorption band spread further by the pressure suggests the answer to the question is there is additional interaction.
The only graph I have seen about satellite measure IR radiation shows considerable energy radiated to space in the CO2 band.
I estimate that over 99.9% of scientists believe CO2 is a greenhouse gas, as proven by lab infrared spectroscopy, so increasing CO2 in the troposphere should impede Earth’s ability to cool itself by some unknown amount. I’m betting on the scientists.
No true scientist would regard consensus, however large, as a logically valid or respectable argument. The history of science is the history of the overthrow of one “consensus” after another, often by a single observation that calls into question all that had gone before.
For instance, Newtonian gravitic theory prevailed for hundreds of years until someone noticed that it did not correctly account for the orbit of Mercury. It fell to a Swiss patent clerk to explain that discrepancy with the theory of relativity, which had first been adumbrated by Galileo Galilei.