By Christopher Monckton of Brenchley
The New Pause, notwithstanding the much-publicized heatwaves in Britain and some other countries, has lengthened by another month to 7 years 11 months. The least-squares linear-regression trend on the UAH satellite lower-troposphere monthly global mean temperature anomalies has settled into a steady state that may yet be perturbed either by another la Niña later this year, which would lengthen the New Pause still further or, in the next year or two, a new el Niño event, which would shorten it or – if the spike were big enough – extinguish it altogether.

As the indefatigable Eric Worrall reported here a couple of weeks back, the Forces of Darkness are becoming concerned at the lengthening of the New Pause. They are beginning to write the nervous little pieces that they wrote when the previous Great Pause began to become significant.
I well remember the first time I drew the attention of the U.S. House of Representatives to the fact that, at that time (in 2007 or thereby), as now, there had been no global warming for seven or eight years: in fact, there had been a small cooling. The news that there had been cooling during that period caused consternation among the “Democrats”.
Against me was Tom Karl, then in charge of the clattering train at NOAA. He was as consternated as his fellow “Democrats” at the news that there had been no global warming for so long a time. He furiously tried to undermine the result by saying that it had not been proper for me to average the temperature anomalies of four distinct global-temperature datasets, one of which was his own. I countered that it made no difference either way, since all four of the datasets I had used, including that of NOAA, had shown a global cooling for the previous seven or eight years.
Eventually Rep. Joe Barton (R: TX), then chairman of the Republican minority caucus on the House energy committee, intervened and ordered both sides to write to the committee justifying their stances. For me, that was easy: I sent individual graphs of the four datasets on which I had relied, including that of NOAA, which all showed cooling. Tom Karl was splutteringly furious, but the data are the data. “It is what it is,” as Roy Spencer puts it.
At the end of that Great Pause, in November 2015, Senator Cruz (R: TX) showed our HadCRUT4 graph to the Senate, again provoking fury from the “Democrats”. At that time the inconvenient and unpredicted truth was there had been no global warming for 18 years 9 months.
If, therefore, the new Pause continues to lengthen satisfactorily, and if – as now seems certain – the crippling consequences of the economic hara-kiri that the West has allowed certain hostile alien powers to inveigle it into perpetrating become all too painfully apparent even to the “Democrat” electorate, the fact underlying these long Pauses will become known not just to the open-minded few but to all, whether the climate Communists like it or not.
That fact is that the rate of global warming predicted by Hansen in 1988 and then by IPCC in 1990 is simply not occurring. Nothing like. In 1990 IPCC had confidently predicted warming equivalent to 0.34 K/decade in the period to 2030. Well, we are now already well into 2022, almost a third of a century after that over-excited prediction, and the observed warming was not the 1.1 K that ought to have occurred by now but just 0.45 K:

Thus, IPCC had predicted almost two and a half times the warming that has actually occurred in the third of a century since its prediction. Yet, as Dr Roy Spencer has just brilliantly pointed out at his website, the anthropogenic forcings are continuing to follow a pattern that would lead to a forcing equivalent to a doubling of CO2 concentration by the end of the 21st century, approximately in line with Representative Concentration Pathway 4.5, and not the deliberately extreme 8.5.
Yet the currently-predicted warming for a forcing equivalent to that from doubled CO2, in the CMIP6 models (Zelinka et al. 2020), is 4 K/century equivalent, or 0.4 K/decade equivalent, up a little on the 0.34 K/decade equivalent predicted in IPCC (1990).
It has long been obvious from the temperature record that the rate of global warming is nothing like what was originally predicted: and yet the predicted warming in the models has officially increased. The decadal equivalent of the currently-predicted centennial rate of warming is now about thrice the observed decadal rate of warming.
I’ve said it before and I’ll say it again. There is a reason why the models continue to predict about thrice as much global warming as is actually happening. But I trust that regular readers will not need me to tell them what that reason is.
Meanwhile, the temperature in England rose above 40 Cº one blissful day in July. Since I am used to living in hot countries, I astonished the assembled company by wearing a tweed jacket throughout the day. I’d normally have worn my heavy leather biker jacket, the best protection against hot weather, but I’m away from home just now. But I was the only person present who did not complain of the heat, for I was comfortably warm, not unbearably hot. I leave it to the reader to work out the sound science behind how that works.
Try it next time the weather is well hot, and you will see what I mean. I was once in Texas, where it was a little hot. I was wearing my biker jacket. Daisy the barmaid was baffled. I told her to put her hand between me and the jacket. She did so and was astonished at how cool it was. Us Brits have the neatest chat-up lines.
Of course, the unspeakable BBC blubbed about how dozens of people were going to be killed by the heat (in a good cold spell the weather can wipe out tens of thousands at a time).
But there is a growing impatience among the electorate at the one-sidedness of the global-warming argument, and at the failure of the BBC or any of the major channels to give both sides of the story. We are going to dump the BBC from our viewing altogether next month, as millions of others have already done. No more license fee for us.
Unfortunately, the relentless propaganda, and the increasingly vicious silencing of all who would otherwise have dared to speak out, have had their effect. I have recently discovered that neither the British intelligence services nor the Cabinet Office have the slightest idea that the global warming nonsense is not merely peddled assiduously by the Communist traffic-light tendency – the Greens too yellow to admit they’re really Reds. It originated in the disinformation directorate of the KGB. But today’s spooks have no idea. One of them, who did not realize that my hearing is sharp, was overheard to say that I was “very Right-wing.” Moi? Zut alors!
Though the anti-social media giants will continue their campaign of outright Communist censorship, by a growing variety of samizdat methods the truth will emerge. Not long now, I think. The climate nonsense has almost run its course. It was all very well when there was little cost to it. But now that households all over the West are going bankrupt trying to pay their power bills and blackouts are only averted by panic measures, the people won’t stand for climate Communism much longer. In Britain on one recent day, the national grid paid more than $11,000 per MWh (or getting on for 400 times good old coal-fired power at $30 per MWh) to keep the lights on in London. And all this insanity on the basis of an elementary error of physics.
Welcome to the Holocene Inter-Glacial!!! Still, it’s not as warm as the previous four Inter-Glacials dating back nearly 400,000 years, but hey ho, perhaps some of these warmistas have lived through those warmer times & know best, perhaps, (sarc)!!! Still can’t understand why the ONLY solution to alleged Manmade Globul Warming is the creation & establishment of a one-world globul guvment, claiming ownership of ALL the world’s resources, whereby they can distribute said resources to the world as they see fit!!! Good old fashioned Socialism/Communism never dies, it does’nt even fade away!!! Agenda 21 anyone???
Nor as warm as it was in the Holocene before the LIA (Little Ice Age).
Well I see that the usual suspects have raced in, “misunderstood” the Pause and what it means, and then soundly thrashed their misunderstanding of it. Good job, Pause Deniers.
What does this pause, one of 123 of the same duration in UAH, have that the other pauses didn’t?
Another “misunderstanding” of the Pause? Really? You people really need a new playbook.
Oh, this is a special pause, is it? It’s not like all the rest, lol!
When you’re in a hole, just keep digging. LOL!
TheFInal Nail, a shill for Putin, fails to grasp that long and frequent pauses are a readily-understandable method of showing those unfamiliar with probability and statistics that the rate of global warming is a whole lot less than had originally been, or is still being, predicted.
It is somewhat interesting that a trivial 4-component (CO2, ENSO, AMO, volcanic) model predicts every pause lasting 5 years or longer including the most recent. What sets the recent pause apart from the others? What makes this time different?
Can you say “red herring argument”?
I knew you could.
This article is primarily focused on the recent pause. No?
Perhaps the furtively pseudonymous “bdgwx” would prefer us to concentrate on the Pause of 18 years 9 months at the beginning of the 21st century.
Since the current Pause is by definition the longest period with a zero trend leading up to the present, it may perhaps be possible even for bdgwx to understand that the head posting is indeed chiefly about the current Pause.
I don’t really have a preference either way. I’m happy to discuss any of the pauses you choose.
I love the fact that most of the climate warming by Co2 brigade, want to go back to the temperatures of 1760 at the start on the Industrial Revolution. They want to go back to London having three foot of snow evey winter and the River Thames freezing so hard that you could dance, have fires and sing on it. They want to go back to 1776 when Valley Forge had ground, frozen solid, down to well over 2 feet. They want to go back to the temperatures where your home heating bill would treble (oops, sorry that’s already happened in Europe, especially London) Yep, go back there but don’t take me….
The ‘pause’ from one set of the multiple times adjusted proxy troposphere readings….
Don’t whine.
As opposed to global warming from several sets of multiple temperature readings and the unvalidated computer games
Perhaps overly optimistic about economic reality intervening in a positive way. I see chaos, not climate religion coming to its senses. And there are 60% believers in fear-based government with critical thinking banned.
Do not underestimate the power of the truth. Magna est veritas, et praevalet, as the apocryphal book of Esdras so trenchantly puts it. In the splendid language of the King James Bible, which ranks alongside Shakespeare as the apotheosis of English literature, Great is truth, and mighty above all things.
I predict that the ‘pause’ will lengthen to around 60 years. Sorry, I won’t be around to see that, but in case no one noticed, climate cycles between warmer and cooler, on a time basis of about 65-70 years. Once it quits warming, it begins cooling, and that lasts from the top of one warmer cycle to the bottom of the next half cycle (cooler), some 30+ years of cooling (or pause, if you prefer). I only regret that I won’t be around to see the headlines of the coming ice age, as we had in the 70’s. That, like everything else, will happen again. They’ll be talking about 1000 year cold spells then…
Lord Mockton, isn’t “heatwave” defined as 5 or more days of extreme heat relative to the location? Two hot days, I thought, does not a heatwave make
A question for Lord Monckton of Brenchley:
Given the error you discovered in their maths, is it possible by using a starting average temperature of 0C (zero), to get their model to predict infinite warming? I think it would be quite illustrative of their major flaw.
No, one can’t usefully go back to zero Celsius. And Their model does not predict infinite warming: merely a lot more warming than is physically consistent with the real-world data.
If La Niña remains weak, there will be no strong El Niño after solar maximum because too little heat will be accumulated under the surface of the western Pacific and the subsurface Kelvin wave will not reach the Niño 1.2 region.
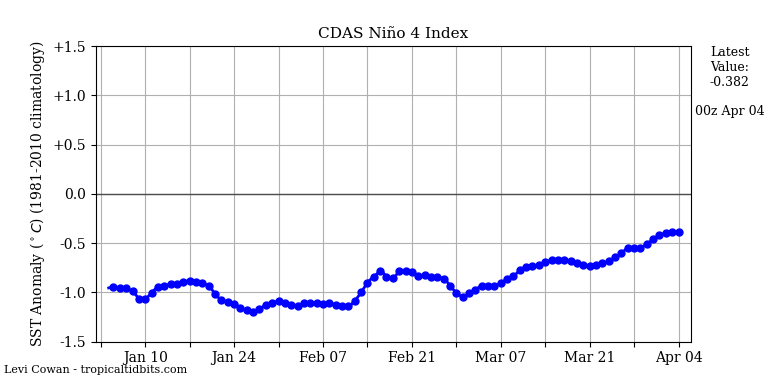
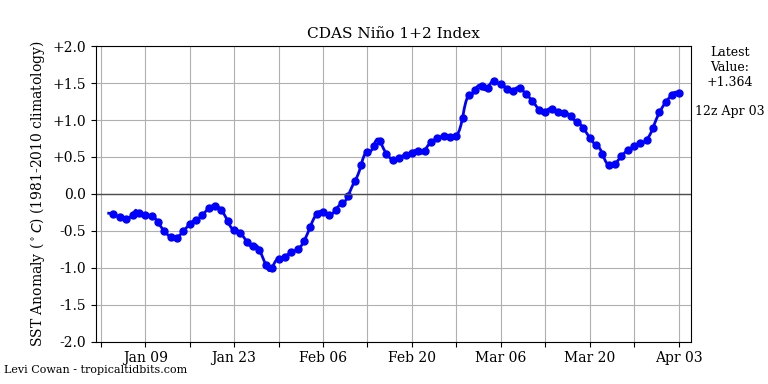
http://www.bom.gov.au/archive/oceanography/ocean_anals/IDYOC007/IDYOC007.202208.gif
Are we past the first solar peak in this cycle?

Heliospheric Current Sheet
http://wso.stanford.edu/gifs/Tilts.gif
The best part of these “pause” articles is reading the comments and see all the alarmist get triggered when all Lord Moncton is doing is posting an observation. He hasn’t changed his prediction: somewhere around 1C of warming per century.
It might be interesting to note that the method Monckton uses to assess the pause period also says that over the last 15 years and 6 months the rate of warming has accelerated to twice the overall rate at +0.26 C/decade. That’s just an observation as well.
Lord Moncton of Baloney is posting a short term observation, without long term UAH context, that very likely has no predictive ability. Almost a total waste of bandwidth.
Stop whining, this cherry picking canard is threadbare.
Short term trends are defined by inflection points, they are cherry picked for that reason.
The pauses show how natural variability dominates the tiny human forcing.
It is very likely that nothing has predictive ability for future climate states. Even Milankovitch cycles don’t always produce ice ages. The future can’t be known.
The spiteful Richard Greene, if he really thought these articles were not worth reading, would not spend so much of his excessive free time commenting thereupon.
And it is factually incorrect to state, as the spiteful Richard Greene states, that no long-term UAH context is provided.
If he would get his kindergarten mistress to read him the head posting – no, that is too advanced for him – to show him the pictures, he would see the graph of UAH temperature since 1990, the year of IPCC’s first ASSessment Report.
JamesD is right: there is really no reason to expect much more than 1-1.4 K warming this century, and that will be net-beneficial.
The Earth’s temperature is constant within certain limits due to the height of the troposphere, which in winter above the 60th parallel drops to an average of only about 6 km.


The previous warming period, which began in the mid-1970’s, ends in 2004. The current pause begins in that same year. This aligns with the pattern of warming and pause periods in evidence since the 1880’s. El Nino and La Nina periods are a distraction from proper analysis of the pattern of temperature change and should be ignored during such analysis..
The structure of the troposphere is coupled to the atmospheric boundary layer.
The boundary layer is tightly coupled to surface properties. The height of the tropopause is related to the depth of the boundary layer.
Boundary layer depth relates to thermal properties such as sensible heat flux and the intensity of wind shear.
Over arid terrain with high surface temperature the boundary layer is wide. Over moist vegetated terrain the boundary layer is relatively narrower.
There is an immense amount of moist static energy (MSE) over moist vegetated landscapes. A shallower PBL with bigger MSE implies a bigger MSE per unit of PBL, which is supportive to an increase of potential for convective development, moist convection, and moisture convergence.
China has conducted extensive surveys of the planetary boundary layer in efforts to characterize aerosol pollution and dissipative mechanisms.
China has observed up to 8m/yr increase in boundary layer depth relating to urbanization.
Over the agricultural landscape boundary layer depth has increased up 4m/yr due to soil erosion.
Maximum terrestrial boundary layer depth with urbanized landscape 1 million km2 = 8m/yr
Maximum terrestrial boundary layer depth over agriculture landscape 48 million km2 = 4m/yr.
Weighted average boundary layer increase = 4.1m/yr
(48×4)+(1×8) / (48+1) = 4.08163265
Roughly 50% of the landscape is urban and or agricultural.
Weighted total terrestrial boundary layer depth increase = 4.1m/yr(0.5) = 2.05m/yr.
During one century of development boundary layer depth has increased up to 100 x 2.05m/yr = ~200 metres averaged over the terrestrial landscape globally.
According to realclimate archives, there has been an upward trend in the simply proxy for emission height in the reanalyses. This trend they say is consistent with the surface warming with the observed lapse rate approximately -5K/km.
+200m in boundary layer depth is thus associated with +1K at the surface.
The structure of the troposphere is closely related to the vertical temperature gradient, which is constant in dry air up to the tropopause ( at the tropopause the gradient decreases rapidly until the lowest temperature) and variable in moist air depending on the amount of water vapor in the air. Warm dry air loses temperature faster than moist air.
Land surface modification by humanity is associated with annual average increase in boundary layer depth, increasing temperature, reduced relative humidity, and reduced cloud cover over all seasons. In climate model conceptualizations these processes use the sum notation lambda. It is a key assumption that humanity has no direct impact on lambda (feedback parameter to total forcing). This assumption does not hold.
https://www.frontiersin.org/articles/10.3389/fenvs.2021.744255/full?fbclid=IwAR3Pq62VYk4sxFaN-70MGayT-neK45D4BsVnJd3vKWMPFTL3RNSQxT3VKUk
Image depicting regional dynamics with daily maximum boundary layer height (depth; daytime), and minimum (nocturnal). All season increase in BLH is observed.
Daily nocturnal BLH (BLH minimum) shows net reduction, enhancing downward turbulent flux of heat. Net turbulent flux always opposes the direction of net radiation. Turbulent flux is directed downwards at night while net radiation is upwards. Daytime is opposite under sun.
Daytime BLH increase is associated with increased stability and cloud reduction. In sum it relates to increased ratio of sensible heat flux vs latent heat in the perturbed landscape.
Sensible heat tends to get recirculated in the turbulent boundary layer increasing nighttime heating. Latent fluxes are associated with total surface cooling and cloud formation, and increased buoyancy/convection. The liquid and solid condensing water aloft emitting full spectrum IR.
This is lambda in action.
https://link.springer.com/article/10.1007/s42452-021-04918-5
The image caption reads: (a–d) The seasonal patterns of daily maximum (shade; m) and daily minimum (contour; m) height of planetary boundary layer for the warming mode. (e) The PC time series of the warming mode (red curve) together with the linear trend (black line). Contour interval is 5 m (blue < 0 < red). The blue curves represent the PC time series for January and July and the blue dotted lines their respective trends.
If your interpretation is muddled, review surface/boundary layer dynamics fundamentals with particular emphasis on turbulent flux. https://denning.atmos.colostate.edu/ats761/Lectures/04.SurfaceEnergyBudget.pdf
It is clear that population density and infrastructure will punctuate increases in surface temperature with decreases in green space. Plants absorb some of the sun’s radiation and the surface heats up less than concrete and asphalt.
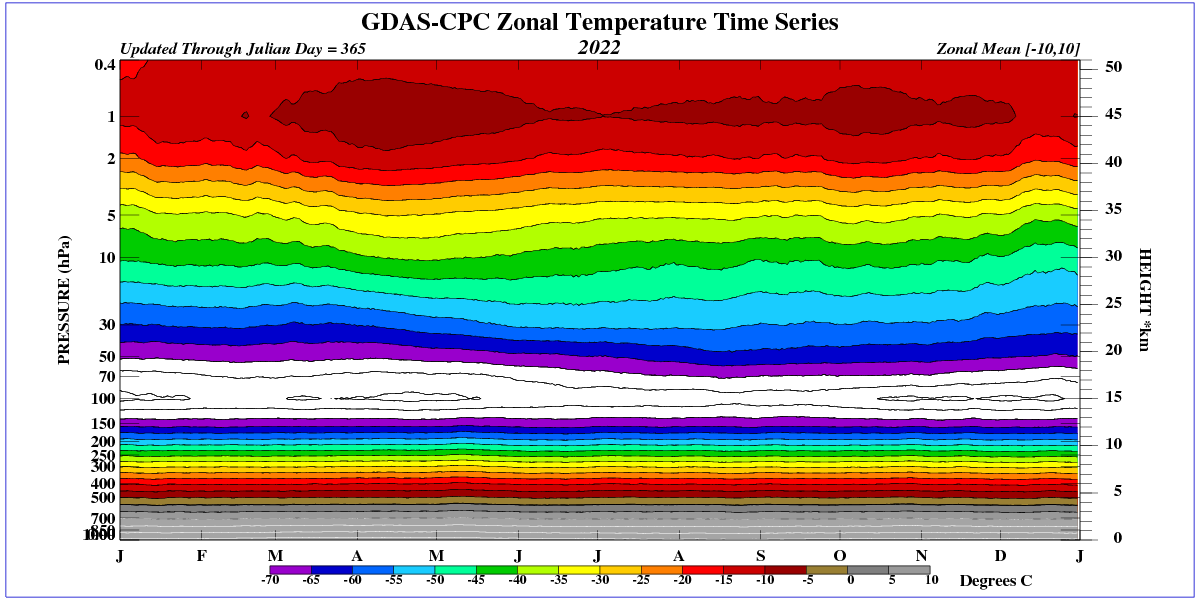
If Earth were not a water planet and there were no water vapor in the air, temperatures on Earth would be almost as extreme as on planets without an atmosphere. This is very evident in the Sahara, and also during La Nina, when the tropical Pacific produces less water vapor. Heat waves in Europe are not unusual.
CMoB said: “That fact is that the rate of global warming predicted by Hansen in 1988 and then by IPCC in 1990 is simply not occurring. Nothing like. In 1990 IPCC had confidently predicted warming equivalent to 0.34 K/decade in the period to 2030. Well, we are now already well into 2022, almost a third of a century after that over-excited prediction, and the observed warming was not the 1.1 K that ought to have occurred by now but just 0.45 K:”
I’m going to post the same content here that I did the other times you misrepresented the IPCC.
According to the IPPC FAR these are the scenarios they considered with the level of CO2, CH4, and CFCs as of 2020 clearly indicated.
And this is the prediction for each scenario.
As you can see the scenario most closely matching the actual emission pathway is scenario C in which 0.55 C of warming was predicted from 1990 to 2020. HadCRUT shows about 0.65 C of warming.
The IPCC did not predict 0.34 K/decade of warming. They predicted about +0.18 C/decade. The observed rate of warming over that same period is +0.21 C/decade. The IPCC’s prediction was not “over-excited”. If anything the IPCC actually underestimated the warming.
If you keep misrepresenting the IPCC FAR prediction at some point I’ll be forced to believe your rhetoric rises to disinformation.
“The observed rate of warming over that same period is +0.21 C/decade.”
How did you come up with that? UAH records +0.13C/decade.
I did a LINEST in Excel from 1990 to 2020 on the HadCRUT dataset. The choice of dataset comes from Monckton. There are variation of his claim dating back to at least 2016 though. Sometimes he refers to the mean of UAH and HadCRUT which would be +0.18 C/decade and nearly spot on with the IPCC prediction.
The “hot model” problem is widely acknowledged by leading US communicators, including Schmidt and Hausfather. They posted guidance on how to handle it. There is no unified theory in CMIP6; they are moving beyond model democracy. If you are following along there is deep frustration about CMIP6 where the computational community is more divided than ever.
The backtracking is sensational. Where now there is to be no reliance on trends over time. In modelling this is called Covering Your A**: “First, follow the lead of the AR6 to base analyses on global warming levels rather than on time10. For example, instead of assessing changes in rainfall by the year 2100, researchers could report changes at global warming levels of 1.5, 2, 3 and 4 °C.”
https://www.nature.com/articles/d41586-022-01192-2
CMIP6 came about almost 25 years after the IPCC prediction.
You dismiss the advice of your idols. They have conceded the model trends are worthless and offer no information. You have engaged in cherry picking. Cherry picking is specifically the craft of choosing evidence which suits your ideology. The best available science has moved beyond the knowledge from over 25 years ago.
The IPCC did not have access to CMIP6 in 1990. And I’m not the one who picked the IPCC prediction as a point of discussion. That was Monckton. I’m just pointing out what the IPCC actually predicted using figures from the actual FAR from 1990.
I couldn’t give a rat’s a** what you think Monckton said. I care about the truth.
I, too, can play with VPN to self promote. You might fool some, but you will not fool me.
What is VPN and what does it have to do with the IPCC prediction from 1990?
You are sad.
JCM said: “You are sad.”
I’m not sure what you mean here, but I get the impression you feel offended. I just want you to know that it is never my intention to offend you or anyone. I’m only interested in discussing the topic at hand and learning more about the climate and how it behaves together with other commentors on WUWT. So if I have offended you in anyway I am truly sorry.
My question still stands…what does VPN have to do with the IPCC prediction from 1990? I honestly have never seen this acronym in the context climate science discussions. And how am I using it to self promote?
chronic narcissistic lies.
Yes even diehard alarmists are admitting to problems. That doesn’t stop them from spouting nonsense throughout the article. “there is still a more than 5% chance of ECS exceeding 5 °C”
Thats all the justification needed for Monkton’s serial disinforming?
Of course their are problems with CMIP6. Their are problems with CMIP5 and every other model in existence. None of them are perfect and none of them will ever be perfect. That doesn’t justify claiming the IPCC predicted +0.34 K/decade of warming or that it was 2x, 3x, or whatever other variation of the day Monckton says higher than what they predicted.
MI using the wrong data set? To 2020 get what wft gets, 0.017171 +/- 0.000809 deg/C. Through 2020, 0.017474 +/- 0.000777 deg/C.
https://www.woodfortrees.org/plot/hadcrut4gl/from:1990/to:2020/plot/hadcrut4gl/from:1990/to:2020/trend
IPCC predicted the equivalent of 0.34 K/decade global warming as their midrange estimate. It hasn’t happened.
But, But, But ….. METHANE!
No they didn’t. They predicted +0.18 C/decade global warming as their best estimate for scenario C…the scenario most like the emission pathway that actually happened. Don’t take my word it. Read the FAR and see for yourself.
IPCC predicted the equivalent of 0.34 K/decade. They were wrong.
Where? What page number?
LOL, now I finally know why all the attention has been put on methane. It is the excuse for why the predictions have failed.
It doesn’t appear that the IPCC put much focus on methane. As you can you see in their graphics above they felt that its concentration would eventually peak around the middle of the 21st century in scenario B…the one most felt was most plausible. Contrast that with CO2 and CFCs in which it is still rising at the end of the century. At the time of publication I suspect most authors did not see the Montreal Protocol coming which took us down a more C’ish pathway.
The real question I have for Mr. Monckton is whether the aforementioned biker jacket is just for show, or does he ride? And if so, please elaborate. 🙂
rip
In response to RipShin, my eyesight has recently deteriorated and I can no longer ride or drive. I miss it a lot. I used to do 40,000 miles a year on two wheels – nearly always on V-twin sport-bikes – and thought nothing of going from Northern Scotland to Barcelona in a day. In those days you could cruise at 120 mph on the French peages.
It seems to me that the global oceans have lost heat over the last month.
Attached is an global ocean temperature anomalies to 400 m. This is from Sea Temperature Analysis (bom.gov.au).
Will this lead to cooling?
La Niña is affecting weather around the world. A jetstream can be seen descending from the north over the eastern U.S., and its cold fronts are bringing flooding to the Appalachians. The jetstream then ripples over the Atlantic, bringing air from the south over Europe. As long as La Niña continues and solar winds are weak, this circulation will continue.

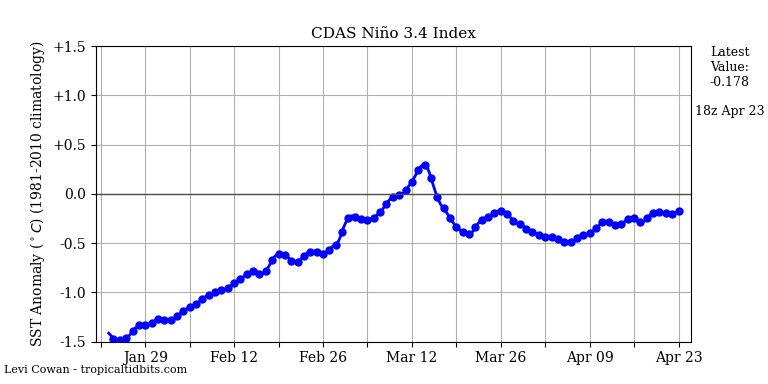
The bad part about the La Nina is the drought, not the temperatures. Expect a shortage of cotton this year, at least in the US.
This is what solar activity looks like now in the full solar cycle.
