Reposted from the NoTricksZone
By P Gosselin
Today we look at the polar ice caps, which the global warming wingnuts claim is the canary in the coal mine and predicted earlier they’d melt and collapse. For example, Al Gore warned the Arctic ice would disappear by 2014.
While CO2 has gone up, Arctic sea ice has RISEN over past decade
But we have a big surprise. First we examine the Arctic sea ice extent so far this summer. Has it melted away like Al Gore said it would?

Source: Vishop Artic Sea Ice Extent
To the contrary, the latest data show Arctic sea ice is still very much present and is currently running above the average of the last decade. Our friend Snowfan here reports:
The Vishop plot shows the Arctic sea ice areas (extent/extension, red line) on 2 July 2022 is larger than in some previous years and above the last 10-year average (dark blue dashed line): There is nothing more with the ridiculous ice-melt fantasies of the two climate lying barons John Kerry and Al Gore, who predicted in 2009 a summer ice-free Arctic in the year 2014, if the global greenhouse emissions would not be drastically reduced.
The CO2 content of the Earth’s global atmosphere has steadily increased from about 380 ppm in 2009 to more than 420 ppm annually by 2022, leading to the further greening of the Earth. The increase in global CO2 levels in the Earth’s atmosphere has been accompanied by growth in Arctic sea ice areas and strong growth in Greenland ice masses this year.”
What an embarrassing development for Al Gore and the tight circle of consensus scientists.
Antarctica continues long-term upward sea ice trend
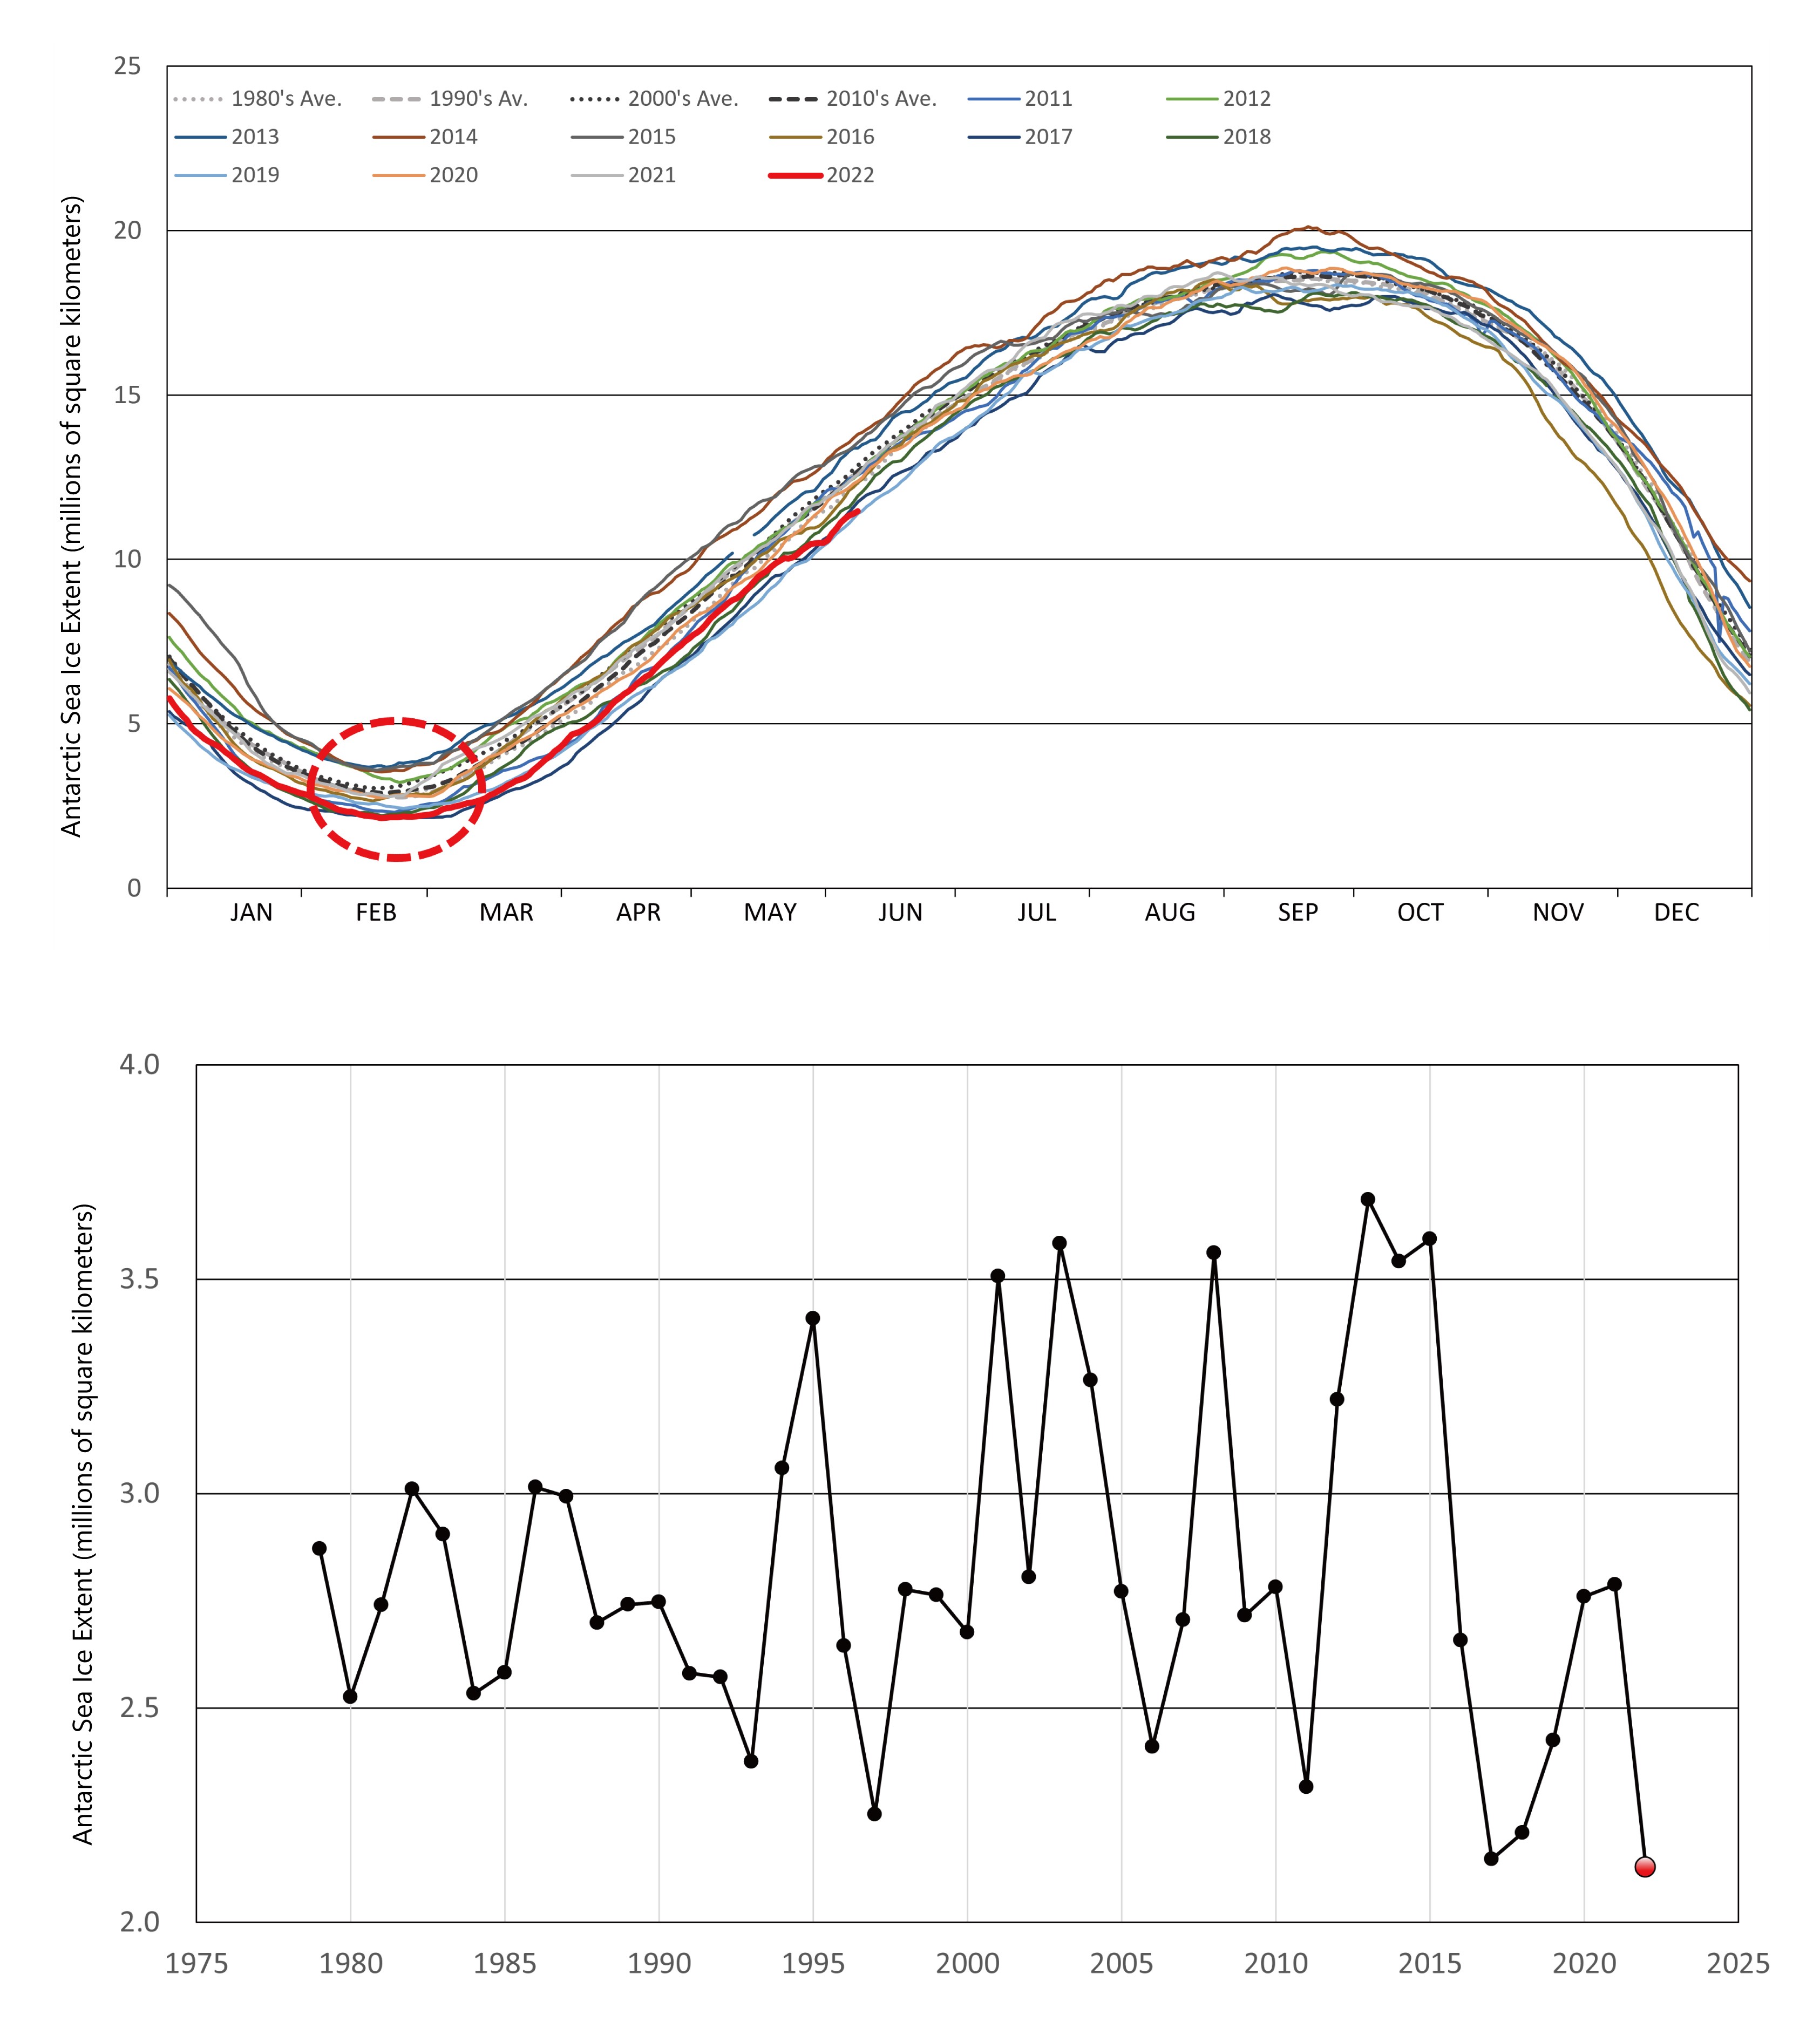
Looking at Antarctica sea ice, we also see a zero-crisis trend when plotting the data from the Japan Meteorological Agency (JMA):

Chart produced by KiryeNet. Data Source: JMA.
The annual mean for Antarctica has risen modestly since satellite measurement began in 1979. There is no polar ice melt crisis at this time. This is humiliating for the climate loonies.
The climatologists should follow George’s advice and do the opposite.
Those damn pesky facts. Almost like the models are rubbish…
Almost????
Thanks, Chaswarnertoo. Your comment made me smile and I couldn’t resist responding.
Regards,
Bob
Diolch yn fawr.😇
Don’t worry, just need a couple more data adjustments to rescue the models.
Breaking News . . . . Biden Administration to redefine “rubbish” . . .
Will the new definition involve hairy legs?
IF NOT retired
Model = give me more money
REPEAT
Pesky warm water. But looking at the last few years, we seem to have turned the corner.
What, where and how are they measuring the temperature?
Japan’s Koi ponds?
Completely meaningless graphic.
You can find that here: https://ds.data.jma.go.jp/tcc/tcc/products/gwp/temp/explanation.html
Much is meaningless to the ignorant like you
Even if it was melting, that’s simply a continuation of melting that started with the end of the Little Ice Age. What the alarmists need to show is definitive acceleration of melting right, not just continued melting at a pre-existing rate?
Further, I know the alarmists keep moving the goalposts of how long a trend is required to prove no warming, but I think they are up to 30 years right? So by those standards, don’t we need to see acceleration in melting for 30 years to use ice cap melting as “proof” of global warming?
What is needed to confirm the CO2 bogey man is melting that continues to correlate with atmospheric CO2 content.
While the ice extent at this moment is marginally above the 2010’s average and may fall below that average by late summer, that level should be much lower if CO2 really was the driver of ice melt.
You don’t really expect the alarmists to use the same standard for data that supports their view, vs data that doesn’t?
Or any form of logic.
Bindidon posted this graph of temps in the Arctic region. Sea ice extends to
the Pole & much further south than 60N along the eastern Siberian &
Canadian coasts as well as in Hudson Bay. The 70N-80N area (thin green
line) has the most deviation & the deviation in all areas has been falling
recently. As Steve Reddish commented above, there should be a correlation
between CO2 levels & temps/sea ice which I don’t see yet as they’d both
have to soar to find any. It will be interesting to see what happens.
Too much has been made of Arctic sea ice & polar bears as they’re
“political footballs” used to scare people. The Arctic & polar
bears survived the Eemian & Climate Optima when there was less
ice than today.
Note: The Danish Meteorological Institute (DMI) has temp graphs for 80N
to the pole
data, data,data and empirical evidence bedamned. This is about wealth redistrbution, as acknowledgrd by IPCC members so data and evidence are meaningless.
Until we have truthful scientists, politicians, and unbiased unbought media, hoi polloi will buy the nonsense.
Here in TX we have recently tied or broken heat records set in 1910/11 when CO2 was 300 ppm v 420 ppm today. If ghg are the temperature control and are 30% higher than a century ago shouldn’t high temperatures be broken daily?
You need to show it’s not the more plausibly natural changes in ocean currents.
You know what the really crazy part of this whole climate change emergency bullshit is? I wish it were true!
If co2 emissions increasing really did increase temperatures a Guaranteed 1-5°C over the next 100 years it would be the best news for planetary climate. The world is too cold and dry since about 35 million years ago when the Antarctic ice cap started to form and since about 15 million years since the northern ones started to form (correct me if I’m wrong about the dates or my logic, it’s OK, that what’s science is about!)
Can anyone argue that peak biosphere diversity and intensity was roughly in the Cretaceous when temperatures were 10°C hotter on average?
The equatorial regions were about the same but the poles much warmer and greener than now. Even if we had to build dikes around New York and Singapore, it would be worth it for the sake of the environment to let temperatures continue on their slow rise.
Let NY get swamped..
BUT, don’t let the people infect the rest of the country.
So build a wall to keep them in NYC.
Of course the minor detail that the Antarctic seaice extent is currently at a satellite era low is conveniently omitted (it set a new record minimum this year). Over the last 20 years the Greenland Icesheet has lost ~5,000 GT and is continuing to do so.
Yep and bang goes the theory there’s a global climate that needs the average the omniscient ones know it should be.
Just read that a retired meteorologist joined 10 other meteorologists to write a ….another climate paper….and heard a retired CEO of a major corporation say “we are all for the climate”. Climate propaganda seems to be winning.
I’m all for climate too else where would my RC aircon be without it? These lefties always want command of other people’s remote controls. Buy their bloody own aircon and set it whenever and wherever they like.
Better still let private enterprise know what universal temp they all want and I’m sure biz will knock out an auto one permanently fixed at their ideal temp and save on the remote.
Which fundament are you pulling those figures from?
References?
The Antarctic sea ice extent is from JAXA https://www.nipr.ac.jp/english/info/notice/20220615.html
The Greenland Ice sheet data is from https://grace.jpl.nasa.gov/resources/30/greenland-ice-loss-2002-2021/
The biggest problem with the Grace survey is that it can’t tell the difference between changes in ice and changes in magma.
So you think that mass loss on Greenland is due to loss of magma?
Facts to ponder. Waddya think?
https://wattsupwiththat.com/2020/12/29/newly-discovered-greenland-plume-drives-thermal-activities-in-the-arctic/
so if it’s sensitive to the influx of magma more ice would have to melt to compensate?
Depends on how deep the magma is.
Aren’t you tired of embarrassing yourself yet?
Global temps have that same “scary” flatline as
Greenland ice loss. (courtesy Willis E)
Oh, noes! We’re all gonna die!
It could be, the problem is that we know there are magma pools under Greenland and we know that magma tends to migrate over time.
You can’t claim that it must be ice loss until you have proven it can’t be anything else.
Greenland ice loss in perspective (h/t David Middleton)
Excellent expose!
So many warmist/alarmists fail to understand the scale of the loss against total mass and that small melting doesn’t prove anything for the AGW conjecture.
Sea ice is irrelevant. Total mass on Antarctica is increasing and Antarctica has just had the coldest winter on record.
A June 15 article referencing the minimum of sea-ice extent at the height of the previous summer. Pure propaganda. Cherry picking.
It’s the limit of the area of at least 10% ice. Not only is that limit dependent on the currents no matter how much ice melted from the winter, how much ice melted is dependent on the ocean currents, not half a degree warmer globe, let alone the much lower trend in the southern ocean.
I also have doubts about the fickle measurements. It’s not that straight forward and climate scientists have a dodgy record. I wouldn’t be surprised if most of the trend (not the one season) was because the extent was closer to 9.5% in the 70s and 10.5% now.
Actually it’s 15%, area is low too.
Even if the Greenland numbers are correct, at the rate of 277 Gt per yr it will take 9,000 years to lose the Greenland ice sheet seeing as it has a mass estimated at 2,500,000 Gt.
So it will still be there when the next ice age returns, likely to be in much less than 9,000 years.
You need a sense of perspective and materiality Phil. Even if those losses are accurate they are not material.
I see, but it’s OK for the OP to say it’s “strong growth in Greenland ice masses this year”. No criticism of that from you though.
So what?
So when Zig Zag Wanderer asks where i get the data from 14 people upvote his request, when I respond 28 people downvote the reply, I guess they don’t like the data?
Phil, it’s these kinds of statements from you that convince some numpties every year to try sailing around the Arctic seas.
Of course every year some boats then get stuck in the STILL VERY ABUNDANT sea ice, and if it weren’t for rescue missions by ice-breakers, lives would be lost.
Any such rescue mission should be performed only by solar powered icebreakers.
(Since most of these seem to happen in Canadian waters, does anyone want to suggest this to Trudolt? It’d be a good virtue-signaling diktat for him to issue.)
Does little Trousseau virtue signal?
Or is he, perhaps, paving the way for his people, the people of Canada, to be happy?
Even if they have nothing . . . . .
Auto
Antarctic sea ice grew dramatically from 1979 to 2014, despite increasing CO2.
Two weather events associated with Super El Niño of 2016 affected its extent. But now it’s building back to normal.
JohnTillman:
The “Super El Nino of 2016” was caused by a 28 million ton decrease in industrial SO2 aerosol emissions, 2014-2016, due to a Chinese edict to decrease factory SO2 aerosol emissions.
Cleaner air = higher temperatures.
Sulphur? You mean it’s Satan wot dunnit? 😁
The El-Nino was caused by poorly understood ocean currents.
Also atmospheric. Weaker than usual trade winds let warm waters slosh from the eastern Pacific to South America in Los Niños, and stronger than normal keep them built up across the International Dateline in Las Niñas.
ENSO is a coupled oceanic-atmospheric phenomenon. The Southern Oscillation is its air pressure variation and El Niño, La Nada and La Niña are its associated SST swings.
A major driver of the oscillation is UV flux, via ozone:
https://www.nature.com/articles/s41598-017-05111-8
Hence, the SST location fluctuations are linked to the solar cycle.
Correlation:
https://aip.scitation.org/doi/abs/10.1063/1.4930679?journalCode=apc#:~:text=ENSO%20occurs%20at%20irregular%20interval,periodical%20Sunspot%20number%20(R).
Prediction:
https://www.sciencedaily.com/releases/2021/04/210405075853.htm
No, it wasn’t. It was caused by the same natural cycles as Super Los Ninos of 1982 and 1997.
Chinese SO2 emissions continued to fall in 2017 to at least 2020, but the world has cooled dramatically since February 2016.
https://www.statista.com/statistics/282680/china–sulphur-dioxide-emissions/
Ten million ton decrease, from about 20 M to 10 M.
Please see link from Statista.
By 2020, it was down below 5 M.
Of course when the Arctic ice was shrinking and Antarctic growing, the alarmists wanted everyone to concentrate on the Arctic.
And at that rate of shrinkage, it will take Greenland about 100,000 years to melt away.
By which time glaciation will undoubtedly have returned.
What percentage of the total Greenland Ice Sheet does 5,000 GT represent?
You failed to mention these. Hmmmmm!
Are you telling us the ice is growing?
The topic is about the Arctic Sea ice cover which you didn’t acknowledge the 15 years of failed predictions of no summer sea ice.
Your deflection shows your hypocrisy since it was until recent years well above average for years which was ignored by the same people who have been wrong about the Arctic region.
Then you make a misleading statement about Greenland since it is a tiny portion of the total mass.
The original postmarks this statement: “strong growth in Greenland ice masses this year”, which I refuted by pointing out that there was not a growth but a continued decline. Nothing misleading about my statement.
We are in the middle of Greenland summer. The fact that ice is currently melting is not surprising or unusual.
Too bad there will always be alarmists who refuse to actually do science and put their claims in context.
“We are in the middle of Greenland summer. The fact that ice is currently melting is not surprising or unusual.”
Indeed, as I showed it’s following the same trajectory as it has for the last 20 years, the one thing it’s not doing is showing “strong growth”.
Your time frame is too limited.
It’s been melting for the last 200 years, ever since the end of the little ice age, and you are correct, it doesn’t show any sign of accelerating.
It’s also been melting since the end of the Holocene Optimum around 7000 years ago and once again, it still shows no sign of accelerating.
But the Antarctic ice is growing
That’s simply untrue. Any proof?
It certainly is true.
Try here: https://www.scientificamerican.com/article/antarctic-sea-ice-hit-a-record-low-now-scientists-think-they-know-why/
antarctic-sea-ice-extent-1024×806.png
The graph above shows Antarctic sea ice extent as of July 17, 2022, along with daily ice extent data for seven previous years and the 2017 record low year. 2022 is shown in blue, 2021 in green, 2020 in orange, 2019 in brown, 2018 in magenta, 2016 in light blue, 2014 in light green, 2013 in light orange, and 2017 in dashed red. The 1981 to 2010 median is in dark gray. The gray areas around the median line show the interquartile and interdecile ranges of the data.
Unscientific American?
The whole article is emotion and opinions. A complete lack of facts.
About the author:
It’s not science, at all.
Antarctic ice shelves break free from fast ice and leftists melt down wailing about sea ice loss.
Winter comes, and the ice shelf freezes, again becoming sea ice.
Yes it’s continuing to freeze during the austral winter, however it’s still below the minimum for the date, so a strong likelihood that the seasonal maximum will be a record low as well.
JAXA has today’s extent at 15,619,033 km^2, 613,352 km^2 below the previous lowest for the date.
“data for seven previous years” Yeah, cherry pick a few years and you can “prove” anything you want. Explain the growth periods.
I haven’t ‘cherry picked’ anything, just showed that the Antarctic sea ice extent is lower than it has been before while the satellite measurements have been made.
Both claims are bogus.
JMA chart in the above article clearly demonstrates that “record minimum this year” is false.
The same goes for the desk bound fools ‘estimating’ Greenland ice mass. An ice mass that aggregates far more each year than it loses.
Besides, Greenland temperatures do not support Greenland ice melt, unless one includes volcanic ice melt.
“JMA chart in the above article clearly demonstrates that “record minimum this year” is false.”
So a graph that ends in 2021 demonstrates that there is no record minimum in 2022!
However the JAXA graph for this year shows that there was a record minimum:
“The same goes for the desk bound fools ‘estimating’ Greenland ice mass. An ice mass that aggregates far more each year than it loses.”
No the measurements show that it is steadily losing more than it gains each year.
That is only true for the period beginning in 2015. Explain the rising trend between 1979 and 2015, a much longer period. It would seem that atmospheric CO2 concentrations has nothing to do with it.
Which comment is that referring to?
Arctic sea ice is well above the 2011 to 2020 average. How is that possible with continuous rapid CO2 rise? Ditto June 2022 continuing the global downtrend since February 2016.
Of course you leave out the minor detail that until recently, Antarctic sea ice was growing – in direct opposition to climate change theory.
You also leave out the minor detail of the above average year for surface mass balance in Greenland.
“Of course you leave out the minor detail that until recently, Antarctic sea ice was growing – in direct opposition to climate change theory.”
How did I leave it out, I showed a graph of all the annual minima since 1979?
“You also leave out the minor detail of the above average year for surface mass balance in Greenland.”
Well at present the SMB is bouncing around the average, however that isn’t enough to make up for the loss due to glacial calving and melting so every year there is a nett loss. That is a fact that the OP neglected to mention when claiming “strong growth in Greenland ice masses this year”.
Facts don’t matter to the Climate History Deniers™ in the Climate Doomsday Cult™.
Nothing more to add. I just wanted to use my new favorite terms.
A rather misleading way to frame this.
With the annual fluctuation in sea ice extent, you’re always going to get periods when the latest year will have higher/lower extent than the previous 10-year average, especially in the early part of the new decade.
For example, look at the 2012 plot. This is still the year with the lowest extent to date, yet it was well above the previous 10-year average for most of March and April 2012 and even lower than the 1990s average at one point.
As of July 27 2022 (the latest VISHOP data point at time of writing), Arctic sea ice extent is 150,000 km2 below the 2010s average for the date. But it’s 900,000 km2 below the 2000s average and 1,690,000 below the 1990s average for the date.
Oddly (or maybe not) Pierre doesn’t use VISHOP to inspect daily Antarctic extent in the same way. I wonder why?
Arctic sea ice is declining trendwise, while Antartic sea ice is not. Nothing new there. And it is no suprise, given the Arctic is warming fast, while the Antarctic is not warming at all.
The more interesting question is why. Somehow unnoticed by the “critical community”, there is plenty if interesting research out there..
There are no contrails over Antartica, not even close by.
https://greenhousedefect.com/contrails-a-forcing-to-be-reckoned-with
Not according to the caption I highlighted from the article. Would you agree it is misleading?
What you just proved is you don’t know what a “trend” is and should be ignored. Something can still be rising but the trend decreasing.
Would you agree you missed the whole point of the discussion?
That should be “was.” It reached a low in 2012 and has apparently reversed the trend over the last decade.
Well, one can always discuss charts. But to me this looks like going south, with some stagnation over the last 10+ years. Anyhow, I have no problem with it, as the Arctic obviously has warmed anyway.
Way more interesting is, again, the “why”. One argument why the Antarctic was not warming is that CO2 had rather a cooling effect there, because of the strong inversion and a “negative GHE”. In the Arctic winter however, we also have such inversion, though not quite as strong.
The cherry on top of the cake now is, that the Artic is warming only in winter, not in the summer. LOL
Your chart shows no more decline after 2006.
That the arctic has warmed up from the coolest time period in the last century is not surprising.
The Arctic warming is actually bad news for warmist/alarmists who doesn’t realize that CO2 isn’t stopping the increased outflow of energy from the planet.
Your Arctic sea ice extent September average time series starting date is 1977 -78 which just so happens to be an apex of cold temperatures adjacent to the expiry of the 1945 – 75 cooling trend ….Tony Heller has published the previous Arctic sea ice satellite measurements dating back to the 1960’s complemented by historical records on his website .. The loss of Arctic ice in the early 1920’s accompanied by extremely warm , temperatures [ The Arctic heated at a 50% faster pace between 1920 – 30 compared to the decade 1995 – 2005 ] was documented in the 1922 Monthly Weather Review ..The 1939 – 40’s sea ice perimeter ebbed to another low extent Furthermore there is no discernable ‘stagnation over the past 10 years ” but rather recovery since 2012 followed by a conspicuous stabilization .of sea ice ..Looking at the chart I see at least 150 000 – 200 000 square km more sea ice at present than 2006 ……”Anyway I have no problem with it ” ? ..You have a serious perception problem ..
“In Spitzbergen the open season for shipping at the coal port lengthened from three months in the years before 1920 to over seven months of the year by the late 1930s. The average total area of the Arctic sea ice seems to have declined by between 10 and 20 per cent over that time”
H H Lamb ‘Climate, History and the Modern World’ 2nd Edition
p260.
” Well one can always discuss charts ” …….More important is the ability to honestly evaluate a chart
But why is is sea ice going up at all this far into the looming crisis with CO2 up over 10% since Al Gore’s prediction. Final nail, even the most strident alarmist Gavin Schmidt of GISS says climate “models are running a way too hot and we dont know why?”
You know the final nail needs a couple of taps and then two solid hits and then the body goes into the ground. I’ve seen your comments and can tell you’re knowledgeable and following the stuff. Tell me you haven’t had second thoughts about it all, like Gavin Schmidt. The folk in the trenches are doubtful. Guys like griff and simon will cling on past the end along with M. Mann.
But according to predictions IT’S NOT EVEN SUPPOSED TO BE THERE.
According to predictions, we’re not even supposed to be here.
As I recall, we all died in 1985 or thereabouts. No matter, since Manhattan is under water anyway.
The return of the Western Interior Seaway (also called the Cretaceous Seaway, the Niobraran Sea, the North American Inland Sea, and the Western Interior Sea).
Man is returning the planet to what it was before Man!
(Isn’t that what they want?)
Mr. hit the nail on the head. What exactly are the predictions of this theory? They have changed so often. Is this science or just prophesizing?
Pity it doesnt give numbers.
It cannot be embarrassing for Al Gore because he is a charlatan and has no shame. It probably is embarrassing for those promoting climate change that will destroy civilization. They will never admit their error as someone with honor would do.
“It cannot be embarrassing for Al Gore because he is a charlatan and has no shame.”
You nailed it. 🙂
Too bad it isn’t the final nail. 🙂
“This is humiliating for the climate loonies.”
“There is no polar ice melt crisis at this time. “
Like the anti ecoloon farming protests in Holland, its gone down the memory hole and therefore isn’t part of the accepted narrative. – as far as our media is concerned.
Only today our very own loonies in Exeter had this to beam out on the propaganda service – aka BBC
Climate change: UK sea level rise speeding up – Met Office
Sea levels have risen by around 16.5cm (6.5 ins) since 1900, but the Met Office says the rate of rise is increasing. They are now rising by 3-5.2mm a year, which is more than double the rate of increase in the early part of last century.
https://www.bbc.co.uk/news/science-environment-62322574
In parts the British isles are ‘sinking‘ and in others ‘rising‘. Parts of England, Wales and southern Ireland are sinking into the ground, but Scotland is rising. Since the last Ice Age, enormous sheets of ice have been removed from the north of the islands. The process is fastest in north eastern Scotland, where some beaches are now a few metres above the current sea level.
What’s funny is that the NSIDC website still insists on showing graphs for 30 year average sea ice extent from 1981-2010. Since the fraudsters have declared climate is a 30 year average shouldn’t they update the graph to at least 1991 to 2020? They haven’t done it because it makes their case look weaker. It proves the old addage. Figures lie and Liars figure.
I e-mailed the folks at NSIDC and asked them why aren’t their graphs updated to 1991-2020 average sea ice extent. They sent me an e-mail explaining they are sticking with the 1981-2010 data because the readers of the website are use to it and they didn’t want to confuse them….WHAT????
As I recall, 30 years was chosen as the base for “average” for meteorology back in the 1920’s because they only had 30 years of data. And it’s not a running average. 30 year blocks of time reset after 30 years have passed.
(They could probably change to 60 years now if the data wasn’t so … adjusted.)
I thought they used to re-adjust every decade.
You might be right.
But there is a “reset” of which 30 years is used for the “average”.
(I don’t know why they don’t use 60 years now.)
6.5 inches since 1900. 🤣 Simply untrue.
The Guardian repeated that faithfully but only acknowledged “meteorologists said.”
Paging Mr. Gore . . . Mr. Al Gore . . . paging Nobel Prize winner Al Gore . . . Mr. Gore . . . please pick up the house phone.
Nice people like him do not talk to heretics.
Gorebal is only interested in cameras and news microphones…
It’s known as a publicity whore, too busy chasing reporters and camera teams.
Talk to one person? Are they really really important?
Coming soon to your towns and cities
The German city of Hanover has become the first big city to ban hot water and central heating in public buildings in response to Vladimir Putin‘s weaponizing of gas supplies.
Build electric bus garage under your water reservoir
A fire at a bus depot in Hanover caused millions of euros in damage.
“Build electric bus garage under your water reservoir” +100
The “EV spontaneous combustion contagion” has spread to America!
https://wattsupwiththat.com/2022/07/27/connecticut-steps-up-to-save-the-planet/
Every little bump up or down from a supposed mean is now an existential crisis.
The true crisis will come when Europe and North America have finally recreated Sri Lanka’s green socioeconomic outcome.
What a joyous future awaits us. NOT!
According to DMI, the past 100 days have been almost entirely below the Mean temperature from 1958 to 2002
http://ocean.dmi.dk/arctic/meant80n.uk.php
Surely, with the CO2 control knob cranked to 11, that should be impossible.
Gee. Not a Climatologically Significant Difference. Not disappearing forever….but just bumbling along well in expected range.
I would guess they’re no more embarrassed by the state of polar sea ice than by the graph of CO2 vs Temperature Anomaly at Willis’ post at https://wattsupwiththat.com/2020/09/15/cooling-the-hothouse/ that shows absolutely no correlation between Earth temperatures and CO2. You’d think they would eventually get tired of having to making up more illogical and unscientific excuses to justify Global Warming.
I also guess that nobody would believe that in 1984 the cruise ship Lindblad Explorer, with 98 “sophisticated international travellers” on board, who had paid up to $23,000 each (surely a small fortune at the time!), completed the luxury 4790 mile (7712km) voyage through the Northwest Passage from St Johns, Newfoundland to Point Barrow, Alaska in just 23 days.
“This is humiliating for the climate loonies”
That would apply to any climate loonies that were capable of shame.
Is there a list somewhere? If there were, they would be immediately be cancelled.
My prediction is that there will now be a big push for an ‘improved’ measure of CO2 levels. Lockdowns will then be shown to have dramatically reduced said levels so that more of the same is now urgently required to bring us back to pre-industrial levels!
If CO2 levels were to go down significantly, food production would decrease significantly while temperature would not. This would be dramatic proof of the many claims that AGW will destroy argiculture.
But, climastrologists -sorry, climatologists have no sense of shame, since everything they say and do is to “save the planet”, therefore, they can’t be embarrassed or feel humiliated. Al Gore recently even shamelessly compared “climate deniers” to the Uvalde cops who did nothing while kids were being murdered. What a nasty piece of work he is.
Don’t forget that in Moore’s Planet of the Humans there is an interview with Gore and Richard Branson. The interviewer asks Gore if he thinks he was a “prophet” about climate change. Branson intercedes and says it depends how you spell “profit” and both he and Gore fall about laughing.
Tells you all you need to know about both of them!
Of course it is.
It is all a rabid lion like acid rain, ozone hole, new ice age, destruction of rain forests, and every other end-of-world scare since the Sumarians.
Some day, there will be intelligent life in some universe
To repeat my prediction: Arctic sea ice will indeed be the canary in the coal mine – an early indicator of global cooling and death of (C)AGW. A decade or so and it’s over.
http://nsidc.org/arcticseaicenews/files/1999/10/Sep_monthly_extents13yr.png
http://nsidc.org/arcticseaicenews/files/2021/10/Figure-3-sept2021.png
Positive ~20-year trend by ~2030.
Possibly earlier. The 15-year trend, 2007-21, is still flat, but could start tilting up during the present five-year interval, 2022-26. If this year ends up like 2009, 2013 and 2014, rather than 2008, 2010, 2017 and 2018, the next highest years, then it could start this summer.
Another high year was 2021, but it was lower than 2022 on yesterday’s date.
Unfortunately, religions have a way of carrying on regardless.
No, by then the required interval to falsify AGW will be near 100 years.
Einstein falsified it in 1917, responding to Arrhenius.
Meanwhile, this is the sort of nonsense we’re subjected to here in NZ…
(Article about Antarctica)
https://youtu.be/-dMJ1GW5XqI
E.g.
By the end of the century…
– 40-100cm sea level rise
– Emperor penguins near extinction
Ocean acidification (due to CO2 absorption) and oxygen depletion is causing species to die off.
– Air temperatures rising by >3’C
– Sea temperatures rising by > 1’C.
– 1 in 100 year floods happening every year.
Happening already…
Host blames recent floods on sea level rise (does sea level rise really make it rain more?)
-‘Climate change’ is ‘slapping us in the face’.
I can’t even really figure out if experts are telling me if the oceans outgas CO2 as the oceans heat (so +ve feedback concern), or if they acidify due to all the CO2 they absorb from the atmosphere – it seems to change depending on what they’re telling me to be frightened of.
I didn’t know that Climatologists could feel shame.
lts not just the Arctic sea ice where nature is not going along with the CO2 climate change agenda. My 45 year recording of the timing of the first snowfall in my local area here in England also is refusing to play ball with the climate agenda.
Which is most odd as the warming of the Arctic along with the warming of the seas around the UK over the last 45 years. Should have been having a impact on the timing of the first snowfall.
But this has simply not been happening as there has been no trend towards a delay in the timing of the first snowfall over the last 45 years. lts a result l was not really expecting and am looking to find a answer to this local climate puzzle.
No puzzle.
The answer is that is just weather.
You are still going to die along with the rest of us
Well if the answer is just weather.
Then the same answer could also explain the warming trend here in the UK over the last 45 years.
They are not embarrassed. Only honest people can be embarrassed. They’ll just sputter and make up some new hypothesis and get more grants to dig up (or manufacture) evidence that supports their new hypothesis.
Can someone please tell me how the difference between these two claims can be resolved?
NSIDC
https://img-s-msn-com.akamaized.net/tenant/amp/entityid/AA104mIB.img?w=534&h=326&m=6
Heatwave melts nearly 6,000,000,000,000 kgs of Greenland’s ice in 3 days (msn.com)
DMI
http://polarportal.dk/fileadmin/polarportal/surface/SMB_curves_LA_EN_20220727.png
Surface Conditions: Polar Portal
I doubt that anyone can isolate a 3 day period and attribute an accurate amount of melting to it. It’s interesting that the authors are trying to convince anyone that will listen that the greatest amount of ice loss is happening at the bottom of the glaciers, not the top – presumably so that they can give a knowing wink and a smile when anyone points out that the glaciers don’t appear to be getting smaller. If the annual average for this year shows anything out of the ordinary I’d be very surprised.
It should be pointed out that mainstream journalists are completely innumerate, and are impressed by big numbers, failing to understand that RATIOS are more important than absolute values. The MSN article fails to point out that 6 gigatonnes of ice lost from Greenland in 3 days is a trivial proportion of the total. Since the total mass of the Greenland icecap is about 3 x 10exp15 tonnes, this equates to 6 x 10exp9 divided by 3 x 10exp15 or 2 x 10exp-6, or two millionths of the total mass. In percentages, Greenland lost 0,0002% of its mass in 3 days, which sounds a whole lot less scary than 6 gigatonnes.
But the NSIDC graph used in the article compared to the DMI graphs seem completely at odds and the difference irreconcilable and beyond any reasonable explanation for the discrepancy to me.
I don’t understand the discrepancy either. Which graph is correct?
Trusting NSIDC is the problem there.
DMI at least has some respect.
Both graphs are showing different things.
The NSIDC is based on % melt extent.
The DMI is based on mass loss in GT.
What it means is that in July for a short time around upto 40+% of the ice cap was melting on the surface. It doesn’t indicate how much loss there is to the ice cap so I don’t know where they get 6,000,000,000,000 kgs of ice in 3 days from. (6 GT) 6 GT is actually nothing for the time of year as the main month for melting in Greenland is July. It will start to cool down in August and September.
The DMI for that time shows losses but still above average accumulation for the time of year. (1981-2010) The amount lost over July about 100 GT.