From Dr. Roy Spencer’s Global Warming Blog
July 18th, 2022 by Roy W. Spencer, Ph. D.
Summary
The simple CO2 budget model I introduced in 2019 is updated with the latest Mauna Loa measurements of atmospheric CO2 and with new Energy Information Administration estimates of global CO2 emissions through 2050. The model suggests that atmospheric CO2 will barely double pre-industrial levels by 2100, with a total radiative forcing of the climate system well below the most extreme scenario (RCP8.5) used in alarmist literature (and the U.S. national climate assessment), with the closest match to RCP4.5. The model also clearly show the CO2 reducing effect of the Mt. Pinatubo eruption of 1991.
The Model
As described here, the simple CO2 budget model uses yearly sources and sinks of atmospheric CO2 to compute how much the atmospheric CO2 concentration changes from one year to the next.
The sink (removal) of “excess” atmospheric CO2 assumes that all of the biological and geophysical processes that remove CO2 from the atmosphere do so at a net rate proportional to the excess of the CO2 value above some ‘equilibrium’ value. When the model is calibrated with the yearly Mauna Loa CO2 data from 1959 through 2021, this rate of removal is 2.02% of the atmospheric excess above 294 ppm. So, for example, at the current CO2 concentration of 417 ppm, the biological and geophysical removal processes are removing 0.0202 x [417 – 294] = 2.48 ppm per year for 2022 (preliminary estimate).
The long-term source of CO2 increase is assumed to be anthropogenic. There are various estimates of yearly CO2 emissions, some from energy use along, some including cement production and land use. I’ve used the Boden et al. (2017) and Our World in Data yearly estimates for 1750 through 2009, and EIA.gov estimates of yearly emissions growth rates from 2010 to 2050, and then assumed their 2050 growth rate is constant to 2100.
I also have included an ENSO term (El Nino and La Nina) to empirically account for CO2 rising during El Nino and decreasing during La Nina. This term amounst to 0.45 times the Multivariate Enso Index (MEI) value averaged from May of the previous year through April of the current year. For example, the latest yearly-average MEI value is -1.29 (La Nina conditions), so 0.45 x [-1.29] =Â -0.58 ppm CO2 decrease in 2022 from La Nina activity.Â
The model is initialized in 1750. The MEI data are included starting in 1958-59.
Results
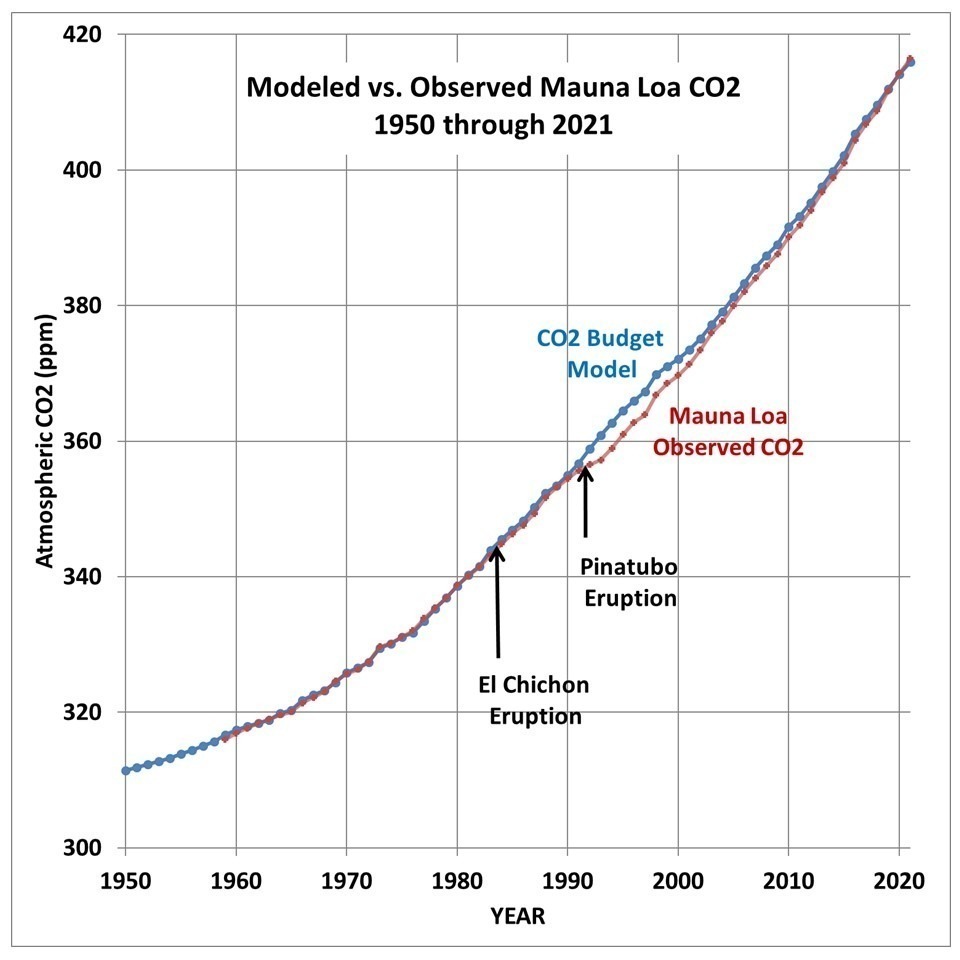
The model fit to Mauna Loa CO2 data is shown in Fig. 1. Note that the largest discrepancies between model and observations are due to major volcanic eruptions, especially Mt. Pinatubo in 1991.

Fig. 1. Model versus observed CO2 concentrations at Mauna Loa, HI.
Contrary to popular perception, these eruptions actually remove CO2 from the atmosphere. This is likely due to increased photosynthesis due to a large increase in diffuse solar radiation from the sky, from sunlight scattered by volcanic aerosols, which can penetrate deeper into vegetation canopies.
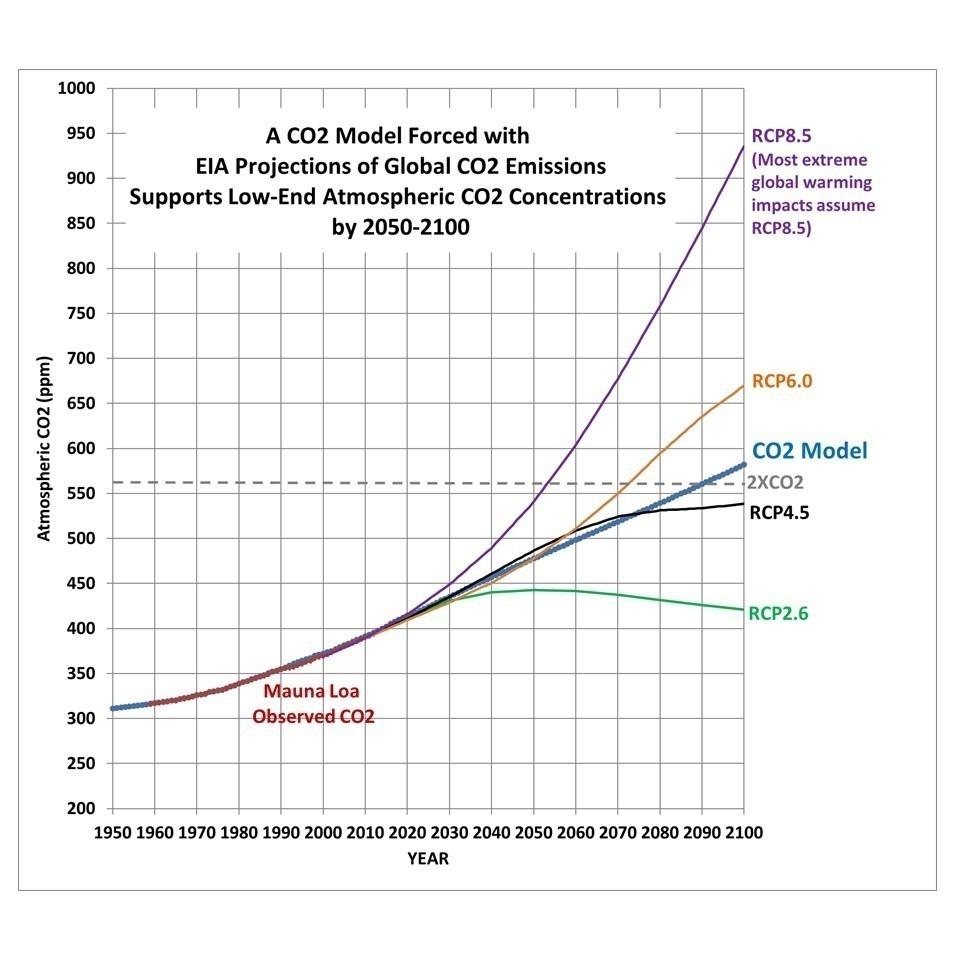
When we run the model using 2021 EIA estimates of yearly CO2 emissions increases from 2010 through 2050, and then assuming the 2050 increase remains the same to 2100, the resulting atmospheric CO2 scenario is closest to the IPCC RCP4.5 scenario. The model CO2 concentration barely reaches the 2XCO2 level, a doubling of the pre-industrial CO2 level.

Fig. 2. As in Fig. 1, but extended to 2100, with the various IPCC radiative forcing scenarios used in recent IPCC reports.
Note the model is well below the RCP8.5 scenario, which is the one most often used to promote alarmist projections of sea level rise, temperature increase, etc.
Discussion
Climate model projections depend critically upon how much atmospheric CO2 will rise in the future. That, in turn, depends upon (1) future anthropogenic emissions, and (2) how fast nature removes “excess” CO2 from the atmosphere.
A simple budget model of the atmospheric CO2 concentration very accurately matches the Mauna Loa CO2 data during 1959-2021 using yearly estimates of global anthropogenic CO2 emissions as a CO2 source, and the observed average rate of removal of CO2 by biological and physical processes, which is proportional to the “excess” of atmospheric CO2 over a baseline of 295 ppm. An empirical factor to account for El Nino and La Nina activity is also included.
The resulting model projection produces atmospheric CO2 concentrations late this century well below the IPCC RCP8.5 scenario, and even below the RCP6.0 scenario. This suggests that the most dire climate change impacts the public hears about will not happen. Note that this likely reduction in future global warming impacts is in addition to the evidence that the climate system is not as sensitive to increasing CO2 as is claimed by the IPCC. In other words, future climate change will likely be much weaker than projected due not only to (1) lower climate sensitivity, but also (2) weaker anthropogenic forcing, and it is the combination of the two that determines the outcome.
From the article: “Contrary to popular perception, these [volcanic] eruptions actually remove CO2 from the atmosphere. This is likely due to increased photosynthesis due to a large increase in diffuse solar radiation from the sky, from sunlight scattered by volcanic aerosols, which can penetrate deeper into vegetation canopies.”
Volcanic aerosols reflect sunlight away from the Earth and thus cool the Earth. I believe the Pinatubo eruption cooled the Earth by about 0.5C for about two years. Now Roy says here that volcanic aerosols increase sunlight hitting the Earth.
I’m confused.
And why would this particular sunlight penetrate *deeper* into vegetation canopies than other sunlight?
No reply. No answer?
My calculation of sink rate per atmospheric concentration implies also a maximum atmospheric level for a given annual emission.
and if ECS is less than 1, as seems increasingly likely, even 1000 PPM may have little to no effect
Does this simple model include the amount of vegetation increases with increasing CO2?
Once again we see many comments that support a view of CO2 concentration affecting the temperature. This ignores saturation and the effects of the atmospheric boundary layer on climate sensitivity.
There you have it. A very simple and basic view of atmospheric physics tells us that the claimed warming mechanism for future increases in CO2 is impossible.
I am sure you didn’t mean to say in #7 that CO2 creates energy just by doubling the number of molecules. That would be impossible.
If you increase the number of molecules you increase the mass and need more energy just to get back to the start point.
I was just referring to the claim that doubling CO2 creates an addition 3-4 watts/m2 of downwelling IR that is supposed to warm the Earth. I agree 100%. CO2 does not create energy. The energy is supposed to be converted to IR “via kinetic energy transfers” as I mentioned in #2.
Lapse rate.
Any reason why the figures aren’t showing?
So in 2040 the concentration would be around 450 ppm according to the model. That’s a good checkpoint and many of us will actually be alive then (hopefully) to see if it is tracking to that. Set a reminder on your calendar now and return to these comments to continue the discussion 🙂
I hear the terms like: estimates, assumptions, projections all cobbled together in another model to give outputs of +or- .oo% of something meaningful. Then to use this “Scientific Data” to plan the future of the Human race is …… I’m at a loss for words!
It’s heartening to see that projected CO2 needed for ECS doesn’t occur until 2090. If experimental/observational ECS estimates around 0.8-1.5 are right then even RCP4.5 is three to five times too hot.
where is the 7% drop in man made co2 emissions in the data due to 2020 lockdowns?
this shows co2 levels are dictated by nature.
The 7% drop equates to only 10.2 GtC * 0.07 * (1/2.13) ppm/GtC = 0.3 ppm. The yearly variation is 2.1 ppm. The signal (0.3 ppm) is only 1/7th the noise (2.1 ppm). To reject the null hypothesis (there is no difference in CO2’s influence on atmospheric concentration with human vs natural emissions) at p < 0.05 using a trivial analysis we would need to have had an 87% drop in human emissions in 2020 assuming that the null hypothesis really is false. Note that p < 0.05 is the minimum criteria for rejection. p < 0.01 is a more robust test, but requires an emission reduction beyond the 10.2 GtC figure for 2020. A more advanced analysis with better noise filters (like those for ENSO) would likely bring the threshold of detectability down to a 50% reduction sustained for a year, but that is beyond my expertise.
It should be noted that the graph in Figure 1 represents a gain of only 1/100th of one percent of the atmosphere.
I’m not sure that is relevant. The signal we are talking about here is the perturbation on the carbon mass in the atmosphere; not the mass of the entire atmosphere itself.
It is relevant to the entire discussion of the role of CO2 in global warming which is the purpose of all of this discussion. It is also a fact that gets little or no mention.
You mean the “yearly increase” rather than the “yearly variation”? I would have thought that a 7% reduction would be picked up by plotting the derivative of the raw data set as my understanding of climate orthodoxy is that 100% of the co2 increase is man made.