From Dr. Roy Spencer’s Global Warming Blog
July 18th, 2022 by Roy W. Spencer, Ph. D.
Summary
The simple CO2 budget model I introduced in 2019 is updated with the latest Mauna Loa measurements of atmospheric CO2 and with new Energy Information Administration estimates of global CO2 emissions through 2050. The model suggests that atmospheric CO2 will barely double pre-industrial levels by 2100, with a total radiative forcing of the climate system well below the most extreme scenario (RCP8.5) used in alarmist literature (and the U.S. national climate assessment), with the closest match to RCP4.5. The model also clearly show the CO2 reducing effect of the Mt. Pinatubo eruption of 1991.
The Model
As described here, the simple CO2 budget model uses yearly sources and sinks of atmospheric CO2 to compute how much the atmospheric CO2 concentration changes from one year to the next.
The sink (removal) of “excess” atmospheric CO2 assumes that all of the biological and geophysical processes that remove CO2 from the atmosphere do so at a net rate proportional to the excess of the CO2 value above some ‘equilibrium’ value. When the model is calibrated with the yearly Mauna Loa CO2 data from 1959 through 2021, this rate of removal is 2.02% of the atmospheric excess above 294 ppm. So, for example, at the current CO2 concentration of 417 ppm, the biological and geophysical removal processes are removing 0.0202 x [417 – 294] = 2.48 ppm per year for 2022 (preliminary estimate).
The long-term source of CO2 increase is assumed to be anthropogenic. There are various estimates of yearly CO2 emissions, some from energy use along, some including cement production and land use. I’ve used the Boden et al. (2017) and Our World in Data yearly estimates for 1750 through 2009, and EIA.gov estimates of yearly emissions growth rates from 2010 to 2050, and then assumed their 2050 growth rate is constant to 2100.
I also have included an ENSO term (El Nino and La Nina) to empirically account for CO2 rising during El Nino and decreasing during La Nina. This term amounst to 0.45 times the Multivariate Enso Index (MEI) value averaged from May of the previous year through April of the current year. For example, the latest yearly-average MEI value is -1.29 (La Nina conditions), so 0.45 x [-1.29] =Â -0.58 ppm CO2 decrease in 2022 from La Nina activity.Â
The model is initialized in 1750. The MEI data are included starting in 1958-59.
Results
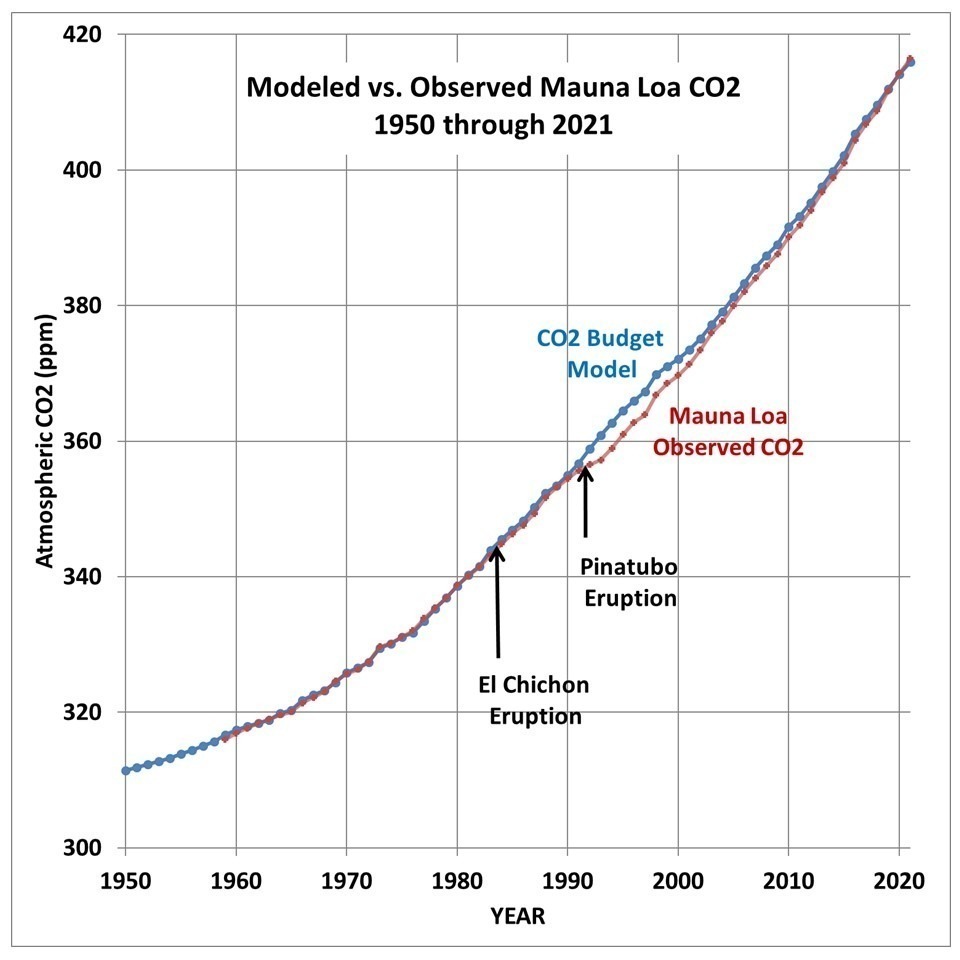
The model fit to Mauna Loa CO2 data is shown in Fig. 1. Note that the largest discrepancies between model and observations are due to major volcanic eruptions, especially Mt. Pinatubo in 1991.

Fig. 1. Model versus observed CO2 concentrations at Mauna Loa, HI.
Contrary to popular perception, these eruptions actually remove CO2 from the atmosphere. This is likely due to increased photosynthesis due to a large increase in diffuse solar radiation from the sky, from sunlight scattered by volcanic aerosols, which can penetrate deeper into vegetation canopies.
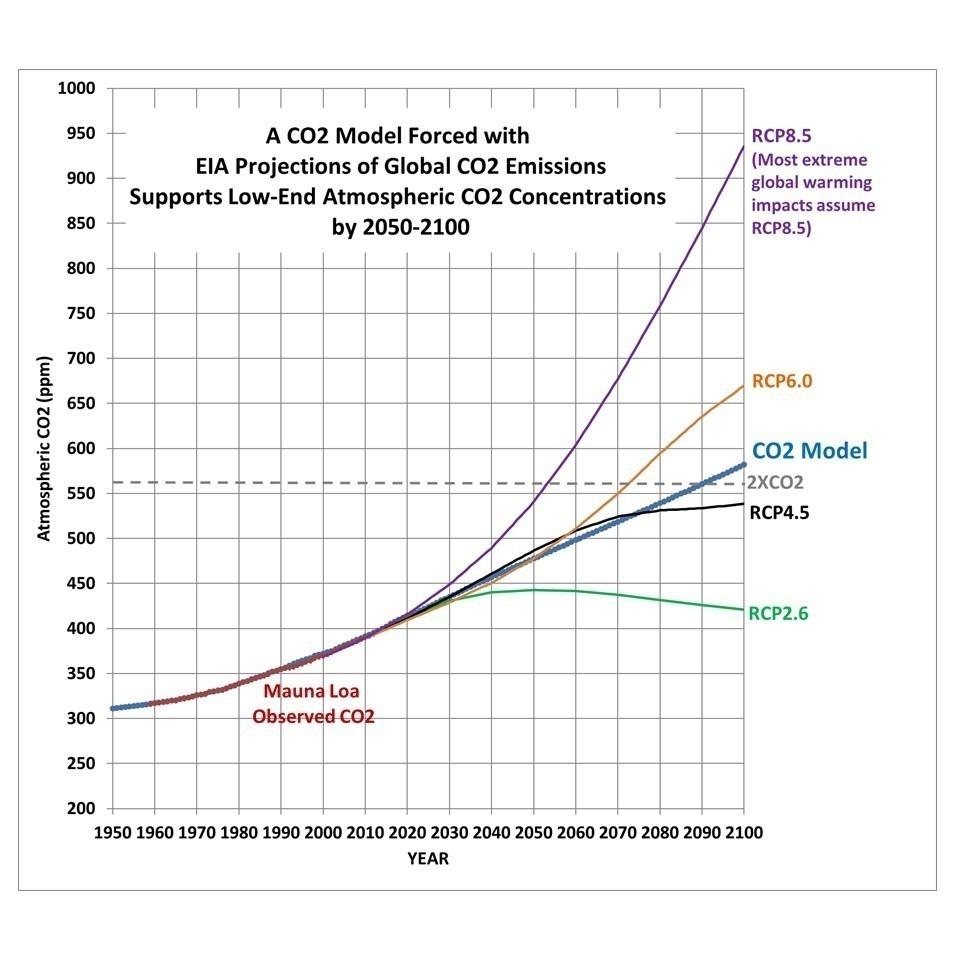
When we run the model using 2021 EIA estimates of yearly CO2 emissions increases from 2010 through 2050, and then assuming the 2050 increase remains the same to 2100, the resulting atmospheric CO2 scenario is closest to the IPCC RCP4.5 scenario. The model CO2 concentration barely reaches the 2XCO2 level, a doubling of the pre-industrial CO2 level.

Fig. 2. As in Fig. 1, but extended to 2100, with the various IPCC radiative forcing scenarios used in recent IPCC reports.
Note the model is well below the RCP8.5 scenario, which is the one most often used to promote alarmist projections of sea level rise, temperature increase, etc.
Discussion
Climate model projections depend critically upon how much atmospheric CO2 will rise in the future. That, in turn, depends upon (1) future anthropogenic emissions, and (2) how fast nature removes “excess” CO2 from the atmosphere.
A simple budget model of the atmospheric CO2 concentration very accurately matches the Mauna Loa CO2 data during 1959-2021 using yearly estimates of global anthropogenic CO2 emissions as a CO2 source, and the observed average rate of removal of CO2 by biological and physical processes, which is proportional to the “excess” of atmospheric CO2 over a baseline of 295 ppm. An empirical factor to account for El Nino and La Nina activity is also included.
The resulting model projection produces atmospheric CO2 concentrations late this century well below the IPCC RCP8.5 scenario, and even below the RCP6.0 scenario. This suggests that the most dire climate change impacts the public hears about will not happen. Note that this likely reduction in future global warming impacts is in addition to the evidence that the climate system is not as sensitive to increasing CO2 as is claimed by the IPCC. In other words, future climate change will likely be much weaker than projected due not only to (1) lower climate sensitivity, but also (2) weaker anthropogenic forcing, and it is the combination of the two that determines the outcome.
All the ominous climate scenarios require stacked improbabilities. Using RCP8.5 and a very high sensitivity to CO2 requires enough unlikely events or processes as to be nearly impossible.
“Fear is freedom! Subjugation is liberation! Contradiction is truth! These are the truths of this world! Surrender to those truths, you pigs who fawn over clothing!” ― Satsuki Kiryuuin
Orwellian NewSpeak
I argue there was never really CO2 ‘equilibrium’ back in the days before industrialization, so perhaps Dr. Spencer’s 295 ppm value for equilibrium isn’t physically valid. It is more likely the ocean was cold enough then for more CO2 sinking versus less CO2 outgassing than now.
If you look close enough to the 12m change in CO2 vs the same for HadSST3 (r=.84) you’ll see the effect of ENSO events there too, ie CO2 being thermo-regulated.
So while Dr. Spencer’s model ‘works’, it probably doesn’t capture the whole picture. For instance I can model the ML CO2 just as successfully as a function SST>25.5C. Accordingly, future CO2 rates should depend on ocean warm area growth too, not just on MME of CO2.
Bob maybe. Two possible counterpoints as ‘food for thought’.
Also, the volcanic impact is Fe related. In that, the fertilization at the surface of the ocean is the big driver. After all, the oceans are 70% of the CO2 absorption and the land-based absorption is really temporary.
However, the sea surface temperatures drive the outgassing of deep water upwelling in the tropics and western coasts at mid-latitudes. And, with warmer water at high latitudes, there is less atmospheric CO2 actively dissolved and removed from the atmosphere.
I was going to raise exactly the same point. The deep water and very long storage time is NOT what drives the SURFACE interactions where the exchanges happen. There is an up welling current in eastern Indian ocean where a lot of CO2 is released. Capture and downwards flow in the Arctic removes it.
Temperature has the most pronounced impact in moderate regions where it could go either way.
Sadly, an open beer is still going to go flat. Perhaps not so bad, since you likely drink it well before it does.
Be glad the pCO2 isn’t so high beer doesn’t bubble.
The “equilibrium” value is that which the data suggests the system is trying to relax to, assuming nature takes extra CO2 out of the atmosphere at a rate proportional to how much extra CO2 is present, which seems to me a reasonable assumption. It doesn’t necessarily mean that the pre-industrial value was 295 ppm, or that it was always constant before anthropogenic emissions. It’s just they way the system has been behaving during 1959-2021.
CO2 flows into and out of the atmosphere by many processes, some of which are well-known (absorption into the ocean, photosynthesis) and others which we have not studied yet or even discovered. Each process is a chemical reaction that can be modeled by a rate equation and an equilibrium equation. All of these reactions are going to be complicated but as you have shown, average out to a quasi-equilibrium equation whose driving force is the difference between a baseline concentration of CO2 and the current value. Your model does describe the data quite well for the last 60 years.
Your model assumes that the natural sources of CO2 do not vary. Researchers that analyze the ratio of C14/C12 in CO2 support this idea. Since the natural sources of CO2 are about twenty times the size of the anthropogenic sources, I find this assumption unlikely on its face but there is not enough research to declare the science settled.
Either way, I am not concerned about the rise in CO2 in the atmosphere, and the corresponding contribution to the general warming trend after the coldest period in the last ten millennia. Once we can determine what causes the warm/cold cycle within an interglacial and what causes a glacial period to start and end, then we can begin to determine if the climate is actually unusual, and if the change is beneficial or not. Wasting trillions of dollars before we even know if there is a problem that we can solve is beyond nuts.
Once we can determine what causes the warm/cold cycle within an interglacial and what causes a glacial period to start and end, then we can begin to determine if the climate is actually unusual, and if the change is beneficial or not.
Planets. Their whereabouts couldn’t care less what you or anyone else would deem “beneficial or not”.
Oddgeir
[excerpt]
“Contrary to popular perception, these eruptions actually remove CO2 from the atmosphere. This is likely due to increased photosynthesis due to a large increase in diffuse solar radiation from the sky, from sunlight scattered by volcanic aerosols, which can penetrate deeper into vegetation canopies.”
Roy, remembering our e-conversation from 2008, I wonder if Henry’s Law provides an alternate or complimentary explanation (I’ve only had 2 hours sleep so take this question with a ton of salt):
Changes in atmospheric CO2 lag changes in SST by ~11 months and lag changes in LT temperature by ~9 months (MacRae 2008, Humlum et al 2013).
https://www.woodfortrees.org/plot/esrl-co2/from:1979/mean:12/derivative/plot/uah6/from:1979/scale:0.18/offset:0.17
Century-scale volcanoes cool Earth by “aerosol-dimming” of the atmosphere and cooler SST causes more CO2 to be absorbed into the ocean.
That process does not preclude an additional photosynthetic impact as you proposed.
All this happens despite the major discharge of CO2 from the volcanoes into the atmosphere.
I’ll catch some sleep while good people mull over these thoughts.
I argue there was never really CO2 ‘equilibrium’
There is always a CO2 equilibrium. Said equilibrium is constantly a function of the temperature in the SST (plus carbonate concentration and salinity in that SST, whatever “surface” is in actual water depth I have not been able to establish) versus CO2 partial pressures in near-surface water/atmosphere resulting from said temperature.
It doesn’t take a climate fictionist to understand that oceanic partial CO2 pressure in turbulent water ~1ft from the surface increase with increased temperature, does it?
Meaning the equilibrium is DYNAMIC but never the less it is even MORE real and observable than your capacity to serve your debts (which is a function of level of debt versus your will to spend enough of your disposable income to keep the equilibrium constant).
“It is more likely the ocean was cold enough then for more CO2 sinking versus less CO2 outgassing than now.”
Yess, ref to “1ft from the surface” as described above..
/
Pointing fingers and accepting I might be accused of performing an ad hominem here, dr. Roy is a Christian and might, as a Christian, feel it to be his responsibility to eccho the Church’s position. Also reference to his acceptance that the result of burning hydrocarbons is increasing CO2 is anthropogenic hence Climate Ficton is anthropogenic albeit warming of the planet is beneficial. Meaning…
dr. Roy is the best of two worlds: A lukewarmer. A Climate Fiction Alarmist and also a Climate Change denier. Mostly however, an alarmist.
Sorry Roy.
For instance I can model the ML CO2 just as successfully as a function SST>25.5C.
I can do the same with the 22 year cycle. Nope, it is NOT the 11 year halfcycle.
Accordingly, future CO2 rates should depend on ocean warm area growth too, not just on MME of CO2.
Ocean turnover time is 500-1000 years? That’s nada. That’s from year 900 and change and until year 2000 plus/minus change. That’s today.
Future CO2 rates will depend on what up-welling can release into the atmosphere.
Oddgeir
Bob Weber wrote, “I can model the ML CO2 just as successfully as a function SST>25.5C”
No, you can’t. The current atmospheric CO2 level is around 130 ppmv higher than the peak CO2 level during the Eemian interglacial (determined from air bubble samples in ice cores). But during the Eemian the Earth’s temperatures — including sea surface temperatures — were certainly at least as warm as they are now — probably quite a bit warmer.
That 130 ppmv rise (a total of 220 ppmv since LGM, to about 417 ppmv now) is more than 40% larger than the range of CO2 levels over the course of past glaciation / deglaciation cycles. The 130 ppmv anthropogenic increase is in addition to the 90 ppmv CO2 rise during the deglaciation at the start of the Holocene.
The (current) Holocene’s sea surface temperatures have not risen 2.4× as much as sea surface temperatures rose during the onset of the Eemian, obviously, so it is impossible to model CO2 as a function of SST.
Dr. Spencer’s model works because it accurately models the summed key physical processes which remove CO2 from the air:
All of those processes are roughly linear functions of atmospheric CO2 concentration, so their sum must also be roughly linear. That means we can accurately predict future natural CO2 removal rates as a function of atmospheric CO2 concentration, which is what Dr. Spencer has done.
The effect of sea surface temperature on atmospheric CO2 level is very minor, compared to the effect of anthropogenic CO2 emissions. The oceans are removing CO2 from the air, not adding it. Rising sea surface temperatures have slightly reduced the removal rate of CO2 from the air into the oceans, that’s all.
Since 1959, about 180% of the atmospheric CO2 concentration increase is of anthropogenic origin: Mankind added ≈180 ppmv, Nature removed ≈79 ppmv, and the concentration increased by ≈101 ppmv.
And that’s literally the bottom line on AGW.
Actually the bottom line comes from the warming trend from Spenser’s UAH satellite data… which from 1979 projects to a warming of 1.3 degrees / century… an “observed” warming that’s hardly very scary.
Extrapolation of the past 30 to 50 years of temperature change to predict the next 30 to 50 years of temperature change has failed twice in the past 110 years:
1910 to 1940 warming did not predict 1940 to 1975 cooling
(before that cooling trend was arbitrarily “adjusted away”)
1940 to 1975 cooling did not predict 1975 o 2020 warming.
There is no logical reason to assume UAH 1979 to 2022 warming should be extrapolated to accurately predict the next 42 years of temperature changes.
Projecting linear regression lines into the future is the *worst* way to predict the future of cyclical processes.
Alarmists think trends go on forever.
The obsession with “trends” is for those who do not understand anything more complicated. ( They loose a fortune trading shares ).
Anyone with even BASIC scientific training knows that you cannot project a trend or any function fit much outside the calibration data period. They all KNOW this. So all the BS claims are deliberate and deceitful.
aka LIES.
Almost all trends for climate related phenomena are done in time. Time is generally not a variable in the phenomena other than for seasonal variation.
That is why traders that rely on time trends lose their shirts. Professional traders pore over financial information from companies and economic forecasts of products. In other words, they understand the functional relationships of the variables that determine a companies results.
Dr. Spencer has at least tried a model with with a temperature variable. I’m not sure this will turn out to be correct, but it is a start. Only validation of actual data will verify its usefulness.
Interglacials typically last 20,000 to 30,000 years… if that periodicity holds up it means the planet is on the last phases of the current interglacial… say 500-1000 years. Within this long phase of glacial-interglacial periods, in the past two millennia warmin periods (Roman and Medieval) last 300 years or so followed by little Ice Ages of similar duration. All of which indicates that we can expect 100-150 years of warming, followed by a similar cooling trend until we fall off of this interglacial for good. A slow warming of a little more than 1 degree C for the next century or so is probably a reasonable expectation.
Trendology is not science.
No, but trends, noticing them and trying to figure out why has been part of science from the beginning, all the way back to noticing the passing of the seasons and the phases of the moon.
I think you need to examine the meaning of “trend” vs “cycle”. Seasons and moon phases are cycles as is the rising and falling sun. The “science” did not use linear trends to predict these occurrences. The “science” used observations to develop the periods of the cycles which could then be used to make validated predictions.
There are trends within the cycle. The planet is in a warming phase (similar to the Roman and Medieval warming) … and the trend indicates if the warming inside that trend is a danger or not. It’s not.
In the next 125-250 years a cooling trend will appear , analogous to the Little Ice age. That cycle will continue until the interglacial cycle itself ends and a New Ice Age prevails for a long, long time.
Ok Einstein. What will global temperatures be in 25 years? 75 years?
And your “better way” is what? Show me some numbers.
I remember newspapers carrying articles expressing the concerns in the 1970s about global cooling due to all the evil & wicked free-enterprise capitalism, then it stopped cooling & started warming! The Intellectual Left are always on the lookout for a new scary story to frighten the peasants with, to achieve their ultimate goal, manipulation & control of us peasants!!! Global Warming seems to fit their agenda perfectly!!!
10 years vs four decades…
The 40 year trend includes shorter term warming and cooling … but hey, show me a better starting point and your own projections for global temperatures 25. 50, 100 years from now.
Just go Nuclear and energy becomes cheaper while CO2 increases become negligible and you have the best of all worlds. The developing world uses carbon while the developed world goes Nuke.
But nope – it HAS to be solar and wind. Solar and wind. SOLAR and WIND.
The only two sources that cannot be sustainable ( wind doesn’t always blow, sun doesn’t always shine ) are apparently the ONLY sources deemed sustainable.
SO STUPID.
Going nuclear only solves the electricity portion of the equation, not the industrial or transportation ‘carbon issues’. But since observational ECS is half modeled, and all the ‘future bad stuff’ only happens under impossible RCP8.5, there are in reality no ‘carbon issues’ to solve. Moderate warming is beneficial (longer temperate growing seasons), while the planet greens.
Burning coal leaves coal ash, which is a pollutant, and air pollution if the coal power plant does not have modern pollution controls.
Burning gasoline and diesel fuel without modern pollution controls also causes air pollution. Such as with old ICE cars, old truck diesel engines and two cycle gasoline engines.
There are serious air pollution problems in many large Asian cities.
Replacing coal with natural gas slashes real sulfur pollution, as was witnessed in western Europe, however the adverse effect is more sunshine.
More sunshine resulted in a 9 W/m2 increase in incoming radiation since 1980 for Europe, far more than the theoritical effect of the 50% increase in CO2.
Based on data from KNMI the more sunshine resulted in an increase of more than 12 W/m2 of incoming radiation in De Bilt since 1980. This can be checked with KNMI Explorer. This is far more than the effect due of increasing CO2.
More sunshine means more incoming radiation. In De Bilt the incoming radiation increased with more than 12 W/m2 since 1980. This can be verified at KNMI Explorer.
SO2 emissions are already down 75% to 80% since 1970 — there’s not much room for addition reductions
from the 1970 level.
Any effect on incoming solar energy from further SO2 reductions is likely to be very small.
Yes gas and oil is better than coal. If we weren’t screwing with Russia we’d have plenty of both.
The other problem, as you say, are already fixed. Poor countries have air polluion problems because they are poor. Not because CO2.
I do not define Chin and India as poor countries anymore. Especially their large cities. Their large cities have air pollution problems
If Putey Putin was not screwing with Ukraine,,,if Germany had no tied itself to Ruzzian gas. Beijing has a big dust problem from the Gobi desert.
Russia is screwing with us.
Then spend money on modern pollution controls instead of on unreliable wind and solar. In fact, the fly ash collected by modern pollution control from coal-fired plants makes a great replacement for a good percentage of cement in concrete. Cement production is cited as a major source of carbon dioxide emission. So, IMO, coal fired plants with fly ash captured should be considered a positive by the wacky left.
Yep, fly ash plays an important role in cement production. 200 – 450 kgs of coal is needed to produce 1 tonne of cement (Word Coal Association)
Assuming moderate warming continues.
Anyone who thinks CO2, the basis of all life on Earth, is more dangerous than nuclear waste is probably beyond help.
Why do you believe people are responsible for the observed CO2 rise? Just because everyone says so? Correlation is not causation.
Because if I release an approximately known volume of CO2 in an enclosed volume, and see my CO2 meter rise, I think it’s probably my doing….
And when I calculate that what I’ve released should increase my CO2 meter by approximately double what it has increased by, I tend to think something in the enclosed space is absorbing half of what I released.
Maybe if I release a fixed amount, whatever is absorbing CO2 in the fixed volume will cause the meter reading to level off at some higher value…but we don’t know that yet….
Study up on the known C14/C13 atmospheric ratios. They definitively resolve the rise issue in favor of anthropogenic emissions. Argue stuff in doubt, not Murray Salby weird stuff not in doubt.
I hesitate to wade in here but I’m a glutton for punishment and I’d really like to know the answer.
A question, do we know all of the natural sources of CO2? Do we not need to know those to do the calculations for how much Man is adding to the atmosphere and how much is natural?
For instance, I don’t think this was discovered until fairly recently
Best case scenario, termites emit 200% more than humans.
Worst case scenario, it’s almost 900% more
D9k-1q5XkAEJR9F.jpg
Zimmerman et al was based on field measurements of emissions. (It’s entirely possible termites emit double the measured values if half are trapped by the soil)
Termites emit methane, which eventually (7-year half life) oxidizes to CO2
They’re pretty smart, too. They kept running into crude when digging tunnels deeply under their mounds, which they found to be very messy. Being neat freaks, they got the idea to get humans to take some of that oil away for them.
It’s symbiotic, not abiotic.
Nature is a net CO2 absorber of some of the CO2 humans add by burning fossil fuels.
Natural sources of CO2 are smaller than natural absorption of CO2.
Sometimes even an net absorber/consumer of ALL human co2 emissions, as after the eruption of Mount Pinatubo caused co2 emissions to flatline for a couple of years, from ocean fertilization from the ash fallout, and possibly from ash in the air causing sunlight to be more diffuse so able to penetrate deeper into forest canopies.
Did you mean the 13C/12C atmospheric ratios?
The methane and carbon dioxide being released from Pleistocene organic detritus in the melting tundra should look very much like the isotopic composition of older fossil fuels. I’m strongly suspicious that we are seriously underestimating the Arctic emissions because the Arctic is warming 2-3X faster than the global average. Also, the respired CO2 from the roots and needles of trees in the boreal forests of Canada and Russia should be enriched in 12C, and has probably been increasing as the Arctic warms in the Winter.
There is that Arctic warming 2-3X faster than average. Bull puckey.
Other than that you can spell 2 and 3 syllable words, what is your point? Do you have evidence you can cite that the Arctic is not warming faster than the global average?
The assumption that Carbon 14 reservoirs remain constant is inherent in those calcs….whether it’s a weakness, we don’t really know, but the calcs show how smart we are so we like ‘em….
Natural Carbon emissions that would be depleted of Carbon-14, and therefore look like fossil fuel emissions (non-exhaustive list, just off the top of my head):
Any previous fossil fuel emissions that have been taken up by the biosphere (it will take time before the carbon can be irradiated by cosmic rays up to the level in the rest of the biosphere).
Decaying plant/animal life or peat exposed by melting permafrost or retreating glaciers.
Volcanic eruptions.
Undersea vents, ‘black smokers’.
Methane leaks not from oil/gas production like from fissures and methane hydrates melting or being disturbed by quakes or landslides.
Deep ocean carbon dioxide that has finally made its way to the surface through upwelling or being incorporated into plant or animal life.
Even James Hansen agrees with you.
“Suggesting that renewables will let us phase rapidly off fossil fuels in the United States, China, India, or the world as a whole is almost the equivalent of believing in the Easter Bunny and Tooth Fairy.” – James Hansen (The Godfather of global warming alarmism and former NASA climate chief)
***
From ‘Baby Lauren and the Kool Aid’, James Hansen 2011
Remind the renewable believers about commercial sailing ships often becalmed or forced to change course because of wind conditions and how owners quickly adopted the steam engine propulsion and after a short period of dual power sources abandoned sails.
The UK Guardian had a ‘Long Read’ story last week (14th July) entitled “Shipping’s new wave. Global trade depends almost entirely on huge, dirty, dangerous container ships. What would it take to bring back wind-powered cargo?”
It details the not entirely successful attempt by a French company to reintroduce ‘zero carbon’ wind powered cargo ships.
The company is now planning a second larger sailing cargo boat, 50 metres long and capable of carrying 350 tonnes of cargo. This is “pushing against the upper size and scale of a sailing boat.”
Compare that to a modern container ship capable of carrying over 20,000 Twenty Foot Equivalent Unit (TEU) containers!
“SO STUPID”
That’s Biden. It doesn’t get much dumber than him.
I hear Biden is going to declare a National Climate Emergency in the near future. I wonder what kind of stupidity that will involve? You can bet it will be SO STUPID.
January can’t come soon enough.
“That’s Biden. It doesn’t get much dumber than him.”
Some try…
Why not go all three? Nuclear can back wind and solar which take advantage of potential energy that would otherwise be wasted.
Nuclear can’t back up weather-dependent generators. That’s not how this stuff works.
Nuclear is base load and not easy to ramp up and down to match fluctuations in demand or the fluctuations in supply inherent to wind and solar. Only gas can match demand. The best wind and solar can do is reduce the amount of gas you have to burn at peak demand *if* the abundant sun and wind happen to coincide with peak demand. Electricity generated by wind and solar when it is not needed above base load is just wasted. The gas burners have to be big enough to meet 100% of peak demand in case wind and solar are producing nothing during that peak period. No matter how much potential energy you might be able to grab from the weather, it is useless unless at least some of it comes at peak demand times.
The Holy Grail is some way to store the electricity that the weather generates when it’s not needed and to then draw on it when demand peaks. Pipe dream so far.
Nice summary!
“Why not go all three? Nuclear can back wind and solar which take advantage of potential energy that would otherwise be wasted.”
Wind and solar would only be fit to use in remote areas where the costs of transmission lines or hauling fuel to the location would be cost prohibitive. They also would likely be good in specific set functions – like a future hi-rise or factory covered in panels that used the electricity to run the airconditioning (if the peak period of need was 10-4pm).
But they shouldn’t be connected to the grid where people are looking for dependable and inexpensive electricity.
Of course, cheap storage will help the wind and solar case, as would dramatic improvements in longevity.
We need to “go nuclear” because it provides reliable, affordable baseload power, unlike solar and wind, and because nuclear energy won’t run out (or gradually become prohibitively expensive), unlike fossil fuels. But nuclear energy’s lack of CO2 emissions is a downside, because CO2 is beneficial, and a decline in atmospheric CO2 concentration will be harmful.
Unfortunately, such a decline is what will happen if nuclear energy largely replaces fossil fuels. If that happens, the CO2 increases won’t become negligible, they’ll become negative. Nature is already removing about 2.5 ppmv of CO2 from the atmosphere each year, so if our emissions were to drop below that rate then the atmospheric CO2 concentration would cease rising, and would, instead, decline.
I analyzed this some years ago in an effort to answer a slightly different question, ‘which RCP is most likely to be BAU (business as usual)?’, for purposes of writing parts of several essays in ebook Blowing Smoke. This was back when RCP 8.5 was touted as BAU, before the widespread skeptical realization that it was likely just impossible. My conclusion was something a bit above RCP 4.5 and well below RCP6.0. My analysis was neither as elegant nor as precisely matching the data as this post. But it reached the same basic conclusion by more general reasoning means. Triangulation on a result via different means is always comforting.
If you just used physics and didn’t take the observed data into account, then your approach might be valid. Lorenz
On the other hand, if you used the observed data to tune your model, you’re just curve matching. It’s a rather simple curve so everyone should be able to reproduce it.
As was pointer out by a Harvard professor back in the 1960’s (“The Population Bomb”), our earth was at a starvation level for CO2, having been most likely put there by the meteor which killed off the dinosaurs and buried the latest bunch of coal (See the relatively recent study “Age of Coal”.) CO2 levels were far higher in previous geologic eras with no damage as a result. Our burning of coal to provide power has been our salvation, and we should continue to do so.
I did a calculation a while ago for a comment here. There are of course some uncertainties. But if you take 150ppm as the threshold for viable photosynthesis in C3 plants (experimentally determined), and estimate the rate of ocean sequestration as CaCO3 (experimentally determined by deposition rates above 2000 meters), then without plate tectonics and resulting subduction volcanism recycling of same into the atmosphere as CO2, the planet dies of CO2 suffocation in about 1.5-3 million years. Thank goodness for plate tectonics.
If the plate tectonics also lead to volcanic eruptions the co2 suffocation can be spead up! Mount Pinatubo spewed ash full of vital minerals into the sea and hence fertilized the oceans and probably land as well – resulting in the Keeling Curve leveling off for a few years – and it’s interesting that there wasn’t an initial peak in co2 with a later aggressive draw down – at least the graphs shown here don’t have the resolution
The Population Bomb was written by a Stanford Professor.
I’d rephrase that: the human factor in any future climate change is likely to be much weaker than projected.
What about volcanic ash fertilizing nearby oceans with iron and sulfur?
Wasn’t the CO2 effect in the atmosphere logarithmic anyway (not linear), so “saturation effect” would mean that its potential to diminish back radiation into space would taper off rapidly as its atmospheric concentration increased?
When supposed observed temperatures are plotted against proxy and observed CO2 concentrations there is an apparent logarithmic relationship, whatever than means.
It is inherently logarithmic, as shown by Guy Callendar in 1938. It means that a doubling is not linear 2x, but only logarithmic 1x. The reasons are basic and simple, explained in essay ‘Sensitive Uncertainty’ in ebook Blowing Smoke. About that there is no doubt.
The logarithmic effect is included in climate sensitivity as it is expressed in temperature increase per CO2 doubling.
There is no climate sensitivity to CO2.
I wonder whether the CO2 decrease observed after a major volcano is simply due to the volcano cooling the oceans.
The Australian forest fires were barely CO2 positive due to ocean fertilization re article on WUWT and its fast.
Volcanos are big Fe sources and we have a Tongan event still in play with red sky’s.
be interesting to see if they have an impact.
The CO2 that has been absorbed into the world’s oceans does not remain there as a total gas in solution, ready to outgas solely as a function of CO2 solubility verses temperature . This is a common misperception.
In the oceans, a really insignificant amount of CO2 remains as a gas in aqueous solution (see Figure 1, the Bjerrum plot, at https://www.soest.hawaii.edu/oceanography/faculty/zeebe_files/Publications/ZeebeWolfEnclp07.pdf ).
As long as the average ocean pH level remains on the basic side (i.e., in the range of 8.1-8.2, as it currently is and is strongly buffered to remain so), one cannot expect decreasing global surface temperatures to result in significant amounts of CO2 “outgassing” from oceans.
Ooops, the time-for-editing expired before I could make necessary corrections/additions to my above post.
Here is the revised version:
The CO2 that has been absorbed into the world’s oceans (as a result of partial pressure differential) does not remain there as a total gas in solution, ready to absorb/outgas solely as a function of CO2 solubility verses temperature . This is a common misperception.
In the oceans, a really insignificant amount of CO2 remains as a gas in aqueous solution (see Figure 1, the Bjerrum plot, at https://www.soest.hawaii.edu/oceanography/faculty/zeebe_files/Publications/ZeebeWolfEnclp07.pdf ).
As long as the average ocean pH level remains on the basic side (i.e., in the range of 8.1-8.2, as it currently is and is strongly buffered to remain so), one cannot expect decreasing global surface temperatures to result in any significant change in the rate of atmospheric CO2 “uptake” from oceans.
The inverse of this is also true: a rising average temperature of the world’s ocean does not directly lead to “outgassing” of CO2 from the world’s oceans. This is another common misperception. It does, however, lead to a decrease in the rate of uptake of CO2 by the oceans.
To your specific point: the delta-T in average ocean temperature caused by any single volcano’s emissions (via ejected particulate or SO2 reduction of incoming solar radiation) will have an insignificant effect on average ocean temperature, and hence ocean CO2 uptake rate.
And yet the ocean does “outgas” CO2 in the low latitudes and it also does “sequester” CO2 in the higher latitudes proving that sea surface temperature (SST) is the predominant factor that determines this process.
(Ocean CO2 flux estimates are available on the internet. Very ifffy!)
When – and if – the total sea surface area outgassing is much larger than the total area sequestering then the net amount of CO2 from the ocean will be contributing to the rise of atmospheric CO2.
I am of the opinion that this is already taking place.
KAT,
Is it purely the ocean water, or instead abundant marine life (such as phytoplankton and algae) that is cycling/recycling CO2 with geographic latitude in ocean surface waters, largely as functions of water temperature and nutrient concentration?
Since the pH of the world’s ocean does not vary that much by latitude, I maintain that the second possibility is the more likely explanation for your observation.
My guess is atmospheric CO2 will stabilize around 500 ppmv by 2100. Why? Two reasons – 1) CO2 levels seem to be driven mostly by biological activity, which follows warming; 2) There is only so much warming we will continue to have before the climate grows colder again and biological activity diminishes once more.
From the 1963 Bomb Spike, we know the half-life of CO2 in the atmosphere is 5 years. This time is far short of the 30-50 years required by IPCC to blame humans burning fossil fuels and wood since 1750.
If you look at the OCO2 (NASA satellite mission measuring atm CO2) model, you will see NH winter with most CO2 emanating from cities. As the arctic region thaws, plants begin to respire and burn stored energy to grow leaves. At this point, the NH is filled with CO2 dwarfing anything humans do. However, further into Spring, the NH CO2 drops dramatically, far below the level in early winter, because plants are scavenging all the CO2 they can from the air. In the equatorial region, particularly in the Amazon, a pulsing CO2 level is seen in the model. This pulsing is consistent with the diurnal cycle of light and dark, where CO2 rises at night and falls during the day. From this model it is clear biology dominates CO2 levels in the air. Humans only slightly perturb the system.
and rain also absorbs a lot look at nullschool CO2 levels. Low CO2 is when the rain is greatest.
Murry Salby argued along the same lines as you do Hoser… net human forced CO2 levels around 2% or less… hardly enough to drive sharp divergences in global climate… if indeed CO2 drives mush of the climate at all..
Humans emitted the equivalent of 310 ppm of carbon. If only 2% or 310 ppm * 0.02 = 6 ppm of that is attributable to the 130 ppm increase in the atmosphere then where did the remaining 330 ppm – 6 ppm = 324 ppm of human emissions go if not into the atmosphere? And from which reservoir(s) did the remaining 130 ppm – 6 ppm = 124 ppm of the atmospheric increase come?
Where did you pull that fantastical number from?
Friedlingstein et al. 2022. 660 GtC * (1/2.13) ppm/GtC = 310 ppm.
bdgwx cites Friedlingstein et al. 2022 as the source of his ridiculous statement that “Humans emitted the equivalent of 310 ppm of carbon.”
The key problem in their paper is actually stated in the second sentence of the abstract of their paper:
“Here we describe and synthesize datasets and methodology to quantify the five major components of the global carbon budget and their uncertainties.” (my underlining emphasis added)
See that? . . . notice that? . . . their conclusions are based on synthesized datasets.
Now what could possible go wrong with that?
That bdgwx could blindly overlook that fact speaks volumes.
BTW, any “scientific” paper that lists 94 (yes, ninety-four!) coauthors, cannot possibly be taken as being serious.
Before then the tipping point will be reached and we will all be in serious trouble.
maybe the goal posts will be moved again and we will be saved?
/sarc.
I don’t remember that. Can you point me to the supporting OCO-2 map?
This, the first OCO-2 image released, is the most iconic, showing most CO2 in the Amazon Basin and sub-Sahara Africa, not exactly known for urban development:

Oct 1 – Nov 11 in the northern hemisphere would still be fall, not winter, when flora has been storing its carbon and water in the roots. Yet the most populated parts of the NH are showing greater CO2 than the less dense shows. As the equatorial belt is both more highly populated and greener than other parts of Africa and SA showing higher CO2 that doesn’t change much year around and would also include Mona Loa.
The seasonal draw-down phase ends in the NH in September, and the ramp-up phase resulting from biological decomposition of leaves begins then. The East Coast of the US has large cities, but also is home to abundant deciduous trees. How do you explain the arcuate region in Canada, SE of Hudson Bay, with elevated CO2 and sparse population? How do you explain the dearth of CO2 over India? How do you explain the low CO2 in Western Europe if CO2 is associated with cities?
But known for the heaviest vegetation on Earth.
Only slightly off topic, GISTEMP Land Ocean Temperature Index is out for June 2022, and the number of changes made since the May 2022 publication is 261.
So far this year the the number of monthly changes looks like this:
Jan Feb Mar Apr May Jun Jul Aug Sep Oct Nov Dec
291 243 252 401 346 261
This is a steady drone that goes on month after month, year after year
LINK
The Fraud Squad.
Your numbers seem low. GISTEMP has posted 486 updates since its inception. Since the input repositories are continuously accepting past observations from the still ongoing record digitization projects I would expect all months to be very close to 486. The reason you are getting lower counts is probably due to the rounding to 2 decimal places. If you modify the gio.py file to output more digits you should notice every month changing even if it is only in the 3rd or 4th decimal place.
My quick count shows over thirty of consecutive two months reports to have more than 500 changes made. My file has 151 LOTI files saved back to June of 2003 and the file is complete back to June of 2016. There are 83 files missing. GISTEMP blocks the Internet wayback machine from saving files. It’s a monthly chore to pull up GISTEMP around the third week of the month and save the LOTI file.
This is not science it’s just a computer game. Observations not models. Nothing else is relevant.
There are no observations of the future climate.
No data for the future.
Just unproven theories and speculation.
Also, hand waving and hysterical predictions of doom.
Observations require models. In the case of CO2 concentration at Mauna Loa it is dependent upon models built on top of models. Most people are not aware that CO2 concentration at Mauna Loa is determined by measuring the amount of infrared radiation being blocked by atmospheric CO2. See details regarding non-dispersive infrared (NDIR) or cavity ring-down spectroscopy (CRDS) instruments for more information on how it is done.
Actually CO2 sensitivity is likely well be low 1 (Richard Lindzen puts ECS at .8)… Global temperatures are largely impervious to CO2 levels. The proof of this is that even in recorded history, climate was as warmer or warmer than today, and certainly much colder all while CO2 levels remained constant at app 285 ppm.
Current weather information for Mauna Loa where all that nasty CO2 is measured. Now what is the problem?
Not the only place it’s measured
Not the point Bob. The Mauna Loa measurements are always used as the first reference for global CO2 levels because the atmosphere is considered “well-mixed” there. The point I’m trying to make is that the idea that increased CO2 will make the world hotter is disproved by the fact that CO2 levels measured around the world do not correspond to temperatures measured around the world. A map of CO2 concentrations does not show higher temperatures where the CO2 is more highly concentrated.
To test this hypothesis, one should look at the monthly CO2 draw-down during the Spring/Summer seasonal draw-down phase and compare to current and pre-Pinatubo curves. If the draw-down isn’t steeper, with a larger net reduction, then the hypothesis is invalidated. Then, one needs to look for another explanation.
based on 25 years of reading climate science and energy articles and studies, my strongest lesson learned is to not believe predictions related to the climate. They have been inaccurate, to be kind. Roy Spencer violates that rule of thumb. There is no particular reason to take his predictions more seriously than predictions other scientists.
Never forget that “climate change” is a prediction of a coming climate crisis … that has been predicted for at least 50 years so far.
The imagined climate crisis is not reality — it’s just a prediction.
Don’t we already have too many climate predictions?
It seems that few predictions are for a better climate
in 50 to 100 years. That reflects a negative bias.
The predictions are for warmer. Warmer is better since it sure beats the alternative.
Can I help it if a bunch of nuckin’ futz people can’t comprehend that? It’s like being in line to inherit millions of dollars and all you can see is problems.
I still can’t figure out why any Canadian would be against global warming. It makes no sense to me.
Doesn’t make sense to this Canuck either!
Warmer, Baby! Warmer!
More hockey stick horse-schittt!
Is NYC under water yet? (predicted by these same idiots in 1998) Call me when it is!
“Is NYC under water yet? (predicted by these same idiots in 1998) ”
Really? Got a reference for that?
The National Geographic…
😉
Jimbo Hansen…
https://dailycaller.com/2016/04/12/scientist-who-predicted-ny-city-would-be-underwater-says-hes-not-an-alarmist/
1988 + 20 = 2008
1988 + 40 = 2028
That is fake news. James Hansen did not predict that New York would be underwater in 20 or 40 years.
from Daily Caller, 2016:
““I don’t think that I have been alarmist — maybe alarming, but I don’t think I’m an alarmist,” James Hansen, who used to head up NASA’s climate arm, told Yale Environment 360 in an interview republished in The Guardian Tuesday.”
from the interview:
——————————————————————
We know from the earth’s history that 2 degrees would eventually lead to sea level rise of several meters. The last inner glacial period, 120,000 years ago, that’s the last time it was warmer than today, sea level was 6 to 9 meters higher — that would mean loss of almost all coastal cities. It’s unthinkable that we walk into such a situation with our eyes open, and yet, the science is very well understood.
There’s no argument about the fact that we will lose the coastal areas, now occupied by most of the large cities of the world. It’s only a question of how soon. That message, I don’t think, has been clearly brought to the policymakers and the public. More than 190 nations agreed [at the Paris climate conference last December] that we should avoid dangerous human-made climate change. That loss of coastal cities would be a dangerous outcome.
———————————————————
Tim, more specifically, in 1988 Hansen was asked by journalist and author Rob Reiss how the ‘greenhouse effect’ would affect the neighborhood outside his window within 20 years (by 2008). His reply was “The West Side Highway [which runs along the Hudson River] will be under water,’ Hansen claimed. “And there will be tape across the windows across the street because of high winds. And the same birds won’t be there. The trees in the median strip will change…. There will be more police cars … [since] you know what happens to crime when the heat goes up.”
— source (among many others): https://www.salon.com/2001/10/23/weather/
(N.B. Reiss later clarified that his misspoke about the “20 years” prediction, and that it was actually asked of Hansen for 40 years into the future. That would be for 2028 . . . so we have 6 years left to go for Hansen to be shown to be correct . . . but the trend of water-level rise in the Hudson does not favor Hansen.)
BTW, in 1986, Hansen also predicted in congressional testimony that the Earth would be some two degrees warmer within 20 years. Nothing like that happened.
The Internet never forgets.
BS is called on that. He was asked what it would look like in 40 years if CO2 was doubled. Well we still aren’t at the 40 years and CO2 has not doubled.
Hanson’s words
“Reiss asked me to speculate on changes that might happen in New York City in 40 years assuming CO2 doubled in amount.”
HansEn should have pointed out that it would have been impossible for the co2 level to double in 40 years and put the reporter at ease.
40 years would be about 2026. Are we doomed to lose NYC to flooding in the next four years?
Hey! Did you hear that Pennsylvania just banned all private/NGO funding of elections?
The origin of that prediction was primarily the result of misreporting by Tony Heller and WUWT’s owner Anthony Watts.
https://youtu.be/WTRlSGKddJE?t=1141
Misreporting? Out and out lies you mean. Still being parrotted and pedalled by doubt-monger Middleton 13 years later.
I don’t know if I’d go as far as to say that Tony Heller and Anthony Watts lied. They were just negligent in their reporting. And you could make an argument that since the misreporting actually started with Susan Hansen’s article that they really had minimal culpability here. And for those unaware, Susan Hansen and James Hansen are not related in any way. The same last name is completely coincidental, but possibly confused Tony Heller and Anthony Watts originally.
The origin of that prediction is Hansen’s mouth.
There are two Hansen’s in play here. Susan Hansen and James Hansen. They are not related in any way. You could make an argument that the prediction originated from Susan Hansen more so than Tony Heller or Anthony Watts, but definitely not James Hansen. I know, it’s confusing.
Dr. Spencer, thank you for your interesting article.
As regards this sentence in the last paragraph of your Discussion subsection:
“This suggests that the most dire climate change impacts the public hears about will not happen.”
I think you may have inadvertently crossed a bridge too far.
That is, one would need strong evidence that ANY further increases in atmospheric CO2 concentration (above the current ~420 ppm) would cause addition atmospheric warming. There are strong scientific arguments—predominately those made by Happer and van Wijngaarden—that lead to charts such as the one attached showing atmospheric CO2 is essentially currently “saturated” in its ability to cause further warming . . . even assuming it had that ability in the past considering the overwhelming presence of water vapor as the major LWIR absorber in the atmosphere.
Considering this, it matters little if year 2100 atmospheric CO2 levels are 425 or 940 ppm.
If the CO2 removal rate is proportional to the concentration (or excess concentration above 297 ppm), then at a concentration of 537 ppm, the CO2 removal rate will be double what it is now (2022). Meaning that eventually the CO2 removal rate by natural processes (primarily photosynthesis) will catch up with the anthropogenic emission rate, and CO2 concentrations will level off at some higher concentration.
Anthropogenic emission rates have been roughly 36 GT/yr, equivalent to about 4.5 ppm/year in the atmosphere (8 GT of CO2 corresponds to about 1 ppm in the atmosphere). If the CO2 emission rates remain constant in future years, the CO2 removal rate (according to the above model) when the CO2 concentration reaches 4.5 / 0.0202 + 297 = 520 ppm, or about 25% above the current CO2 concentration.
At that concentration, the CO2 removal rate would be about 86% higher than now. If this was mostly due to photosynthesis, think of the kind of crop yields our grandchildren will enjoy!
Why would anyone want to prevent this?
Some quotes from “The RISE and REIGN of the MAMMALS A New History,
from the Shadow of the Dinosaurs to Us” by STEVE BRUSATTE that keep pushing the CO2 drives climate
“The entire planet was not frigid; certainly the coal swamps weren’t. But over the South Pole of Gondwana, and then southern Pangea, there was an enormous ice cap. It owed its very existence to the coal swamps: the growth of so many giant trees drew carbon dioxide out of the atmosphere, and with less of this greenhouse gas to insulate the planet, temperatures plummeted.” Page 8
“Bubbling up with the lava came silent killers, noxious gases like carbon dioxide and methane that seeped into the atmosphere and spread around the world. These are greenhouse gases, which trap heat in the atmosphere by absorbing radiation and beaming it back to Earth, and they caused runaway global warming. Temperatures increased by about 9 to 14 degrees Fahrenheit (5–8 degrees Celsius) within a few tens of thousands of years—similar to what is happening today, although actually at a slower pace than modern warming (a fact that should give everyone reading this pause). Still, it was more than enough to acidify the oceans and starve them of oxygen, causing widespread death of shelled invertebrates and other sea life.” Page 44
“For about 600,000 years, megavolcanoes erupted along the future Atlantic seaboard. There were four violent pulses of activity, which engulfed the edges of the new continents in fire. Added together, some of the lava flows and magma vents—like those that can be seen today as cliffs of basalt rock in the vicinity of New York City or the deserts of Morocco—were up to three thousand feet thick, more than twice the height of the Empire State Building. But like what happened some 50 million years earlier, at the end of the Permian, the real terror was not lava or ash, but the gases that rode up the volcanic vents from the deep earth, into the atmosphere—greenhouse gases like carbon dioxide and methane, which catalyzed a spurt of global warming. Just like at the end of the Permian, the temperature spike caused oceans to acidify, starved shallow waters of oxygen, and triggered ecosystem collapse on land and sea.” Page 86
The IPCC is actually quite subtle in how it approaches this particular issue.
In the WG-I report, “The Physical Science Basis”, for AR6 (finalised in May 2022) it admits (in section 1.6.1.4, “The likelihood of reference scenarios, scenario uncertainty and storylines”, on page 239) :
NB : This is “buried” in the text of the main report, and the basic message is not included in the SPM (or even the Technical Summary).
Their projection of “BaU ~= RCP 4.5 up to 2070” is in very good agreement with Dr. Spencer’s graph in the ATL article.
While WG-I highlights the “counterfactual” nature of the “worst-case scenarios”, it includes the final “On the other hand …” sentence in what appears to be a “throwaway” manner …
– – – – –
AR6’s WG-II report, “Impacts, Adaptation and Vulnerability” (released in February 2022), has an entire “Cross-Chapter Box” justifying the continued use of RCP 8.5 for potential impact assessments.
Cross-Chapter Box CLIMATE, “Climate Reference Periods, Global Warming Levels, and Common Climate Dimensions”, sub-section “AR6 WGI Reference Periods, Climate Projections and Global Warming Levels”, page 1-22 :
The emphasis is (not so) “subtly” shifted from the wording of the WG-I text, and justifies the use of RCP 8.5 (along with the new, CMIP6, SSP5-8.5 pathway) throughout the WG-II report.
– – – – –
For the AR6 WG-III report, “Mitigation of Climate Change” (released in April 2022), a similar “emphasis shift” is used.
Box 3.3, “The likelihood of high-end emission scenarios”, on page 3-28, concludes with :
This, to me, is halfway between the WG-I and WG-II approaches.
It admits that RCP 8.5 is “considerably” less likely than previously thought, and that it should not be considered as the BaU scenario, but allows for it to be used (along with SSP5-8.5) throughout the WG-III report as well.
Excellent report, Mark.
The more obvious reason would be cooling of the ocean surface. This raises the question of how much of the rise in atm CO2 is caused by ocean warming and not the opposite.
Looking at rate of change of CO2 we see how it dropped marked after Pinatubo and spiked during the unusually warm 1998 El Nino. This IS TEMPERATURE DEPENDENT.

Takahashi 1993 is a good source. Using the formula in the publication we can estimate about 17 ppm per 1 C of SST change.
A link to Dr Spencer model is here: https://www.drroyspencer.com/wp-content/uploads/Simple-CO2-budget-model-2.xlsx
Here is Spencer’s model without the MIE frig factor.

It shows clear temperature dependence. The model shows CO2 increasing too quickly until 1978 and too slowly after that. This reflects “the ice cometh” vs “OMG we’re all gonna fry” climate periods. Instead of correcting using a MIE frig factor, it may be more instuctive to include an SST term. Warming oceans are absorbing less than they were in 1978.
SST is one input to MIE but it is a data salad bowl of Empirical Orthogonal Functions.
What Greg said! SST.