By Christopher Monckton of Brenchley
The New Pause paused last month because I was ill. Many apologies for the interruption. Now, however, it resumes – and it has lengthened from 7 years 7 months to the end of April 2022. To the end of June 2022, the New Pause is now 7 years 10 months in length:

This Pause, like its predecessor, which was an impressive 18 years 8 months (UAH), or 18 years 9 months (HadCRUT4), is, as always, not cherry-picked. It is derived from the UAH monthly global mean lower-troposphere temperature anomalies as the period from the earliest month starting with which the least-squares linear-regression trend to the most recent month for which data are available does not exceed zero. Whatever the data show, I show. Or, in the immortal words of Dr Roy Spencer, speaking of his dataset, “It is what it is”. In that splendid dictum speaks all true science.
The least-squares trend, which Professor Jones at the University of East Anglia used to recommend as the simplest and most robust method of deriving global-temperature trends, takes due account of all monthly values, not merely of the starting and ending values.
England, said the Portuguese-American philosopher George Santayana, is the paradise of eccentricities, hobbies and humors. One of mine is jurisprudence, the philosophy of law. I have lectured on it at universities: indeed, one of my talks was given in the faithful replica of the Supreme Court Chamber at Liberty University, Virginia. I also give tutorials to law students on jurisprudence from time to time, for law lecturers generally do not love the subject, for it is inspirational rather than perspirational, though their students love it.
The Roman Emperor Justinian knew this. When he wrote his Institutes, a digest of his Digest of Roman law, he did so for the benefit of the law students of the empire, each of whom he addressed thus in the first Institute –
“Let this be thine: to lead a life upright,
“Do harm to none, but give to each his due.”
Marcus Tullius Cicero, who wrote the most beautiful, Ciceronian Latin, made a similar point, a century before the Lord of Life and Love and Laughter was admired by snuffling kine rubbing flanks with thrones and dominations in a stable at Bethlehem. Cicero, in his treatise de Legibus on jurisprudence, wrote: “The law is founded upon and rooted in love.” At root, then, love is – or, at any rate, ought to be – the mischief of every law. The framers of your magnificent Constitution knew this, for they were widely read and deeply learned.
The framework of the Constitution is the ancient doctrine of the separation of powers between the legislature (Congress), the executive (the President) and the judiciary (the Supreme Court). For political power, like money and muck, “is not good except it be spread”. I once won a debate on the desirability or otherwise of judicial activism before the Chicago Bar Association simply by citing Article 1, Section 1, which opens with these simple words:
“All legislative power herein granted shall be vested in a Congress of the United States, which shall consist of a Senate and House of Representatives.” Period.
That period is the most important period in history. On this side of the pond, we call a period a “full stop”. That full stop is the most important full stop in history. Right from the outset, your founding fathers made it very, very clear that they did not intend anyone, however high and mighty, to make or muss up or unmake the law unless you, the people, had elected him and his colleagues in Congress to do so. If anyone else, such as an overpaid, self-aggrandizing official of a government agency such as the EPA, purports to make law, he contravenes that full stop of full stops that fully stops anyone but those whom the people have elected as their only legislators from exercising the legislative function granted by the Constitution to Congress, and to Congress alone.
Why is that splendid opening sentence at once an embodiment and an expression of the love of which the Jews and then Cicero and then the Lord of Life and then Justinian spoke? It is because democracy – government of the people, by the people, for the people, as Lincoln trenchantly put it in the finest speech in history, the Gettysburg Address – depends absolutely on the principle that each of the people so deeply loves his neighbors that he is willing, nay eager, to entrust to them no less cheerfully than to himself the power to make and unmake those who govern him and them and the nation of which the people are the embodiment.
Therefore, it has been a delight to read the Supreme Court’s learned opinion at last curbing somewhat the bureaucratic overreach of the EPA, which had tortured the purpose and intent (which lawyers call the “mischief”) of an Act of Congress so as to usurp unto itself the power of Congress to make laws regulating the sins of emission perpetrated by the great industries and enterprises of your busy nation.
Even if it be ungenerously imagined that the Trump administration achieved little else, the President picked three winners – Amy Coney Barrett, Brett Kavanaugh and Neil Gorsuch – and parked them firmly on the banc of the Supreme Court, there to work their beneficial magic for decades to come. Justice Gorsuch’s masterly concurring opinion in the EPA case, which cites the vesting clause of the Constitution, meditates brilliantly, and eloquently, on the jurisprudential aspects of the Court’s opinion. In particular, it cites with approval the vesting clause at the beginning of the Constitution, and pokes fun at the three cry-babies on the Bench, who, in their whining dissent, here as in the Court’s recent decision that it is for the States and not for the Court to legislate on whether and when their citizens may torture, dismember and kill their babies without even giving the holy, wholly innocents an anesthetic first, seek to suggest that the Constitution is out of date and that the opinions of the mere proletariat and their mere elected representatives in their mere duma are of no account compared with the Party Line laid down by the all-seeing, all-knowing, all-wise apparatchiki.
If you read nothing else this year, read the Gorsuch concurrence. That resounding and profoundly learned endorsement of the vision and the wisdom of your founding fathers, and of the mischief of your noble Constitution, ends with these words –
“When Congress seems slow to solve problems, it may be only natural that those in the Executive Branch might seek to take matters into their own hands. But the Constitution does not authorize agencies to use pen-and-phone regulations as substitutes for laws passed by the people’s representatives. In our Republic, ‘It is the peculiar province of the legislature to prescribe general rules for the government of society’ (Fletcher v. Peck, 1810). Because today’s decision helps safeguard that foundational constitutional promise, I am pleased to concur.”
The gulf fixed between the libertarian majority and the totalitarian minority on the Court is precisely the gulf fixed between the Communist and Republican Parties in Congress. The dissent of the Court’s three witches opens thus –
“Today, the Court strips the Environmental Protection Agency (EPA) of the power Congress gave it to respond to ‘the most pressing environmental challenge of our time’ (Massachusetts v. EPA, 2007). Climate change’s causes and dangers are no longer subject to serious doubt. Modern science is ‘unequivocal that human influence’ – in particular, the emission of greenhouse gases like carbon dioxide – ‘has warmed the atmosphere, ocean and land’ (IPCC 2021).
“The Earth is now warmer than at any time ‘in the history of modern civilization’, with the six warmest years on record all occurring in the last decade (USGCRP 2017; Brief for Climate Scientists as Amici Curiae) The rise in temperatures brings with it ‘increases in heat-related deaths’, ‘coastal inundation and erosion’, ‘more frequent and intense hurricanes, floods, and other extreme weather events’, ‘drought’, ‘destruction of ecosystems’ and ‘potentially significant disruptions of food production.’ (American Elec. Power Co. v. Connecticut, 2011). If the current rate of emissions continues, children born this year could live to see parts of the Eastern seaboard swallowed by the ocean (Brief for Climate Scientists as Amici Curiae). Rising waters, scorching heat, and other severe weather conditions could force ‘mass migration events, political crises, civil unrest’ and ‘even state failure’ (Dept. of Defense, Climate Risk Analysis 2021). And, by the end of this century, climate change could be the cause of ‘4.6 million excess yearly deaths’ (R. Bressler, The Mortality Cost of Carbon, Nature Communications 2021).”
The long whinge that follows is predicated upon that improperly selective opening list of generally mendacious, imagined and imaginary harms from mildly warmer worldwide weather. It is that list that misleads the dissenters into grouching – more than somewhat banausically – to the effect that the evil demon Siotu is a “pollutant” and, therefore, falls within the broadly-drawn regulatory power granted to the EPA by Congress at section 111 of the Clean Air Act.
Yet the rebel reds contradict themselves when they conclude thus –
“The subject matter of the regulation here makes the Court’s intervention all the more troubling. Whatever else this Court may know about, it does not have a clue about how to address climate change. And let’s say the obvious: The stakes here are high. Yet the Court today prevents congressionally authorized agency action to curb power plants’ carbon dioxide emissions. The Court appoints itself – instead of Congress or the expert agency – the decision-maker on climate policy. I cannot think of many things more frightening.”
The contradiction lies in the dissenting coven’s assertion that “Whatever else this Court may know about, it does not have a clue about how to address climate change.” But, by the same token, the Court, and in particular the three unbecomingly partisan dissenters, does not have a clue about whether or not the various official-sounding sources for their contention that “the stakes are high” are talking through their hats. The dissenting opinion fails, therefore, on the very same ground on which the dissenters accuse the plurality of failing: they have appointed themselves, instead of Congress or what they unsoundly describe as the “expert” agency [x, an unknown quantity; spurt, a drip under pressure], as the decision-maker on climate science and, accordingly, on climate policy.
I set out something of the two opposing opinions, with particular attention to the dissenters’ opinion, because, given that the constitutionally-minded plurality on the Bench are at last minded to uphold the fine vision of your founding fathers and to rein in the power grab by the 3 million ambitious cuisses-de-cuir in the various Federal departments and agencies by reference to long-established principles of jurisprudence, it may now have become possible to persuade the Supreme Court that it should take one more step, and a decisive step, to topple the entire edifice of nonsense in support of and motivated by hostile alien powers that is global-warming fanaticism.
When the legal doctrine that administrative action by the entities of the State was reviewable by the Courts first emerged in the Courts of Equity in 14th-Century England (I remember it well, not least because the weather was so much warmer then), the purpose of judicial review of administrative action was – as it remains to this day – to put the citizen on a level playing-field with the State before the Courts. Judicial review is no less a feature of U.S. than of U.K. jurisprudence. In the U.K., we have a special Administrative Court to hear judicial-review cases. In the U.S., the ordinary civil courts hear such cases.
One of the principles of administrative law is that any action by any agency of government that is irrational is ipso facto unlawful. On both sides of the Atlantic, the courts have occasionally – and I stress occasionally – struck down the actions of ministers or their officials on the ground that no reasonable person, even in the exercise of the wide discretion delegated to ministers and, through them, to their officials in an administration elected by the people, could possibly have taken the decision in question.
Let us now examine the pseudo-scientific basis for the Supreme Court’s dissenters’ decision to the effect that because of the wickedness of the demon Siotu the EPA was duty bound to treat it as though it were a dangerous “pollutant” – which, of course, on any dispassionate and objective scientific tandard, it is not.
“The Earth is now warmer than at any time ‘in the history of modern civilization’”. No, it isn’t. It was at least as warm in the mediaeval warm period, which led to the Renaissance, to the building of the great cathedrals of Europe, and thus provided the environment within which the then emergence of modern civilization was possible.
“The six warmest years on record all occur[red] in the last decade”. Depends what you mean by “the record”. It is warmer today than since the first global temperature record began in 1850 – but so what? A couple of centuries are a mere blink of an eye sub specie aeternitatis. Most of the past 10,000 years have been warmer than the present in many parts of the world. Yet the planet somehow did not fry. Our predecessors were not all toast, and nor shall we be.
“The rise in temperatures brings with it ‘increases in heat-related deaths’”, but also decreases in cold-related deaths, which, as Willis Eschenbach has demonstrated in one of his many distinguished columns here, outstrip the increases in heat-related deaths in every region of the planet, and in some regions by an order of magnitude.
What about “‘coastal inundation and erosion’”? Well, that, as any rock jock will tell you, has been going on ever since there was first an ocean. It was only 10,000 years ago that, painted in then-fashionable woad blue, I could walk from my simple, ancestral trilithon house in rural Kent to what would many millennia later become Parisii Lutetiorum in Gaul without getting the aristocratic tootsies wet. But then sea level went and rose by 120 feet – and that, as Professor Ian Plimer often says, is sea-level rise.
What about “‘more frequent and intense hurricanes, floods, and other extreme weather events’”? Hurricanes are if anything a little less frequent and intense than they were (there has been nothing like the 1815 hurricane in the Caribbean at any time since then – I remember it well, for it made a mess of my plantations); even the hideous nest of vested-interest vipers that is IPeCaC says the evidence for more flooding is insubstantial; and the same goes in general for other extreme-weather events, as IPeCaC’s report on extreme weather grudgingly but definitively concluded.
By the same token., “‘drought’” is no more prevalent than before. Indeed, if the three dissenters had bothered to inform themselves of just a little elementary meteorology rather than taking their pseudo-science from talking-points issued by a variety of innocuous-sounding but actually malevolent front groups acting in the interest of foreign powers inimical to Western democracy, prosperity and freedom, they would know that, by the Clausius-Clapeyron relation, warmer worldwide weather increases the capacity of the space occupied by the atmosphere to carry water vapor, the most important of all the greenhouse gases by virtue of its sheer volume, so that droughts are less likely, not more likely. Unsurprisingly, therefore, as early as 1981 it was reported by Nicholson et al. that the Sahara’s southern margin had retreated, allowing 300,000 square kilometres that had formerly been arid to bloom once again, and permitting nomadic tribes to return to areas that they had not inhabited in recorded history.
Likewise, “‘destruction of ecosystems’” is not what happens in net terms when the climate gets warmer and, therefore, wetter. One might have thought that even extreme-Left justices would have learned enough geography (geology rocks, but geography is where it’s at) to appreciate that hardly anyone lives in the Arctic or Antarctic, where it is cold and dry, but nearly everyone lives where it is warm and, therefore, wet.
As for “‘potentially significant disruptions of food production’”, the worst that can be expected is that, exactly as has always happened as a result of shifting weather patterns whether natural or anthropogenic, what can be grown where will change from time to time. In Roman times, we grew grapes in Scotland’s Great Glen (I remember it well: the wine was quite good, too, if a little on the sweet side for my taste: one had to water it down for best effect, as recommended by Homer). However, what is certain is that the worldwide harvest in recent years – notwithstanding, or, rather, in no small part because of, warmer and wetter weather worldwide – has reached record highs, compromised recently only by the special military massacre in Ukraine, which, until the war, produced a tenth of the world’s grain exports.
“If the current rate of emissions continues, children born this year could live to see parts of the Eastern seaboard swallowed by the ocean”. Yup. That’s been happening along our own East Coast here in Blighty for the past 10,000 years. As we scientists say, “sh*t happens”. But it will not happen significantly more rapidly or severely just because sea level rises at the terrifying mean worldwide rate of 1 mm per year (after correction for regional variations in post-ice-age isostatic rebound rates), as the late Tom Wysmuller concluded after what proved to be his last research project. I miss him.
“Rising waters” are not as much of a threat as the dissenters wish to imagine: for 1 mm per year is about 4 inches per century. Oo-er! Pick up your skirts and run for the hills, nan!
As for “scorching heat”, that is offset in the tropics by earlier afternoon convection (i.e., thunderstorms) as the temperature rises, and elsewhere by greater rainfall. Again, Willis Eschenbach has done the research on that.
“Mass migration, political crises and civil unrest”, in the near-perfectly thermostatic climate of our age, is caused almost exclusively either by purely economic factors or by totalitarian regimes, such as that of the dissenters’ fellow-Communist Vlad the Invader.
Finally, the three naysayers reveal their true political colors when they end their list of imaginary cataclysms with the vapid and naively-parroted assertion that global warming, which is thus far causing a handsome reduction in global mortality, will somehow cause “‘4.6 million excess yearly deaths’” by 2100. No, it won’t. You heard it here first.
Here, then, is my modest proposal for taking advantage of the constitutionalist plurality that has at last cleared its throat and found its voice at the Supreme Court.
First, a casus belli must be identified, and a credible plaintiff found. The simplest casus belli is the sheer irrationality that is evidenced by the three Communists’ list of blatantly bogus bugaboos.
The shuttering of coal-fired power stations in the name of Saving The Planet from negligible and (in the last eight years or so, at any rate) non-existent global warming is, objectively speaking, irrational. It is not something that any rational minister or official would do or demand that taxpayers and energy-users should pay for unless he had been misled, as the three dissenters had – whether wittingly or unwittingly – allowed themselves to be misled.
In my submission, the plurality of the Court as at present constituted – but not the three recusants, for, as with all totalitarians, their minds are closed to aught but the Party Line – can be readily invited to understand three things.
First, the notion of rapid and dangerous global warming is predicated upon a monstrous and elementary error of physics that misled clahmatawlagiests into imagining that at the global-temperature equilibrium in 1850, when the global temperature record began and before we could have had any significant impact on the weather, the 8 K directly-forced warming by preindustrial noncondensing greenhouse gases had become 32 K final warming – the “natural greenhouse effect”.
It was imagined, therefore, the predicted 1 K direct warming by anthropogenic greenhouse-gas enrichment over the entire 21st century would become 4 K final warming after accounting for temperature feedback response, chiefly driven by more water vapor in warmer air.
What the poor saps had forgotten is that the Sun is shining. Therefore, at the global-temperature equilibrium in 1850, very nearly all of the 32 – 8 = 24 K feedback response was actually responding not only to the puny 8 K direct warming by all the naturally-occurring noncondensing greenhouse gases that had accumulated in the atmosphere up to that date but also to the 255 K emission temperature itself.
Therefore, the correct final or equilibrium warming in response to each 1 K of direct warming by noncondensing greenhouse gases, as matters stood in 1850, was not 32 / 8 = 4 K, but rather (255 + 32) / (255 + 8) < 1.1 K (see below): a mild, gentle, net-beneficial warming, not the “catastrophe” imagined by the three dissenters.

To head off the trolls who tend to maunder on to the ineffectual effect that that calculation is “inappropriate extrapolation”, there is no extrapolation at all: for there was a temperature equilibrium in 1850. It was, of course, the perpetrators of the error, not I, who had extrapolated, in that they had imagined that the ratio of equilibrium to directly-forced warming in 2100 would be about the same as it was in 1850.
Actually, that is not an unreasonable assumption: after correction of their silly error of physics, we may indeed expect about 1.1 K to be the anthropogenic component in global warming over this century; and the slow rate of warming to date is consistent not with the perps’ 4 K 21st-century anthropogenic component in warming but with the corrected 1.1 K.
However, one consequence of correcting climatology’s error is that even a 1% increase in feedback strength would engender a 340% increase in equilibrium-temperature response compared with the response derived for the equilibrium in 1850.
To put it another way – and to reveal another piece of our research that has not hitherto been made public – if the absurdly exaggerated feedback strengths listed in IPeCaC’s 2021 report were true, then equilibrium doubled-CO2 sensitivity (ECS) would not be 1.1 K, nor even the 4 K imagined by the usual suspects on the basis of their error. It would be more like 450 K. And nothing like that is actually happening, or someone would have noticed by now.
Therefore, either the models from which the vastly inflated feedback strengths are diagnosed or the diagnostic method are nonsense – or, more probably, both. No surprise then, that for 18 months our paper explaining all of this with limpid and irrefutable clarity has been languishing marked as “with editor” on the editorial-management system of the learned journal of climatology to which we had submitted it. The journal cannot refute it but dare not publish it for fear of reprisals from the totalitarian army of haters.
Secondly, the economic error. To achieve net-zero emissions by 2050, the fatuous and economically destructive target set by governments on both sides of the pond, would cost the West quadrillions but would make no measurable difference to global temperature.
Thirdly, the strategic error. The gainers by the economic hara-kiri being committed by the West in the name of Saving The Planet are Putin, who is making so much profit by the increase in oil, gas, nickel, grain and other commodity prices consequent upon his invasion of Europe that he will have paid off Russia’s entire national debt within three to five years, and Xi Jinping, the oppressor of Tibet, Sinkiang and Hong Kong, who, having ordered his feeble-minded stooge Biden to withdraw precipitately from Afghanistan rather than continuing to maintain inexpensive hard-point defense at a couple of key airfields there, has been rewarded by China’s Taliban proxies with control of the vast lithium fields in Afghanistan, the richest such deposits in the world. China now controls almost 100% of lithium carbonate production worldwide, and soon the West will ban real cars altogether, ostensibly in the name of planet-saving but in reality to place the West’s economies heavily under the thumb of China.
What we now need is a coal-mining or coal-fired power generating corporation to have the guts to mount a root-and-branch case against the present maladministration’s climate policies and then to fight it all the way to the Supreme Court. In the meantime, the teams with which I work will be preparing the following amicus briefs:
1: To answer, with definitive evidence, all the untruthful misstatements about the climate uttered by the three refuseniks as the preface to their moaning dissent from the plurality’s opinion in the EPA case;
2: To inform the Court of climatology’s central error of physics, and to explain that, therefore, all government-mandated controls on free markets and industrial activities arising from the covert Russian and Chinese promotion of the global warming nonsense over many decades are not only irrational but arguably treasonous;
3: To inform the Court that the proven costs of emissions abatement will buy no measurable reduction in global temperature, so that the real and provable costs of mitigation will inevitably and prodigiously exceed any legitimately-conceivable benefits;
4: To inform the Court of the long-planned strategic threat to the West posed by Russia’s and China’s sedulous promotion of the global warming narrative over many decades, and of the implosion of the Western economies that will result as the comparatively inexpensive coal-based static and oil-based locomotive energy sources are replaced by Russian gas and Chinese-controlled lithium carbonate respectively.
To take just one example, if Germany were to ban all real cars and replace them with Teslas and suchlike electric buggies, she would, on her own, consume the entire global annual production of lithium carbonate, enriching China as the price of that precious raw material soars, just as prices tend to do whenever a managed market replaces a free one, and just as Germany is already paying through the nose to fund Putin’s continuing massacre by the inflated prices she now pays for Siberian gas. Without the global-warming nonsense, and the consequent shuttering of Europe’s coal-fired power plants, which once produced electricity at a tiny fraction of the current cost of Siberian gas per terawatt-hour, Putin could not have afforded to invade Europe, and would not have dared to do so.
So far, the many major industries most directly targeted by Russia’s and China’s global warming campaign, and therefore with the most to lose by their inaction, have trembled cravenly and have done little or nothing to fight back, for fear of the Rufmord (Goebbels’ term for reputational destruction) that is meted out by numerous anti-Western front groups to those of us who dare to speak out against the collapse of Western civilization.
Somebody has got to tell the Supreme Court a few home truths about just how irrational is the global warming nonsense, and about just how vulnerable are the West’s interests to any further perpetuation thereof. As the lamented Ron Reagan used to say, “If not we, who? If not now, when?”
To add to Christopher’s comments, the UAH data for June 2022 is available. Using methods similar to his, the linear negative trend for the lower troposphere air temperature over Australia is now 9 years and 11 months.
If the trend continues through July, that will make 10 years of oft-repeated claims of global warming=climate change=extremes of heat=fearful existential disaster.
The scientific interest is not so much that there is another pause. Time series have them. The debating point, if people did debate, is the mechanisms that allow such pauses when GHG (especially control knob CO2) are increasing. Geoff S
http://www.geoffstuff.com/uahjune.jpg
Geoff,
this is just cherry picking and it is likely to last for years despite ongoing global warming. The El Niño in 2015/16 raised temperatures by about 0.5 for a period of a year. Given that the long term rate of warming in the UAH record is 0.14 degrees per decade Monkton’s method is would give a pause of several decades even while the earth continues to warm.
If you look at the ocean heat content you see a completely different story. There has been nothing but a slow steady increase. It is a much better indicator of global warming since the oceans are where most of the energy is stored.
IW,
A crucial, but neglected duty of the seasoned scientist of today is to examine the “perceived wisdom” to see if it is really “deliberate deceit”; to publicise examples of the latter, to try to change guesses into reliable, derived values that can be reproduced.
In the matter of measurement of water temperature, one can draw on experience of measurement performance by experts under top, controlled conditions. A few years ago I asked the Brits at their National Physics Laboratory how good they were at measuring water temperatures.
My question was –
“Does NPL have a publication that gives numbers in degrees for the accuracy and precision for the temperature measurement of quite pure water under NPL controlled laboratory conditions? At how many degrees of total error would NPL consider improvement impossible with present state-of-art equipment?”
Part of their answer was –
“NPL has a water bath in which the temperature is controlled to ~0.001 °C, and our measurement capability for calibrations in the bath in the range up to 100 °C is 0.005 °C. However, measurement precision is significantly better than this. The limit of what is technically possible would depend on the circumstances and what exactly is wanted.”
Australia’s National Measurement Institute answered “The selection of a suitable temperature sensor and its readout is mostly based on the overall uncertainty, the physical constraint (contact/immersion), manual or auto-logging, available budget… The most accurate (most expensive) sensor is a standard platinum resistance thermometer at mK level uncertainty.” (A mK is 0.001 Kelvin).
……………………….
Moving from optimized specialist laboratories to the real world of ocean T measurement with buoys, we see claims like this – The temperatures in the Argo profiles are accurate to ± 0.002°C and pressures are accurate to ± 2.4dbar.
Data FAQ | Argo (ucsd.edu)
You can see why this claim of temperature accuracy is laughable. Do not place too much trust in stories about tiny, gentle change of ocean heat content. Geoff S
Once again, we see the *SENSOR* resolution being put forth as the uncertainty of the entire measurement device. It doesn’t matter what the resolution of the sensor is or how accurately it is calibrated if a barnacle attaches itself to the water intake of the float. The sensor calibration is done with a specified water flow by it. Anything that interrupts that water flow destroys the calibration of the instrument no matter how good the sensor is. If a mud-dauber wasp builds a nest in the air intake of a Stevenson screen just what does that do to the calibration of overall measurement device.
In fact, it was established a number of years ago that the uncertainty of an Argo float is around +/- 0.5C. Not much better than a standard old LIG thermometer.
Many people really don’t want to see this, they’d much rather see the milli-Kelvin numbers.
Especially when the measuring agency converts hundredths of a degree Celsius to Zettajoules, just so they can make an alarming appearing graphic of temperatures.
Ocean measurements that NOAA’s buoy thermistors are not calibrated to measure consistently in the field conditions. Possible error bars for such measurements swamp any temperature measurements.
No, it isn’t cherry-picking. It is simply the reporting of what – however uncongenial to Mr “Walton” – is actually so.
In the end the realist says: What is different about this warming trend compared to others? Why were the others labeled “Optimums” while this one, which so far is milder is claimed to be deadly?
As I’ve been told by quite a few alarmists, we don’t know what caused the other warm periods. But that doesn’t matter since the models have proven that the current warming period is being caused by CO2.
A totally illogical position, but par for the course for AGW science.
Mobius Strip logic.
That graph should be much more widely known.
CAGW isn’t even logically self-consistent.
The present one isn’t shown on that graph since it only runs until 1950
Oh, so it’s the CO2 in the oceans that traps the heat. /s
Why do you cling to this nonsense talking point with such desperation?
It’s all he’s got left. The rest of his arguments have already been shot down.
So has their cherry picking argument been shot down, repeatedly.
Instead, the entire trollop chorus bleats it repeatedly trying to pretend that their rants of “cherry picking” trump science
Cherry picking indeed, but CO2 is rising and we are still cold.
Benghazi was started by an internet video 😉
And when all other arguments fail, go back to the cherry picking lie.
Sorry IW, the temperatures are what they are. The FACT that they haven’t risen for a period of time can’t be denied. Your only chance to disprove anything is to show that temperatures HAVE NOT stayed flat for a number of years. CM has not claimed that temperatures won’t again climb, instead, he has claimed (rightly so) that CO2 has not caused rising temperatures for a rather long period of time. As such, one can definitely say one of two things, that natural causes far outweigh CO2’s effect at least for a time, and/or that CO2 is not the entire set of controls for temperature.
Let’s do a count shall we…….
1) NOAA SST-NorthAtlantic GlobalMonthlyTempSince1979 With37monthRunningAverage.gif (880×481) (climate4you.com)
2) PDO MonthlyIndexSince1979 With37monthRunningAverage.gif (880×475) (climate4you.com)
3) NOAA SST-Nino3-4 GlobalMonthlyTempSince1979 With37monthRunningAverage.gif (880×475) (climate4you.com)
It can’t get up now.
What is the significance of the current “pause,” climatologically speaking? It seems like we’ve had many such “pauses” superimposed over the long term warming trend. What makes this one different?
Wait a minute. You show the increase from about 1935 in your graph. Then a decrease. Then a long pause from about to 1985? Then an increase up to present. These short pauses in between shown with a red or blue lines, as you asked are due to what? Irrelevant nonsense from Lord Monckton. Your graph is nice. Can you add yearly CO2 airborne concentrations to your graph? Would be nice to see the relationship over time.
How do we know the global temperature (if such a thing is meaningful) from before the satellite era? Surely the data pre-1979 are too sparse and uncalibrated for that?
Nice hockey stick.
Isn’t it weird how most of our record temps occurred in the 30s yet are not show on your graph?
And then cold records of the 70s 😉
This little hockey stick is the product of the Bureau of Adjustors.
The answer to your question is that the pauses show that temperatures do not have a direct functional relationship to CO2. It is not up to anyone but you to explain what atmospheric conditions cause the slowdown in the temperature growth. It might occur to you to question if 140 years are long enough to fully capture cycles in the physical phenomena of the globe’s temperature. For example, do you think these temperature increases will eliminate the next glaciation? If not, what conditions must change to begin the next glaciation?
The hottest period should be the 1930s.
That past has been cooled and the present warmed. Oddly, aligned by NOAA to increasing CO₂.
There are two points to make about the ruling and the dissent.
One is that the issue decided was purely a legal one, whether Congress has authorized the Agency to regulate CO2 emissions. To this the majority decided no. So those so dismayed by it have a very simple remedy, persuade Congress explicitly to authorize it.
The second point is that the dissent is written on the lines that would be appropriate for a politician arguing for the passage of such a law. There’s no real argument about the legal situation, and the invocation of the supposed climate disaster shows this radical confusion. It may be relevant if the matter comes before Congress. But its completely irrelevant to the question of whether Congress has so far authorized regulation.
The dissent is basically arguing the merits of emission reduction or restriction. Which is none of its business. Whatever the merits of such a policy, it has no bearing on the legal issue of what the EPA is authorized to do.
By the way, same thing applies in the media coverage of the abortion decision. Its not about the right to abortion. Its about whether there is, as a matter of law, a certain constitutional right. If you differ on the merits of a certain approach to abortion, persuade your local state legislature to enact. Because its not in the Constitution. But that doesn’t imply any particular position on the substantive issue.
I guess the final point is that what needs to be shewn is that the EPA actions would have any effect on the climate problem which the dissent tries to argue exists. The case should be that even if there is a climate problem, the EPA policies will have no effect on it. Because China etc.
So even in its own terms its wrong. Its making the usual scientifically illiterate progression from ‘Global CO2 emissions are damaging’ to ‘Therefore we should restrict our own local ones’.
No, only if restricting your own local ones will have an effect on the global total. Otherwise you are wasting time and money.
Talking about “going off the rails”.
“Tropical Storm Colin” what a bad joke! That mild storm would have never been named if NOAA NHC was not all in on selling “Climate Change”. They hyped that BS without regard to ruining the holiday weekend of people along the coast of the Carolinas. It was a nothingburger from beginning to end and now, less than 48 hours after they named it, you won’t see any swirl on the radar. It is nothing but an area of low pressure.
Looking at the maps I see no place inland that recorded even a gust over 38 mph. A good thunderstorm kicks up more of a breeze than that. The ACE of named Atlantic Tropical storms has been dropping for several years in a row now and it looks like NOAA NHC is trying to drop it even more.
And never mind that when NOAA and the news hypes this kind of thing like they did, people will start to not take warnings seriously and when a real threat comes fail to take the proper precautions. But I am to the point now, that I believe the government would like that. I mean what’s a few unnecessary casualties if it could advance their catastrophic climate change scam.
Yes, I have noticed this weather hype over the past few years.
The strength of LM’s powerful articulation in this article is in the climatology error regarding feedbacks and system dynamics, and also on the destructiveness of the false climate catastrophe narrative in being the foremost cause of the current real and severe global problem of energy and food price inflation.
This destructive false catastrophism is the fault of the west entirely. It doesn’t really help to drag in China and Russia. That clouds the issue. Current global economic stress is 100% of western green-progressive origination and causation.
Cyanide is a poison. It operates by depriving the cell of its energy supply by blocking a part of the respiratory Krebs cycle. The mode of cyanide toxicity on an oxygen respiring organism is a good metaphor for the effect of green anti fossil fuel activism on the global economy. Both block energy supply. What could possibly go wrong?
“For various reasons, it would be wrong to assume that CO2 cannot cause any warming, for a number of reasons, not the least of which is that the climate behaves as a mathematically-chaotic object, so that – to use the well-worn metaphor – even the fluttering of a butterfly’s wings on one side of the world may be so magnified as to cause a hurricane on the other.”
Fluttering butterfly wings… what a joke – complete nonsense.
Maybe the mathematician can learn something from others in the field, such as from
“Revisiting causality using stochastics: 1. Theory” Koutsoyiannis et al (2022) and “Revisiting causality using stochastics: 2. Applications” Kousoyiannis et al (2022),
where in the latter they concluded:
“The remaining real-world case study led to an important side product of the current research. This is the surprising finding that, while in general the causal relationship of atmospheric T and CO₂ concentration, as obtained by proxy data, appears to be of hen-or-egg type with principal direction 𝑇→[CO₂], in the recent decades the more accurate modern data support a conclusion that this principal direction has become exclusive. In other words, it is the increase of temperature that caused increased CO₂ concentration. Though this conclusion may sound counterintuitive at first glance, because it contradicts common perception (and for this reason we have assessed the case with an alternative parametric methodology in the Supplementary Information, section SI2.4, with results confirming those presented here), in fact it is reasonable. The temperature increase began at the end of the Little Ice Period, in the early 19th century, when human CO₂ emissions were negligible; hence other factors, such as the solar activity (measured by sunspot numbers), as well as internal long-range mechanisms of the complex climatic systems had to play their roles.” [my bold]
There are natural explanations for why they are correct and why Christopher Monckton and all the lukewarmists and warmists put together are wrong about any ECS values.
It is because CO2 follows SST. CO2 lags HadSST3 global by nine months; and the 12mo ave change in CO2 lags the 12mo ave change in ERSSTv5 >25.5C by 5 months – confirming what Kousoyiannis et al claimed.
The natural oceanic control of atmospheric CO2 explains the ML CO2 trend too. My model shows the true ECS is of CO2 to SST, and is 2.1 ppm/C, see bottom right panel:
Therefore Christopher Monckton’s CO2-climate feedback model is also utter nonsense.
Here’s Weber once again peddling his tragically ridiculous, anti-data, anti-reality, anti-science nonsense.
The (gasp!) data clearly demonstrates that the oceans currently act as a net absorber of CO2 OUT of the air. The oceans cannot possibly be responsible for the current increase of CO2 in the air. All of Weber’s handwaving jibber jabber is therefore totally refuted. See attached.
Babbling the same tired old falsehoods over and over and over again, despite totally refuting evidence, is the hallmark of the anti-science crackpot.
[Lower the use of pejoratives~charles]
Yep. The Oceans are the #1 carbon sink.
It is unfortunate to see Monckton blindly parroting the false talking point that one finds routinely bouncing around the so-called “skeptical” echo chamber that “it was at least as warm in the mediaeval warm period”.
It might have been “at least as warm” … in certain parts of the world, like Europe. But not globally.
A large multitude of climate history research publications over the past quarter century have more or less definitively refuted this too often regurgitated “skeptical” talking point falsehood. A graph summarizing the results of the largest of such studies, from the Pages 2k Consortium, is attached.
“the warmest 10-year (30-year, 50-year) period of the past two millennia falls within the second half of the 20th century in 94% (89%, 84%) of ensemble members.”
And it’s only gotten warmer since then.
PAGES 2k Consortium. Consistent multidecadal variability in global temperature reconstructions and simulations over the Common Era. Nat. Geosci.12, 643–649 (2019). https://doi.org/10.1038/s41561-019-0400-0
Pages 2K is a joke. Nothing but doubling down on Mann’s hockey stick. What role to “ensembles” play in palaeo data?
During the MWP elephant seals lived in the Antarctic Ross Sea as attested by biological remains. Now they can’t live less than 2400 km further north.
https://ptolemy2.wordpress.com/2022/05/27/elephant-seals-in-the-ross-sea-what-more-proof-needed-that-mwp-was-real-and-global/
The Siberian treeline is moving north with warming, but fossil tree stumps show that the current treeline is no further north than 1000 years ago.
https://ptolemy2.wordpress.com/2020/07/09/the-to-and-fro-of-the-siberian-taiga-tundra-treeline/
Elephant seals, treelines: these speak with more authority than “ensembles”.
The above graph is nonsense and a disgraceful fiction.
MGC’S graph is a work of fiction based largely or entirely on computer models..
Here is some real-world evidence:
https://royalsocietypublishing.org/doi/10.1098/rstb.2007.2200
The Russian treeline is a dynamic ecotone typified by steep gradients in summer temperature and regionally variable gradients in albedo and heat flux. The location of the treeline is largely controlled by summer temperatures and growing season length. Temperatures have responded strongly to twentieth-century global warming and will display a magnified response to future warming. Dendroecological studies indicate enhanced conifer recruitment during the twentieth century. However, conifers have not yet recolonized many areas where trees were present during the Medieval Warm period (ca AD 800–1300) or the Holocene Thermal Maximum (HTM; ca 10 000–3000 years ago). Reconstruction of tree distributions during the HTM suggests that the future position of the treeline due to global warming may approximate its former Holocene maximum position. An increased dominance of evergreen tree species in the northern Siberian forests may be an important difference between past and future conditions. Based on the slow rates of treeline expansion observed during the twentieth century, the presence of steep climatic gradients associated with the current Arctic coastline and the prevalence of organic soils, it is possible that rates of treeline expansion will be regionally variable and transient forest communities with species abundances different from today’s may develop.
Graemethecat
The climate history graph you are trying to pretend away is not based on “computer models”. It is based on the most comprehensive real world global dataset in existence.
And you should really read your own references more carefully. Here are a couple of direct quotes from the study you cite:
“The late nineteenth and twentieth centuries are characterized by generally increasing temperatures that in recent decades appear to have exceeded those experienced during the MWP”
“The prolonged and substantial warming of the Eurasian Arctic in the recent period probably reflects both natural factors and the additional radiative forcing provided by high levels of anthropogenic greenhouse gases”
In other words, the study you cite actually confirms both significant anthropogenic warming influences and the climate history information that you are trying to pretend away as “fiction”.
Thanks for providing (without even realizing it, LOL) the evidence that refutes your own objections.
“The late nineteenth and twentieth centuries are characterized by generally increasing temperatures that in recent decades appear to have exceeded those experienced during the MWP”
“The prolonged and substantial warming of the Eurasian Arctic in the recent period probably reflects both natural factors and the additional radiative forcing provided by high levels of anthropogenic greenhouse gases”
So they are making suppositions. There are plenty of data which contradict these statements:
However, conifers have not yet recolonized many areas where trees were present during the Medieval Warm period (ca AD 800–1300) or the Holocene Thermal Maximum (HTM; ca 10 000–3000 years ago).
Do you actually read what you post?.
Never! MGC only cherry picks certain phrases based on his own self-absorbed biases.
They did not make mere “suppositions”. They provided a multitude of references to the data that backs their statements.
re: “However, conifers have not yet recolonized many areas where trees were present during the Medieval Warm period (ca AD 800–1300) or the Holocene Thermal Maximum (HTM; ca 10 000–3000 years ago)”
They also explain that observation in their paper:
“some lag between climate change and forest development is inevitable”
But of course you didn’t read that part either, did you? No, of course not. It doesn’t adhere to the so-called “skeptical” propaganda party line.
As usual, so-called “skeptical” arguments are so easily refuted.
Really? When are you going to start?
If they are so certain of their suppositions, why did they qualify them with “appear” and “probably”?
It seems that the furtively acronymic climate Communist Putin pawn “MGC” is no more expert in forestry than in meteorology. Once a warmer and hence wetter climate is restored to cold and dry hilltops, the return of forestry thereto often takes little more than a generation, and it can be a lot shorter than that.
When I was a lad, I used to get on my Ducati and go every morning the 100 miles from Limassol, where I then lived, to the Akamas peninsula of north-western Cyprus, one of the world’s last surviving floral treasuries, where grows the very rare Cyprus rose.
The Tmema Dason, the Department of Trees, had posted up notices on one flank of the shapely mountain that I used to climb each morning, saying “Perioche Kamene”, meaning “Burned Area”. However, within a few years of the forest fire, the forest cover had restored itself, along with the undergrowth characteristic of a floral treasury.
Another episode of unfortunate and ill-informed Moncktonian handwaving.
The authors point out that the evidence suggests that the time lag they speak of in this region may be on the order of decadal to centennial scales. So much for this latest spouting of Moncktonian excuses.
Another qualifier that the research authors stated, which was, of course, blindly disregarded by the “skeptical” crowd that wants to falsely pretend that this study somehow indicates that “the MWP was ‘warmer’ than today” (even though the authors themselves explicitly state otherwise) is this:
“dominance of northern forests in Siberia by evergreen conifers rather than larch may be an important difference between past and future treeline zone conditions”
In other words, the treeline location can be a function of not only temperature conditions but also the particular dominant species inhabiting the area at the time.
And these so-called “skeptics” still wonder why they are not taken seriously by the worldwide scientific community. SMH.
Any evidence for your assertion today, liar?
Simple question. At what stage of ice cover do each variety of tree actually grow? At what low temperature do each variety exist at? We know with ice cover, neither will grow.
The point is that trees have survived and grown at points that are just being exposed. Therefore, it was at least as warm as it is now if not warmer.
Consequently, we shouldn’t be worried about the temperature rise up until now. We should be worried about what is occurring right now. For the last almost 8 years we are seeing cooling. Will warming continue for enough time to let new trees start and survive? Let’s hope so.
Gorman says: “The point is that trees have survived and grown at points that are just being exposed. Therefore, it was at least as warm as it is now if not warmer.”
This is so ridiculously wrong.
How much more obvious could the authors make themselves? The treeline is not just a function of temperature, as Gorman wants to falsely pretend, but also a function of what tree species are dominant.
“Therefore, it was at least as warm as it is now if not warmer” is such a laughably incorrect conclusion.
It almost seems as if Gorman is actually being intentionally and deliberately dense.
Funny you didn’t mention this sentence of mine!
“We know with ice cover, neither will grow.”
In other words, until the ice disappears no trees will grow. That means that current temperatures are no warmer than it was then.
J Gorman sadly continues to beat the same tired old, long deceased dead horse, despite its cause of death having been spelled out numerous times now. So disgraceful.
MGC has apparently never seen the burning of the pastures on the Great Plains. The grass regrows in days, not weeks, months, or years. The scrub juniper and spruce will appear within a year and hardwoods not much longer (as long as the scrub evergreens don’t choke them out.
T Gorman, like Monckton before, references wildly different, and thus irrelevant, growing conditions … and blindly dismisses the authors’ own statement that their evidence indicates that the time lag they speak of in this region may be on the order of decadal to centennial scales.
Typical willfully ignorant “skeptical” behavior.
Got any evidence for your “Trump is an insurrectionist” libel?
“and blindly dismisses the authors’ own statement that their evidence indicates that the time lag they speak of in this region may be on the order of decadal to centennial scales.”
As I said, from first-hand experience over 70-odd years, it does *NOT* take decadal or centennial lengths of time for natural vegetation to reappear once conditions return to non-freezing. Grass takes less than a week. Trees reappear in a year or two. Not DECADES or CENTURIES.
You keep trying to push an assertion that is wrong on the face of it. It’s obvious that you, and probably the authors, don’t understand the difference between sub-soil temperatures and air temperatures. It’s why it’s so laughable to see CAGW adovocates like you and John Kerry keep arguing that the Earth is going to turn into a cinder – no understanding of the real world at all!
T Gorman keeps beating the same tired old dead horse. This is the Siberian tundra. Way different than Great Plains prairies.
T Gorman also continues to disingenuously ignore the different tree species factor. Conditions conducive to the beginning of regrowth of some tree species are not conducive to others. As the authors state, a change of dominant species will affect the location of the treeline.
Yet another tragic Gormanian example of a continual grasping at the flimsiest of straws in order to try to pretend away reality.
Get some new insults, you keep recycling the same ones over and over.
“ This is the Siberian tundra. Way different than Great Plains prairies.”
“Conditions conducive to the beginning of regrowth of some tree species are not conducive to others.”
ROFL!! So friggen what? No one is saying that the same grasses, shrubs, trees, etc grow everywhere!
But things *do* grow almost everywhere – even outside hot vents on the ocean floor!
What do you think peat is made of? It’s partially decayed vegetation and organic matter! How in Pete’s name do you suppose that vegetation got there in the first place? And if it is taking a long time for the peat to thaw out so new growth can begin then how is that somehow proof that the Earth is warming catastrophically?
A picture is worth a thousand words.
Phil,
The real joke here is imagining that some pseudo-science blog should take precedence over the most comprehensive research studies ever conducted on this topic, published in the most prestigious scientific journals in the world.
MGC, I agree completely, so why do you keep doing it?
“MGC” is perhaps not well versed in formal logic – or, indeed, in anything other than the Party line.
In logic, argument from the imagined (and all too often imaginary) reputation of “experts” is known as the argumentum ad verecundiam. It is one of the dozen fundamental fallacies of logic first enumerated and excoriated by Aristotle in his Refutations of the Sophists. Deployment of the arg. ad verecundiam has long been recognized as an identifier of the totalitarian mindset.
Consider, for instance, the elementary error of physics described in the head posting. That error occurred when climate Communists realized that direct warming by greenhouse gases would not, on its own, be anything like enough to fool anyone into shutting down coal-fired static and oil-fired locomotive power and thereby greatly enriching Russia through Siberian gas and China through lithium carbonate for electric buggies’ batteries.
Therefore, They borrowed the handy concept of temperature feedback from control theory, a difficult branch of physics with whose norms they were wholly unfamiliar, and succeeded in multiplying the puny direct warming by four, when in reality the difference made by feedback processes is a great deal smaller.
“MGC” should not, therefore, assume that this is a “pseudo-science” blog merely because it does not toe the climate-Communist Party Line of which it is a devoted and unthinking adherent. Nor should it assume that the “comprehensive research studies” are right when, thanks to the climate Communists’ error of elementary physics, all of them are in fact wrong.
“MGC”, like all totalitarians, is more concerned with “prestige” than with objective truth.
So let me propound for its benefit the fundamental principle underlying all of logic and hence all of mathematics and hence all of the sciences, of which mathematics is the lingua franca. You will not see this principle set forth in any textbook, however “prestigious”: for until the totalitarians began their poisonous politicization of the sciences it had been taken for granted.
That fundamental principle is the principle of the universality of truth:
“Any proposition that is true stands consistent with every proposition that ever was or is or ever shall be true, throughout the universe of time and space, from the beginning of the beginning to the end of the end and from here to the outermost stars; but any proposition that is false, whether or not it stand consistent with other propositions that are false, falls inconsistent with every proposition, throughout the universe of time and space, that ever was or is or ever shall be true.”
Just about every research paper ever written on the subject of climate sensitivity – the “how much warming?” question – is untrue, for all of them, including my own first-ever paper on the subject, did not realize that official climatology had perpetrated its elementary error of physics.
Therefore, all those papers, however “prestigious” their authors, however “prestigious” their institutions, however “prestigious” their journals, were simply flat-out wrong. No ifs, no buts, no maybes. Their mistake was elementary, and it was catastrophic. All of those papers contained that disastrous untruth and, because they contained it, they are to that extent untrue and, therefore, at odds with the universal truth. Compared with that, mere “prestige” is as nothing.
re: “Therefore, They borrowed the handy concept of temperature feedback from control theory”
Monckton continues to make believe that the scientific facts underlying positive feedback, known since the 19th century, are just some kind of “borrowed concepts” used to supposedly “fudge” the numbers. He further makes believe that all climate sensitivity studies are “wrong” … merely because he says so.
And so-called “skeptical” folks like Monckton still wonder why the worldwide scientific community does not take them seriously. SMH.
The furtively acronymic “MGC” is incapable of producing any scientific argument, Perhaps it should not seek to question its betters until it has first learned from his kindergarten mistress the importance of telling the truth.
It is objectively true that climatology borrowed the methods of elementary feedback analysis from control theory, starting explicitly with Hansen in 1984 (previous mentions of feedback having been more general).
It is objectively true that Hansen, and just about everybody after him, misunderstood what they had borrowed, and imagined that in 1850 the emission temperature of 255 K engendered no feedback response, but that suddenly the directly-forced warming by preindustrial noncondensing greenhouse gases produced a feedback response of 32 K.
That assumption was incorrect. Yet it was that assumption that led Sir John Houghton, the first chairman of the IPCC, to imagine that there would be large ECS rather than small ECS. I know this because when I wrote and asked him he wrote back and told me so.
And “MGC”, merely because he is a climate Communist, should not simply swallow the climate Communist propaganda to the effect that “the worldwide scientific community” does not take us seriously.
If our result were as wrong as “MGC” and his fellow climate Communists fervently wish it was, why would the editor of a learned journal, to whom we had submitted the paper 18 months ago, not simply have thrown it back at us? Or why, if it were not quite as obviously wrong as that, did he not pass it out for review and then throw it back at us? Why is it still marked as “With Editor”? And why does he not reply to our occasional, short and polite requests to know how matters are progressing?
As it happens, the particular editor to which we sent the paper had previously stated that there was no legitimate scientific argument against the climate-Communist Party Line.
Could it be that his hesitancy to do the job of an editor with respect to our paper is founded upon the fact that, like “MGC”, he knows full well that we are right but fervently wishes that we were wrong?
Monckton can handwave all he wants. Reality remains as follows:
A correct calculation of ECS begins with an analysis of the radiative forcing of additional water vapor that enters the atmosphere as the atmosphere is warmed by CO2 radiative forcing (or by other influences). Making up some other kind of pseudo-scientific gibberish, that relies only on ridiculously irrelevant temperature proportions, while completely ignoring the radiative physics which actually govern the ECS feedback response, remains such a laughably poor “analysis” that it is “not even wrong”.
“It is objectively true that Hansen, and just about everybody after him, misunderstood what they had borrowed, and imagined that in 1850 the emission temperature of 255 K engendered no feedback response, but that suddenly the directly-forced warming by preindustrial noncondensing greenhouse gases produced a feedback response of 32 K.”
You just succinctly and correctly laid out the whole issue. If CO2 (and other gases) are a feedback mechanism then since CO2 has always existed in the atmosphere the feedback mechanism has always existed. It didn’t just all of a sudden “start up”. That means the 1850 temps need to be analyzed in the same fashion as post-1850 temps.
re: “That means the 1850 temps need to be analyzed in the same fashion as post-1850 temps”
They have been. Monckton’s claims to the contrary are nothing but totally fabricated anti-science nonsense.
Just more watermelon (communist hiding as a green) propaganda from MCP.
You don’t know any more about forecasting than you do about climate change!
All of the papers, studies, blogs, etc. that you reference have nothing but correlations between some data series, usually based on time. Few if any produce any mathematical functional relationships between different time series. It is all basically may, maybe, predictions based on trends, etc.
I am a trained and degreed electrical engineer. Do you think engineers rely on maybe’s, perhaps, beliefs, or correlations? We rely on measurements and precise formulas. PV = nRT, V = IR, Maxwell’s equations, e=mc^2. Do you think the people who studied and did innumerable experiments like Maxwell, Boltzmann, Planck, Fourier, and many, many other geniuses didn’t devote much of their lives to designing experiments and in many cases inventing measurement equipment to determine the mathematics that underlay their theories?
This is what turned me off climate science to begin with. It was nothing but correlations from the bottom to the top. I have done enough dealing in trends in the telephone industry to KNOW trends should always follow the admonition that past performance is no guarantee of similar future performance. If you can’t tell me what the conditions will be that initiate the next glaciation, then you don’t know anything about what causes current temperatures. All you have is a crystal ball made from computer runs and questionable statistics.
Lord Monckton has supplied you with detailed mathematics that lay behind his assertions. The least you could do is supply your mathematics, either done by you or others, to show that his are wrong. Feedback claims in GHG theory MUST have some mathematics behind them or they exist only as unproven assertions of what “might” occur. Good luck on making cogent arguments based on crystal ball “might be’s”.
re: “All of the papers, studies, blogs, etc. that you reference have nothing but correlations between some data series”
Anyone who claims that the data is “nothing but correlations” is clearly not cognizant of the available research. This claim is every bit as ridiculous as claiming that PV = nRT and V = IR are “nothing but correlations”.
re: “If you can’t tell me what the conditions … blah blah blah blah blah”
A familiar, tired old “skeptical” objection, which pretends that climate projections are pretty much useless unless they are more or less perfect. But of course this is ridiculous. Every bit as ridiculous as claiming that weather forecasts are useless because they aren’t perfect either.
I did not say PV = nRT, etc., were correlations. I said :
“We rely on measurements and precise formulas. PV = nRT, V = IR, Maxwell’s equations, e=mc^2.”
What exactly in that sentence leads you the assertion that I said correlation?
You are showing your bias and lack of science training if you attempt to make these into correlations. I assure you they are not. They are functional relationships that have passed all tests and over time have gone beyond theory and turned into LAWS.
Why do you use the term PROJECTIONS? Are you unable to admit that there are no functional relationships available that offer PREDICTIONS?
A projection is nothing more than guess. Projections based on trends and correlations are guesses. Give me a resistance and a current and I will tell you an exact voltage that will appear across the resistor.
You really need to read more carefully, Gorman. Such a shameful display of poor reading comprehension skills. It’s difficult to imagine how you could ever have obtained an actual engineering degree.
It was never claimed that PV=nRT and V =iR were mere correlations. What was stated was that your totally false pretending that climate data consists merely of correlations is every bit as ridiculous as claiming that the PV=nRT and V=iR equations are too.
And you’re just playing silly word games with your whining about “projection” vs “prediction”, and once again falling back on the totally false assumption that climate projections are based merely on “trends and correlations”.
You are blindly (and apparently intentionally) refusing to accept reality, that climate projections are based on well known and long demonstrated laws of physics. Your claim that “a projection is nothing more than guess” is pure nonsense.
re: “Monckton has supplied you with detailed mathematics etc. etc. etc.”
This is a joke, right? Monckton’s “detailed mathematics” are nothing but pseudo-scientific gibberish. A correctly computed ECS value is derived from the known radiative forcing values of the various greenhouse gases, not via mere handwaving temperature proportions. Monckton’s temperature proportions “method” of computing ECS is laughably incorrect and totally ridiculous.
Monckton’s “analysis” would most certainly earn a failing grade in any atmospheric physics class.
The furtively acronymic “MGC”, who knows no mathematics or science but knows how to recite the climate-Communist Party Line, says that ECS is derived from radiative forcings. That is a woefully ignorant and incomplete account, and it is also a characteristically wilful misrepresentation of our research.
For about three-quarters of ECS, in IPeCaC’s understanding, comes not from the directly-forced warming (which, though “MGC” lyingly suggests otherwise), we simply accept ad argumentum, but from feedback response thereto.
Though “MGC” does not know enough elementary climatology, physics, math or logic to understand our result, I shall try, yet again, to awaken what passes for its “mind” to the possibility that the Party Line is very definitely wrong on this one.
The first of the two elementary errors perpetrated by the climate Communists is that they forgot the Sun was shining and, in their calculation of ECS based on the position in 1850, they attributed all of the substantial solar feedback response to the greenhouse gases.
There’s no point in “MGC” sneering at us for the simplicity of our calculations, when the error we are describing with those calculations is as simple and obvious as it is.
Monckton sadly makes more tragically inept handwaving errors. He somehow imagines that the statement “ECS is derived from radiative forcing” is “wrong”. But it isn’t “wrong” at all.
The feedback response (which ECS measures) is, of course, driven primarily by radiative forcing. Specifically, it is driven by the radiative forcing of additional water vapor that enters the atmosphere as the atmosphere is warmed by CO2 radiative forcing (or, to be complete, warmed by anything else). This is all well known atmospheric physics, understood even back in the 19th century.
My statement thus was, and remains, entirely valid and correct.
In contrast, Monckton’s laughably pseudo-scientific “calculation” of ECS, which relies on ridiculously irrelevant temperature proportions, taking zero account whatever of the radiative forcing physics which actually govern the feedback response, is so bad that it is not even wrong. His “analysis” would most definitely earn an abysmally failing grade in any atmospheric physics class.
Such a disgraceful anti-science embarrassment.
“Specifically, it is driven by the radiative forcing of additional water vapor that enters the atmosphere as the atmosphere is warmed by CO2 radiative forcing…”
I know your favorite trick is to regurgitate others propaganda. You need to respond with data that shows “additional water vapor” in the atmosphere. Not just regionally, but globally. Reference some real measurements and global data.
It’s also important to address why more arid conditions are/will occur with more water vapor in the atmosphere.
re: “You need to respond with data that shows “additional water vapor” in the atmosphere.”
It’s just amazing how these so-called “skeptics” like Gorman will so often pretend to themselves that they are “well informed” about climate change, and yet they constantly demonstrate exactly the opposite. Gorman is (no surprise) unaware of even the simple fact of increasing water vapor in the air.
Chen, B., and Z. Liu (2016)
J. Geophys. Res. Atmos. doi:10.1002/2016JD024917.
“Increasing trends of global water vapor have been observed from the analysis of five types of data sets”
Did you read your study? Here is what was said in the “Results and Discussion” section.
Let’s look at global. 0.17±0.35 Ho, Ho, Ho. If you understand uncertainty, then you know that 0.17 is a guess, it could be anything in the uncertainty interval.
Now, let’s look at tropical. 0.02 ± 0.37 Again, Ho, Ho, Ho. Besides being very small, 0.02 is obviously a guess knowing the uncertainty interval.
Let’s look at temperate. 0.14 ± 0.31 Again, purely as guess knowing the uncertainty interval.
How about Arctic. 2.98± 1.21 Finally, a number that exceeds the uncertainty interval.
Now, how about Antarctic. -2.03 ± 1.34 Again a number that exceeds the uncertainty interval. But, and a big BUT, it is negative.
And, here is the best question. If there has been an increase in PWV (Precipitable Water Vapor), then why all the predictions of increased aridity and lack of water? The two don’t really go together. Do you deny that these prediction exist or are they incorrect? Here is one discussed at this very site.
https://wattsupwiththat.com/2022/06/28/heat-waves-dessler-continues-to-step-in-it/
Wow. Total WOW. Such blindingly obvious, tragically dishonest Gormanian cherry picking.
The Gorman dishonestly cherry picked just ONE of the FIVE available datasets.
The Gorman also dishonestly cherry picked just the one and only one time period under study for which this dataset happens not to exhibit a statistically significant trend.
That’s right, the Gorman dishonestly ignores the fact that the trends for this dataset over the two other (later) time periods discussed in this study are statistically significant.
The Gorman also dishonestly ignored the fact that mean trends are positive in every single dataset and are statistically significant for almost all of the data set time frames.
What part of “statistically significant global trends” is the Gorman unable to understand?
Who does the Gorman imagine he is fooling with his ridiculously dishonest nonsense? Clearly it is no one but himself.
MGC –> I quoted from the study you referenced. The uncertainty intervals are directly from the study and not made up by me. You appear to ignore them, probably because you don’t understand what they mean. Please explain what “0.17±0.35″ tells you.
Instead of the ad hominem attacks you would be better served to directly discuss the reasons why what I quoted is wrong.
You fail once again.
Yet another tragic example of J Gorman’s lack of critical reading skills.
It was not stated that those intervals were “made up”. How could Gorman be so dense as to imagine that was the case?
It was stated that Gorman cherry picked just one of three available time intervals in just one of five available datasets in order to come up with a dataset and a time interval that does not display statistical significance. A truly textbook example of classically disingenuous cherry picking.
Gorman ignores the fact that 9 of the other 10 choices he could have made do show global statistical significance.
Gorman also ignores the fact that all of the datasets show that the magnitude of the upward global water vapor trend has been growing as the world continues to warm. Thus even the one cherry picked dataset that Gorman chose (with the time interval that goes back the longest into the past) also shows a statistically significant global trend during the more recent timeframes.
Another shameful yet typical example of so-called “skepticism” at its very worst, employing disgracefully obvious cherry picking in order to deliberately misrepresent the totality of the available data.
And J Gorman still wonders why so-called “skeptics” like himself cannot be taken seriously? Unbelievable.
re: “The least you could do is supply your mathematics, either done by you or others, to show that his are wrong”
Here’s an elementary primer for starters:
http://www.globalwarmingequation.info/
Show YOUR mathematics that disprove Monkton’s.
Don’t refer me to a book. Show YOUR work from the book.
Dont assume you are dealing with idiots here. I studied Bode in depth, as have others here, with components that were reactive and also had gain thereby requiring calculus to develop the overall gain and frequency response.
You apparently don’t even understand that CM’s purpose was not to actually define a functional relationship but to simply show that a fundamental assumption of climate scientists and folks like you is wrong when it comes to feedback.
Ah, and here we go with yet another Gormanian episode of “Let’s Move The Goalposts”.
First it was “either done by you or by others”. Now it has morphed into only “done by you”.
Just another empty handwaving excuse in order to try to pretend away reality.
re: “Dont assume you are dealing with idiots here”
Well, if you’re not, then prove it by studying, carefully, the following selections from the reference already provided:
Derivation of equation: ΔF = 5.35 ln (C/C0)
Derivation of temperature increase equation: ΔT = 1.66 ln (C/C0)
Calculation of temperature increase for doubling CO2 content
Until that occurs, no rational discussion with you on this topic is possible.
Since you are obviously not going to respond with YOUR math about feedback calculations, I will tell you why what you responded with is junk.
A functional relationship is known in math as a formula that provides ONE and only ONE output for each input. This means it can provide a prediction of an exact value that can be compared to experimental observation.
The relationships shown on the web page do not provide absolute values so they are worthless for obtaining verifiable observations.
While the formulas shown do provide a single value for delta T and delta F, they are insufficient for calculating actual values of growth. Why you ask?
They fail to provide multiple values for similar CO2 concentrations. When you examine the data closely, you will see that similar concentrations can provide different temperature anomaly values.
What you are looking at on this page is basically a curve fitting attempt to temperature anomalies. In other words, it is not a scientific attempt to explain a natural phenomena.
You betray your lack of sophistication in mathematics and how physical phenomena must be describable in detailed formulas.
re: “The relationships shown on the web page do not provide absolute values so they are worthless for obtaining verifiable observations.”
This “objection” is so ridiculous. In a system of multiple variables, it is possible to define an absolute mathematical relationship between a single input variable (CO2) and the output variable (temperature) assuming that the other variables remain more or less constant.
That is what is presented here. These equations provide an accurate description of changes in temperature given changes of just the one currently most influential variable, CO2.
Moreover, measurements indicate that changes in other influences are currently minor in comparison to the CO2 influence, and can thus be considered to be remaining more or less constant. So these equations also provide an accurate description of total expected temperature changes. And in fact, temperature change trends since the onset of the Industrial Revolution have followed these equations quite closely.
Gorman’s handwaving “objections” are just another anti-science excuse to try to pretend away reality.
“Moreover, measurements indicate that changes in other influences are currently minor in comparison to the CO2 influence, and can thus be considered to be remaining more or less constant.”
So CO2 *is* the magic thermostat? Then how do you explain the recent, multi-year pauses that have happened since 2000?
It would appear that some of those “minor” influences may not be so minor! Either that or CO2 is *not* the magic thermostat you claim.
T Gorman,
Learn to differentiate between mere temporary fluctuations, which is what your “bu bu bu bu what about pauses” whining represents, and actual drivers of long term trends, like increasing CO2 levels.
Yet another sorry display of handwaving excuses to try to pretend away reality.
You have already posted a set of very, very dubious formulas from a web page that no more show a functional relationship between CO2 and temperature than between the man in the moon and CO2. You have shown very little knowledge of the math required to prove a theory and therefore shouldn’t be chastising anyone.
What J Gorman pretends are “very very dubious formulas” are in reality well founded science known and backed by observational evidence since way back in the 19th century.
Another tragically abysmal Gormanian fail.
Show us how a single CO2 concentration arrives at multiple temperature predictions. Several of the graphs you have referenced show multiple temps for the same CO2 value. And some show multiple CO2 values with the same temperature. That means the formulas are not correct.
The fallacy of using long linear regression lines to forecast is that it gives equal weight to *all* data points, far past, past, recent, and current. It’s actually a form of argumentative fallacy known as Argument to Tradition – it’s been this way in the past so it will always be this way.
The glacial and inter-glacial periods of the Earth’s history belies the belief that things never change.
Not even CO2 in the atmosphere remains the same. If temperature is supposed to follow CO2 then it should follow CO2. Yet we know that it doesn’t.
And *YOU* can’t explain why it doesn’t. *YOU* can’t explain why “temporary fluctuations” happen. Neither can the climate models since they don’t show any fluctuations like the pauses we have had recently!
If you can’t explain the fluctuations then you can’t call them temporary!
Another round of tired old pretend away reality excuses. Those temporary fluctuations that have Gorman in such a tizzy are mostly due to El Nino / La Nina events and volcanic episodes.
Gorman also ignores that we know these fluctuations are temporary because heat continues to accumulate in the oceans. It’s just a matter of time until that heat is released into the atmosphere with the next major El Nino.
But so-called “skeptics” like Gorman intentionally hide from this information because it doesn’t support their “Nuh Uh because I say so” narrative.
You are so full of it, It isn’t even funny anymore. First you argue that water vapor is not constant, that it is increasing. Then you come here and say everything else is constant except for CO2.
Do you recognize how paranoid you are?
Are clouds constant? How about albedo? How about the tilt of the earth? Or seasons? Or methane? Or sunspots? Or a thousand other things. Do you truly believe they are constant?
J Gorman’s “response” is once again just so tragically ridiculous.
For the several decades timeframe we are talking about here, does Gorman really want to pretend that the tilt of the earth might be changing in any meaningful way? Talk about comical!
And really? “seasons” ? How do “seasons” drive a decades long trend? Gorman, do you have any clue what you are talking about?
Sunspots? The effect of observed sunspot changes is an order of magnitude smaller than the CO2 warming influence.
And Gorman, learn the difference between primary driving variables and variables that will change in response to those primary drivers. Clouds, water vapor, albedo, all change in response to being driven by primary drivers like CO2 changes. DUH.
Tell us the GCM’s are so complicated. If it is as simple as you say, a simple Personal Computer could make accurate predictions.
You’ve lost the argument. Ad hominem won’t change that.
For global trends, even hand calculated trends have been accurate.
The Gorman really hasn’t any clue what it is talking about.
Looks like he’s earned himself a spot in approval purgatory, what a nutter.
MGC, who is credulous enough to swallow the Hokey-Stick graph that shot Mann to notoriety, should know that, as an expert reviewer for the 2013 Fifth Assessment Report, I included in my review a list of some 400 papers providing real-world evidence that in all parts of the world the climate of the middle ages was at least as warm as it is today. However, IPCC found this inconvenient truth too much for it, and took no account of my submission.
One understands MGC’s devotion to the climate-Communist Party Line that is now so enriching Mr Putin, since there are few coal-fired power stations in Europe to compete with his overpriced Siberian gas – overpriced thanks to the very large hike in commodity prices that has arisen from the special military massacre in Ukraine. But the climate Communists now have the blood of thousands of innocent Ukrainians on their hands and, in due course, they will be brought to account for it. MGC should be a little more careful in future, and may care to reflect both sides of the scientific evidence, and not just the side that suits the climate Communist faction to which he murderously adheres. I say “murderously” because, were it not for the climate-Communist faction, no one would have shut down all or nearly all of the coal-fired power stations; Germany, to name but one, would not have become cravenly dependent on Siberian gas; and Putin would not have been able to fund his continuing invasion with the massive daily funds paid to him by Germany and many other European countries so that his Siberian gas, and that alone, with no competition from coal, can keep the lights on.
And here come the typically wild, zero evidence “Nuh Uh because I say so” conspiracy theory responses, which pretend that research team after research team after research team after research team, from all over the globe, from a wide variety of scientific disciplines, for a quarter of a century, have all simply “made up” their research results, in order to supposedly foist some nefarious “scam” upon all of mankind.
Delusional doesn’t even being to properly describe such notions.
And now with the patented, anyone who points to well documented facts, is just a wacky conspiracy theorist.
What “well documented facts” ? There have been none presented here by Monckton. Just a lot of handwaving and empty, unsupported claims.
You are nothing but a watermelon propagandist.
Feel free to post evidence that it is warmer today than during the MWP.
Already did. Sorry to see that you were not paying attention.
Menteur!
Graemethecat sadly continues to demonstrate how not to pay attention.
Look more carefully before you speak again.
The fanatical but furtively acronymic climate Communist “MGC” says there is “zero evidence” for my contention that the medieval warm period was, in most parts of the world, warmer than the present. Yet I had alluded to 400 learned papers establishing by a variety of real-world as opposed to microchip-masturbation methods that global temperature in the Middle Ages was at least as warm as the present.
And it is not that research teams have “made up” their results – though, of course, that was one of the conclusions drawn by the Congressional inquiry into the hokey-stick graph. The truth is that, through an unholy combination of direct or indirect Communist pressure on and within academe and the media and excessive interdisciplinary compartmentalization, the vast majority of climate “scientists” did not realize that their mid-range climate-sensitivity estimates were far too high due to an elementary error of physics that had arisen when they had attempted to borrow the mathematics of feedback from a branch of physics – control theory – with which they were unfamiliar and in which they were and are insufficiently educated.
Likewise, through ignorance of elementary macroeconomics they did not realize that even if the whole of the West achieved nut-zero emissions by 2050 there would be so small a decrease in temperature compared with that which would have obtained on the business-as-usual case that the quadrillions they are flinging at what is in any event a non-problem would be entirely wasted.
Finally, through systematic and systemic Communist subversion in the news media, in the “Democrat” party and throughout academe, they were not allowed to see what Putin and XI were up to: Putin profiteering by knocking out competition from coal-fired power stations, so that Germany, in particular, would be forced to continue to pay billions to the Kremlin for Siberian gas that now costs ten times coal-fired power per MWh; Xi by ordering his feeble-minded stooge Biden to withdraw precipitately from Afghanistan so that Peking could control the vast lithium deposits in Afghanistan, the greatest in the world. Peking now controls very nearly 100% of lithium carbonate and lithium hydroxide production for batteries in the electric buggies we are all being compelled to use.
“MGC”, whoever it is, should not, therefore, assume that every fact with which it disagrees is the result of a conspiracy theory.
Can you post a link to a few of the 400 global temperature reconstructions that you speak of so that we can review them?
Studies establishing the reality of the medieval warm period
The overwhelming majority of the following empirical studies in the journals demonstrate that the Middle Ages were warmer than today
General temperature reconstructions
Bard, E. 2002. Climate shock: Abrupt changes over millennial time scales. Physics Today 55(12): 32-38.
Bell, B. and Menzel, D.H. 1972. Toward the observation and interpretation of solar phenomena. AFCRL F19628-69-C-0077 and AFCRL-TR-74-0357, Air Force Cambridge Research Laboratories, Bedford, MA, pp. 8-12.
Bürger, G. 2010. Clustering climate reconstructions. Climate of the Past Discussions 6: 659–679.
Cook, E.R. and Kairiukstis, L.A. 1990. Methods of Dendrochronology: Applications in the Environmental Sciences. Kluwer, Dordrecht, The Netherlands.
Dergachev, V.A. and Raspopov, O.M. 2010a. Reconstruction of the Earth‘s surface temperature based on data of deep boreholes, global warming in the last millennium, and long-term solar cyclicity. Part 1. Experimental data. Geomagnetism and Aeronomy 50: 383–392.
Dergachev, V.A. and Raspopov, O.M. 2010b. Reconstruction of the Earth‘s surface temperature based on data of deep boreholes, global warming in the last millennium, and long-term solar cyclicity. Part 2. Experimental data analysis. Geomagnetism and Aeronomy 50: 393–402.
Esper, J. and Frank, D. 2009. The IPCC on a heterogeneous Medieval Warm Period. Climatic Change 94: 267-273
Fritts, H.C. 1976. Tree Rings and Climate. Academic Press, London, UK.
Loehle, C. 2004. Climate change: detection and attribution of trends from long-term geologic data. Ecological Modelling 171: 433-450.
McIntyre, S. and McKitrick, R. 2005. Hockey sticks, principal components and spurious significance. Geophysical Research Letters 32 L03710.
Soon, W. and Baliunas, S. 2003. Proxy climatic and environmental changes of the past 1000 years. Climate Research 23 (2): 89-110.
Wanner, H., Beer, J., Butikofer, J., Crowley, T.J., Cubasch, U., Fluckiger, J., Goosse, H., Grosjean, M., Joos, F., Kaplan, J.O., Kuttel, M., Muller, S.A., Prentice, I.C., Solomina, O., Stocker, T.F., Tarasov, P., Wagner, M., and Widmann, M. 2008. Mid- to Late Holocene climate change: an overview. Quaternary Science Reviews 27: 1791–1828.
Northern Hemisphere
Bond, G. and Lotti, R. 1995. Iceberg discharges into the North Atlantic on millennial time scales during the last glaciation. Science 267: 1005–1010.
Bond, G., Kromer, B., Beer, J., Muscheler, R., Evans, M.N., Showers, W., Hoffmann, S., Lotti-Bond, R., Hajdas, I., and Bonani, G. 2001. Persistent solar influence on North Atlantic climate during the Holocene. Science 294: 2130–2136.
Bond, G., Showers, W., Cheseby, M., Lotti, R., Almasi, P., deMenocal, P., Priore, P., Cullen, H., Hajdas, I., and Bonani, G. 1997. A pervasive millennial-scale cycle in North Atlantic Holocene and Glacial climate. Science 278: 1257–1266.
Brohan, P., Kennedy, J., Harris, I., Tett, S.F.B., and Jones, P.D. 2006. Uncertainty estimates in regional and global observed temperature changes: a new dataset from 1850. Journal of Geophysical Research 111: 10.1029/2005JD006548.
Bürger, G. 2010. Clustering climate reconstructions. Climate of the Past Discussions 6: 659-679.
Butikofer, J. 2007. Millennial Scale Climate Variability During the Last 6000 Years—Tracking Down the Bond Cycles. Diploma thesis, University of Bern, Bern, Switzerland.
Christiansen, B. and Ljungqvist, F.C. 2012. The extra-tropical Northern Hemisphere temperature in the last two millennia: reconstructions of low-frequency variability. Climate of the Past 8: 765-786.
D’Arrigo, R., Wilson, R. and Jacoby, G., 2006: On the long-term context for late 20th century warming. Journal of Geophysical Research 111: D3, D03103.
Denton, G.H. and Karlen, W. 1973. Holocene climatic variations—their pattern and possible cause. Quaternary Research 3: 155–205.
Hong, Y.T., Hong, B., Lin, Q.H., Shibata, Y., Zhu, Y.X., Leng, X.T., and Wang, Y. 2009a. Synchronous climate anomalies in the western North Pacific and North Atlantic regions during the last 14,000 years. Quaternary Science Reviews 28: 840–849.
Hong, B., Liu, C., Lin, Q., Yasuyuki, S., Leng, X., Wang, Y., Zhu, Y., and Hong, Y. 2009b. Temperature evolution from the δ18O record of Hami peat, Northeast China, in the last 14,000 years. Science in China Series D: Earth Sciences 52: 952–964.
Isono, D., Yamamoto, M., Irino, T., Oba, T., Murayama, M., Nakamura, T., and Kawahata, H. 2009. The 1500-year climate oscillation in the mid-latitude North Pacific during the Holocene. Geology 37: 591–594. Loehle, C. 2009. A mathematical analysis of the divergence problem in dendroclimatology. Climatic Change 94: 233–245.
Ljungqvist, F.C. 2010. A new reconstruction of temperature variability in the extra-tropical northern hemisphere during the last two millennia. Geografiska Annaler 92A: 339–351.
Ljungqvist, F.C., Krusic, P.J., Brattstrom, G. and Sundqvist, H.S. 2012. Northern Hemisphere temperature patterns in the last 12 centuries. Climate of the Past 8: 227-249.
Mayewski, P.A., Rohling, E.E., Stager, J.C., Karlen, W., Maasch, K.A., Meeker, L.D., Mann, M.E., Woodruff, J.D., Donnelly, J.P. and Zhang, Z. 2009. Atlantic hurricanes and climate over the past 1,500 years. Nature 460: 880-883.
Meyerson, E.A., Gasse, F., van Kreveld, S., Holmgren, K., Lee-Thorp, J., Rosqvist, G. Rack, F., Staubwasser, M., Schneider, R.R., and Steig, E.J. 2004. Holocene climate variability. Quaternary Research 62: 243–255.
McIntyre, S. and McKitrick, R. 2003. Corrections to the Mann et al. (1998) proxy data base and Northern Hemispheric average temperature series. Energy and Environment 14: 751–771.
Moberg, A., Sonechkin, D.M., Holmgren, K., Datsenko, N.M., and Karlen, W. 2005. Highly variable Northern Hemisphere temperatures reconstructed from low- and high-resolution proxy data. Nature 433: 613–617.
Oppo, D. 1997. Millennial climate oscillations. Science 278: 1244–1246. Rayner, N.A., Brohan, P., Parker, D.E., Folland, C.K., Kennedy, J.J., Vanicek, M., Ansell, T., and Tett, S.F.B. 2006. Improved analyses of changes and uncertainties in marine temperature measured in situ since the mid-nineteenth century: the HadSST2 dataset. Journal of Climate 19: 446–469.
Richter, T.O., Peeters, F.J.C. and van Weering, T.C.E. 2009. Late Holocene (0-2.4 ka BP) surface water temperature and salinity variability, Feni Drift, NE Atlantic Ocean. Quaternary Science Reviews 28: 1941-1955.
Trouet, V., Esper, J., Graham, N.E., Baker, A., Scourse, J.D. and Frank, D.C. 2009. Persistent positive North Atlantic Oscillation mode dominated the Medieval Climate Anomaly. Science 324: 78-80.
Wanner, H. and Butikofer, J. 2008. Holocene Bond cycles: real or imaginary? Geografie-Sbornik CGS 113: 338–350.
Wanner, H., Beer, J., Butikofer, J., Crowley, T., Cubasch, U., Fluckiger, J., Goosse, H., Grosjean, M., Joos, F., Kaplan, J.O., Kuttel, M., Muller, S., Pentice, C., Solomina, O., Stocker, T., Tarasov, P., Wagner, M., and Widmann, M. 2008. Mid to late Holocene climate change—an overview. Quaternary Science Reviews 27: 1791–1828.
Arctic
Benner, R., Benitez-Nelson, B., Kaiser, K. and Amon, R.M.W. 2004. Export of young terrigenous dissolved organic carbon from rivers to the Arctic Ocean. Geophysical Research Letters 31: 10.1029/2003GL019251.
Besonen, M.R., Patridge, W., Bradley, R.S., Francus, P., Stoner, J.S. and Abbott, M.B. 2008. A record of climate over the last millennium based on varved lake sediments from the Canadian High Arctic. The Holocene 18: 169-180.
Bonnet, S., de Vernal, A., Hillaire-Marcel, C., Radi, T. and Husum, K. 2010. Variability of sea-surface temperature and sea-ice cover in the Fram Strait over the last two millennia. Marine Micropaleontology 74: 59-74
Comiso, J.C., Wadhams, P., Pedersen, L.T. and Gersten, R.A. 2001. Seasonal and interannual variability of the Odden ice tongue and a study of environmental effects. Journal of Geophysical Research 106: 9093-9116.
Deser, C., Walsh, J.E. and Timlin, M.S. 2000. Arctic sea ice variability in the context of recent atmospheric circulation trends. Journal of Climatology 13: 617-633.
Divine, D., Isaksson, E., Martma, T., Meijer, H.A.J., Moore, J., Pohjola, V., van de Wal, R.S.W. and Godtliebsen, F. 2011. Thousand years of winter surface air temperature variations in Svalbard and northern Norway reconstructed from ice-core data. Polar Research 30: 10.3402/polar.v30i0.7379
Drinkwater, K.F. 2006. The regime shift of the 1920s and 1930s in the North Atlantic. Progress in Oceanography 68: 134-151.
Gonzalez-Rouco, F., von Storch, H. and Zorita, E. 2003. Deep soil temperature as proxy for surface air-temperature in a coupled model simulation of the last thousand years. Geophysical Research Letters 30: 10.1029/2003GL018264.
Goulden, M.L., Wofsy, S.C., Harden, J.W., Trumbore, S.E., Crill, P.M., Gower, S.T., Fries, T., Daube, B.C., Fan, S., Sutton, D.J., Bazzaz, A. and Munger, J.W. 1998. Sensitivity of boreal forest carbon balance to soil thaw. Science 279: 214-217.
Grinsted, A., Moore, J.C., Pohjola, V., Martma, T. and Isaksson, E. 2006. Svalbard summer melting, continentality, and sea ice extent from the Lomonosovfonna ice core. Journal of Geophysical Research 111: 10.1029/2005JD006494.
Groisman, P.Ya., Knight, R.W., Razuvaev, V.N., Bulygina, O.N. and Karl, T.R. 2006. State of the ground: Climatology and changes during the past 69 years over northern Eurasia for a rarely used measure of snow cover and frozen land. Journal of Climate 19: 4933-4955.
Grudd, H., Briffa, K.R., Karlén, W., Bartholin, T.S., Jones, P.D. and Kromer, B. 2002. A 7400-year tree-ring chronology in northern Swedish Lapland: natural climatic variability expressed on annual to millennial timescales. The Holocene 12: 657-665.
Humlum, O., Elberling, B., Hormes, A., Fjordheim, K., Hansen, O.H. and Heinemeier, J. 2005. Late-Holocene glacier growth in Svalbard, documented by subglacial relict vegetation and living soil microbes. The Holocene 15: 396-407.
Isaksson, E., Hermanson, M., Hicks, S., Igarashi, M., Kamiyama, K., Moore, J., Motoyama, H., Muir, D., Pohjola, V., Vaikmae, R., van de Wal, R.S.W. and Watanabe, O. 2003. Ice cores from Svalbard—useful archives of past climate and pollution history. Physics and Chemistry of the Earth 28: 1217-1228.
Jomelli, V. and Pech, P. 2004. Effects of the Little Ice Age on avalanche boulder tongues in the French Alps (Massif des Ecrins). Earth Surface Processes and Landforms 29: 553-564.
Karlén, W. 2005. Recent global warming: An artifact of a too-short temperature record? Ambio 34: 263-264.
Kasper, J.N. and Allard, M. 2001. Late-Holocene climatic changes as detected by the growth and decay of ice wedges on the southern shore of Hudson Strait, northern Québec, Canada. The Holocene 11: 563-577.
Laidre, K.L. and Heide-Jorgensen, M.P. 2005. Arctic sea ice trends and narwhal vulnerability. Biological Conservation 121: 509-517.
Lovelius, N.V. 1997. Dendroindication of Natural Processes. World and Family 95. St. Petersburg, Russia.
Moore, G.W.K., Holdsworth, G. and Alverson, K. 2002. Climate change in the North Pacific region over the past three centuries. Nature 420: 401-403.
Naurzbaev, M.M. and Vaganov, E.A. 2000. Variation of early summer and annual temperature in east Taymir and Putoran (Siberia) over the last two millennia inferred from tree rings. Journal of Geophysical Research 105: 7317-7326.
Naurzbaev, M.M., Vaganov, E.A., Sidorova, O.V. and Schweingruber, F.H. 2002. Summer temperatures in eastern Taimyr inferred from a 2427-year late-Holocene tree-ring chronology and earlier floating series. The Holocene 12: 727-736.
Parkinson, C.L. 2000a. Variability of Arctic sea ice: the view from space, and 18-year record. Arctic 53: 341-358.
Parkinson, C.L. 2000b. Recent trend reversals in Arctic Sea ice extents: possible connections to the North Atlantic oscillation. Polar Geography 24: 1-12.
Parkinson, C.L. and Cavalieri, D.J. 2002. A 21-year record of Arctic sea-ice extents and their regional, seasonal and monthly variability and trends. Annals of Glaciology 34: 441-446.
Parkinson, C., Cavalieri, D., Gloersen, D., Zwally, J. and Comiso, J. 1999. Arctic sea ice extents, areas, and trends, 1978-1996. Journal of Geophysical Research 104: 20,837-20,856.
Peterson, B.J., Holmes, R.M., McClelland, J.W., Vorosmarty, C.J., Lammers, R.B., Shiklomanov, A.I., Shiklomanov, I.A. and Rahmstorf, S. 2002. Increasing river discharge in the Arctic Ocean. Science 298: 2171-2173.
Polyakov, I., Akasofu, S.-I., Bhatt, U., Colony, R., Ikeda, M., Makshtas, A., Swingley, C., Walsh, D. and Walsh, J. 2002a. Trends and variations in Arctic climate system. EOS: Transactions, American Geophysical Union 83: 547-548.
Polyakov, I.V., Alekseev, G.V., Bekryaev, R.V., Bhatt, U., Colony, R.L., Johnson, M.A., Karklin, V.P., Makshtas, A.P., Walsh, D. and Yulin A.V. 2002b. Observationally based assessment of polar amplification of global warming. Geophysical Research Letters 29: 10.1029/2001GL011111.
Polyakov, I.V., Alekseev, G.V., Timokhov, L.A., Bhatt, U.S., Colony, R.L., Simmons, H.L., Walsh, D., Walsh, J.E. and Zakharov, V.F. 2004. Variability of the intermediate Atlantic water of the Arctic Ocean over the last 100 years. Journal of Climate 17: 4485-4497.
Polyakov, I.V., Bekryaev, R.V., Alekseev, G.V., Bhatt, U.S., Colony, R.L., Johnson, M.A., Maskshtas, A.P. and Walsh, D. 2003. Variability and trends of air temperature and pressure in the maritime Arctic, 1875-2000. Journal of Climate 16: 2067-2077.
Przybylak, R. 1997. Spatial and temporal changes in extreme air temperatures in the Arctic over the period 1951-1990. International Journal of Climatology 17: 615-634.
Przybylak, R. 2000. Temporal and spatial variation of surface air temperature over the period of instrumental observations in the Arctic. International Journal of Climatology 20: 587-614.
Przybylak, R. 2002. Changes in seasonal and annual high-frequency air temperature variability in the Arctic from 1951-1990. International Journal of Climatology 22: 1017-1032.
Raspopov, O.M., Dergachev, V.A. and Kolstrom, T. 2004. Periodicity of climate conditions and solar variability derived from dendrochronological and other palaeoclimatic data in high latitudes. Palaeogeography, Palaeoclimatology, Palaeoecology 209: 127-139.
Schell, D.M., 1983, Carbon-13 & carbon-14 abundances in Alaskan aquatic organisms: delayed production from peat in Arctic food webs. Science 219: 1068-71.
Schirrmeister, L., Siegert, C., Kuznetsova, T., Kuzmina, S., Andreev, A., Kienast, F., Meyer, H. and Bobrov, A. 2002. Paleoenvironmental and paleoclimatic records from permafrost deposits in the Arctic region of northern Siberia. Quaternary International 89: 97-118.
Soon, W. W.-H. 2005. Variable solar irradiance as a plausible agent for multidecadal variations in the Arctic-wide surface air temperature record of the past 130 years. Geophysical Research Letters 32 L16712, doi:10.1029/2005GL023429.
Stern, H.L. and Heide-Jorgensen, M.P. 2003. Trends and variability of sea ice in Baffin Bay and Davis Strait, 1953-2001. Polar Research 22: 11-18.
Vaganov, E.A., Shiyatov, S.G. and Mazepa, V.S. 1996. Dendroclimatic Study in Ural-Siberian Subarctic. Nauka, Novosibirsk, Russia.
Yoo, J.C. and D’Odorico, P. 2002. Trends and fluctuations in the dates of ice break-up of lakes and rivers in Northern Europe: the effect of the North Atlantic Oscillation. Journal of Hydrology 268: 100-112.
Zeeberg, J. and Forman, S.L. 2001. Changes in glacier extent on north Novaya Zemlya in the twentieth century. Holocene 11: 161-175.
Greenland
Alley, R.B., Meese, D.A., Shuman, C.A., Gow, A.J., Taylor, K.C., Grootes, P.M., White, J.C.W., Ram, M., Waddington, E.D., Mayewski, P.A., and Zielinski, G.A. 1993. Abrupt increase in Greenland snow accumulation at the end of the Younger Dryas event. Nature 362: 527–529.
Andresen, C.S., Bjorck, S., Bennike, O., and Bond, G. 2004. Holocene climate changes in southern Greenland: evidence from lake sediments. Journal of Quaternary Science 19: 783–793.
Christiansen, H.H. 1998. ‘Little Ice Age’ navigation activity in northeast Greenland. The Holocene 8: 719-728.
Chylek, P., Box, J.E. and Lesins, G. 2004. Global warming and the Greenland ice sheet. Climatic Change 63: 201-221.
Chylek, P., Dubey, M.K, and Lesins, G. 2006. Greenland warming of 1920-1930 and 1995-2005. Geophysical Research Letters 33: L11707.
Comiso, J.C., Wadhams, P., Pedersen, L.T. and Gersten, R.A. 2001. Seasonal and interannual variability of the Odden ice tongue and a study of environmental effects. Journal of Geophysical Research 106: 9093-9116.
Dahl-Jensen, D., Mosegaard, K., Gundestrup, N., Clow, G.D., Johnsen, S.J., Hansen, A.W. and Balling, N. 1998. Past temperatures directly from the Greenland Ice Sheet. Science 282: 268-271.
Dansgaard, W., Johnsen, S.J., Gundestrup, N., Clausen, H.B. and Hammer, C.U. 1975. Climatic changes, Norsemen and modern man. Nature 255: 24-28.
Groton, CT. Vinther, B.M., Jones, P.D., Briffa, K.R., Clausen, H.B., Andersen, K.K., Dahl-Jensen, D., and Johnsen, S.J. 2010. Climatic signals in multiple highly resolved stable isotope records from Greenland. Quaternary Science Reviews 29: 522–538.
Hanna, E. and Cappelen, J. 2002. Recent climate of Southern Greenland. Weather 57: 320-328.
Hanna, E. and Cappelen, J. 2003. Recent cooling in coastal southern Greenland and relation with the North Atlantic Oscillation. Geophysical Research Letters 30: 10.1029/2002GL015797.
Hansen, B.U., Elberling, B., Humlum, O. and Nielsen, N. 2006. Meteorological trends (1991-2004) at Arctic Station, Central West Greenland (69°15’N) in a 130 years perspective. Geografisk Tidsskrift, Danish Journal of Geography 106: 45-55.
Humlum, O. 1999. Late-Holocene climate in central West Greenland: meteorological data and rock-glacier isotope evidence. The Holocene 9: 581-594.
Jennings, A.E. and Weiner, N.J. 1996. Environmental change in eastern Greenland during the last 1300 years: evidence from foraminifera and lithofacies in Nansen Fjord, 68°N. The Holocene 6: 179–191.
Jensen, K.G., Kuijpers, A., Koc, N. and Heinemeier, J. 2004. Diatom evidence of hydrographic changes and ice conditions in Igaliku Fjord, South Greenland, during the past 1500 years. The Holocene 14: 152-164.
Johnsen, S.J., Dahl-Jensen, D., Gundestrup, N., Steffensen, J.P., Clausen, H.B., Miller, H., Masson-Delmotte, V., Sveinbjörnsdottir, A.E., and White, J. 2001. Oxygen isotope and palaeotemperature records from six Greenland ice-core stations: Camp Century, Dye-3, GRIP, GISP2, Renland and NorthGRIP. Journal of Quaternary Science 16: 299–307.
Kalnay, E., Kanamitsu, M., Kistler, R., Collins, W., Deaven, D., Gandin, L., Iredell, M., Saha, S., White, G., Woollen, J., Zhu, Y., Chelliah, M., Ebisuzaki, W., Higgins, W., Janowiak, J., Mo, K.C., Ropelewski, C., Wang, J., Leetmaa, A., Reynolds, R., Jenne, R. and Joseph, D. 1996. The NCEP/NCAR 40-year reanalysis project. Bulletin of the American Meteorological Society 77: 437-471.
Kaplan, M.R., Wolfe, A.P. and Miller, G.H. 2002. Holocene environmental variability in southern Greenland inferred from lake sediments. Quaternary Research 58: 149-159.
Keigwin, L.D. and Boyle, E.A. 2000. Detecting Holocene changes in thermohaline circulation. Proceedings of the National Academy of Sciences USA 97: 1343-1346.
Koerner, R.M. and Fisher, D.A. 1990. A record of Holocene summer climate from a Canadian high-Arctic ice core. Nature 343: 630-631.
Kobashi, T., Severinghaus, J.P., and Kawamura, K. 2008. Argon and nitrogen isotopes of trapped air in the GISP2 ice core during the Holocene epoch (0–11,600 B.P.): methodology and implications for gas loss processes. Geochimica et Cosmochimica Acta 72: 4675–4686.
Kobashi, T., Severinghaus, J.P., Barnola, J.-M., Kawamura, K., Carter, T., and Nakaegawa, T. 2010. Persistent multi-decadal Greenland temperature fluctuation through the last millennium. Climatic Change 100: 733–756.
Korhola, A., Weckstrom, J., Holmstrom, L. and Erasto, P. 2000. A quantitative Holocene climatic record from diatoms in northern Fennoscandia. Quaternary Research 54: 284-294.
Lassen, S.J., Kuijpers, A., Kunzendorf, H., Hoffmann-Wieck, G., Mikkelsen, N., and Konradi, P. 2004. Late Holocene Atlantic bottom water variability in Igaliku Fjord, South Greenland, reconstructed from foraminifera faunas. The Holocene 14: 165–171.
Moberg, A., Sonechkin, D.M., Holmgren, K., Datsenko, N.M. and Karlén, W. 2005. Highly variable Northern Hemisphere temperatures reconstructed from low- and high-resolution proxy data. Nature 433: 613-617.
Moore, J.J., Hughen, K.A., Miller, G.H. and Overpeck, J.T. 2001. Little Ice Age recorded in summer temperature reconstruction from varved sediments of Donard Lake, Baffin Island, Canada. Journal of Paleolimnology 25: 503-517.
Naurzbaev, M.M., Vaganov, E.A., Sidorova, O.V. and Schweingruber, F.H. 2002. Summer temperatures in eastern Taimyr inferred from a 2427-year late-Holocene tree-ring chronology and earlier floating series. The Holocene 12: 727-736.
Norgaard-Pedersen, N. and Mikkelsen, N. 2009. 8000 year marine record of climate variability and fjord dynamics from Southern Greenland. Marine Geology 264: 177–189.
O’Brien, S.R., Mayewski, P.A., Meeker, L.D., Meese, D.A., Twickler, M.S., and Whitlow, S.E. 1995. Complexity of Holocene climate as reconstructed from a Greenland ice core. Science 270: 1962–1964.
Przybylak, R. 2000. Temporal and spatial variation of surface air temperature over the period of instrumental observations in the Arctic. International Journal of Climatology 20: 587-614.
Rayner, N.A., Horton, E.B., Parker, D.E., Folland, C.K. and Hackett, R.B. 1996. Version 2.2 of the global sea-ice and sea surface temperature data set, 1903-1994. Climate Research Technical Note 74, Hadley Centre, U.K. Meteorological Office, Bracknell, Berkshire, UK.
Rolland, N., Larocque, I., Francus, P., Pienitz, R. and Laperriere, L. 2009. Evidence for a warmer period during the 12th and 13th centuries AD from chironomid assemblages in Southampton Island, Nunavut, Canada. Quaternary Research 72: 27-37.
Roncaglia, L. and Kuijpers A. 2004. Palynofacies analysis and organic-walled dinoflagellate cysts in late-Holocene sediments from Igaliku Fjord, South Greenland. The Holocene 14: 172-184.
Schweingruber, F.H. and Briffa, K.R. 1996. Tree-ring density network and climate reconstruction. In: Jones, P.D., Bradley, R.S. and Jouzel, J. (Eds.), Climatic Variations and Forcing Mechanisms of the Last 2000 Years, NATO ASI Series 141. Springer-Verlag, Berlin, Germany, pp. 43-66.
Seaver, K.A. 1996. The Frozen Echo: Greenland and the Exploration of North America AD c. 1000-1500. Stanford University Press, Stanford, CA, USA.
Seppa, H. and Birks, H.J.B. 2002. Holocene climate reconstructions from the Fennoscandian tree-line area based on pollen data from Toskaljavri. Quaternary Research 57: 191-199.
Steig, E.J., Grootes, P.M. and Stuiver, M. 1994. Seasonal precipitation timing and ice core records. Science 266: 1885-1886.
Stuiver, M., Grootes, P.M. and Braziunas, T.F. 1995. The GISP2 δ18O climate record of the past 16,500 years and the role of the sun, ocean, and volcanoes. Quaternary Research 44: 341-354.
Taurisano, A., Boggild, C.E. and Karlsen, H.G. 2004. A century of climate variability and climate gradients from coast to ice sheet in West Greenland. Geografiska Annaler 86A: 217-224.
Vaganov, E.A., Shiyatov, S.G. and Mazepa, V.S. 1996. Dendroclimatic Study in Ural-Siberian Subarctic. Nauka, Novosibirsk, Russia.
Vare, L.L., Masse, G., Gregory, T.R., Smart, C.W. and Belt, S.T. 2009. Sea ice variations in the central Canadian Arctic Archipelago during the Holocene. Quaternary Science Reviews 28: 1354-1366.
Vinther, B.M., Jones, P.D., Briffa, K.R., Clausen, H.B., Andersen, K.K., Dahl-Jensen, D. and Johnsen, S.J. 2010. Climatic signals in multiple highly resolved stable isotope records from Greenland. Quaternary Science Reviews 29: 522-538.
Virkkunen, K. 2004. Snowpit Studies in 2001-2002 in Lomonosovfonna, Svalbard. M.S. Thesis, University of Oulu, Oulu, Finland.
Wagner, B. and Melles, M. 2001. A Holocene seabird record from Raffles So sediments, East Greenland, in response to climatic and oceanic changes. Boreas 30: 228-239.
White, J.W.C., Barlow, L.K., Fisher, D., Grootes, P.M., Jouzel, J., Johnsen, S.J., Stuiver, M. and Clausen, H.B. 1997. The climate signal in the stable isotopes of snow from Summit, Greenland: Results of comparisons with modern climate observations. Journal of Geophysical Research 102: 26,425-26,439.
Iceland
Axford, Y., Geirsdottir, A., Miller, G.H., and Langdon, P.G. 2009. Climate of the Little Ice Age and the past 2000 years in northeast Iceland inferred from chironomids and other lake sediment proxies. Journal of Paleolimnology 41: 7–24.
Bianchi, G.G. and McCave, I.N. 1999. Holocene periodicity in North Atlantic climate and deep-ocean flow south of Iceland. Nature 397: 515–517.
Bradwell, T., Dugmore, A.J. and Sugden, D.E. 2006. The Little Ice Age glacier maximum in Iceland and the North Atlantic Oscillation: evidence from Lambatungnajokull, southeast Iceland. Boreas 35: 61-80.
Hanna, E., Jonsson, T., Olafsson, J. and Valdimarsson, H. 2006. Icelandic coastal sea surface temperature records constructed: Putting the pulse on air-sea-climate interactions in the Northern North Atlantic. Part I: Comparison with HadISST1 open-ocean surface temperatures and preliminary analysis of long-term patterns and anomalies of SSTs around Iceland. Journal of Climate 19: 5652-5666.
Jiang, H., Seidenkrantz, M-S., Knudsen, K.L. and Eiriksson, J. 2002. Late-Holocene summer sea-surface temperatures based on a diatom record from the north Icelandic shelf. The Holocene 12: 137-147.
Knudsen, K.L., Eiriksson, J., Jansen, E., Jiang, H., Rytter, F. and Gudmundsdottir, E.R. 2004. Palaeoceanographic changes off North Iceland through the last 1200 years: foraminifera, stable isotopes, diatoms and ice rafted debris. Quaternary Science Reviews 23: 2231-2246.
Larsen, D.J., Miller, G.H., Geirsdottir, A. and Thordarson, T. 2011. A 3000-year varved record of glacier activity and climate change from the proglacial lake Hvitarvatn, Iceland. Quaternary Science Reviews 30: 2715-2731.
Ran, L., Jiang, H., Knudsen, K.L. and Eiriksson, J. 2011. Diatom-based reconstruction of palaeoceanographic changes on the North Icelandic shelf during the last millennium. Palaeogeography, Palaeoclimatology, Palaeoecology 302: 109-119.
North America
Arseneault, D. and Payette, S. 1997. Reconstruction of millennial forest dynamics from tree remains in a subarctic tree line peatland. Ecology 78: 1873-1883.
Balling Jr., R.C., Cerveny, R.S. and Idso, C.D. 2002. Does the urban CO2 dome of Phoenix, Arizona contribute to its heat island? Geophysical Research Letters 28: 4599-4601.
Barclay, D.J., Wiles, G.C. and Calkin, P.E. 2009. Tree-ring crossdates for a first millennium AD advance of Tebenkof Glacier, southern Alaska. Quaternary Research 71: 22-26.
Barron, J.A., Heusser, L.E., and Alexander, C. 2004. High resolution climate of the past 3,500 years of coastal northernmost California. In Proceedings of the Twentieth Annual Pacific Climate Workshop, edited by S.W. Starratt and N.L. Blumquist, 13–22. U.S. Geological Survey.
Bond, G., Kromer, B., Beer, J., Muscheler, R., Evans, M.N., Showers, W., Hoffmann, S., Lotti-Bond, R., Hajdas, I. and Bonani, G. 2001. Persistent solar influence on North Atlantic climate during the Holocene. Science 294: 2130-2136.
Brunelle, A., Minckley, T.A., Blissett, S., Cobabe, S.K. and Guzman, B.L. 2010. A ~8000 year fire history from an Arizona/Sonora borderland cienega.Journal of Arid Environments 24: 475-481.
Brush, G.S. 2001. Natural and anthropogenic changes in Chesapeake Bay during the last 1000 years. Human and Ecological Risk Assessment 7: 1283-1296.
Bunbury, J. and Gajewski, K. 2012. Temperatures of the past 2000 years inferred from lake sediments, southwest Yukon Territory, Canada. Quaternary Research 77: 355-367
Byrne, R., Ingram, B.L., Starratt, S., Malamud-Roam, F., Collins, J.N., and Conrad, M.E. 2001. Carbon-isotope, diatom, and pollen evidence for late Holocene salinity change in a brackish marsh in the San Francisco estuary. Quaternary Research 55: 66–76.
Calkin, P.E., Wiles, G.C. and Barclay, D.J. 2001. Holocene coastal glaciation of Alaska. Quaternary Science Reviews 20: 449-461.
Campbell, C. 2002. Late Holocene lake sedimentology and climate change in southern Alberta, Canada. Quaternary Research 49: 96-101.
Changnon, S.A. 1999. A rare long record of deep soil temperatures defines temporal temperature changes and an urban heat island. Climatic Change 42: 531-538.
Clegg, B.F., Clarke, G.H., Chipman, M.L., Chou, M., Walker, I.R., Tinner, W., and Hu, F.S. 2010. Six millennia of summer temperature variation based on midge analysis of lake sediments from Alaska. Quaternary Science Reviews 29: 3308–3316.
Cronin, T.M., Dwyer, G.S., Kamiya, T., Schwede, S., and Willard, D.A. 2003. Medieval Warm Period, Little Ice Age and 20th century temperature variability from Chesapeake Bay. Global and Planetary Change 36: 17–29.
Cumming, B.F., Laird, K.R., Bennett, J.R., Smol, J.P. and Salomon, A.K. 2002. Persistent millennial-scale shifts in moisture regimes in western Canada during the past six millennia. Proceedings of the National Academy of Sciences USA 99: 16,117-16,121.
Dansgaard, W., Johnsen, S.J., Reech, N., Gundestrup, N., Clausen, H.B., and Hammer, C.U. 1975. Climatic changes, Norsemen and modern man. Nature 255: 24–28.
Dean, W.E. 1997. Rates, timing, and cyclicity of Holocene eolian activity in north-central United States: evidence from varved lake sediments. Geology 25: 331-334.
DeGaetano, A.T. and Allen, R.J. 2002. Trends in twentieth-century temperature extremes across the United States. Journal of Climate 15: 3188-3205.
Dow, C.L. and DeWalle, D.R. 2000. Trends in evaporation and Bowen ratio on urbanizing watersheds in eastern United States. Water Resources Research 36: 1835-1843.
Edwards, T.W.D., Birks, S.J., Luckman, B.H., and MacDonald, G.M. 2008. Climatic and hydrologic variability during the past millennium in the eastern Rocky Mountains and northern Great Plains of western Canada. Quaternary Research 70: 188–197.
Fritz, S.C., Ito, E., Yu, Z., Laird, K.R. and Engstrom, D.R. 2000. Hydrologic variation in the northern Great Plains during the last two millennia. Quaternary Research 53: 175-184.
Galloway, J.M., Lenny, A.M. and Cumming, B.F. 2011. Hydrological change in the central interior of British Columbia, Canada: diatom and pollen evidence of millennial-to-centennial scale change over the Holocene. Journal of Paleolimnology 45: 183-197.
Gedalof, Z. and Smith, D.J. 2001. Interdecadal climate variability and regime scale shifts in Pacific North America. Geophysical Research Letters 28: 1515–1518.
George, K., Ziska, L.H., Bunce, J.A. and Quebedeaux, B. 2007. Elevated atmospheric CO2 concentration and temperature across an urban-rural transect. Atmospheric Environment 41: 7654-7665.
Gonzalez, J.E., Luvall, J.C., Rickman, D., Comarazamy, D., Picon, A., Harmsen, E., Parsiani, H., Vasquez, R.E., Ramirez, N., Williams, R. and Waide, R.W. 2005. Urban heat islands developing in coastal tropical cities. EOS: Transactions, American Geophysical Union 86: 397,403.
Hallett, D.J., Lepofsky, D.S., Mathewes, R.W. and Lertzman, K.P. 2003. 11,000 years of fire history and climate in the mountain hemlock rain forests of southwestern British Columbia based on sedimentary charcoal. Canadian Journal of Forest Research 33: 292-312.
Hayhoe, K., Cayan, D., Field, C.B., Frumhoff, P.C. et al. 2004. Emissions, pathways, climate change, and impacts on California. Proceedings of the National Academy of Sciences USA 101: 12,422-12,427.
Helm, D. 1982. Multivariate analysis of alpine snow-patch vegetation cover near Milner Pass, Rocky Mountain National Park, Colorado, U.S.A. Arctic and Alpine Research 14: 87–95.
Hinkel, K.M. and Nelson, F.E. 2007. Anthropogenic heat island at Barrow, Alaska, during winter: 2001-2005. Journal of Geophysical Research 112: 10.1029/2006JD007837.
Hinkel, K.M., Nelson, F.E., Klene, A.E. and Bell, J.H. 2003. The urban heat island in winter at Barrow, Alaska. International Journal of Climatology 23: 1889-1905.
Ingram, B.L., Ingle, J.C., and Conrad, M.E. 1996. Stable isotope record of late Holocene salinity and river discharge in San Francisco Bay, California. Earth and Planetary Science Letters 141: 237–247.
Jáuregui, E. 2005. Possible impact of urbanization on the thermal climate of some large cities in Mexico. Atmosfera 18: 249-252.
LaDochy, S., Medina, R. and Patzert, W. 2007. Recent California climate variability: spatial and temporal patterns in temperature trends. Climate Research 33: 159-169.
Laird, K.R., Fritz, S.C., Grimm, E.C. and Mueller, P.G. 1996a. Century-scale paleoclimatic reconstruction from Moon Lake, a closed-basin lake in the northern Great Plains. Limnology and Oceanography 41: 890-902.
Laird, K.R., Fritz, S.C., Maasch, K.A. and Cumming, B.F. 1996b. Greater drought intensity and frequency before AD 1200 in the Northern Great Plains, USA. Nature 384: 552-554.
Laird, K.R., Cumming, B.F., Wunsam, S., Rusak, J.A., Oglesby, R.J., Fritz, S.C. and Leavitt, P.R. 2003. Lake sediments record large-scale shifts in moisture regimes across the northern prairies of North America during the past two millennia. Proceedings of the National Academy of Sciences USA 100: 2483-2488.
Laird, K.R. and Cumming, B.F. 2009. Diatom-inferred lake level from near-shore cores in a drainage lake from the Experimental Lakes Area, northwestern Ontario, Canada. Journal of Paleolimnology 42: 65-80.
Leung, L.R., Qian, Y., Bian, X., Washington, W.M., Han, J. and Roads, J.O. 2004. Mid-century ensemble regional climate change scenarios for the western United States. Climatic Change 62: 75-113.
Maul, G.A. and Davis, A.M. 2001. Seawater temperature trends at USA tide gauge sites. Geophysical Research Letters 28: 3935-3937.
McGann, M. 2008. High-resolution foraminiferal, isotopic, and trace element records from Holocene estuarine deposits of San Francisco Bay, California. Journal of Coastal Research 24: 1092–1109.
Meyer, G.A., Wells, S.G., and Jull, A.J.T. 1995. Fire and alluvial chronology in Yellowstone National Park: climatic and intrinsic controls on Holocene geomorphic processes. Geological Society of America Bulletin 107: 1211–1230.
Nordt, L., von Fischer, J., and Tieszen, L. 2007. Late Quaternary temperature record from buried soils of the North American Great Plains. Geology 35: 159–162.
Nordt, L., von Fischer, J., Tieszen, L., and Tubbs, J. 2008. Coherent changes in relative C4 plant productivity and climate during the late Quaternary in the North American Great Plains. Quaternary Science Reviews 27: 1600–1611.
Rood, S.B., Samuelson, G.M., Weber, J.K., and Wyrot, K.A. 2005. Twentieth-century decline in streamflows from the hydrographic apex of North America. Journal of Hydrology 306: 215–233. Stine, S. 1994. Extreme and persistent drought in California and Patagonia during Medieval time. Nature 369: 546–548. Stuiver, M., Grootes, P.M., and Brazunias, T.F. 1995. The GISP2 δ18O climate record of the past 16,500 years and the role of the sun, ocean, and volcanoes. Quaternary Research 44: 341–354.
Routson, C.C., Woodhouse, C.A. and Overpeck, J.T. 2011. Second century megadrought in the Rio Grande headwaters, Colorado: How unusual was medieval drought? Geophysical Research Letters 38: 10.1029/2011GL050015
Shindell, D.T., Schmidt, G.A., Mann, M.E., Rind, D. and Waple, A. 2001. Solar forcing of regional climate change during the Maunder Minimum. Science 294: 2149-2152.
Stahle, D.W. and Cleaveland, M.K. 1994. Tree-ring reconstructed rainfall over the southeastern U.S.A. during the Medieval Warm Period and Little Ice Age. Climatic Change 26: 199-212.
Stahle, D.W., Cleaveland, M.K. and Hehr, J.G. 1985. A 450-year drought reconstruction for Arkansas, United States. Nature 316: 530-532.
Stanton, M.L., Rejmanek, M., and Galen, C. 1994. Changes in vegetation and soil fertility along a predictable snowmelt gradient in the Mosquito Range, Colorado, U.S.A. Arctic and Alpine Research 26: 364–374.
Sritairat, S., Peteet, D.M., Kenna, T.C., Sambrotto, R., Kurdyla, D. and Guilderson, T. 2012. A history of vegetation sediment and nutrient dynamics at Tivoli North Bay, Hudson Estuary, New York. Estuarine, Coastal and Shelf Science 102-103: 24-35.
Thomas, E., Shackeroff, J., Varekamp, J.C., Buchholtz Ten Brink, M.R., and Mecray, E.L. 2001. Foraminiferal records of environmental change in Long Island Sound. Geological Society of America, Abstracts with Program 33(1), A–83.
Varekamp, J.C., Thomas, E., Lugolobi, F., and Buchholtz Ten Brink, M.R. 2002. The paleo-environmental history of Long Island Sound as traced by organic carbon, biogenic silica and stable isotope/trace element studies in sediment cores. Proceedings of the 6th Biennial Long Island Sound Research Conference.
Viau, A.E., Gajewski, K., Fines, P., Atkinson, D.E. and Sawada, M.C. 2002. Widespread evidence of 1500 yr climate variability in North America during the past 14,000 yr. Geology 30: 455-458.
Viau, A.E., Gajewski, K., Sawada, M.C., and Fines, P. 2006. Millennial-scale temperature variations in North America during the Holocene. Journal of Geophysical Research 111: 10.1029/2005JD006031.
von Fischer, J.C., Tieszen, L.L., and Schimel, D.S. 2008. Climate controls on C3 vs. C4 productivity in North American grasslands from carbon isotope composition of soil organic matter. Global Change Biology 14: 1–15.
Whitlock, C., Dean, W., Rosenbaum, J., Stevens, L., Fritz, S., Bracht, B., and Power, M. 2008. A 2650-year-long record of environmental change from northern Willard, D.A., Cronin, T.M. and Verardo, S. 2003. Late-Holocene climate and ecosystem history from Chesapeake Bay sediment cores, USA. The Holocene 13: 201-214.
Willard, D.A., Weimer, L.M. and Holmes, C.W. 2001. The Florida Everglades ecosystem, climatic and anthropogenic impacts over the last two millennia. Bulletins of American Paleontology 361: 41-55.
Woodhouse, C.A. and Overpeck, J.T. 1998. 2000 years of drought variability in the Central United States. Bulletin of the American Meteorological Society 79: 2693-2714.
Yellowstone National Park based on a comparison of multiple proxy data. Quaternary International 188: 126–138.
Wiles, G.C., Barclay, D.J., Calkin, P.E., and Lowell, T.V. 2008. Century to millennial-scale temperature variations for the last two thousand years inferred from glacial geologic records of southern Alaska. Global and Planetary Change 60: 115–125.
Wilson, R., Wiles, G., D‘Arrigo, R., and Zweck, C. 2007. Cycles and shifts: 1300 years of multi-decadal temperature variability in the Gulf of Alaska. Climate Dynamics 28: 425–440.
Wolfe, B.B., Edwards, T.W.D., Hall, R.I. and Johnston, J.W. 2011. A 5200-year record of freshwater availability for regions in western North America fed by high-elevation runoff. Geophysical Research Letters 38: 10.1029/2011GL047599.
Europe and the Mediterranean
Andrade, A., Rubio, B., Rey, D., Alvarez-Iglesias, P., Bernabeu, A.M. and Vilas, F. 2011. Palaeoclimatic changes in the NW Iberian Peninsula during the last 3000 years inferred from diagenetic proxies in the Ria de Muros sedimentary record. Climate Research 48: 247-259.
Andren, E., Andren, T. and Sohlenius, G. 2000. The Holocene history of the southwestern Baltic Sea as reflected in a sediment core from the Bornholm Basin. Boreas 29: 233-250.
Bazylinski, D.A. and Williams, T.J. 2007. Ecophysiology of magnetotactic bacteria. In Magnetoreception and Magnetosomes in Bacteria, edited by D. Schuler, 37–75. Berlin, Germany: Springer.
Benito, G., Rico, M., Sanchez-Moya, Y., Sopena, A., Thorndycraft, V.R. and Barriendos, M. 2010. The impact of late Holocene climatic variability and land use change on the flood hydrology of the Guadalentin River, southeast Spain. Global and Planetary Change 70: 53-63
Berglund, B.E. 2003. Human impact and climate changes—synchronous events and a causal link? Quaternary International 105: 7-12.
Blakemore, R.P. 1982. Magnetotactic bacteria. Annual Review of Microbiology 36: 217–238. Bonnet, S., de Vernal, A., Hillaire-Marcel, C., Radi, T., and Husum, K. 2010. Variability of sea-surface temperature and sea-ice cover in the Fram Strait over the last two millennia. Marine Micropaleontology 74: 59–74.
Bodri, L. and Cermak, V. 1999. Climate change of the last millennium inferred from borehole temperatures: Regional patterns of climatic changes in the Czech Republic—Part III. Global and Planetary Change 21: 225-235.
Brooks, S.J. and Birks, H.J.B. 2001. Chironomid-inferred air temperatures from Lateglacial and Holocene sites in north-west Europe: progress and problems. Quaternary Science Reviews 20: 1723-1741.
Denton, G.H. and Karlen, W. 1973. Holocene climatic variations—their pattern and possible cause. Quaternary Research 3: 155–205.
Eronen, M., Hyvarinen, H. and Zetterberg, P. 1999. Holocene humidity changes in northern Finnish Lapland inferred from lake sediments and submerged Scots pines dated by tree-rings. The Holocene 9: 569-580.
Esper, J., Cook, E.R., and Schweingruber, F.H. 2002. Low-frequency signals in long tree-ring chronologies for reconstructing past temperature variability. Science 295: 2250–2253.
Esper, J., Frank, D.C., Timonen, M., Zorita, E., Wilson, R.J.S., Luterbacher, J., Holzkamper S., Fischer, N., Wagner, S., Nievergelt, D., Verstege, A. and Buntgen, U. 2012. Orbital forcing of tree-ring data. Nature Climate Change: DOI 10.1038/NCLIMATE1589.
Filippi, M.L., Lambert, P., Hunziker, J., Kubler, B. and Bernasconi, S. 1999. Climatic and anthropogenic influence on the stable isotope record from bulk carbonates and ostracodes in Lake Neuchatel, Switzerland, during the last two millennia. Journal of Paleolimnology 21: 19-34.
Frisia, S., Borsato, A., Spotl, C., Villa, I.M., and Cucchi, F. 2005. Climate variability in the SE Alps of Italy over the past 17,000 years reconstructed from a stalagmite record. Boreas 34: 445–455. Giraudi, C. 2009. Late Holocene glacial and periglacial evolution in the upper Orco Valley, northwestern Italian Alps. Quaternary Research 71: 1–8.
Frumkin, A., Magaritz, M., Carmi, I. and Zak, I. 1991. The Holocene climatic record of the salt caves of Mount Sedom, Israel. Holocene 1: 191-200.
Gasiorowski, M. and Sienkiewicz, E. 2010. The Little Ice Age recorded in sediments of a small dystrophic mountain lake in southern Poland. Journal of Paleolimnology 43: 475-487.
Giraudi, C. 2009. Late Holocene glacial and periglacial evolution in the upper Orco Valley, northwestern Italian Alps. Quaternary Research 71: 1-8
Grudd, H. 2008. Tornetrask tree-ring width and density AD 500-2004: a test of climatic sensitivity and a new 1500-year reconstruction of north Fennoscandian summers. Climate Dynamics 31: 843–857.
Guiot, J., Nicault, A., Rathgeber, C., Edouard, J.L., Guibal, F., Pichard, G., and Till, C. 2005. Last-Millennium summer-temperature variations in Western Europe based on proxy data. The Holocene 15: 489–500.
Gunnarson, B.E., Linderholm, H.W. and Moberg, A. 2011. Improving a tree-ring reconstruction from west-central Scandinavia: 900 years of warm-season temperatures. Climate Dynamics 36: 97-108.
Haltia-Hovi, E., Nowaczyk, N., Saarinen, T., and Plessen, B. 2010. Magnetic properties and environmental changes recorded in Lake Lehmilampi (Finland) during the Holocene. Journal of Paleolimnology 43: 1–13.
Haltia-Hovi, E., Saarinen, T., and Kukkonen, M. 2007. A 2000-year record of solar forcing on varved lake sediment in eastern Finland. Quaternary Science Reviews 26: 678–689.
Hassan, F.A. 1981. Historical Nile floods and their implications for climatic change. Science 212: 1142-1145.
Helama, S., Merilainen, J. and Tuomenvirta, H. 2009. Multicentennial megadrought in northern Europe coincided with a global El Niño-Southern Oscillation drought pattern during the Medieval Climate Anomaly. Geology 37: 175-178
Issar, A.S. 1990. Water Shall Flow from the Rock. Springer, Heidelberg, Germany.
Issar, A.S. 1998. Climate change and history during the Holocene in the eastern Mediterranean region. In: Issar, A.S. and Brown, N. (Eds.) Water, Environment and Society in Times of Climate Change, Kluwer Academic Publishers, Dordrecht, The Netherlands, pp. 113-128.
Issar, A.S. and Makover-Levin, D. 1996. Climate changes during the Holocene in the Mediterranean region. In: Angelakis, A.A. and Issar, A.S. (Eds.) Diachronic ClimaticImpacts on Water Resources with Emphasis on the Mediterranean Region, NATO ASI Series, Vol. I, 36, Springer, Heidelberg, Germany, pp. 55-75.
Issar, A.S., Tsoar, H. and Levin, D. 1989. Climatic changes in Israel during historical times and their impact on hydrological, pedological and socio-economic systems. In: Leinen, M. and Sarnthein, M. (Eds.), Paleoclimatology and Paleometeorology: Modern and Past Patterns of Global Atmospheric Transport, Kluwer Academic Publishers, Dordrecht, The Netherlands, pp. 535-541.
Issar, A.S., Govrin, Y., Geyh, M.A., Wakshal, E. and Wolf, M. 1991. Climate changes during the Upper Holocene in Israel. Israel Journal of Earth-Science 40: 219-223.
Jansen, E. and Koc, N. 2000. Century to decadal scale records of Norwegian sea surface temperature variations of the past 2 millennia. PAGES Newsletter 8(1): 13-14.
Kaniewski, D., Van Campo, E., Paulissen, E., Weiss, H., Bakker, J., Rossignol, I. and Van Lerberghe, K. 2011. The medieval climate anomaly and the little Ice Age in coastal Syria inferred from pollen-derived palaeoclimatic patterns. Global and Planetary Change 78: 178-187.
Karlen, W. and Kuylenstierna, J. 1996. On solar forcing of Holocene climate: evidence from Scandinavia. The Holocene 6: 359–365.
Kim, B., Kodama, K., and Moeller, R. 2005. Bacterial magnetite produced in water column dominates lake sediment mineral magnetism: Lake Ely, USA. Geophysical Journal International 163: 26–37.
Kullman, L. 1998. Tree-limits and montane forests in the Swedish Scandes: Sensitive biomonitors of climate change and variability. Ambio 27: 312-321.
Larocque-Tobler, I., Grosjean, M., Heiri, O., Trachsel, M., and Kamenik, C. 2010. Thousand years of climate change reconstructed from chironomid subfossils preserved in varved lake Silvaplana, Engadine, Switzerland. Quaternary Science Reviews 29: 1940–1949.
Larocque-Tobler, I., Stewart, M.M., Quinlan, R., Trachsel, M., Kamenik, C. and Grosjean, M. 2012. A last millennium temperature reconstruction using chironomids preserved in sediments of anoxic Seebergsee (Switzerland): consensus at local, regional and Central European scales. Quaternary Science Reviews 41: 49-56.
Luterbacher, J., Dietrich, D., Xoplaki, E., Grosjean, M., and Wanner, H. 2004. European seasonal and annual temperature variability, trends, and extremes since 1500. Science 303: 1499–1503.
Magny, M., Peyron, O., Gauthier, E., Vanniere, B., Millet, L. and Vermot-Desroches, B. 2011. Quantitative estimates of temperature and precipitation changes over the last millennium from pollen and lake-level data at Lake Joux, Swiss Jura Mountains. Quaternary Research 75: 45-54.
McDermott, F., Frisia, S., Huang, Y., Longinelli, A., Spiro, S., Heaton, T.H.E., Hawkesworth, C., Borsato, A., Keppens, E., Fairchild, I., van Borgh, C., Verheyden, S. and Selmo, E. 1999. Holocene climate variability in Europe: evidence from delta18O, textural and extension-rate variations in speleothems. Quaternary Science Reviews 18: 1021-1038.
McDermott, F., Mattey, D.P. and Hawkesworth, C. 2001. Centennial-scale Holocene climate variability revealed by a high-resolution speleothem ð18O record from SW Ireland. Science 294: 1328-1331.
Mikalsen, G., Sejrup, H.P. and Aarseth, I. 2001. Late-Holocene changes in ocean circulation and climate: foraminiferal and isotopic evidence from Sulafjord, western Norway. The Holocene 11: 437-446.
Millet, L., Arnaud, F., Heiri, O., Magny, M., Verneaux, V. and Desmet, M. 2009. Late-Holocene summer temperature reconstruction from chironomid assemblages of Lake Anterne, northern French Alps. The Holocene 19: 317-328.
Moschen, R., Kuhl, N., Peters, S., Vos, H. and Lucke, A. 2011. Temperature variability at Durres Maar, Germany during the Migration Period and at High Medieval Times, inferred from stable carbon isotopes of Sphagnum cellulose. Climate of the Past 7: 1011-1026.
Morellon, M., Valero-Garces, B., Gonzalez-Samperiz, P., Vegas-Vilarrubia, T., Rubio, E., Rieradevall, M., Delgado-Huertas, A., Mata, P., Romero, O., Engstrom, D.R., Lopez-Vicente, M., Navas, A. and Soto, J. 2011. Climate changes and human activities recorded in the sediments of Lake Estanya (NE Spain) during the Medieval Warm Period and Little Ice Age. Journal of Paleolimnology 46: 423-452.
Nesje, A., Dahl, S.O., Matthews, J.A. and Berrisford, M.S. 2001. A ~ 4500-yr record of river floods obtained from a sediment core in Lake Atnsjoen, eastern Norway. Journal of Paleolimnology 25: 329-342.
Niggemann, S., Mangini, A., Richter, D.K. and Wurth, G. 2003. A paleoclimate record of the last 17,600 years in stalagmites from the B7 cave, Sauerland, Germany.Quaternary Science Reviews 22: 555-567.
Paasche, O., Lovlie, R., Dahl, S.O., Bakke, J., and Nesje, E. 2004. Bacterial magnetite in lake sediments: late glacial to Holocene climate and sedimentary changes in northern Norway. Earth and Planetary Science Letters 223: 319–333.
Schilman, B., Bar-Matthews, M., Almogi-Labin, A. and Luz, B. 2001. Global climate instability reflected by Eastern Mediterranean marine records during the late Holocene. Palaeogeography, Palaeoclimatology, Palaeoecology 176: 157-176.
Snowball, I. 1994. Bacterial magnetite and the magnetic properties of sediments in a Swedish lake. Earth and Planetary Science Letters 126: 129–142.
Sorrel, P., Tessier, B., Demory, F., Baltzer, A., Bouaouina, F., Proust, J.-N., Menier, D. and Traini, C. 2010. Sedimentary archives of the French Atlantic coast (inner Bay of Vilaine, south Brittany): Depositional history and late Holocene climatic and environmental signals. Continental Shelf Research 30: 1250-1266.
Stancikaite, M., Sinkunas, P., Risberg, J., Seiriene, V., Blazauskas, N., Jarockis, R., Karlsson, S. and Miller, U. 2009. Human activity and the environment during the Late Iron Age and Middle Ages at the Impiltis archaeological site, NW Lithuania. Quaternary International 203: 74-90.
Velle, G. 1998. A paleoecological study of chironomids (Insecta: Diptera) with special reference to climate. M.Sc. Thesis, University of Bergen.
Russia and central Asia
Chen, F.-H., Chen, J.-H., Holmes, J., Boomer, I., Austin, P., Gates, J.B., Wang, N.-L., Brooks, S.J., and Zhang, J.-W. 2010. Moisture changes over the last millennium in arid central Asia: A review, synthesis and comparison with monsoon region. Quaternary Science Reviews 29: 1055–1068.
Demezhko, D. Yu. and Shchapov, V.A. 2001. 80,000 years ground surface temperature history inferred from the temperature-depth log measured in the superdeep hole SG-4 (the Urals, Russia). Global and Planetary Change 29: 167-178.
Esper, J., Cook, E.R. and Schweingruber, F.H. 2002. Low-frequency signals in long tree-ring chronologies for reconstructing past temperature variability. Science 295: 2250-2253.
Esper, J., Schweingruber, F.H. and Winiger, M. 2002. 1300 years of climatic history for Western Central Asia inferred from tree-rings. The Holocene 12: 267-277.
Esper, J., Frank, D.C., Wilson, R.J.S., Buntgen, U., and Treydte, K. 2007. Uniform growth trends among central Asian low- and high-elevation juniper tree sites. Trees—Structure and Function 21: 141–150.
Hiller, A., Boettger, T. and Kremenetski, C. 2001. Medieval climatic warming recorded by radiocarbon dated alpine tree-line shift on
Thank you.
This list looks like another re-peddling of what are well known to be blatantly flagrant “skeptical” misrepresentations. Below is one of the more particularly egregious examples from this list, of several that could be cited:
Monckton (and other “skeptics” as well) falsely claim that the following paper supports their notion that the medieval warming period was “warmer than today”:
Moberg, A., Sonechkin, D.M., Holmgren, K., Datsenko, N.M., and Karlen, W. 2005. Highly variable Northern Hemisphere temperatures reconstructed from low- and high-resolution proxy data.
But here is what is contained in the paper itself, quoted word for word:
“We find no evidence for any earlier periods in the last two millennia with warmer conditions than the post-1990 period”
How much more obviously wrong can it be to include this study on this list? And there are more examples like this one.
bdgwx has also reviewed this list and found the same kinds of explicit discrepancies and flagrant misrepresentations.
And “skeptics” like Monckton still won’t understand why they cannot be taken seriously.
Dodgy reconstructions are problematic. Conclusions from low resolution proxy data are dubious.
Odd, that many of the dodgy ones low resolution reconstructions are performed by alarmists who then press release their fantastic conclusions.
“Find no evidence” means exactly that!
Not that they proved anything, just that they didn’t find evidence.
Try looking at the actual evidence in the paper, and not the mere microchip masturbation.
Try listening to the folks who know and understand best the “actual evidence”: the researchers who did the work to compile it. They have stated directly:
“We find no evidence for any earlier periods in the last two millennia with warmer conditions than the post-1990 period”
To pretend that the Moberg et al 2005 research somehow belongs on a list of studies which “demonstrate that the Middle Ages were warmer than today” is so clearly nothing but an egregiously disingenuous misrepresentation. The statement by the research authors themselves makes this more than abundantly clear.
And sadly, there are many, many more egregiously ridiculous misrepresentations similar to this one that can be found on that list. bdgwx identified several in just the “general reconstructions” group alone.
Here’s another utterly preposterous example, grabbed from the North America grouping of that list:
Hayhoe, K., Cayan, D., Field, C.B., Frumhoff, P.C. et al. 2004. Emissions, pathways, climate change, and impacts on California. Proceedings of the National Academy of Sciences USA 101: 12,422-12,427.
This study is about projections of future climate changes in California during the coming century It does not discuss climate history back in the medieval warming period at all. Who in their right mind could ever imagine that this study belongs on that list?
Yep, here’s reality: all kinds of studies appear on that list that have no business whatever being there; they not only do not support the false MWP claims of so-called “skeptics”, but many of them in fact support the opposite conclusion.
In other words: that “400 papers” list is bogus.
And so-called “skeptics” like Monckton still won’t understand why they cannot be taken seriously.
What is bogus is your non rebuttal rebuttal.
“400 papers” list is bogus.”
You are making a fool of yourself making dumb assertions that you can’t back up.
You are not fooling anyone here with your adherence to warmist/alarmist ideology.
tommy, how could you possibly miss that backing evidence has been presented? By both myself and bdgwx.
I’m not the one “making a fool” of themselves here.
BWAHAHAHAHAHAHAHA!!!
I doubt you have read a single published paper and certainly no counterpoints on them either.
You have emptied the dodge barrel long ago which is why your replies are empty and useless.
Try harder next time.
Thanks LMoB!
It’s extraordinary and chilling to note how little effect published papers have in the face of political dogma.
I had said that the data were from each region of the globe.
Thank you. I’ll take a look at those in the global reconstruction list of your post when I get time.
I spent a considerable amount of time today reviewing your list of “General temperature reconstructions“. Only 2/11 are global. Both of the global reconstructions say it is warmer today than at any point in their reconstructions. An additional 2/11 are for the NH only. The M&M 2005 publication does not include the MWP as originally defined by Lamb 1965. The Wanner et al. 2008 publication says it is significantly warmer today. Some of the others do not include the modern warming era. And some of the others aren’t even temperature reconstructions at all. I have to be honest. I feel like you put me on a wild goose chase here. I spent hours reading these papers; every single one. Anyway, here is what I learned.
Bard 2002 – This is not global temperature reconstruction. It is regional. It also does not evaluate the last 70 years of warming.
Bell & Menzel 1972 – This is not a global temperature reconstruction. It is not even a temperature reconstruction at all.
Burger 2010 – This is not a global temperature reconstruction. It is not even a temperature reconstruction at all. It compares 10 NH reconstructions and only through about 1850.
Cook 1990 – This is not a global temperature reconstruction. It is not even a temperature reconstruction at all. It is book regarding methods and procedures in the realm of dendrochronology.
Dergachev & Raspopov 2010ab – This does appear to be global temperature reconstruction. They provide a few previously published reconstructions, but theirs is based on borehole data which only includes the years 1500-2000 and which shows the later part decisively warmer than the early part (figure 5).
Esper & Frank 2009 – This is not a global temperature reconstruction. It provides commentary on the debate regarding the heterogenous vs homogenous nature of global temperatures in the context of the IPCC AR4’s assessment that the transition over the last 1000 years is characterized best as more heterogenous in the past and more homogenous in the present.
Fritts 1976 – This is not a global temperature reconstruction. All reconstructions are focused on North America only.
Loehle 2008 – This is a global temperature reconstruction. However, it is limited to only 18 timeseries most of which are in the NH. I do appreciate how Loehle corrects the 50 year shift error from his 2007 publication. Notice that when you add the last 70 years of warming to the reconstruction (figure 2) it is clear that it is warmer today than during the peak circa 900 AD.
McIntyre & McKitrick 2005 – This is the well known M&M publication in response to MBH98/99. It is not a global temperature reconstruction. It is limited to the NH only. It also does not conclude that the MWP was warmer than today anyway. In fact, it does not even include the MWP as originally defined by Lamb 1965.
Soon & Baliunas 2003 – This is not a global temperature reconstruction. In fact, the authors say “As indicators, the proxies duly represent local climate. Because each is of a different nature, the results from the proxy indicators cannot be combined into a hemispheric or global quantitative composite.”
Wanner et al. 2008 – This is not a global temperature reconstruction. It is for the NH only. Furthermore it shows the temperature around 2000 being significantly warmer than the peak around 1050 AD.
The real question—why do you discount and ignore all the reams of regional data that disagree with your warmunist religion?
Why do you think regional temperatures are not worth considering over global. Regional temperature all add up to global. From what I have found is that for the regions with no or very littlewarming it is nigh unto impossible to find regions that have large warming to make the Global Average Temperature (GAT) averages come out.
One big reason is that Northern Hemisphere summer (winter) is averaged with Southern Hemisphere winter (summer). My guess is that this causes spurious trends that are not seen when you break it up into regional data.
Another problem is that the data is done on an calendar year and not seasonal year when looking at 12 month periods.
Lastly, why are Tmax and Tmin not done separately? It would seem that treating them the same with average insolation, average clouds, average everything is not an appropriate method to follow in attempting to know in detail how the climate works.
They are all about bad science and propaganda where their conclusion is decided for them.
“Regional temperature all add up to global.“
Yes, if they were at the same times, and at the adequate intensities. But if that were true, then there would be at least a few papers aggregating them. You all are having inconvenient problems coming up with them.
FYI, this is the royal “your” claim. And, per normal rules of discourse, it’s up to you to doc it. With a paper that does so, without the “add up the here and there, varying intensity regionals”.
Waiting…..
Exactly. Regional temperature reconstructions are not only important, but necessary for global reconstructions. It’s not that hard to take that 400 regional reconstruction list and aggregate it a global reconstruction. We know its not hard because multiple groups have done exactly that.
bbb ->
No the problem is knowing what data is accumulated and how it is summarized. Here is a study for the U.S. They probably didn’t intend to provide information injurious to CAGW folks but they did.
U.S. Agro-Climate in 20th Century: Growing Degree Days, First and Last Frost, Growing Season Length, and Impacts on Crop Yields | Scientific Reports (nature.com)
FFF is First Fall Frost, LSF is Last Last Spring Frost, and CGS is Climatological Growing Season
Now FFF and LSF don’t usually occur during the daytime, they occur at night. So, what conclusion do you draw about nighttime temperatures? Can you draw any conclusion about nighttime temperatures from a Global Average Temperature? Do you think other areas of the globe may be experiencing the same thing since crop yields are increasing almost everywhere?
When averaging summer in NH and winter in SH (or vice versa) can you make a conclusion about which is warming more or are they the same? How do you break up the GAT to make that conclusion? Summarizing data hides information. Much of that information is vitally important in making correct conclusions.
Wouldn’t you like to know whether summers in both NH and SH are warming? Or springs or fall or winters? Exactly what is driving the GAT to show annual growth in temps? Can you tell by trending the GAT?
The claim was about the MWP being globally warmer then modern. Your overlong deflection only tells us that you are either unemployed or incarcerated in a Club Fed with wifi.
As bdgwx says, these regional “findings” could have been easily aggregated to make the case. And I’ll add that that paper would have been cited in record numbers. The fact that that hasn’t happened is an important piece of missing evidence for that claim.
And you know what they say about claims made without evidence…
Who are “they”, blob?
“ And I’ll add that that paper would have been cited in record numbers.”
By who? The climate scientists? It’s really only been of interest in the ag world since it doesn’t comport with the scare tactics of the CAGW advocates who say the Earth is going to become a cinder!
Read back. “The paper” I reference is this unicorn doc that properly evaluates regional reconstructions and supports the claim that the MWP was globally warmer than modern.
Would you please provide it?
A tacit admission that such a paper does not exist. Why not? Not a rhetorical question.
You are like many, many academics, the value of a study is not what it says, but how many times it is cited. That is not a valid argument against the studies conclusions.
How many climate scientists do you think study agricultural studies to find information? I suspect none. Besides how many would then take the risk of poking their head out of the trenches to make the point that “Hey, maybe we have been wrong!”? Good way to get shot in the head, figuratively speaking, and lose your job.
Basically, your dismissal of the paper and its findings not worth the time to read because you don’t have a cogent argument to produce.
I assure you that farmers do read this information and make business decisions based on it.
Hmmm…..
How about this graph? It shows min temps in the CONUS going up far faster than max temps. Max temps are not nearly as high as they were in the 30’s. But min temps are even larger!
If the Earth didn’t turn into a cinder in the 30’s then why is it turning into a cinder today when max temps are cooler?
This is just one regional study of temps. There are plenty of others.
Oh, btw, this is by the EPA.
Another knee jerk deflection.
You seem to miss the point that, if there was a decent aggregation of global MWP temps that decidedly showed them to be higher than those in the trans AGW era, it would be praised to the skies. The authors would be ferried from one 5 star venue to another to “present” this paper in a Saudi Gaudy A380. They would not only be “consulted” at record $ rates, but would be concussed with gold bars. They would be smothered with those 72 vestal virgins, pre mortem.
I.e., it would be a BFD…
Wonder why it is still nonextant….
Admirable work ethic. But you had great 7/4 celebrations in St. Charles, Florissant, St. Louis, all day. Admittedly hot and humid, but I would have done your very good work tomorrow.
We are summering at Pismo Beach. We listened to traditional patriotic music in the AM and watched the best fireworks show over the Pacific ocean anywhere, last hour. Priorities….
Thanks. We decided to take it easy on the 4th. And we usually watch the fireworks from our house in St. Charles. It’s basically a 360 fireworks show.
As I said, the list conprised chiefly regional studies.
I repeat, I did not say that the list contained global temperature reconstructions. I said it contained evidence from all parts of the globe. Any fool can do a “reconstruction” such as that of the lamentable Mann and come up with any desired result that is profitable. I prefer the real-world evidence, from hundreds of papers, from many different methods of gauging temperature compared with the present.
It’s not impossible to take real-world evidence from all parts of the globe and reconstruct a global average temperature so that we can test the hypothesis that the Lamb 1965 MWP was globally synchronous and warmer than today. Many have done it.
And don’t hear what I’m not saying. I’m not saying regional reconstructions aren’t useful. On the contrary they are extremely useful and, in fact, necessary to form global reconstructions. What I’m saying is that regional reconstructions by themselves tell us nothing about the global average temperature in the past and cannot be used to test hypothesis regarding the global average temperature.
If you want to convince curmudgeonly skeptics like me that the Lamb 1965 MWP might have been global synchronous and warmer than today then at the very least you must present a global average temperature reconstruction comparing the past with the present showing exactly that. We’ll then evaluate it along side all of the other reconstructions and form a position around the consilience of evidence.
The GAT is a meaningless number.
Does that make the pause meaningless?
Oh look, bellcurveman tries (again) to get me to play his silly little games.
Fail.
I’ll take that as a yes.
blob gave you an upvote—success is achieved!
Don’t worry, I’ll give you one if it makes you feel more important.
HAHAHA
And you say that I am lame—more projection!
“I’m not lame, you are” he said, lamely.
“Go away kid, yah bother me” — Fields.
What LMoB has cited is only a small fraction of all the papers that show global extent of MWP. More are archived on the CO2 Science site.
Here’s a thought to get your head around. One particular study might be dismissed as being local not global. But put enough of them together, from all continents INCLUDING Antarctica – and the overall conclusion is that the MWP really was global.
Ocean temperatures were also higher in the MWP. Oceans aren’t local.
Phil Salmon said: “What LMoB has cited is only a small fraction of all the papers that show global extent of MWP. More are archived on the CO2 Science site.”
CMoB posted a grand total of 1 study that can be used to assess whether the Lamb 1965 MWP was globally synchronous. That study is Loehle 2008. The Loehle 2008 study using only 18 timeseries (most of them in the NH) found that the MWP was globally synchronous, but that it was cooler than it is today.
If you have another global average temperature reconstruction you want me to look at then post it.
Phil Salmon said: “Here’s a thought to get your head around. One particular study might be dismissed as being local not global. But put enough of them together, from all continents INCLUDING Antarctica – and the overall conclusion is that the MWP really was global.”
That’s exactly what I’m asking for. Put all of those local/regional reconstructions together and aggregate them into a global reconstruction. Many groups have done just that so we know it is possible. I have several of them downloaded already. If there really are so many studies showing that the MWP was globally synchronous and warmer than it is today then it should be really easy to post a few them.
Why do you ignore the dozens of regional ones?
Co2 Science, the MWP project.
Hundreds of papers from all continents:
http://www.co2science.org/data/mwp/mwpp.php
Phil Salmon said: “Hundreds of papers from all continents:”
I’m assuming one of them includes the aggregation of all the others into a global reconstruction? Can you post a link to it?
Why are you obsessed with a global temperature that probably exists nowhere. All it’s good for is scientists and politicians to complain the the GBR is bleaching, polar bears are dying, snow isn’t falling on Mt. Kilamonjara, islands and coastlines are disappearing BECAUSE THE GLOBE IS WARMING! Noone need look what their location is specifically doing since the globe is warming everywhere.
Scientists and politicians should be looking at local and regional temperatures. I assure you that HVAC engineers are doing that. If global warming is truly occurring it will show up in the local and regional temperatures.
The GCM models should be designed to deal with accurate local and regional predictions first and global secondly.
You want to be more impactful in the climate debate, start concentrating on local and regional temperature changes.
re: “You want to be more impactful in the climate debate, start concentrating on local and regional temperature changes”
J Gorman once again demonstrates a woeful lack of knowledge. The climate models have already made lots and lots of correct local and regional projections.
They said the Arctic would warm faster than the rest of the globe. It has.
They said the U.S. Southwest would become drier. It has.
They said the Eastern U.S. would become wetter and experience more extreme precipitation events. It has.
They said sea level would rise along the U.S. east coast faster than the global averages. It has.
Meanwhile, what value have so-called “skeptics” brought to the climate science table? Pretty much nothing. Essentially zero correct predictions. Just a slew of wildly incorrect predictions, and lots and lots of adolescent anti-science ankle biting nay-saying. That’s about it.
And yet they still wonder why they aren’t taken seriously!
MCP the watermelon serial prevaricator strikes again.
Meanwhile you ignored numerous prediction failures such no Summer Ice in the Arctic, that Polar Bear population would plummet with the drastic reduction of summer ice among the few and it didn’t happen, and the summer decline has stopped years ago.
Skepticism main role is to point out the weakness or failures of research claims which you should have already known.
Droughts is actually a common feature of the desert southwest which lasted for centuries in the past.
tommy, as an editor, I would imagine that you should have more responsibility to make sure that what you say is actually correct.
You’ve unfortunately parroted some known to be incorrect “skeptical” talking point distortions. Like this:
“prediction failures such as no Summer Ice in the Arctic”
Here’s reality: “no Summer Ice in the Arctic” was never actually “predicted” to have occurred by now by any climate projection.
There was a single study that indicated there was a possibility that this could happen soon (and it very nearly did in 2012), but the mean projections were, and have always been, that “no summer arctic ice” is still likely a couple of decades away.
Let’s be accurate, please.
“Here’s reality: “no Summer Ice in the Arctic” was never actually “predicted” to have occurred by now by any climate projection.”
There wasn’t a single CAGW advocate in the climate scientist clique that stood up in the MSM and said Gore was wrong in his prediction!
There are all kinds of studies out, using climate models, predicting food shortages caused by higher maximum temps. All belied by the continued global grain harvests over the past 20 years.
The fact is that the global average temperature is going up because minimum temps are going up, not because max temps are. This minimum temps will have to get a LOT larger before we lose the Arctic ice cap! And those rising minimums are fueling longer growing seasons, more food, and fewer human deaths from climate causes.
Why aren’t the CAGW out trumpeting those actual results? Instead they just keep on with the “THE END OF THE WORLD” meme!
re: “Skepticism’s main role is to point out the weakness or failures of research claims”
Yes, this should be the role of valid skepticism. Unfortunately, though, I see this as rarely if ever practiced by far too many who like to call themselves climate “skeptics”.
Instead, they typically trot out some false distortion of the scientific research and then pretend they are making some kind of “legitimate” objection.
Like, for example, peddling that distorted story about “no Summer Ice in the Arctic prediction failures”. Or that silly “they forgot the sun was shining” nonsense that Monckton is peddling in this very article.
And they continue to peddle their distorted stories for years or even decades, long, long after their distortions have been proven false. Like, for example, still pretending after almost a quarter century now that the “hockey stick” climate history research results are “fraudulent”.
Did the models predict the 13% greening of the earth? Did they predict the continuing growth of global grain harvests which continue to set records every year? Did they predict the number of fewer deaths from cold around the globe?
Freeman Dyson said he didn’t believe in the climate models because they are not holistic and do not fully describe the climate which is the entire temperature profile at a location and not just the mid-range temperature value.
Phil,
That CO2 “Science” website about the MWP is, unfortunately, an egregiously dishonest compendium of ridiculously false claims about climate history studies.
There are numerous instances of CO2 “Science” claiming that the results of such and such a paper supposedly demonstrate that the MWP was “warmer” than today, but then when you go and actually read the paper, it not only says no such thing, but even says the exact opposite. Many of the papers on Monckton’s demonstrated-to-be-bogus “list” are also found at CO2 “Science”.
And far too many so-called “skeptical” folks like Phil unfortunately fell for all of this false, disingenuous, anti-science propaganda hook, line, and sinker.
Maybe stick with real science for a change.
Please just quit with the irony, hypocrite.
This is a pathetic reply you made since you didn’t counter anything of the CO2 Science website claims.
Maybe stick with posting real evidence?
tommy, you should adhere to that old trial lawyer’s dictum:
“Don’t ask any question for which you don’t already know the answer. You may end up getting an answer you don’t like.”
… which is going to be the case for you right now, LOL.
Here are just four of many examples of false CO2 “Science” claims that could be cited:
One:
Highly variable Northern Hemisphere temperatures reconstructed from low- and high-resolution proxy data Moberg et al 2005
What co2science claims this study says:
“the Medieval Warm Period peaks just prior to AD 900 and is strongly expressed between about AD 650 and 1250. Peak temperatures during this time period are about 0.22°C higher than those at the end of the Moberg et al. record.”
What the study itself actually says:
“We find no evidence for any earlier periods in the last two millennia with warmer conditions than the post-1990 period”
Two:
Annual temperatures during the last 2485 years in the mid-eastern Tibetan Plateau inferred from tree rings Yu et al 2009
What co2science claims this study says:
“the Medieval Warm Period at this location was warmer than the Current Warm Period by about 0.2°C.”
What the study itself actually says:
“Our data suggests that the late twentieth century (1970-2000 AD) was the warmest during the last 1000 years.”
Three:
Cronin, T.M., Dwyer, G.S., Kamiya, T., Schwede, S. and Willard, D.A. 2003. Medieval Warm Period, Little Ice Age and 20th century temperature variability from Chesapeake Bay. Global and Planetary Change 36: 17-29.
What co2science claims this study says:
“Statistical analyses revealed mean 20th-century temperatures were 0.15°C cooler than mean temperatures during the first stage of the Medieval Warm Period”
What the study itself actually says:
“late 19th and 20th century temperature extremes in Chesapeake Bay … exceeded those of the prior 2000 years, including the interval 450-1000 AD, by 2-3C”
Four:
Ljungqvist, F.C. 2010. A new reconstruction of temperature variability in the extra-tropical Northern Hemisphere during the last two millennia. Geografiska Annaler Series A 92: 339-351.
What co2science claims this study says:
“it was just as warm as, or even warmer than, it has been recently during both the Roman and Medieval Warm Periods.”
What the study itself actually says:
“The temperature of the last two decades (1990s 2000s), however, is possibly higher than during any previous time in the past two millennia”.
And its gotten even warmer since then.
Bottom line: CO2 “Science” is as dishonest as the day is long.
Are you joking! Never happen.
And the Moncktonian pretending continues! This time it’s the fairy tale fable that the “conclusion” of congressional inquiry was that the hockey stick result was “made-up”. And let’s just disregard the fact that, since those inquiries, the most comprehensive climate history studies ever conducted have only further corroborated those results.
And we’re then treated again to the entirely unsupported claim of “400 papers” that supposedly show things that the most comprehensive global studies do not find.
And we still have the empty and equally unsupported claim that some undisclosed “elementary error of physics” supposedly exists in climate sensitivity studies. No evidence presented of any such “error” … except if one imagines that “because I say so” constitutes “evidence”.
Why is it that climate Communists can’t use a little common sense? The conclusion of the congressional enquiry was indeed to the effect that the hokey-stick result had no legitimate justification, and that it was fabricated.
Why is it that climate Communists will selectively cite only those studies that they imagine support the Party Line, without citing those that do not? And why do They assume that there are few, or no studies, that oppose the Party Line?
Why is it that climate Communists, when given a list of as many of the 400 papers demonstrating the reality of the mediaeval warm period as can be inserted in a single comment, maintain that the existence of the 400 papers is “entirely unsupported”?
Why is it that climate Communists write of an “unsupported claim” of an elementary error of physics that is “undisclosed”, when it is disclosed and supported in the head posting?
Get your kindergarten mistress to read the head posting to you. Then, at least, you will be better informed, though probably not wiser.
For the same reasons Liz Chaney and the rest of Nasty Pelosi’s witch hunt committee take comments out-of-contest and drop key words in their desperate attempt to smear DJ Trump as an “insurrectionist”.
Trump is an insurrectionist, and deserves to be in jail for the rest of his life.
Nope!
Proven repeatedly, as their kangaroo court selectively edit video, evidence and testimony.
All three are dead on arrival “fruit of the vine” killer topics before a higher court.
Cheney’s kangaroo court’s claims are so egregious that Cheney can’t buy an audience outside of browbeaten democrat legislators.
Your clown show is not entertaining.
re: “The conclusion of the congressional enquiry was indeed to the effect that the hokey-stick result had no legitimate justification, and that it was fabricated.”
And the Moncktonian pretending continues.
re: “elementary error of physics”
ECS is correctly derived via the known radiating forcing values of the various greenhouse gases, not via a laughably simplistic and spectacularly wrongheaded temperature proportions method.
As the old saying goes, that “analysis” is so bad that it is “not even wrong”.
re: “400 papers”
An egregious misrepresentation. See rebuttal of this tired old false claim where the list was posted.
Why are you such a bald-faced liar?
Yeah he is lying hard since The Wegman, and North reports shows the problems with the NORTHERN Hemisphere “Hockey stick” paper are sufficient enough to discredit the nonsense.
I am not the one “lying” here, tommy.
North Report 2006, direct quote:
“Based on the analyses presented in the original papers by Mann et al. and newer supporting evidence, the committee finds it plausible that the Northern Hemisphere was warmer during the last few decades of the 20th century than during any comparable period over the preceding millennium.”
This direct quote from the committee’s report clearly demonstrates that the claim
“the North Report shows … problems with the NORTHERN Hemisphere “Hockey stick” paper are sufficient enough to discredit the nonsense”
is simply not correct.
Not to mention that numerous research studies conducted since the 2006 North Report, (Marcot, Ljungqvist, Hegerl, Moberg, Pages 2k, Kopp, etc.) using a wide variety of techniques, have only further corroborated the original “hockey stick” findings.
BWAHAHAHAHAHAHAHAH!
MCP is a stand-in for Mann…
The IRONY runs deep in you…..
The Holocene Climate Optimum from 5000 to 9000 years ago was most likely warmer than the past decade. Climate proxies are never definitive, which is why I wrote “most likely”.
Averaging many local climate reconstructions made using proxies tends to create a smoother curve, that may not be accurate,
Farnsworth et al 2020 find the Svalbard marine environment was 7 degrees warmer in the Holocene optimum than currently. And that’s just one of many.
https://www.sciencedirect.com/science/article/pii/S0012825220302956
It could be either refuted, or not really refuted all.
“more or less definitively” is the degree of confidence we have become used to in descriptions of all climate conjectures.
Thousands of papers, from all over the world have shown that the MWP was world wide, but that acolytes will never accept any data that refutes their religion.
Yet another “Nuh Uh because I say so” type of response from MarkW, making claims that have been thoroughly debunked numerous times. Here’s just one of many refutations:
https://insideclimatenews.org/news/04122015/medieval
From your link:
“Young and colleagues measured the extent of glaciers, a proxy for temperature, over the last 1,000 years in Western Greenland and further west on Baffin Island. They found that glacial coverage from 950 to 1250, the years of the purported Medieval Warm Period, was only slightly less than during a subsequent cold period known as the Little Ice Age.
“These glaciers were almost just as big during the Medieval Warm Period as they were during the Little Ice Age in the Baffin Bay and Labrador Sea region,” Young said. “It probably wasn’t all that warm during the Medieval Warm Period.””
Thanks for confirming it was actually warmer there during the MWP.
How much is “slightly less”?
As always with Climatista propaganda, there are no actual numbers, merely vague assertions.
Graemethecat
Your comment would be truly hysterical were it not so tragically inept.
re: “Thanks for confirming it was actually warmer there during the MWP” ??
You can’t be serious. These results confirm exactly the opposite. What part of “wasn’t all that warm during the Medieval Warm Period” were you unable to comprehend?
And so-called “skeptics” like Graemethecat still wonder why they are not taken seriously. Unbelievable.
They found that glacial coverage from 950 to 1250, the years of the purported Medieval Warm Period, was only slightly less than during a subsequent cold period known as the Little Ice Age.
Do you agree that glacial extent was lower from 950 to 1250 than during the LIA?
List them.
Thanks LMoB and others for your comments.
There are two opposite approaches to palaeo climate reconstruction at play in the current climate debate. The approach by alarmist scientists is the “stir fry” approach. There are many proxies of ecological history, from sediment or calcified fossil isotope records to chemical traces like alkenones and sedimented leaf wax, to biologiyproxies such as abundances of midges, pollen etc. The stir fry approach seems a simple and compelling one – just add in all proxies. The more the merrier. Temperature reconstruction is the averaged result of them all. The problem (or depending on your person, the advantage) with proxy stir fry is that proxies are incredibly varied in their reconstructed amplify with time. There is little agreement between many of them with peaks and troughs all over the place, often anti correlated. This has a simple implication – average them all together and you will ALWAYS get a straight line – with error bars. The further back in time you go, the straighter the averaged line will be. The stir fry approach is the one taken in currently accepted benchmark (multi) proxy reconstructions, such as those of Shakun, Marcott and the PAGES 2K project. Their goal is not to discover anything about past climate but the opposite – hide any real information and blur everything together into a straight line.
https://www.researchgate.net/profile/Matthew-Wooller/publication/291384457_Holocene_climate_changes_in_eastern_Beringia_NW_North_America_-_A_systematic_review_of_multi-proxy_evidence/links/5be8cc684585150b2bb040c4/Holocene-climate-changes-in-eastern-Beringia-NW-North-America-A-systematic-review-of-multi-proxy-evidence.pdf
The alternative approach is the one proposed by Steve MacIntyre at his Climate Audit site. In contrast to the Shakun stir fry, MacIntyre is extremely selective as to which proxies are good enough to bear witness on past climate. Many selection criteria have to be met. In practice the biological “proxies” are rejected as pertaining to temperature and the focus is on isotope dated cores of polar ice or ocean sediment. Here at least agreement and consistency are found. With these isotope proxies one is actually seeing something informative and coherent about past climates.
https://climateaudit.org/
So when you see these climate reconstructions (going back from the present) starting with smooth insulation then trailing off further in the past to a blurry straight line, you are seeing the stir fry proxy method at play. The graph will always have the same shape. And it will always be equally false and artificial.
smooth
insulationundulationPhil,
These claims you post are, no surprise, simply false. The reconstructions conducted by Pages 2k and others include strict selection criteria. Moreover, those studies do not show a “blurry line becoming ever straighter further back in time”. The Marcot study in particular shows nothing of the kind.
I saw all the proxies set out in the original Shakun paper. A wildly diverse menagerie, some bio proxies were so weak that they scarcely showed any difference between the last glacial maximum and the Holocene optimum. They were all thrown in.
There is no ECS. That’s a period at the end so as LM says “full stop”.
Dry air does not increase in temperature due to IR. Attached is a table from a thermodynamics text show the energy input required for various gases at various temperatures. According to what LM wrote there should be additional columns showing with and without IR. He points out there could be a 4 K lower temperature if IR is not involved in dry air.
The idea of CO2 causing an increase in temperature by a forcing is further wrong because as you add CO2 you change the Cp value and increase the mass. I have never seen any account for both of those.
“The idea of CO2 causing an increase in temperature by a forcing is further wrong:
The idea of CO2 inhibiting Earth’s ability to cool itself is right.
Thankyou for an entertaining post, I really enjoyed reading it as all of your columns.
I have been reading through the years that your teams paper is either been improperly rejected by journals or in the most recent one, not being reviewed at all. This has generated a pattern of not wanting to publish it not because it wrong, but because it’s right. I think this is very unacceptable and as you say fraudulent behaviour of trying to maintain the climate scare.
This finally brings me to my question, you mentioned some months ago that you were in contact with a senior police officer about the journals fraudulent handling of you teams paper, I am wondering if you can provide us with an update how this is all going?
We must keep on fighting until the truth emerges!!!
Many thanks
TheSunDoesShine
In response to TheSunDoesShine, I remain in regular contact with the senior police contact, and we are putting the pieces together. It will take some time, partly because I am not as fit as I was and partly because it is difficult to assemble evidence in such a way that the police – who are always most reluctant to examine evidence of fraud, particularly on this monstrous scale – are going to take a lot of persuading. So we have to get everything right first time.
I’m surprised you get invited by universities to lecture about your hobby (jurisprudence), why not journalism since that’s a subject you actually have a diploma in? Your history knowledge is a bit wanting too, Picts never occupied Kent and certainly not 10,000 years ago, still too cold for walking around naked! Your usual insulting tone referring to the minority on the Supreme Court as ‘witches’ (two of them women), but at least they have an education in jurisprudence. As for Scottish vineyards in Roman times I’m afraid your memory is faulty, the furthest north ones were in Northamptonshire and Lincolnshire, nowadays they’re as far north as Yorkshire (there’s even one near Leeds where you were once a cub reporter).
Ah, the petulance and spite of the climate Communist! I am invited to lecture about many things, so there is no point in being childishly jealous about it. Nor did I say that Picts occupied Kent, nor that we walked naked at that time. And it is regrettable that “Phil.”, who is not widely read, has not read Macbeth, or he would have realized the reference to the “three witches” – a literary reference, not an insult.
Ah, the ignorance of the climate Communist, in assuming that I have had no education in jurisprudence. And there were indeed vineyards in the Great Glen (which, like it or not, is in Scotland) in Roman times. The fact that a climate Communist has not read about it does not mean that it is not so.
Don’t be childish. Rufmord, or personal reputational assault, is a technique that marks out those who perpetrate it as either Fascists or Communists or, these days, as the unholy melange of the two that is Russian and Chinese Communism, and that is widely prevalent among the climate Communists.
What the Sun “says”.
SST Outlook: NCEP CFS.v2 Forecast (PDF corrected) Issued: 27 June 2022
North Atlantic surface temperature.
Ice in the Beaufort Sea and Canadian Archipelago.

Why is the solar wind still weak? We see the last speed jumps in 2019.
UV radiation decreases again after a large increase.
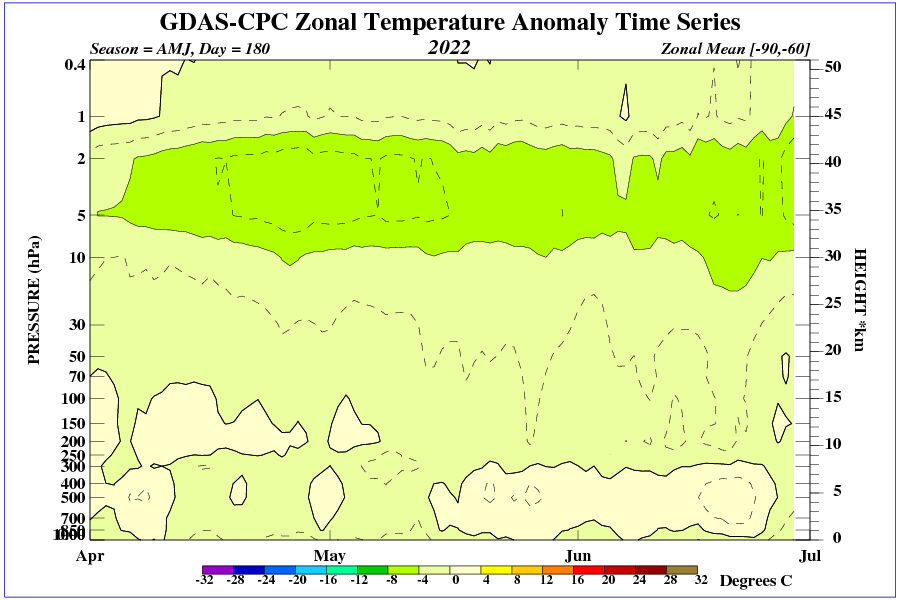
Temperature drop in the upper stratosphere above 60S.
wow! talk about Cherry Picking!
You need to:
(a) graph Global Mean Temperature, not GM _Change_
all this graph shows is that in the past 7 years (!!) the Global mean temps are not accelerating.
(b) 7 years, really? why not show the past 30 years, as is the standard reference period or _recent_ changes? Lots of data available for that.
at this point this isn’t even clever misdirection. its just flat out deception
Another watermelon trots out the “cherry picking” canard/talking point.
The anonymous climate Communist “chris” says we should graph global mean temperature, not global mean temperature anomalies. In that case, his complaint is not with us but with the Party Line he so unthinkingly espouses, so that the West, having foolishly closed down its coal-fired power stations at the behest of climate Communists such as himself, is forced to pay for Putin’s special military massacre of women and children in Ukraine. IPeCaC and other soi-disant “authorities” use global mean temperature anomalies because that way they can make the warming seem far bigger and more serious than it is. If one were to graph absolute temperatures instead, the graph would be a near-horizontal line.
And if “chris” will get his kindergarten mistress to review the elementary characteristics of fractions with him, he will discover that 7 years 10 months is far closer to 8 years than to the “7 years, really?” that he mentions.
And it is not appropriate to take 30 years as the reference period for global temperatures, because the most influential of the oceanic temperature cycles, the Pacific Decadal Oscillation, has a cycle more like 60 years.
What these monthly columns show, in a simple fashion, is that these long periods of no warming are inconsistent with the predictions of warming large enough and rapid enough to be dangerous. When from time to time this column publishes the full datasets, we show that the predicted warming of about 4 K per century, or 4 K per doubling of CO2, that the climate Communists predicted is simply not occurring; and our discovery of climatology’s elementary error of physics demonstrates why it is not occurring, and why the models are so wrong.
Short term trends can become long term trends. Linear regression is the worst kind of forecasting there is. It gives the past equal weight with the present. The past is not always a good predictor of either the present or the future. That’s why you *must* watch for slope changes as they occur. An eight year slope change is certainty significant. Whether it continues or not, who knows for sure? But it is a sure bet that if you ignore it and it turns out to be a predictor of the future then bad things will happen because you missed it! Wasted spending by government being one of the worst!
“An eight year slope change is certainty significant.”
Could you say what the confidence interval for those eight years is?
Given that on another page you are claiming the uncertainty for each monthly value is at least ±1.4°C, and that any line that fits within that range is possible, I would assume you think the rate of change could be anywhere from ±3.5°C / decade. If that’s the case how on earth can you claim it is significantly different from the previous trend of 0.11°C / decade.
Confidence intervals don’t really have much to do with uncertainty associated with measurements of different things. I don’t know why you are hung up on confidence intervals associated with temperatures.
Confidence intervals really only apply when you are measuring the same thing multiple times and no systematic error exists. In this case you have to assume that you are generating a Gaussian distribution around a true value x-bar. (This isn’t necessarily the case an you need to confirm it on a case by case basis)
You can then find the standard deviation of the distribution around the mean and assume that the true value is x-bar +/- σ.
None of the assumptions hold for temperatures. You are not measuring the same thing multiple times. Systematic error *does* exist in each measurement. The distribution of the measurements cannot be assumed to be Gaussian.
“ I would assume you think the rate of change could be anywhere from ±3.5°C / decade. If that’s the case how on earth can you claim it is significantly different from the previous trend of 0.11°C / decade.”
You consider +/-3.5C to be the same as 0.11C? Did you miss a decimal point somewhere? The first is 30 times bigger! That is significantly different!
He will never understand this.
So why did you put confidence intervals on your graph? Why say “the regression line can fall anywhere inside the confidence interval”?
As always all I get from you is a long list of things you say are not true, but no answer to the question. What do you think the uncertainty in the pause is? If you are now saying the uncertainty has nothing to do with the confidence interval, then what do you think it is?
Nitpick Nick Stokes has taught you well…
Yes it’s a nitpick to ask what those lines and numbers meant on your graph.
You do realize that confidence intervals are only a function of the data themselves?
Of course you don’t, and never will.
Yes. How do you think they are calculated. It’s a simple formula and there are assumptions that may not be correct, hence the need to correct for auto correlation.
Once again you are distracting from your inability to say if you think the confidence interval I quoted ±0.56°C / decade is too big or too small for the uncertainty interval of the pause.
It would be so easy for you to say, “I think the actual uncertainty of the trend over that last 7.75 years is x°C / decade. This is much larger / smaller than the so called confidence interval generated by the Skeptical Science Trend Calculator.”
But you won’t, and you don’t need to be a mind reader to see why.
“Once again you are distracting from your inability to say if you think the confidence interval I quoted ±0.56°C / decade is too big or too small for the uncertainty interval of the pause.”
And once again here you are conflating confidence intervals with uncertainty intervals. They are *NOT* the same thing.
Again, multiple measurements of different things using different measurement devices are not guaranteed to generate an independent, identically distributed data set. You must *prove* that it is iid before you can assume that. If the distribution is not iid then standard deviation and “confidence levels” simply don’t apply.
The UAH histograms are different every month.
“So why did you put confidence intervals on your graph? Why say “the regression line can fall anywhere inside the confidence interval”?”
Bottom line? He didn’t put confidence intervals on his graph. He put on uncertainty intervals.
The only reason I plotted confidence intervals was to emphasize how the regression line becomes less reliable toward the ends.
So what are those green lines labeled CL upper and CL lower meant to represent. Are you saying they are uncertainty intervals.
“Confidence intervals don’t really have much to do with uncertainty associated with measurements of different things.”
Rubbish as always.
Even Carlo, Monte understands that.
But have it your way. What do you think is the uncertainty in the pause trend line?
“You consider +/-3.5C to be the same as 0.11C?”
Try reading what I said. If the uncertainty of the zero trend over the pause is ±3.5°C / decade, then it is possible that the trend is unchanged because 0.11°C / decade fits within the uncertainty interval.
A lie generated by your faulty mind reading, and you still can’t sort out the difference between the two.
Sorry for giving you too much credit.
“Rubbish as always.”
There is a *reason* why non-Gaussian distributions are described using the 5-number statistical description. The average is *NOT* a part of this description and neither is standard deviation. Without an average how do you define a standard deviation? Without a standard deviation how do you define a confidence interval.
You keep saying you don’t ignore uncertainty but you just keep right on ignoring it!
“Even Carlo, Monte understands that.”
“ the confidence interval that he puts on his own UAH plots!”
He was talking about *YOUR* plots, not his!
“But have it your way. What do you think is the uncertainty in the pause trend line?”
Trend lines don’t have uncertainty! Data points have uncertainty!
Trend lines have a best-fit calculation based on the stated values of the data points and ignore the uncertainty of the data points!
“Try reading what I said. If the uncertainty of the zero trend over the pause is ±3.5°C / decade, then it is possible that the trend is unchanged because 0.11°C / decade fits within the uncertainty interval.”
Again, trend lines don’t have uncertainty! Trend lines have a best-fit calculation based on the stated values of the data. Since the data point is “stated value +/- uncertainty”. Thus the actual value can range from stated value + uncertainty+ to stated value – uncertainty- where uncertainty+ indicates the max value of the uncertainty interval and uncertainty- indicates the minimum value of the uncertainty interval.
And yes, any trend line lying within the uncertainty limits is possible. That’s the whole idea of specifying uncertainty!
Climate science doesn’t study climate at all; instead it is consumed with generating and comparing these trend lines.
It is an obsession. They are trying to play like day traders of stock. Run the trends to decide what to buy or sell.
Don’t do like the “real” traders who pour over a company’s fundamentals to find out what the future may hold regardless of past and present stock price.
Correlations are ruined by CO2 going up while temperatures are going down. Why did temperatures go up in the past when CO2 was not changing?
Has anyone of the CAGW persuasion on this site ever mentioned what cause these? Nope. Just an unshakeable belief that CO2 must be at fault and we need to eliminate all sources.
Why do none of the solutions include eliminating termites? They are destructive insects that have little redeeming value.
A lot of projecting here. I’ve been fascinated by the extent Lord Monckton draws trend lines all over the place, with no regard to uncertainty, context or appropriateness. Whether it’s his 7 years of global cooling, or his 18 years of the Great Pause, or his current mini-pause he relies on arbitrary trend lines, which can tell you nothing. Yet people here lap them up, and assume something really lever is going on, even when he makes clear they are only there for the benefit of those who do not understand trends properly.
And AGAIN, you CAN’T comprehend his methods.
More trendology dogma.
Trendology dogma, from someone who claims I cannot understand hoe Monckton looks back over every trend until he finds one he likes. It’s a trivial method. It ignores all uncertainties, ignores all discontinuities and selects a start date purely on the basis of it given the longest result he likes. I know his method.
What I can’t comprehend is how you don’t understand that your uncertainties for UAH and your method for calulating the uncertainty for the trend don’t blow his pause out of water. It’s almost as if you only care about uncertainties when you don’t like the result.
“ It’s a trivial method.”
That’s not a rebuttal of his method. It’s a form of the argumentative fallacy called Poisoning the Well. You are saying MoC is using a trivial method as an aspersion on his character. If you can’t show how is method is wrong then be silent.
“It ignores all uncertainties,”
So what? The rend line based on past and present stated values that you claim has small uncertainty ignores the data uncertainty as well!
“ignores all discontinuities”
What discontinuities? You keep claiming there ae such but have never been able to actually show how they come into being. A discontinuity is where different values are approached from the left and the right. Nothing CoM does causes that to happen. You *can* have different slopes of the function on each side of a point without it being a discontinuity.
“selects a start date purely on the basis of it given the longest result he likes.”
So what? That somehow makes his method invalid? The opposite applies also – you just don’t like the result he gets. “like” is not a rebuttal of his method.
“What I can’t comprehend is how you don’t understand that your uncertainties for UAH and your method for calulating the uncertainty for the trend don’t blow his pause out of water. It’s almost as if you only care about uncertainties when you don’t like the result.”
It blows the trend line you like out of the water as well! And, for at least the fourth time, trend lines don’t have uncertainty, they have a best fit metric. That is *NOT* uncertainty.
If you buy the traditional trend line for UAH then you should accept CoM’s trend line. Both are based on the same data with the same uncertainties. If you don’t accept CoM’s trend line then you shouldn’t accept the traditional trend line either. You can’t have your cake and eat it too. So which is it? Are trend lines using UAH data acceptable or not?
“What discontinuities?”
By the way, why do you keep calling him CoM?
I keep trying to explain why the trend lines here are nonsense, yet for some reason you think I’m obsessed with them. I’m not the one claiming trend lines have no uncertainty.
“Trend lines don’t have uncertainty! Data points have uncertainty!”
Weren’t you the one claiming the trend line could be anywhere withing the 1.4K uncertainty bounds? Don’t you think that implies an uncertainty to the trend line?
“Weren’t you the one claiming the trend line could be anywhere withing the 1.4K uncertainty bounds? Don’t you think that implies an uncertainty to the trend line?”
Yep! That’s because of the DATA uncertainty! Trend lines don’t have uncertainty, they have a best fit metric. Pick your data points from the stated values +/- uncertainty intervals and find a best-fit trend line to fit the data! The data points you pick could even have a 2nd or 3rd order best fit as the best trend line instead of a linear one!
It’s the uncertainty in the data, i.e. the temperature measurements, that is the problem, not the best-fit metric. It’s why a GAT is so idiotic, it’s uncertainty interval is so wide the GAT could be most anything!
“Trend lines don’t have uncertainty, they have a best fit metric.”
Yet Taylor has a whole chapter explaining how to work out the uncertainty of a trend line.
If you are talking about chapter 8 you are, once again as usual for you, cherry picking based on a title rather than the subject matter.
Chapter 8: Page 182:
“To answer this question, we would first find the line that best fits the data, but we must then devise some measure of how well this line fits the data.
If you look in Chapter 9, Rule 9.15,
r = Σ(x_i – x_bar)(y_i – y_bar) / sqrt[ Σ(x_i – x_bar)^2 Σ(y_i – y_bar)^2 ]
No where in this equation are uncertainties shown,
“As I will show directly, the number r is an indicator of how well the points (x_i,y_i) fit a straight line”
Again, Taylor is not finding an “uncertainty”, he is finding the best fit linear trend line to the data points. No where is he including anything about uncertainty!
In fact, he states in Chapter 9:
“Using the method of least squares, we can find the values of A and B for the line that best fits the points (x_1, y_1), …, (x_n, y_n). If we already have a reliable estimate of the uncertainties in the measurements, we can see whether the measured points do lie reasonably close to the line (compared with the known uncertainties).
In other words, he is saying that the measurements uncertainties must be used to judge if the line actually represents the “stated values +/- uncertainty”.
STOP TRYING TO CHERRY PICK STUFF YOU HAVE ABSOLUTELY NO UNDERSTANDING OF!
Your continued use of this tactic is why no one wants to try and teach you anything any more!
Chapter 8, specifically 8.4
I don’t need to cherry-pick from the book. The equations he gives are the same you will find in any text book. They are the standard error of the regression parameters. I only mention Taylor, because he specifically calls them a measure of uncertainty, which you keep saying they are not.
Regarding chapter 9, why do you think it ends up with talking about the probability of a specific r value for a given number of uncorrelated variables? Because there is an uncertainty in the correlation coefficient.
Note also in that section he is saying you don’t know the uncertainty of the variables in advance but have to estimate them from the data, and specifically applies that to the case where uncertainty is not coming from measurements but from variability in the data.
His example is homework scores compared with exam scores. No uncertainty in the points, but
You quote where he says
And ignore the word “if”.
“They are the standard error of the regression parameters.”
Which you use to determine the best fit!
“ I only mention Taylor, because he specifically calls them a measure of uncertainty, which you keep saying they are not.”
They are a measure of the uncertainty of the fit to the stated values of the measurements!
“Regarding chapter 9, why do you think it ends up with talking about the probability of a specific r value for a given number of uncorrelated variables? Because there is an uncertainty in the correlation coefficient.”
I’ll ask again – WHY DO YOU THINK NO UNCERTAINTIES APPEAR IN THE EQUATION?
You simply cannot determine measurement uncertainty from only the stated values. You keep confusing best-fit with measurement uncertainty!
“Note also in that section he is saying you don’t know the uncertainty of the variables in advance but have to estimate them from the data, and specifically applies that to the case where uncertainty is not coming from measurements but from variability in the data.”
As usual, you can’t even get this straight!
Taylor, Section 9.3, page 216: “This kind of experiment has no uncertainties in the points; each students’s two scores are known exactly. The uncertainty lies rather in the extent to which the scores are correlated; and this has to be decided from the data.” (bolding mine, tg)
“The extent to which a set of points (x_1,y1), …, (x_n, y_n) supports a linear relation between x and y is measured by the linear correlation coefficient, or just correlation coefficient,
r = σ_xy / (σ_x * σ_y)”
Once again, this has nothing to do with the uncertainty of the measurements and what impact they have. “r” is a measure of the best-fit to the linear trend line.
“And ignore the word “if”.”
If we know the uncertainties then we can do what MC did and show the uncertainties on the graph. If those uncertainties span the linear trend line then you simply don’t know if the linear trend line is actually telling you anything or not!
Give it a rest! You can’t get *any* of this right. You are still stuck inside that little box you call a mind. And all you can do is try to cherry pick stuff you think will prove you can ignore measurement uncertainty and can use only the stated values to come up with some hokey “uncertainty” metric.
All you are doing is fooling yourself. You need to sit down and actually work out the examples in Taylor, check your answers with his, and TRY to come to some actual knowledge about uncertainty.
Again, it is useless to try and educate you. I won’t answer any more of your garbage on this subject.
“Which you use to determine the best fit!”
No you don’t!
You need to know the best fit in order to determine the uncertainty. Read section 8.4.
“They are a measure of the uncertainty of the fit to the stated values of the measurements!”
What do you think uncertainty of the trend means?
“I’ll ask again – WHY DO YOU THINK NO UNCERTAINTIES APPEAR IN THE EQUATION? ”
Because he’s using the stated values. Which, contrary to your assertions, does not mean he’s assuming there are no uncertainties. If you read the preamble to 9.15 you would see this.
BTW, this is not relevant to the question about whether trend lines have uncertainty. Chapter 9 is talking about correlation.
“You simply cannot determine measurement uncertainty from only the stated values.”
I don;t care if you call it measurement uncertainty or not. It’s a measure of uncertainty, which may or may not be caused by measurement uncertainty.
“As usual, you can’t even get this straight!”
You are just emphasizing what I was trying to tell you. Even if there is no measurement uncertainty there is still uncertainty in the trend and in the correlation, and even if there is measurement uncertainty you don’t have to know what it is.
“Once again, this has nothing to do with the uncertainty of the measurements and what impact they have.”
Once again, the point I was answering is that there is uncertainty in the trend. You’re doing what you keep accusing me of, and making a red-herring fallacy.
Rest of the ad hominems ignored.
You claimed there is no uncertainty in a trend. I showed you where your own preferred source talked about uncertainty in the trend line.
In addition, I see that Bevington talks about uncertainty in the parameters of a leas square fit (page 109), and the GUM describes an example of using a least square fit to calibrate a thermometer (H3), in which they also describe the standard error of the regression as its uncertainty.
It’s far too late in this discussion to try to deflect it into another debate about using stated values.
If you can’t accept there is uncertainty in a trend line, despite three metrological sources using that exact word, then I doubt there’s much point going any further.
Section 8.4, page 189
“The standard deviation σ_x is just the root-mean-square value of Δx that would result from repeating this measurement many times.”
Temperature is *NOT* measured multiple times.
And Δx is is the distance between the linear trend line and the point (x_i, y_i). NO UNCERTAINTY INVOLVED! Just best fit of the linear trend line to the stated values of the measurement!
“What do you think uncertainty of the trend means?”
And now you are gong to claim that you were talking about best-fit.
THERE IS NO UNCERTAINTY in the trend line. There is a best-fit metric. Uncertainty is an unknowable. The residuals between the stated values of the data points and the trend line are not unknowable*.
You are still looking for a way out to ignore measurement uncertainty. STOP IT. THERE IS NOT WAY OUT.
“THERE IS NO UNCERTAINTY in the trend line.”
I’ve given you three sources, all of which refer to the uncertainty of a trend line. I can’t help you any further. You are clearly trying to pick nits that only exist in your imagination.
As always you have no conception of the difference between the uncertainty of a trend line, and uncertainty of individual values. You still can’t understand, despite all the exercises you claim to have done, that it is possible to derive an uncertainty in a trend despite treating all values as exact. You keep obsessing with the fact that the trend is a best-fit, without explaining why that means there is no uncertainty in the best-fit. You have no conception that just because you got one set of measurements this time, does not mean you would have exactly the same if you repeated the experiment.
For some reason you claim there is no uncertainty in the trend line, whilst insisting we just don;t know what the true trend line is. Rather than reflect on this contradiction, you are tying yourself in knots to rationalize your obvious mistake. Whatever you call it, the trend line is uncertain, we do not normally know the exact value of the true trend line, or even if it exists, all we know is the best fit to the data, and the estimated confidence of that fit – that is uncertainty.
“But it is a sure bet that if you ignore it and it turns out to be a predictor of the future then bad things will happen because you missed it!”
Would you say the same about the trend over the last 10 years? The trend since 2012 is 0.29°C / decade, more than twice the previous trend. Is that something we shouldn’t ignore?
The ineluctable fact remains that the rate of global warming since the first predictions by IPeCaC in 1990 has been very substantially less than predicted, which is why such long Pauses are so conspicuous a feature of the temperature record.
You might claim that “long pauses” are only there to indicate to a statistically naive audience that the rate of warming is lower than predicted, but the like of Tim Gorman clearly don’t get that. They think it’s an actual change in the trend, which may be projected into the future.
So I think it’s a fair question, why think the last 8 years tells us something about a change in warming rates but not the last 10 years? With the temporary ups and downs in any data set mean the choice of start date can produce highly different trends, and it’s just confirmation bias to choose the start point that makes the argument you want to make.
The real problem is that you are trying to rationalize natural variation into a trend with a constant linear slope of growth. You and other CAGW proponents adhere to the fact it is being done by one single factor, CO2, that has been growing in the atmosphere.
You simply fail to discern the fact that natural variation occurs based upon a large number of factors that combine in a chaotic fashion to make a continuous physical phenomena that can not be described by linear mathematics.
You never consider the fact that we are in an interglacial period of an ice age and that we are doomed to reenter a period of glaciation again. CAGW adherents seem to think that this short period of temperature growth will continue forever and decreasing temperatures will never occur again.
What really made me a sceptic is the hockey stick of temperature growth. At some point sufficient water vapor will form enough clouds that albedo reduces to the point where the sun can no longer heat the earth. That is never shown as the limit on hockey stick graphs. Why? If temperatures a century from now can be predicted, then why can’t the limit of growth be predicted? Again, linear math just won’t allow it. That is why models fail and turn into simple linear equations.
Look at this graph from another thread.
https://wattsupwiththat.com/2022/07/05/another-energy-imbalance-paper/
Do you honestly believe the statistical analysis done on temperatures follow the curve shown on this graph? If so, you are wrong. If not, then you must admit that linear math and statistical analysis is pretty much useless for predicting the future. We need to be using vector (multivariable) calculus similar to Maxwell’s or Navier-Stokes partial differential equations.
“The real problem is that you are trying to rationalize natural variation into a trend with a constant linear slope of growth.”
As I’ve repeatedly told you, I’m not. A linear trend may well not be the best fit for any data set, it’s just a useful first approximation.
And you keep wanting to have it both ways. Insisting linear trends are wrong, but then happily accepting the idea of no warming over 7.75 years on the basis of a linear trend.
“You and other CAGW proponents adhere to the fact it is being done by one single factor, CO2, that has been growing in the atmosphere.”
I think there are multiple factors that affect changes, and it makes no difference why you think temperatures are warming at this point. My argument against the pause is simply that it provides no evidence of change in the rate of warming, whatever is causing that warming.
“CAGW adherents seem to think that this short period of temperature growth will continue forever and decreasing temperatures will never occur again.”
I don’t think that, I don;t know of anyone who thinks that. If you are just looking at the current trend, you do not try to project that far into the future let alone indefinitely. And if you model the warming based on CO2, inevitably warming will follow CO2, not go on for ever. It stops as rising CO2 stops, and it’s not possible for CO2 to rise for ever as carbon is finite.
“That is never shown as the limit on hockey stick graphs.”
“hockey stick” graphs are usually attempting to show what has happened, not what’s going to happen.
You may have a model where increased cloud cover is sufficient to stop future warming, but why i should I believe your model ahead of any of the others?
“You simply fail to discern the fact that natural variation occurs based upon a large number of factors that combine in a chaotic fashion to make a continuous physical phenomena that can not be described by linear mathematics.”
Might as well post my updated analysis based on nothing but linear regression involving CO2, a lagged ENSO, and an estimate of volcanic activity. This linear regression is based on data up to the start of the pause, and projected over the pause period. This month was pretty close to the predicted value, but in general the pause has been warmer than what would have been predicted.
Shaded area is the 95% prediction interval, not the confidence interval.
And as I didn’t have time to do this earlier, here’s the state of the Pause with confidence intervals, based on the Skeptical Science Trend Calculators correction for auto correlation.
The SSTC doesn’t allow you to put in uncertainties. Confidence intervals are calculated solely based on the stated values which assumes they are 100% accurate – as you always do!
Where are the uncertainty limit lines on your graph?
Do you never read what i write. No the confidence interval is not based on supposed uncertainty values. That’s not how you normally calculate the confidence intervals for trends. Read Taylor, he explains the formulas which do not require knowing the uncertainties of the measurements.
But, again, if you want to assume uncertainty intervals and add them to the normal confidence intervals you could do it, but it’s going to make the confidence interval bigger, which in turn makes the pause even less meaningful.
“Do you never read what i write. No the confidence interval is not based on supposed uncertainty values.”
i KNOW! You always ignore uncertainty!
“That’s not how you normally calculate the confidence intervals for trends.”
you don’t calculate confidence intervals for trends, you calculate best-fit measure. Since the trend line ignores the uncertainty of the stated values the trend line’s uncertainty is typically unknown. Which is what *you* always do, ignore uncertainty, even though you say you don’t.
“But, again, if you want to assume uncertainty intervals and add them to the normal confidence intervals you could do it, but it’s going to make the confidence interval bigger, which in turn makes the pause even less meaningful.”
Do clouds influence ENSO? Does ENSO influence clouds? Or how about water vapor?
Any time series with a positive slope will show a correlation. That doesn’t mean either one causative in any way. Why don’t you plot postal rates on your graph and see how they correlate to CO2 and ENSO?
No idea. All I’m saying is including more factors gives a better estimate, and just knowing ENSO values demonstrates why you have a pause. It also explains why the pause doesn’t disprove the link with CO2.
In other words you don’t care about causation, only correlation.
Did you put the postal rate trend line on your graph yet? It’s another factor that should give a better estimate!
I care about causation, but it isn’t the purpose of the graph to show it. I may well be able to get just as good a fit with US postal rates, I just just suspect there’s less reason believe there would be a causation.
“I care about causation, but it isn’t the purpose of the graph to show it. I may well be able to get just as good a fit with US postal rates, I just just suspect there’s less reason believe there would be a causation.”
In other words the purpose of the graph isn’t to show causation but it is the purpose of the graph to confirm the causation you believe in!
ROFL!!!!!
No the purpose of the graph was to see if there was any evidence that the pause disproved the idea of a correlation between CO2 and temperature.
Typical bellman, if the information you put right in front of his nose disagrees with his preconceived notions, he rejects them out-of-hand.
Maybe I should have just said, “don’t whine”.
Which evidence do you think I rejected out of hand?
Let’s recap for the benefit of my alleged “fans”: I had the audacity to replot the UAH monthly data with very modest uncertainty limits, plus quite a lot of additional analysis of the data that has not been done before TMK. Most of the subsequent comments posted were insightful and gave me things to think about for the future.
Only a single poster (starts with “b”) objected to my limits, claiming they “seemed too big” without a shred of technical justification. After being justifiably mocked, he employed Nick Stokes’ tactics and attempted to nitpick the uncertainty numbers, eventually that I didn’t know what I was doing and had made a stupid error by using U(T) = ±1.4K (expanded uncertainty). But all this person did is expose his own ignorance and incompetence.
He then went on a jihad, demanded over and over and over that I explain myself to him, the great and important person that he is. I refused to play his games so he just whines about me, a lot.
Have you figured out where the 1.4K number comes from yet?
For the reference you are talking about this thread
https://wattsupwiththat.com/2022/07/01/satellite-data-coolest-monthly-global-temperature-in-over-10-years/#comment-3545864
“Only a single poster (starts with “b”) objected to my limits”
Argument ad Populum. It only needs one person to be right.
“claiming they “seemed too big” without a shred of technical justification”
Agreed. I don’t need to know to know all the technical details to see why your claimed ±1.4K uncertainty is unlikely to correct. But my main focus was on pointing out that if you are correct you are saying that UAH data is worthless, that Dr Roy Spencer is wasting his time publishing them, that WUWT are being dishonest in quoting them with no mention of uncertainty, and the Lord Monckton certainly can’t be using them to justify his claims about the pause.
“After being justifiably mocked”
You should know be now that mocking me is not going to stop me asking questions and pointing out issues.
“he employed Nick Stokes’ tactics and attempted to nitpick the uncertainty numbers,”
You invoke Nick Stokes as if that’s a bid thing.
But by, nitpicking you mean I asked you why you had chosen a high coverage factor, and later asked how you had calculated the sigma value in your graph. You refused to answer any question.
“eventually that I didn’t know what I was doing and had made a stupid error by using U(T) = ±1.4K (expanded uncertainty).”
It’s obvious from are many discussions over the years that you don’t know what you are doing, but specifically here the refusal to answer simple questions is the give away. I didn’t say you had made a stupid error in using an expanded uncertainty, I asked why you had chosen a coverage factor of 2.8. This followed from your claim that the combined standard uncertainty was 0.5K. By multiply it by 2.8 you are saying you want an uncertainty interval of around 99.5%. I asked because I wanted to make sure I understood what you were doing – as usual you insulted me and refused to answer, insisting it was too complicated for me to understand.
“But all this person did is expose his own ignorance and incompetence.”
But the other person still refused to explain.
“He then went on a jihad, demanded over and over and over that I explain myself to him”
I wouldn’t need to keep asking if you would just answer the question. It quickly becomes clear that there is a reason you refuse to answer. Either you don’t know, or you know it would make you look bad – so you go through your usual schoolyard tactics in an attempt to distract from your inability to answer.
“Have you figured out where the 1.4K number comes from yet?”
I shouldn’t need to figure it out. You should be the one to justify it.
“I don’t need to know to know all the technical details to see why your claimed ±1.4K uncertainty is unlikely to correct.”
You’ve been given substantiation on the +/- 1.4K over and over again and yet you refuse to accept it. All you can do is to continue to nit-pick because you don’t understand any of it!
“But my main focus was on pointing out that if you are correct you are saying that UAH data is worthless, that Dr Roy Spencer is wasting his time publishing them, that WUWT are being dishonest in quoting them with no mention of uncertainty, and the Lord Monckton certainly can’t be using them to justify his claims about the pause.”
Whining word salad! It’s why *all* of the so-called temperature reconstructions are useless, not just UAH.
“You refused to answer any question.”
*I* answered your question! Yet you remain focused on MC instead of on the issue. Stalking obsession!
“It’s obvious from are many discussions over the years that you don’t know what you are doing, but specifically here the refusal to answer simple questions is the give away. “
He knew EXACTLY what he was doing and it is correct. You’ve been shown why but in your obsession you refuse to accept it.
” This followed from your claim that the combined standard uncertainty was 0.5K. By multiply it by 2.8 you are saying you want an uncertainty interval of around 99.5%.”
You keep saying MC doesn’t know what he is doing and then you go and try to conflate uncertainty with confidence interval – showing that you have NO IDEA of the difference.
“I shouldn’t need to figure it out. You should be the one to justify it.”
*I* JUSTIFIED IT! The actual uncertainty of adding 30 uncertainties from 30 mid-range daily temperature values is far more than +/- 1.4K. +/- 1.4K is a CONSERVATIVE value for the total uncertainty of each monthly figure.
Yet for some reason you are so obsessed with MC that you won’t even listen to reason. Get some help!
“You’ve been given substantiation on the +/- 1.4K over and over again and yet you refuse to accept it”
The only substantiation I’ve seen so far is the claim that 1.4 was chosen because it’s the square root of 2.
As I keep saying, you don’t have to convince me. Convince Dr Spencer.
“Whining word salad! It’s why *all* of the so-called temperature reconstructions are useless, not just UAH.”
But Pat Franke said the uncertainty in HadCRUT was only ±0.5°C, much less than UAH.
“*I* answered your question! Yet you remain focused on MC instead of on the issue. Stalking obsession!”
It’s his claim. He shouldn’t need you to answer for him.
“He knew EXACTLY what he was doing and it is correct.”
You realize your endorsement doesn’t carry much weight with me.
“You keep saying MC doesn’t know what he is doing and then you go and try to conflate uncertainty with confidence interval – showing that you have NO IDEA of the difference.”
I said uncertainty interval, not confidence interval.
“*I* JUSTIFIED IT! The actual uncertainty of adding 30 uncertainties from 30 mid-range daily temperature values is far more than +/- 1.4K. +/- 1.4K is a CONSERVATIVE value for the total uncertainty of each monthly figure.”
There are no mid-range uncertainty values in UAH data. And you can’t claim the 1.4 figure is correct, and then turn round and say it should be much larger. And, weary sigh, you do not add the uncertainties.
“But Pat Franke said the uncertainty in HadCRUT was only ±0.5°C, much less than UAH.”
Really? I don’t find that. But I did find this in a post from Anthony Watts which is a study on Hadcrut from The Reference Frame, 30 July 2011
“The warming at a given place is 0.75 plus minus 2.35 °C per century.”
“If the rate of the warming in the coming 77 years or so were analogous to the previous 77 years, a given place XY would still have a 30% probability that it will cool down – judging by the linear regression – in those future 77 years! However, it’s also conceivable that the noise is so substantial and the sensitivity is so low that once the weather stations add 100 years to their record, 70% of them will actually show a cooling trend.”
” But the actual change of the global mean temperature in the last 77 years (in average) is so tiny that the place-dependent noise still safely beats the “global warming trend”, yielding an ambiguous sign of the temperature trend that depends on the place.”
Look at the first quote very, very closely! The uncertainty is three times larger than the stated vale of the warming. Wow!
Here is what Pat Frank had to say in a comment to the above Hadcrut study:
—————————————————
Lubos’ result showing a mean trend of 0.76(+/-)2.36 C shows that climate is very heterogeneous and consists of very many widely scattered sub-states. The mean state does not represent the system at all.
Chris Essex had a paper a few years back pointing out that global mean temperature is a statistic rather than a physical parameter, and that it doesn’t have any real physical meaning at all. Lubos’ result demonstrates that point. It makes no scientific sense to talk about a global mean temperature because nowhere on Earth experiences that state. The 95% confidence interval is 4.6 C on either side of the mean.
Talking about the mean state of a system of widely spread sub-states is approximately like asserting the physical comfort of a guy standing with one foot in a bucket of boiling water and the other foot frozen in ice at -80 C. His mean foot is at a comfortable +20 C, and what’s the problem? https://s.w.org/images/core/emoji/14.0.0/svg/1f642.svg“
Did you tell him that confidence intervals are meaningless on temperature data, and there is no uncertainty in a trend line?
Here’s the paper I was thinking of
https://www.science-climat-energie.be/wp-content/uploads/2019/07/Frank_uncertainty_global_avg.pdf
He states a lower-limit uncertainty of ±0.46°C was found. Though I’m not sure what coverage factor if any he’s using.
The title of that paper is:
UNCERTAINTY IN THE GLOBAL AVERAGE SURFACE AIR TEMPERATURE INDEX: A REPRESENTATIVE LOWER LIMIT
(bolding mine, tg)
WHY do you always see only what you want to see?
From the study:
“It is thus impossible to know whether the rate of warming during the 20th century was climatologically unprecedented, or to know the differential magnitude of any air temperature warmer or cooler than the present, within +/- 1C, for any year prior to the satellite error.
You *really* need to learn how to stop cherry-picking titles and facts without actually understanding the entire referenced paper. It might help if you actually read the whole, entire thing for meaning before quoting it.
As are Carlo Monte’s figures. The fact remains that Frank’s fantasy lower bound estimates for HadCRUT are still only a third of the lower bound fantasy estimates for UAH.
Given that you don’t believe there is any probability distribution associated with any pf these uncertainty intervals, I don’t know what you think making the intervals larger would mean. You don;t know if the true mean is within the current interval, make it 10 times bigger and you still don’t know if it’s in the interval, and the probability hasn’t even changed.
Idiot.
This just in—the “b” person still can’t figure out basic uncertainty calculations.
What a surprise…well, no.
And again you choose an hilarious insult rather than asking the simplest of questions.
You pretty much nailed it. Typical bellman!
And the claim that the length of a pause is an indicator of the strength of the trend, is only partially true.
Consider RSS. It’s trend is much bigger than UAH, 0.21°C / decade. Yet it’s pause is virtually the same length as UAH, starting in November 2014 (as of May 2022).
All the pause really tells you is how long ago was the last big El Niño.
“And the claim that the length of a pause is an indicator of the strength of the trend, is only partially true.”
Who exactly is claiming that? The voices in your head?
“Who exactly is claiming that? The voices in your head?”
Lord Monckton in the comment I was responding to (my emphasis)
And you STILL don’t understand his methods.
So people keep telling me. So what do you think his methods are?
Go read for yourself, I’m not going to educate you.
Something else you are unable to grasp.
“The ineluctable fact remains that the rate of global warming since the first predictions by IPeCaC in 1990 has been very substantially less than predicted, which is why such long Pauses are so conspicuous a feature of the temperature record.”
I don’t see a single word in here about the STRENGTH of the trend. Just a statement that the trend line generated by the climate models are diverging away from actual observations such as the UAH.
You seem to be reading something that only you can see!
As far as I can see, he claims that long pauses are an indication of the trend being weak. As I’ve said before, if all you want to do is say that UAH data is less than some prediction, you can do that by referencing the entire trend of the last 40 years. Monckton says that this is too confusing for the average person and that the pause somehow illustrates the slowness of the warming better.
Here’s another quote
“They think it’s an actual change in the trend, which may be projected into the future.”
Why do you continue to lie like this? It is a trigger point where the residual fit begins to grow. Growth in the residual fit of a trend line to the data used for the trend line is an indication that something needs to be looked at.
And you are at least as bad at forecasting as you are at uncertainty. Past performance is no guarantee of future performance. You cannot weight past data equally with current data if you are trying to formulate a true forecast. Current data has much more weight than past data.
“So I think it’s a fair question, why think the last 8 years tells us something about a change in warming rates but not the last 10 years?”
As usual, you are stuck inside a small box with your thinking. What you want to use is a time series forecast method which is basically just a linear regression model. That is far too simplistic of a method to use with numerous other variables which impact the forecast. It’s the same with most of the climate scientists and their models. Forecasts of climate should be what is known as an explanatory model where all involved variables are forecasted as predictor variables and are combined into one coherent whole.
Clouds are a main contributor variable as is water vapor, but I don’t see you integrating either of those into you forecast for temperature, only the past performance of one variable – temperature. It’s certain that the climate models don’t handle clouds correctly, it’s a major fault line in their forecasts of future temperature.
As I said, when residual fits start to grow it’s an indication that *something* has changed. And, as usual, you just want to ignore it, just like you do with uncertainty!
“As I said, when residual fits start to grow it’s an indication that *something* has changed.”
Could you explain your process. I used the analysis you previously suggested but found the best place for a kink was March 2012, and shows an increased warming trend.
As far as I can see the average residuals for a linear trend up to the start of the pause are almost identical to the trend including the pause. If you mean continue the trend from before the the start of the pause over the pause period you do see an increase in residuals, but that’s mainly because the pause period has been hotter than would have been predicted.
Oh, and where are all your tirades about people using the stated figures with no mention of the uncertainties?
“Could you explain your process.”
CoM has done a good job of explaining the process.
“I used the analysis you previously suggested but found the best place for a kink was March 2012, and shows an increased warming trend.”
So you didn’t find a kink in 2015? Recheck your math.
“If you mean continue the trend from before the the start of the pause over the pause period you do see an increase in residuals”
YOU are the one that keeps saying to ignore the pause, not anyone else.
“but that’s mainly because the pause period has been hotter than would have been predicted.”
Malarky! The residuals are higher because the temps are not following the historical linear regression line. They are diverging from it.
“CoM has done a good job of explaining the process.”
Yes, but it’s not your process. You want to detect where residuals start to increase. How do you determine that?
“So you didn’t find a kink in 2015? Recheck your math.”
I’ve done it multiple times. If you disagree show your workings.
Even if I do put a kink in September 2014 it just shows the trend increases.
“Malarky! The residuals are higher because the temps are not following the historical linear regression line. They are diverging from it.”
That’s what I’m saying. If there is any indication of a change around the time of the 2016 El Niño, it’s that temperatures remaind warmer than you’d expect using the old trend line. I don;t this is significant, there’s far too little data to draw any conclusions about accelerated warming, but it is what the data is.
“Yes, but it’s not your process. You want to detect where residuals start to increase. How do you determine that?”
You are the statistician and you can’t subtract data points from the trend line value? OMG!
“I’ve done it multiple times. If you disagree show your workings.”
I don’t have to. CoM has done it for me!
“That’s what I’m saying.”
Then why do you claim that the residuals aren’t growing since 2015?
” it’s that temperatures remaind warmer than you’d expect using the old trend line.”
It isn’t a matter of what the absolute temperature is. It’s a matter of what is happening to the residuals. If your trend line goes through those warmer temps and the trend line still shows them as increasing while they are *not* increasing then the residuals will continue to increase from that divergent point. That’s what CoM has found.
It’s no wonder you don’t understand his method!
One of the drawbacks to confidence intervals is they are largely a function of the number of points in a regression. This is why his plot with the two lines shows the pause with a larger CI, there are 5x more points prior to the pause. If extra points were to be synthesized somehow and added to the pause, the CI would shrink.
They aren’t related to uncertainty at all, although they could be used in a UA as part of a complete answer if needed, I suppose (I’m still puzzled about how he got this crazy idea that “stated values” automagically include uncertainty).
“This is why his plot with the two lines shows the pause with a larger CI, there are 5x more points prior to the pause. If extra points were to be synthesized somehow and added to the pause, the CI would shrink.”
As would that of the prepause data, if those “extra points were to be synthesized somehow”. The prepause data will always be qualitatively both physically and statistically better and more indicative of what is actually going on.
BTW, the issue of “uncertainty” in the values is a straw man. The trends/kinks being evaluated will change hardly at all with or without them.
HI, BLOB! You’re as clueless as ever, but don’t let me stop from spewing more mindless word salad.
“ The prepause data will always be qualitatively both physically and statistically better and more indicative of what is actually going on.”
That might be true if the ONLY thing they are used for is to look at the past. When you try to extend that trend line that past data is *NOT* better or more indicative of future performance, not even for temperature. Past data weighted the same as present data is a truly a terrible way to forecast chaotic physical processes.
“BTW, the issue of “uncertainty” in the values is a straw man. The trends/kinks being evaluated will change hardly at all with or without them.”
This is just pure, unadulterated malarky! ANY trendline that can be produced inside the uncertainty interval is totally valid. Those trend lines could have varied slopes – positive, negative, or zero slopes. Since uncertainty represents an UNKNOWN you have to consider those unknowns.
Kink points, however, should translate into any of these varied trend lines since it represents a *change* in slope.
Any of the distributed estimates of individual global temperature or sea level data point uncertainty, when considered along with normal OLS trending, add very little to the standard error of the trend estimates. Even the grossly inflated ones invented by Dr. Frank. Only when you retreat into convenient non quantification of them, with the bogus claim that you can’t even estimate them because they are “unknown”, is it possible to hope for numbers anywhere near large enough to matter.
“Any of the distributed estimates of individual global temperature or sea level data point uncertainty, when considered along with normal OLS trending, add very little to the standard error of the trend estimates.”
You are as bad as bellman! Standard error of the trend estimates is nothing more than a best-fit metric to the stated values and totally ignores the uncertainty of the stated values.
It’s the typical “you can just ignore uncertainty” crap from statisticians that can’t deal with uncertainty.
There’s a handful of posters here for whom I wish that I was as “bad” as. Bellman is certainly in that group.
All petroleum engineers are about half statistician. It goes with the territory, training, and required practice. But I’ve learned a lot from these “bad boys”. OTOH, your posts are based in some incomprehensible idea that your flawed take aways from your stated “real world experience” trump hundreds of years of accumulated understanding of statistics, physics, engineering.
“ flawed take aways from your stated “real world experience” trump hundreds of years of accumulated understanding of statistics, physics, engineering.”
Another argumentative fallacy known as Appeal to Authority. Malarky!
My experience with uncertainty started in my first year university physics and electrical engineering lab. ACTUAL OBSERVATION, not stuff out of a statistics textbook that never addresses uncertainty.
The grad student teaching our second semester ee lab quickly disabused myself and seven other students of the folly of each of us building our first transistor amplifier, taking one reading each, and then averaging all eight together so we could save time and effort. When we all put down the same answer we all failed that lab experiment. One measurement each of different things simply doesn’t create a distribution leading to a true value applicable to each. The average of each single reading was *not* a true value in any sense of the word. We were supposed to take multiple measurements of each amp and record the data. Those readings could then be used to give an answer for each amp!
All you do is demonstrate your own lack of knowledge about the subject of uncertainty.
Thanks, coming from someone with far more real world experience than me, that means a lot.
Like bellcurveman, blob thinks uncertainty is just another word for error.
Another idiot who equates uncertainty with error.
Go blob go!
That’s not a bug it’s a feature. You expect there to be less confidence when there is less data.
If you add synthetic points it will reduce the confidence interval, which is why you do ‘t want to do it. This effectively what happens with auto correlation, which is why the standard calculation will be too narrow.
I don’t care if you say a confidence interval is the same as an uncertainty interval. You need to define exactly what you mean by uncertainty, bita confidence interval does represent the interval it’s reasonable to say the true trend may lie
The “crazy idea” is that all data varies, and it varies for any number if reasons. A regression gives you model of a relationship for a dependent variable based on oneormore independent variables. But the data points will almost never be an exact fit. One reason for this is other factors not accounted for in your variables, another is measurement uncertainty. Any random errors in the measurements add to the overal variability and this results in larger confidence intervals.
It’s a similar idea as taking multiple measurements to get a type A uncertainty. The uncertainty is present in the data.
Of course that doesn’t apply to systematic errors or other sorts of uncertainty.
You still haven’t explained where you got the sigma value and confidence intervals in your graph. I assume you calculated it using your stated uncertainties as it is bigger than the Skepticle Science Trend Calculator.
More technobabble, unread. Still not answering your clueless, loaded questions.
You’re a fool with delusions of grandeur.
The typical “Hey, **** YOU, MAN!!” response to Bellman’s Statistics 101, chapter 3 response to your new discovery. Did you really, just now, stumble upon this?
I really struck a nerve by daring to question the Holy Confidence Interval.
” A regression gives you model of a relationship for a dependent variable based on one or more independent variables.”
For a regression to have any purpose the independent variable must have a relationship with the dependent variable.
Temperature is not directly dependent on time alone other than by a trig function.
That’s why the standard deviation of a sine wave is its rms value which is not time dependent. It’s only dependent on the peak value (not peak-to-peak).
Note that two experts downvoted this statement, which indicates they likely flunked trig.
“Don’t whine.”
I’ve no idea why anyone cares enough about votes, but I suspect the reason for the down votes in this case, was it had no relevance to the previous comment, not because they disagreed with the “trig”.
Whiner.
“For a regression to have any purpose the independent variable must have a relationship with the dependent variable.”
Yes, but that doesn’t mean it has to be a causal relationship. Correlation is not causation.
“Temperature is not directly dependent on time alone other than by a trig function.”
No idea what you mean by a trig function. Is this another way of saying you think everything is a cycle?
When you look at the correlation between something and time, you are not generally saying that time caused the change, just that the change has occurred with respect to time.
Finally some TRVTH from da bellcurveman.
There are just too many people involved in climate change that simply do not understand uncertainty.
When you are measuring the same thing multiple times you get a distribution of MEASUREMENTS. Those measurements vary from the mean for various reasons, including random error and systematic bias.
So, in a sense, the measurements are an indication of the uncertainty associated with the measurements. If you assume that uncertainty is ALL TOTALLY random in nature and are identically distributed around a mean then you can assume all that randomness cancels leaving the mean as the true value.
Temperature measurements at different locations using different devices taken at different times, however, do *NOT* generate a measurement distribution that can be assumed to be random in nature. The mean of those measurements is *NOT* a true value.
Bellman is stuck in a box generated from his statistical training. He can’t imagine or understand how uncertainty works in the real world.
And they downvoted this comment also, leaving me to conclude that they live in a “demon haunted world”, to borrow from Carl Sagan.
That I dared to cast aspersion upon the Holy Confidence Interval was completely unacceptable, they both had to try shutting me down PDQ.
Lord Kelvin, teaching what modern climate science still has yet to learn about.
“Bellman is stuck in a box generated from his statistical training.”
For the last time, I have very little “statistical training”. Maybe one course during my degree. Mostly it’s what I’ve learned as an interest, quite a lot learned trying to explain things to you.
What I do understand is basic maths and how to read an equation. Most of the problem I have had with you is trying to get you to understand what the uncertainty equations you insisted I read meant. It’s been a futile but sometimes fun exercise. But how you can still not understand that
u(q) / q = u(x) / x
does not mean
u(q) = u(x)
is beyond me. I think you either have an extreme case of cognitive dissonance, or you are trolling.
“If you assume that uncertainty is ALL TOTALLY random in nature and are identically distributed around a mean then you can assume all that randomness cancels leaving the mean as the true value.”
And you keep throwing around words you don’t understand. “identically distributed” does not mean “comes from a symmetric distribution”.
“Temperature measurements at different locations using different devices taken at different times, however, do *NOT* generate a measurement distribution that can be assumed to be random in nature. The mean of those measurements is *NOT* a true value.”
Why on earth not. You keep stating things like this, but never back it up with an argument or evidence. I though we were getting somewhere when you switched from talking about uncertainties to the variance of random variables. We can easily establish what the variance of a mean of random variables is, the definitions are clear, and you can easily test them using any random number generator such a set of dice.
So taking the mean of the same random variable is
var((X + X) / 2) = (var(X) + var(X)) / 4)
and taking the mean of two different variables
var((X + Y) / 2) = (var(X) + var(Y)) / 4)
Extend this to as many different random variables as you like. The point is there is no difference in principle between taking multiple measurements of the same thing, taking multiple samples from the same population, or averaging multiple things from different populations. In all cases you have a distribution that is itself a random variable, and it has a variance that is less than the average variance.
“u(q) / q = u(x) / x
does not mean
u(q) = u(x)”
Your math skills are atrocious. You’ve got the equations above totally wrong.
It’s not u(q)/ q. There is no such thing as u(q)/q. u(q) means u is a function of q. The uncertainty of q is not a function of q. It is a function of the measurand and the measurement device.
That’s why u(q) = ẟq/q where ẟq is its uncertainty.
And why u(x) = ẟx/x
And why u(q) = u(x).
Get a life.
Go away son, you bother me!
“Your math skills are atrocious. You’ve got the equations above totally wrong.”
Sorry to confuse you by using different symbols. (u(x) is the notation GUM uses for standard uncertainty). OK, go back to Taylor’s symbols
It’s been a futile but sometimes fun exercise. But how you can still not understand that
ẟq / q = ẟx / x
does not mean
ẟq = ẟx
is beyond me.
“And why u(q) = u(x).”
Of course, if you define u(x) to be the fractional uncertainty of x, that’s correct. But as always, you don’t want to think about the consequences of the fractional uncertainties of the mean and the sum being equal.
“ẟq / q = ẟx / x
does not mean
ẟq = ẟx
LEARN SOME BASIC ALGEBRA!
No one is saying this!!!
If u(x) = ẟx / x
and u(q) = ẟq / q
then u(q) = u(x)
Unfreakingbelievable!!!!
“No one is saying this!!!”
You have been saying it for the last 2 years.
You think that the uncertainty of the mean is the same as the uncertainty of the sum. All you have done is redefine u(x) to mean the FRACTIONAL uncertainty of x. .
So yes, in that case we we have u(mean) = u(sum). But that also means that if say the absolute uncertainty of the sum of 100 thermometers is ±5°C, then the absolute uncertainty of the mean is ±0.05°C.
It has to be because mean = sum / 100.
Now are you going to insist I learn some algebra, or will you try some more red herrings.
Idiot.
Which ring will you be starring in for the next show?
What a clown.
I know how to calculate residuals. I’m trying to figure out what you think the process Monckton is using to determine the exact month when the residuals grow, and why he never mentions this secrete method for determining the start of the pause. Why does he keep saying it’s based on finding the earliest start date that gives a negative trend, rather than mentioning residuals?
When I check, the mean absolute residual for the linear trend from the start up to September 2014 is 0.138, and for the trend from the start to June 2022 is 0.139, so only one thousandth of a degree different. Of course the trend has increased from 0.11°C / decade to 0.13°C / decade.
So I just want to know why you think September 2014 is such an important date when it comes to changing residuals.
Where is the heat escaping from the Pacific Ocean?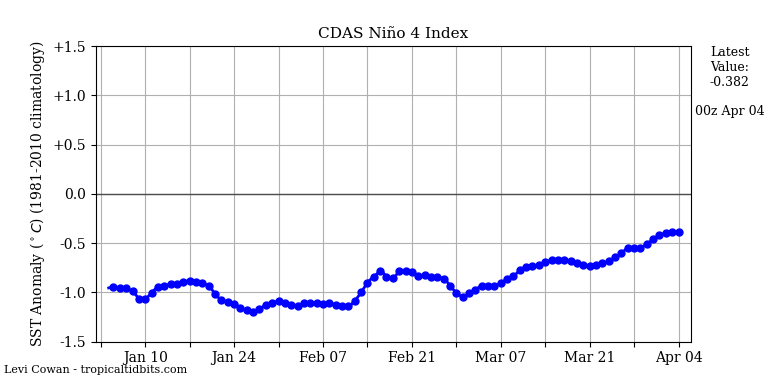
http://www.bom.gov.au/cgi-bin/oceanography/wrap_ocean_analysis.pl?id=IDYOC006&year=2022&month=07
Why is there a threat of flooding in Australia?
http://tropic.ssec.wisc.edu/real-time/mtpw2/product.php?color_type=tpw_nrl_colors&prod=ausf×pan=24hrs&anim=html5
Temperatures continue to drop in the western equatorial Pacific. Is eastern Australia ready for more rain?
Daily Mean Temperatures in the Arctic 1958 – 2022
Daily mean temperatures for the Arctic area north of the 80th northern parallel, plotted with daily climate values calculated from the period 1958-2002.
http://ocean.dmi.dk/arctic/plots/meanTarchive/meanT_2022.png
Weak sunspots (low magnetic activity) are approaching the solar equator, which means an increase in the strength of the solar wind. As a result, the latitudinal circulation will strengthen and the full La Nina will return in November, when the Humboldt Current will be at its lowest temperature.