Paul Dorian

A solar image on May 23rd, 1967 features a bright region (top, center) which is where the solar flare occurred on that day. Credit: National Solar Observatory historical archive, American Geophysical Union
It was during the height of the Cold War and a powerful solar storm could have led to a disastrous military conflict between the US and Soviet Union if not for the early efforts of the US Air Force to monitor solar activity. On May 23rd, 1967, a solar storm took place that was so powerful, it jammed radar and radio communications in polar regions and the US Air Force actually began to prepare aircraft for war thinking the nation’s surveillance radars were being jammed by the Soviet Union. Fortunately, space weather forecasters in the military suspected there might be another cause and they relayed information about the possibility that a solar storm could have been the reason for the disrupted radar and radio communications. As it turned out, this information was enough to keep the planes on the ground and the US avoided a potential nuclear weapon exchange with the Soviet Union.
Early efforts on monitoring the sun
The US military began monitoring solar activity and space weather disturbances in the upper atmosphere during the latter part of the 1950’s. By the 1960’s, the US Air Force Air Weather Service (AWS) formed a new branch whose specific purpose was monitor the sun for solar flares that could lead to a disruption on Earth with radio communications and power line transmissions. During the 1960’s, the AWS set up a network of observers in the US and in overseas locations who provided regular input to solar forecasters at the North American Aerospace Defense Command (NORAD). In fact, by 1967, several observatories around the world were sending daily reports directly to NORAD solar forecasters.

Daily observations of the number of sunspots since 1 January 1900 according to Solar Influences Data Analysis Center (SIDC). The thin blue line indicates the daily sunspot number, while the dark blue line indicates the running annual average. The arrow indicates the time of the solar storm referenced in this posting (May 23rd, 1967). Data source: WDC-SILSO, Royal Observatory of Belgium, Brussels. Last day shown: 30 April 2022. Last diagram update: 4 May 2022.
The solar storm results in a close call
In 1967, solar cycle #20 was ramping up towards solar maximum with an increasing number of sunspots and this period is often associated with an increase in solar activity such as flares. On May 18, 1967, observers detected an unusually large group of sunspots with intense magnetic fields on one region of the sun. By May 23rd, observers and forecasters saw the sun still appeared to be quite active and likely to produce a major solar flare. Observatories in New Mexico and Colorado actually saw a flare visible to the naked eye while a solar radio observatory in Massachusetts reported the sun was emitting unprecedented levels of radio waves. A significant worldwide geomagnetic storm was forecast to occur within 36-48 hours, according to a bulletin from NORAD’s Solar Forecast Center in Colorado Springs, Colorado on May 23:

Notes recorded during May 1967 regarding the region of the sun where the major flare occurred on May 23rd. Credit: National Solar Observatory historical archive, American Geophysical Union.
As the solar flare event unfolded on May 23, radars at all three Ballistic Missile Early Warning System (BMEWS) sites in the far Northern Hemisphere were disrupted. These radars, designed to detect incoming Soviet missiles, appeared to be jammed. Any attack on these stations – including jamming their radar capabilities – was considered an act of war.
Retired Colonel Arnold L. Snyder, a solar forecaster at NORAD’s Solar Forecast Center, was on duty that day. The tropospheric weather forecaster told him the NORAD Command Post had asked about any solar activity that might be occurring. Along with the information from the Solar Forecast Center, NORAD learned the three BMEWS sites were in sunlight and could receive radio emissions coming from the sun. These facts suggested the radars were being ‘jammed’ by the sun, not the Soviet Union, Snyder said. As solar radio emissions waned, the ‘jamming’ also waned, further suggesting the sun was to blame, he said.
During most of the 1960s, the Air Force flew continuous alert aircraft laden with nuclear-weapons. But commanders, thinking the BMEWS radars were being jammed by the Russians and unaware of the solar storm underway, put additional forces in a “ready to launch” status during this particular event. The Air Force did not launch additional aircraft as information from the Solar Forecasting Center made it to commanders in time to stop the military action, including a potential deployment of nuclear weapons.

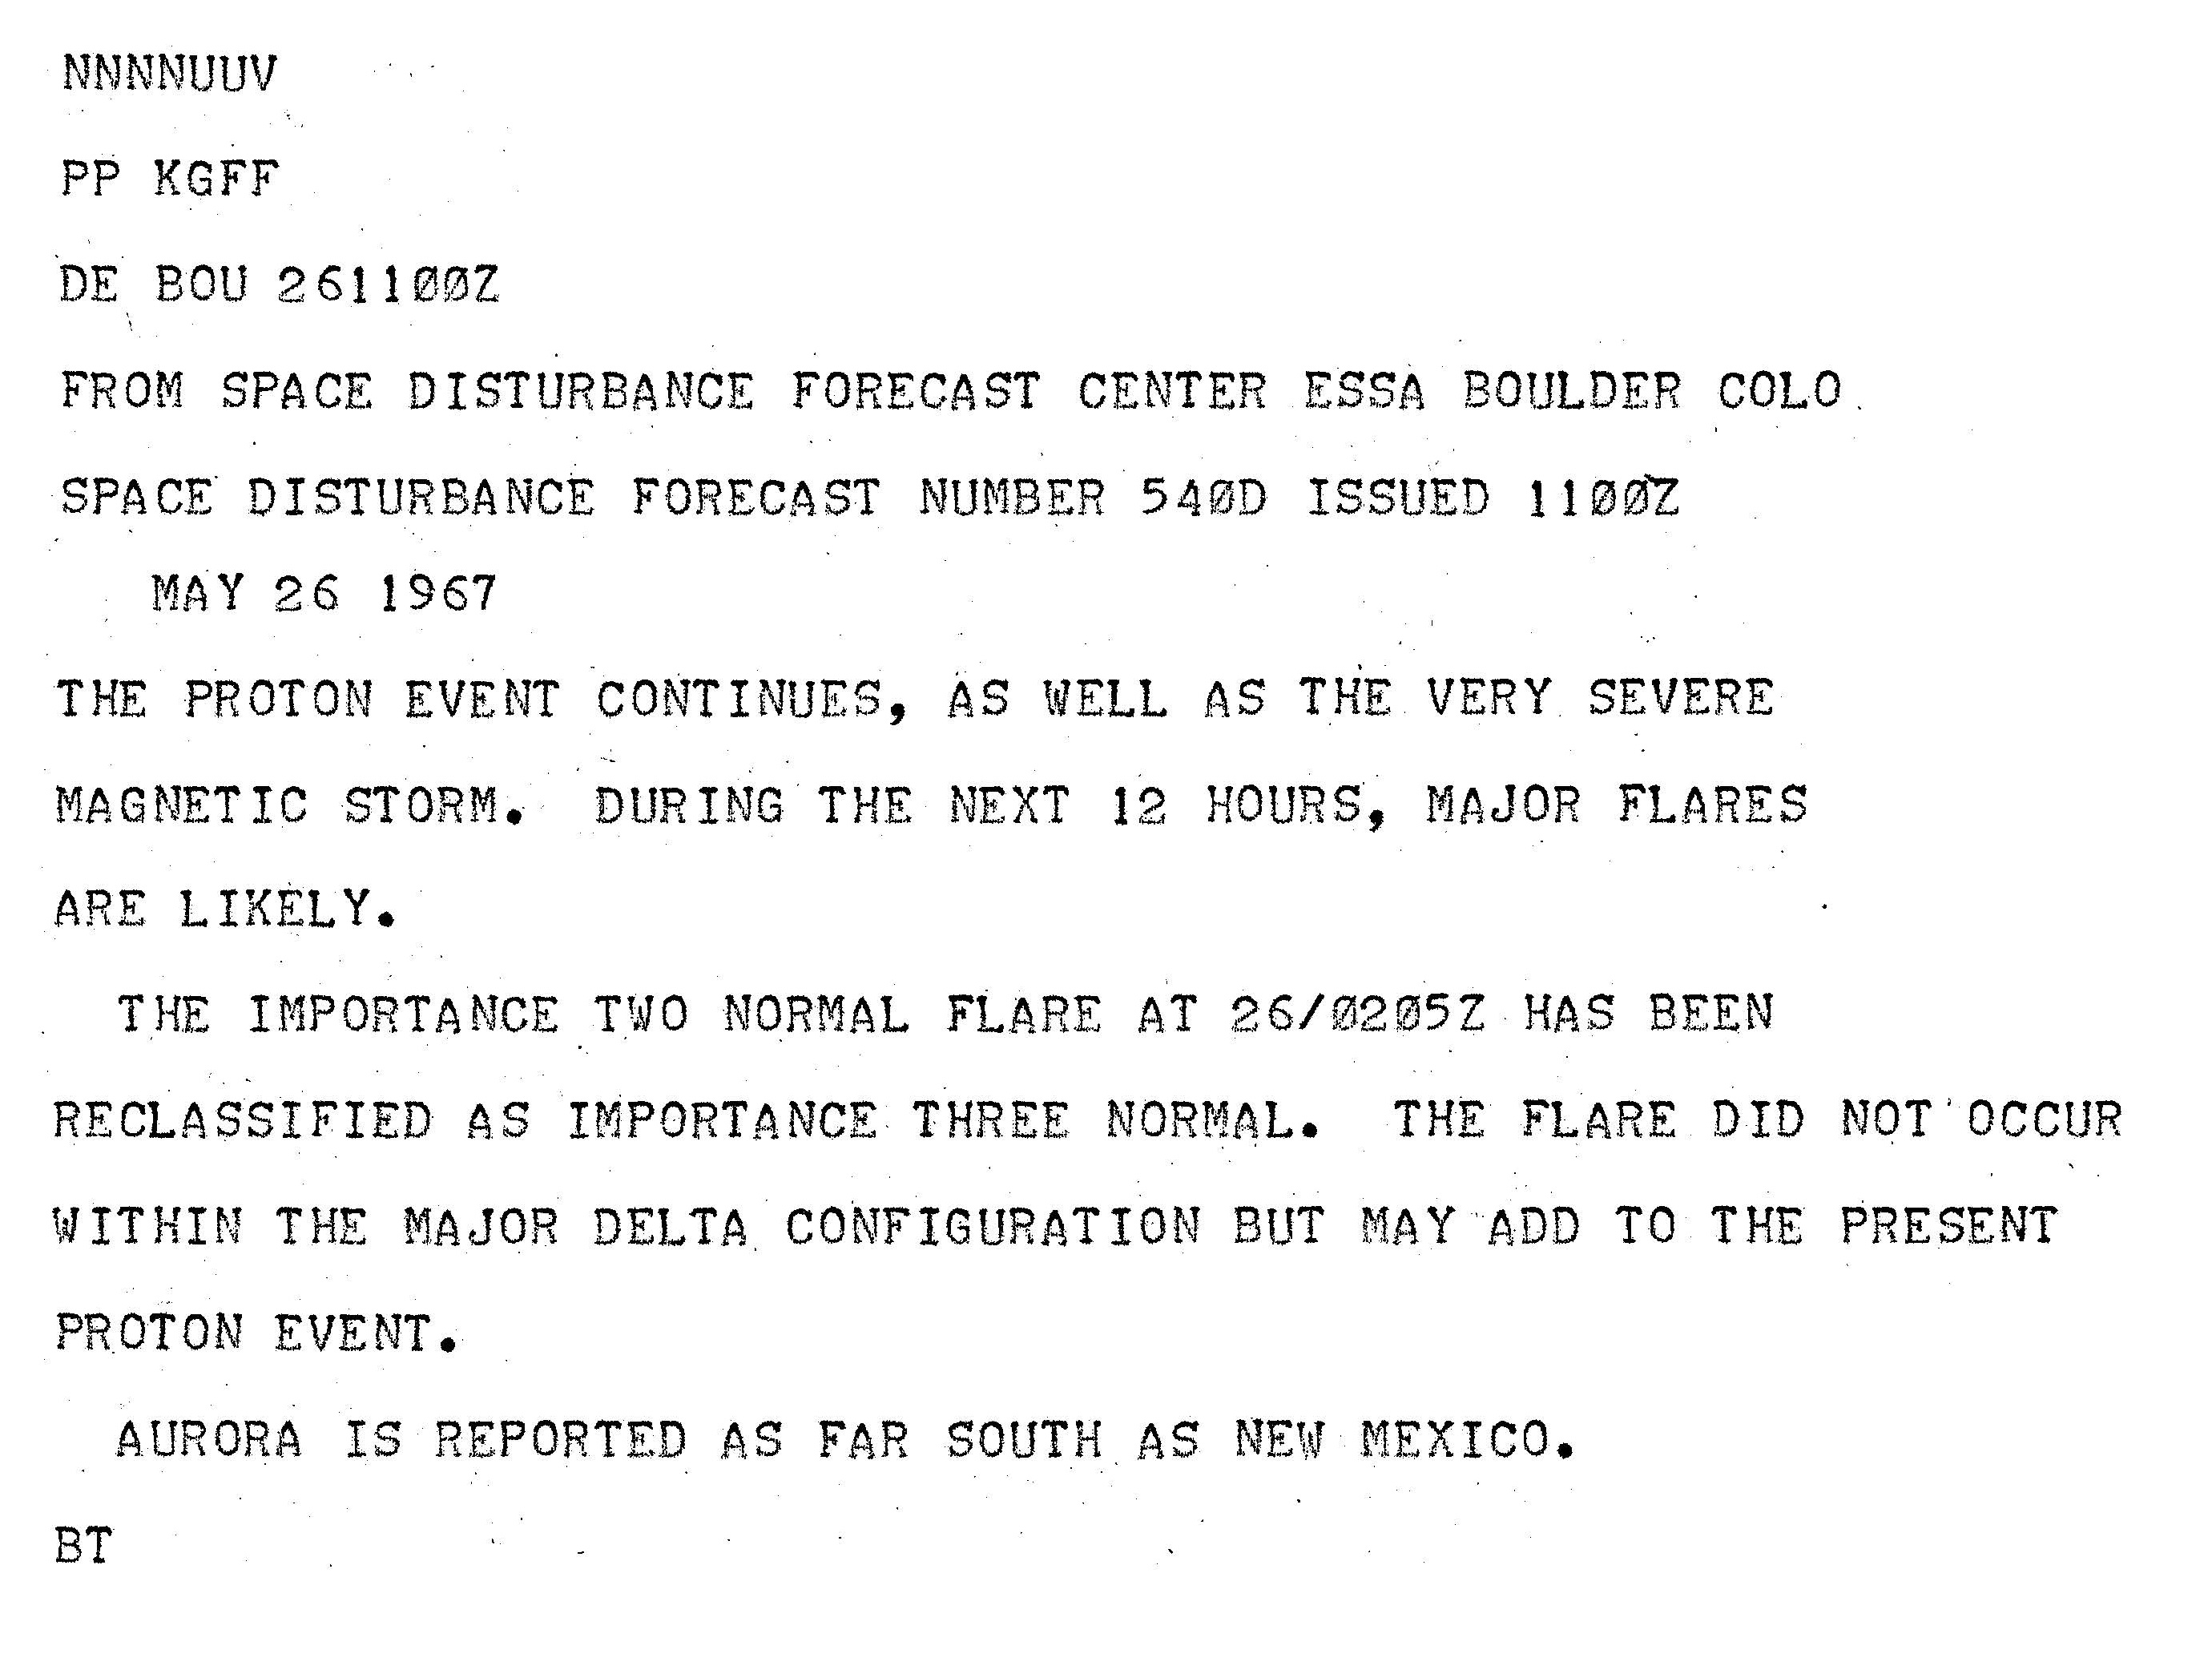
A report of solar activity on May 26 from the Space Disturbance Forecast Center, a civilian forecasting center at the Environmental Science Services Administration (now NOAA). Credit: ESSA/NOAA
The solar flare on May 23rd, 1967 was accompanied by a coronal mass ejection (CME) which triggered a powerful geomagnetic storm that hit Earth about 40 hours later. U.S. radio communications were disrupted in almost every conceivable way for almost a week. In fact, this particular solar storm was so strong that the Northern Lights – normally limited to sky watchers in the high latitudes – were visible as far south as New Mexico.
The solar storm of May 1967 is ranked as one of the top in the record books. The solar storm that is known as the most powerful in recorded history is known as “The Carrington Event” took place in September of 1859. That geomagnetic storm caused telegraph systems to fail all over North America and Europe and the northern lights were visible down to Cuba. A Carrington-like solar storm today would likely be devastating given the dependence on power grids and satellite networks.
Meteorologist Paul Dorian
Arcfield
arcfieldweather.com
Follow us on Facebook, Twitter, YouTube
And satellite communications were just barely getting started in 1967. I wonder what effect a similar flare would have now.
Probably not much. With the delay time for the signal it’s more desirable to sent most things by fiber optic surface lines. It would disturb things like weather forecasting and entertainment as those signals are often passed through satellite somewhere their delivery. GPS would be a mess as we have many people who can’t navigate without a GPS unit.
I have heard this tale SO many times over the years – and it is bunkum.
SAC SOP (Strategic Air Command Standard Operating Procedure) was, and probably still is, that if the detection window for an attack was reduced – for ANY reason, natural or man-caused – the response time was also reduced. Assets were put on higher alert status, reconnaissance was increased, and NCA (National Command Authority – POTUS, Congress, etc.) was also alerted to be prepared for rapid movement out of target zones.
I got this from a retired SAC bomber commander. He and his crew sat in their B52 on the tarmac here, fully armed, UNTIL BMEWS came fully back “on line.” There was no stand down when the problem was identified to be a solar event.
Yeah, but it’s more exciting when you tell it the other way.
Ah, Dr. Strangelove I presume…
“Yes gentlemen, they are on their way in and no one can bring them back. For the sake of our country and our way of life, I suggest you get the rest of SAC in after them, otherwise we will be totally destroyed by red retaliation. My boys will give you the best kind of start, fourteen hundred megatons worth, and you sure as hell won’t stop them now. So let’s get going. There’s no other choice. God willing, we will prevail in peace and freedom from fear and in true health through the purity and essence of our natural fluids. God bless you all.”
Fortunately General Jack D. Ripper was not in charge of NORAD.
On the subject of Dr Strangelove, would an event like the 2013 Chelyabinsk meteor have triggered the hypothetical Doomsday Machine?
I can understand the reasoning behind the alert. After all, whether natural or manmade, the radars going down still leave you blind. In fact, being natural might encourage bad actors to try their luck, on the theory that the other side will think, “Oh, it’s just the sun.”
I recall one night it the mid-1970s where we were wakened by the klaxon. We ran to the aircraft and heard a “get ready to do” message coming in from the Primary Alerting System. A few minutes later we got a stand down message. Turned out that the Soviets were unloading a missile field in compliance with one of those SALT agreements. They didn’t bother to tell our side what they were doing. A few minutes after their launch it was clear the missiles were going to Kamchatka. Our side contacted their side and told them to stop doing that.
I did a little research on ‘space weather’ at weather.gov after reading the post. By far the biggest CME risk is to the electricity grid rather than say car electronics or satellites. For example, on 3/13/1989 a ‘minor’ event knocked out power to 6 million people in Canada for 9 hours and damaged transformers as far away as NJ.
To an extent, the grids could be somewhat ‘hardened’—but not completely, and according to NERC no one is willing to pay for costly ‘partial insurance’ for a ‘rare’ event. There are several scholarly studies readily available for US and European grids and the costs of not buying ‘partial insurance’ against a ‘Carrington’ scale space weather event. None are comforting in the least. Just Google ‘grid vulnerability to space weather’.
About half of major solar storm events occur at the inner planet trigger alignments, like with the Carrington event, with a typical pair of syzygies. The rest have the trigger alignments occurring in the previous weeks to the storm event, often at 1.5 solar rotations before the solar storm event. This is April 14th 1967, the second red body is Ceres:
The Carrington Event, August 28 1859:
Getting ready for “Wing Attack Plan R”?
Thanks Paul for giving me a reason to use the many spaceweather data files I’ve collected. The top geomagnetic storm rankings depend on the indice.
Unfortunately there wasn’t any x-ray flux data available from 1967 to find the size of the flare.
The 1967 solar flare’s CME magnetic disturbance at Earth reached Kp=9 for nine hours, an Ap of 146, and Dst of -387. The Dst (disturbance storm time) was below -300nT for eight continuous hours.
By comparison the 1989 event that took out Quebec’s power was more powerful in terms of Dst, reaching as low as -589, and a higher Ap of 246, which is the second highest Ap on the list since 1932. The 1967 event was 49th on the Ap list.
1 11/13/1960 280
2 3/13/1989 246
3 4/1/1960 241
4 7/15/1959 236
5 9/18/1941 232
6 7/5/1941 222
7 3/28/1946 213
8 3/1/1941 207
9 10/29/2003 204
10 10/6/1960 203
49 5/26/1967 146
50 10/21/1989 146
Confusion???????
I am looking at the top plot of sunspots. It is clearly labeled:
SIDC: Daily sunspot number
The Y-Axis has Daily sunspot labels going into the hundreds.
Pick a number, like 200 sunspots/day. scan across the chart. Many, many lines go up that high.
But we all know there is nothing like 200 sunspots/day on the sun.
I cannot be reading it *that* wrong.
That plot must be mislabeled, or misgendered or something.
What is with these plots???
Those were modeled spots. They run a little high. /s
We count a LOT more sunspots now than in the past – much, much smaller ones that could not be seen by previous observers.
As of a few decades ago, that is. Earlier “counts” are extrapolations into the past from “what are visible now using earlier methods, and what are visible now with new methods.” So assume a fair sized error range on those.
According to Dr Svalgaard, they still use the same instruments that were used from the beginning to compare with current methods.
You could’ve also concluded there was something wrong with your understanding of the SN.
Sunspot numbers have two parts: SN = 10*Ng + Ns, with Ng= # of groups, Ns= # of spots.
Accordingly, the lowest SIDC v2 SN after zero is 11, for one group (Ng) and one spot (Ns).
Anyone could’ve not known or had forgotten that definition – no biggie.
The greatest impact on Earth could come from a flare from a spot close to the solar equator, right in front of the Earth. Take a look at the current strength of the solar equatorial dipole.
For one year, we do not see a significant increase in either density or solar wind speed.
A young Danish science graduate at this time or soon after may have been stationed in Greenland to monitor USSR communications. The event could have inspired him to devote his scientific endeavour pursing solar science.
Yes you might have guessed it, his name is Dr. Leif Svalgaard.
It would be interesting to hear from good doc Svalgaard if he is around.
Not so interested in nuke fallout, I looked at SILSO numbers and AMO numbers. The frauds have hacked the numbers again, but that is besides the point:
In 132 month averages (11 years halfcycle), AMO is still high up there while SS is at about 1895-1905 ish numbers. In 264 month averages (22 year fullcycle), AMO is still climbing while SS is still falling.
Oddgeir