Guest Post by Willis Eschenbach
Over in the Tweeterverse I saw that someone said:
NASA GISSTEMP Global Mean went above 1.5C for 2 months in 2016.
Hmmm, sez I … why not since then?
So I thought I’d take a look at the major global surface temperature estimates for the 21st Century.
The datasets that I used are the surface temperature datasets of the Goddard Institute for Space Science (GISS), Hadley Climate Research Unit (HadCRUT), Berkeley Earth, and Japan Meteorological Agency (JMA), along with the Earth’s Radiant Energy System (CERES), University of Alabama Huntsville Microwave Sounding Unit (UAH MSU), and the Remote Sensing Systems Microwave Sounding Unit (RSS MSU) satellite-based datasets.
I’ve done a structural change breakpoint analysis for each one. I have not chosen the breakpoints. They are selected, and their uncertainties estimated, by the Bai & Perron algorithm implemented in the R computer language package “strucchange”.
Here they are, in no particular order:
Surface Station Datasets


Satellite Based Datasets


Clearly, there has been a sea-change in the surface temperature changes in the 21st century. For most of the last half of the 20th century, temperatures were rising on the order of 0.15°C per decade. But this century, for a good part of the period from 2000 to the end of 2014, the rate of rise of most of the datasets was much less than that.
And in all seven of the datasets, since the breakpoint before the 2015/16 El Nino, the temperatures have either been near level or dropping …
Hmmm …
One interesting note. The records fall into two groups—the CERES, JMA, RSS and UAH data have very little change up until ~ 2015. But three of the ground-station-based datasets, GISS, HadCRUT, and Berkeley Earth, have a distinct trend change around 2005. Why? Dunno … but it doesn’t increase my confidence in the ground-based data. My guess is that those three ground datasets, GISS, HadCRUT, and Berkeley Earth, are contaminated by the Urban Heat Islands or excessive “homogenization”. However, that’s only a guess.
My very best wishes to all,
w.
PS—Please do us all a favor, and when you comment, QUOTE what you’re talking about. This avoids endless misunderstandings.
PPS—Please be clear that I am not predicting the future—I am reporting on the past …
The recent decline or leveling of increase will not be widely reported, as it does not fit the narrative.
Yes, the narrative blinders on at NYC GISS, Happy Valley, UN, and the Bay Area come with very thick insulation to protect against frostbite (trending truth).
Worse, the high priests of “Climate Change” will soon start another round of fiddling temperatures past and present to erase any past warmth and massage the facts into their preferred shape. Trees will be sacrificed to give up cores from the few areas that had anomalous cooling during this warm phase and others selected from anomalous warm areas in the future. And/or, strange maths will be newly invented to change cooling into warming. Don’t laugh, please! It’s a tried and true pathway to Socialist, climate purity and righteous industrial destruction.
I don’t think one should use terms like “fiddling temperatures” unless one has their own satellites, or has spent 20 years excavating and assessing ice cores.
but that’s just me. I took , and passed, science and statistics in both high school and college.
Chris, your naivety is very sweet.
Your denial of known facts, ie data adjustment, is noted.
Had to laugh at “unless one has their own satellites”. Since no one person has their own satellites, (Musk’s don’t count as they don’t measure temperature) thus no one is allowed to comment on data adjustment. How very clever of chris.
You would benefit by visiting Tony Heller’s website and viewing the many examples he has analyzed and posted of observations and charts that have been falsified by NASA and other agencies whose trust has been lost due to their intellectual dishonesty.
Here is one example. [edit: the gif is not working. It shows the same chart for 1999 and 2016 but with significant changes that were forged by doctoring the data.]
Let me try to post the charts again.
Hansen said 1934 was 0.5C warmer than 1998.
Temperatures did not continue climbing after 1998, as Hansen expected they would do, with his belief in CO2 warming. Instead, the temperatures started cooling.
This is when the major temperature data manipulation started and these dishonest people started warming the present and cooling the past. They couldn’t demonize CO2 if it isn’t any warmer today than it was in the 1930’s, so the only way to keep the climate change science fiction going was to manipulate the data and make it look like things are getting hotter and hotter and hotter.
They manipulated the data so that they could claim that 10 years between 1998 and 2016 were the “hottest year ever!”, promoting the meme that the temperatures were getting hotter and hotter, year after year.
The UAH satellite charts shows NO years between 1998 and 2016 as being warmer than 1998.
So 1934 was warmer than 1998, and 1998 is statistically tied with 2016, so at least in the United States, we have been in a temperature downtrend since the 1930’s.
Hansen, after the cooling began in 1998, tried to downplay the warmth of the 1930’s, even though his own previous temperature charts clearly showed it.
U.S. temperature chart (Hansen 1999):
An interesting side note: At the time Hansen was saying 1934 was 0.5C warmer than 1998, he had a fellow researcher (I don’t recall his name) email him (contained in the infamous Climategate emails) confirming Hansen’s number for 1934, saying his calculation of 1934 was that it was 0.49C warmer than 1998.
I’ve always wondered what this person thought when Hansen started trying to downplay the warmth of the 1930’s, and claim the 1930’s were not as warm as 1998.
Did this person change his tune and claim 1934 wasn’t as warm as he originally calculated? I don’t know the answer to that, but if it were me, I would stick to the data I collected and would wonder why Hansen is distorting his data.
Hansen is essentially now saying this guy’s calculation about 1934 as compared to 1998, is wrong.
Here we go again with all the utterly demented “manipulated data” phony baloney.
We have natural markers of climate change that also show us a rising temperature trend since the 1930s. Things like last spring frost dates, first spring bloom dates, first fall frost dates, movements of plant hardiness zones, etc.
Even plants and the soil that they live in know there’s been a real upward temperature trend. Denier folks who pretend otherwise are therefore, literally, “dumber than dirt”, LOL.
That wasn’t me that downvoted you. I don’t do down votes.
But your “argument” *was* ridiculous and deserved to be downvoted. “the plants and the soil know”. That’s funny. That’s supposed to be a scientific argument?
If you couldn’t be insulting, you wouldn’t have anything, would you?
As usual, you blindly ignore the actual point: natural markers demonstrate that the warming trend is real, not just some phony baloney “data manipulation”.
The real insult here is deniers constantly claiming “fraud” when in reality, they are the frauds.
BTW Tom, you seem to be rather obsessed with up and down votes. Why is that?
”We have natural markers of climate change that also show us a rising temperature trend since the 1930s.”
No further comment required..
Slam dunk impossible to dispute evidence.
It’s called homologation, a well accepted scam to correct old data to align with modern measuring methods.
“I don’t think one should use terms like “fiddling temperatures” unless one has their own satellites, or has spent 20 years excavating and assessing ice cores.”
You may have passed science classes but perhaps you don’t remember them. One of the hallmarks of science is being able to replicate results and have your work tested by the scrutiny of others.
Regardless of whether adjustments to temperature data are justified or unjustified, it is Imperative that others question those adjustments, methodologies and assumptions. This can be done by any logical person versed in maths. Sometimes it takes an outsider to catch assumptions that someone in the field makes out of habit. Steve McIntyre comes to mind.
Always beware of gatekeepers and those who justify gatekeeping.
That is a bit extreme. It’s possible that some trees might be infected, but the point of coring is to avoid cutting down an entire tree to obtain the information.
not widely reported because it is meaningless. duh
yes, cooling is always treated as meaningless by warmist zealots.
Yep, I suppose in a ‘warming world’ a developing cooler trend is not worthy of mention. Ha!
Anything that doesn’t support the narrative is meaningless.
You are a natural climate variability denier. Seek help.
BEST is the worst.
Its almost as if temperature fluctuate from warming trends to cooling trends,. Who could have imagined.
RSS appears to be pointing its instrument into a different universe.
I think they are playing with their instrument !
‘My guess is that those three ground datasets, GISS, HadCRUT, and Berkeley Earth, are contaminated by the Urban Heat Islands or excessive “homogenization”.’
I’ll choose door number 2, Monty.
Btw Willis, thank you for another insightful article.
I would be tempted to go for both – the land temperature stations are a complete joke, in the main.
Thank you Willis – good article. I use UAH LT because I trust Spencer and Christy.
Excerpts from previous posts:
UAH LT global temperatures oscillate around a trend line and that trend is definitely a cooling one – since Feb2016 or Feb2020 – take your pick.
My colleagues and I are concerned about crop failures and food shortages happening ~now – major food price inflation is already a problem.
There was a huge crop failure across the Great Plains of North America in 2019 that Joe D’Aleo and I wrote about then. We are seeing the same conditions in 2022 – a cold, wet, late Spring. In 2019 fully 30% of the huge USA corn crop was never planted. There was plenty of grain in storage and good crops elsewhere so prices were stable.
We rejected the alleged global warming crisis (“CAGW” aka “Climate Change”) as false propaganda in 2002 – the alleged global warming crisis was always the “BIG LIE”, an unscientific, political fraud concocted by the extreme left – “wolves stampeding the sheep for political and financial gain”.
In 2002 we also rejected grid-connected “green energy” (wind and solar) due to intermittency and the lack of practical grid-scale storage. Nothing has changed.
“Cheap, abundant, reliable energy is the lifeblood of society”. It IS that simple.
Our society has fallen into the trap of letting idiot, corrupt politicians set energy policy. We have published against this climate-and-energy alarmist fraud since 2002 and we were correct – then and now. As we predicted, this is ending badly.
Excerpted comments from mid-March 2022:
https://wattsupwiththat.com/2022/03/15/claim-climate-change-driven-plant-growth-is-bad/#comment-3477744
Note the predictive skill of MacRae and Patterson (2002) and Landscheidt (2003), who predicted cooling based on solar activity ~two decades before it started.
Cooling is here now – as evidenced by the hundreds of significant very-cold events worldwide, documented by Cap Allon at Electroverse.net.
Some say global cooling started in Feb2016 but that was the peak of a huge El Nino, so I prefer Feb2020. In either case my 2013 prediction of global cooling starting within ten years is still correct.
Even the moderate cooling observed to date can be dangerous, because global cooling is accompanied by deviations of the polar vortex that destroy humans and crops – such as the extreme cold in south-central USA in Feb 2021 and the recent extreme cold in India and China that cost many lives.
Our cooling predictions from 2002 and 2013 are described here:
https://correctpredictions.ca/
Told you so! We’ve been predicting this slow-motion train wreck since 2002.
This is ending badly. I would much rather have been wrong.
[Insert very strong expletives here]
COLD SPRING KEEPING N.D. MOSQUITOES AT BAY–FOR NOW; PRIME CORN YIELD ALREADY GONE; ‘BLUE BLOB’ HAS HALTED ICELAND/GREENLAND MELTING; + SULINA CANAL RESTRICTED
May 12, 2022 Cap Allon
Zelenskyy has again urged the international community to stop the Russian blockade of the deep seaports of Ukraine citing the threat to the world food supply.
[excerpt]
PRIME CORN YIELD ALREADY GONE
Corn farmers across the much of the U.S. are unlikely to net high yields this year because their planting has been delayed significantly by cold and rain, according to an Iowa State University agronomist.
The impact of that delay will depend heavily on farmers’ progress over the next 10-14 days. If the weather doesn’t play ball (which, going by the chart above, it doesn’t look like it will) then it’s all by game over for U.S. corn.
Mark Licht, an ISU Extension cropping systems specialist who studies yield trends, believes that the current delays have already reduced yields: “I think we’ve already taken the top end off of it. How much is yet to be determined.”
Heading into this week, corn planting across the state was about two weeks behind the five-year average, the slowest planting pace since 2013, said Greg Thessen, director of the USDA’s National Statistical Service for the Upper Midwest.
Just 14% of seed corn was in the ground as of Sunday –thanks to persistent rains since the middle of April and cold soil temperatures– compared with the average of 63%. The ground needs to average about 50F for proper sprouting, yet we still have many regions having to contend with hard frosts.
The best corn crops are planted before mid-May, and that it’s all-but game over if planting pushes into June.
What a pseudo-scientific joke MacRae. The trends that you are pointing to in order to pretend (LIE) that you have made “correct” predictions are far too short to be representative of any genuine long term “cooling” trend.
Moreover, you completely ignore the fact that during your short term so-called “cooling” period, huge amounts of heat have accumulated in the oceans. So the globe as a whole is still very much in a warming trend. (In case you weren’t aware, the oceans are part of our globe). “Cooling”? Oh please.
Much of that accumulated ocean heat will be released to the atmosphere as soon as the next major El Nino comes around. When that happens, we’ll witness yet another round of record HIGH air temperatures. Given the magnitude of the ocean heat accumulation, it is almost a guaranteed certainty.
Sorry, but in leaving out vital ocean factors entirely, your “analysis” is nothing but pseudo-scientific handwaving nonsense.
MGC – DELUSIONAL SOCIOPATH?
Science doesn’t work the way you think it does.
Science is not all about YOU, YOUR hissy fits, YOUR jumping up and down, YOUR screaming and having a little zzzt in your pants.
Science requires competence and evidence, not your childish rants and temper tantrums.
You may not know it, but you are following Lenin’s plan to destroy the Western democracies.
You and your fellow-travellers are behind Door #2:
2. “It is, of course, much easier to shout, abuse, and howl than to attempt to relate, to explain.”
How do I say this nicely? Go vaxx yourself!
Regards, Allan
Lenin wrote: https://www.azquotes.com/author/8716-Vladimir_Lenin
[excerpts]
– NNB #1 to 7 – the strategy to subvert our free society
– NNB #2 – why alarmists don’t debate climate or covid science – they just shout-down realists.
– NNB #5 – crush the middle class with taxation and inflation – what is happening now, via government over-spending.
1 “People always have been and they always will be stupid victims of deceit and self-deception in politics.”
2 “It is, of course, much easier to shout, abuse, and howl than to attempt to relate, to explain.”
3 “Democracy is indispensable to socialism.”
4 “The goal of socialism is communism.”
5 “The way to crush the bourgeoisie is to grind them between the millstones of taxation and inflation.”
6 “Trust is good, but control is better.”
7 “As an ultimate objective, “peace” simply means communist world control.”
WHAT THE GREEN NEW DEAL IS REALLY ABOUT — AND IT’S NOT THE CLIMATE
https://wattsupwiththat.com/2019/07/20/what-the-green-new-deal-is-really-about-and-its-not-the-climate/
THE LIBERALS’ COVERT GREEN PLAN FOR CANADA – POVERTY AND DICTATORSHIP
https://wattsupwiththat.com/2019/10/01/the-liberals-covert-green-plan-for-canada-poverty-and-dictatorship/
Such a typical WUWT denier cultist “response”. Totally ignore the fact that your pseudo-scientific “correct predictions” yammerings were totally ripped to shreds by real science. Real science that you ignorantly just pretended away with “childish rants and temper tantrums”.
And then, instead of facing the music like a man of integrity would do, you launched instead into off-topic rants about the “Green New Deal” and “communism”.
The facts remain unchanged: because the oceans have continued to accumulate heat, there has been no actual global “cooling” trend at all. Your so-called “correct predictions” are nothing but false pseudo-scientific nonsense. A complete and total failure.
Sorry that your anti-science denier brainwashing does not allow you to accept this reality.
No point in arguing with an innumerate.
It appears that a huge cold-and-wet crop failure is developing across the Great Plains in 2022, just as happened in 2019 and just as we predicted in 2002, 2013 and 2019.
THE REAL CLIMATE CRISIS IS NOT GLOBAL WARMING, IT IS COOLING, AND IT MAY HAVE ALREADY STARTED October 27, 2019
https://wattsupwiththat.com/2019/10/27/the-real-climate-crisis-is-not-global-warming-it-is-cooling-and-it-may-have-already-started/
“The Catastrophic Anthropogenic Global Warming (“CAGW”, aka “Global Warming”, “Climate Change”, “Climate Crisis”, “Climate Emergency”) scare is a failed hypothesis and the greatest scientific fraud in history.”
I’m not the one who is innumerate here, bub. You’re the one who left out the heat accumulated under the ocean surfaces (and have continued to do so) in your silly and totally false “cooling” claims.
And that 10-27-2019 reference you just posted is one of the craziest spews of denier cultist garbage I’ve ever seen. So many gross misrepresentations, cherry picked half-truths, and just plain old outright LIES.
My co-author in the above October 27, 2019 paper is Joseph D’Aleo, Co-Chief Meteorologist with Weatherbell Analytics. Joe was the founding Director of Meteorology of the Weather Channel and is one of the top professionals in his field, based on his excellent predictive track record.
_______________________________
One more of our successful predictions to brag about, this one in Autumn 2014:
You may recall that winter, when Boston and much of the USA Northeast was snowed-in.
CORRECT PREDICTIONS SCORE TO DATE
IPCC and acolytes: 0
Us (“climate deniers”): Beaucoup.
SCIENTIFIC COMPETENCE – THE ABILITY TO CORRECTLY PREDICT October 20, 2021. Update May 12, 2022
https://correctpredictions.ca/
“The ability to correctly predict is the best objective measure of scientific and technical competence.”
Our scientific predictions on both Climate and Covid are infinitely more accurate than the mainstream narratives, which have been false and baselessly alarmist to date.
Prior to the record snowfall in the winter of 2014–15, Joe d’Aleo and I sent a written warning to my friend, the Head of the Energy Information Administration (EIA), stating that the National Weather Service (NWS) weather forecast that EIA used was extremely in error, and warning of a very cold and snowy winter to come, especially for the Northeast Coast.
The EIA reran their lower 48 USA energy demand for that winter using Joe’s forecast and calculated an additional 11% total energy required for the winter months. The actual energy consumption were one percent lower than Joe’s forecast and 10% higher in the NWS forecast. That is a huge amount of energy.
I do not know what contingency the EIA uses, so I don’t know if we saved any lives. Nevertheless, I believe we did a good deed and we may have indeed significantly reduced human suffering.
In summary, if you want an accurate weather forecast, go to WeatherBell, not NWS.
Whoop-T-do. So you got one winter prediction right for one single year, eight years ago. BFD. You probably got nine others wrong but just haven’t mentioned them, LOL.
Meanwhile, MacRae continues to LIE with his ludicrous claim of a “correct” cooling prediction. There is no such genuine global “cooling” trend occurring, because heat has continued to accumulate in the oceans. And we also already know from past experience that the upward trend in air temperatures can “pause” for fairly significant periods before resuming.
And the upward trend will resume. It can only be a matter of time until that ocean heat is released to the atmosphere with the next major El Nino. Very likely sometime in the next five years or so.
MGC –>. “You probably got nine others wrong but just haven’t mentioned them, LOL.”
PROBABLY? That’s real important evidence you have there.
”The facts remain unchanged: because the oceans have continued to accumulate heat, there has been no actual global “cooling” trend at all.”
Where is the heat coming from?
a/ From the atmosphere and/or surface? – No, we can clearly see that is not the case at the moment.
b/ From the bottom of the ocean?
c/ From outer space but somehow directly into the oceans without warming anything else?
d/ From some kind of secret underwater energy generating experiment?
”during your short term so-called “cooling” period, huge amounts of heat have accumulated in the oceans. So the globe as a whole is still very much in a warming trend”
No. You are a moron.
Once again, Mike sadly demonstrates his woeful and no doubt intentional ignorance of this topic with yet another mindless “Nuh Uh because I say so” babble of pure stupidity.
See attached graph. Yes, heat has continued to accumulate in the oceans all throughout this so-called “pause”. Just like it did all throughout the previous “pause”.
Heat accumulation in the oceans is why real scientists (denier cultists of course not included) knew that it had to be only a matter of time until the prior “pause” ended, and also know that the same thing must occur sooner or later with the latest “pause”.
But sadly, anti-science anti-reality denier cultists foolishly continue to pretend otherwise.
There is NO ocean warming in the Northern in Hemisphere in the ARGO era. Your one claimed (tiny) supporting parameter is not significant. May not even be accurate.
Much more significant is falling atmospheric temperatures since Feb2016 or Feb2020 (take your pick) and major crop failures across the Great Plains in 2019 and probably again in 2022 and elsewhere, and runaway food costs and imminent global food shortages.
I foresee you bleating “tiny ocean warming in the Southern Hemisphere” to the millions starving in the third world. Try telling that to people whose kids are hungry and have swollen bellies from malnutrition – better do your BS from a safe distance, like your “safe space” in your basement. You don’t even post under your own name. Just one more climate BS-er!
Comments on Riser et al (2016) – An Infomercial about the ARGO Program – Watts Up With That?
Ocean Heat Content (0 to 2000 Meters) – Why Aren’t Northern Hemisphere Oceans Warming During the ARGO Era? – Watts Up With That?
Krige the Argo Probe Data, Mr. Spock! – Watts Up With That?
New paper on ARGO data: Trenberth’s ocean heat still missing – Watts Up With That?
Speaking of “anti-science anti-reality denier cultists” , here’s MacRae, LOL! He begins his sorrowfully inept denier screed by bleating:
“There is NO ocean warming in the Northern in Hemisphere in the ARGO era.”
Another typically dishonest cherry pick in order to intentionally obfuscate and lie. Look at only one hemisphere and blindly ignore the fact that the ocean in the other hemisphere was accumulating heat content very rapidly.
And in order to really, REALLY look like a stupid anti-science fool, look only at the time period 2005-2012. That was ten years ago, pal !!
This is your “evidence” ?? OMG LOL !! What a comically laughable joke !!
And sorry, bub, but the ocean warming is not “tiny”. It is several times larger heat content than what has been warming the atmosphere. Yet again, you demonstrate that you have no clue what you are talking about. None.
“more significant is falling atmospheric temperatures since Feb2016 or Feb2020”
Ha ha ha ha ha ha ha. Yet another regurgitation of this pure 100% fairy tale nonsense all over again, pretending that a mere short term fluctuation (with a dishonestly cherry picked start date right after the latest El Nino maximum, to boot) is somehow “evidence” of a long term cooling trend … a “cooling” trend which we already know does not even actually exist on a global scale because large amounts of heat have continued to accumulate in the oceans. Heat that will be released to the atmosphere whenever the next major El Nino comes along. Heat that will propel us to new record high global temperatures.
You’re a delusional pseudo-scientific fool, MacRae.
MGC May 15, 2022 8:32 am
First off, could you dial back on the personal insults? They’re not doing your reputation any good, and they’re a sign you are unsure of your claims so you feel the need to buttress them with insults. Not a good look on you.
Second, it seems you believe in the ocean heat content estimates. Me, not so much. Here’s an example of the ocean heat content claims.
Now, that looks all sciency … but just how big is a zetajoule, and what is the resulting temperature change?
Well, a zetajoule (ZJ) is 10^21 joules. In the 51 years since 1970, the claim in the graph is that the OHC has changed by about 350 ZJ. And here’s a calculation of the annual change shown in that graph. Everything after a # is a comment
Now, perhaps you think it is possible to measure the temperature of the top 2000 meters of the ocean to an annual precision of 0.003°C …
Me, I think that’s bull goose looney. That’s far more precision than is claimed for the surface temperature. But we have far, far fewer measurements of the ocean depths than of the land surface, and the ocean is 3-D, not 2-D like the land surface temperature.
Recently, most of this is ARGO float data. There are about 4,000 ARGO floats. They take one vertical survey every 10 days. Surface area of the ocean is about 370 million square km. So that’s one float per 92,000 square km.
So that’s one temperature measurement every ten days of an area the size of Portugal … but heck, you’re free to believe that taking 36 temperature readings per year at one location in Portugal will give you the annual temperature change in Portugal to the nearest 0.003°C …
Me, I’ll pass on swallowing that whopper.
I discussed this issue further a decade ago in my post “An Ocean Of Overconfidence“.
w.
WE –>. Excellent description. This fellow has no idea what measurement uncertainty is all about. I doubt he will understand why temperatures to 3/1000th of a degree is so far within the uncertainty interval there is no way to discern readings to that resolution.
Good thoughts, thank you Willis.
I’ve been studying this subject since 1985 and publishing since 2002, and I am tired of all the blatant warmist falsehoods. I’ve updated my latest paper several times, but most of the new content is Covid, because scientifically, Climate is an almost-closed issue. Either Earth is cooling and we were correct, or it starts significantly warming again and we were wrong. I would prefer to be wrong. Cold is bad. Warm is good. CO2 is good. End of debate.
My colleagues and I are most concerned about another crop failure across the Great Plains this year due to a late, cold and wet Spring and Summer, and global food shortages that will greatly impact the poor of the world. The USA corn crop is looking doubtful, as I wrote in mid-March, based on the cold Nino34 SST. Crop failures and floods have occurred in large areas of the world. The war in Ukraine impacts grain exports from Ukraine and fertilizer exports from Russia.
There are reports of fires at ~20 food processing plants across the USA – many swimming-pools of scorched popcorn? The FBI is reportedly investigating this strange occurrence.
Best personal regards, Allan
Here we go again with this tired old denier excuse that disingenuously ignores the central limit theorem in order to arrive at false “conclusions”. Yep, let’s just throw Elementary Statistics 101 right out the window.
Not to mention that there are multiple methods other than Argo temperature measurements for making reasonable estimates of the ocean heat content increase; methods that find results similar to the Argo measurements. (see, for example, Meyssignac et al., 2019)
Bottom line: the increase of ocean heat content is not only very real, but has been identified via multiple different methods that yield similar results. Pretending otherwise as you folks are trying to do here is nothing but intentionally ignorant pseudo-scientific jibber jabber.
So I’m sorry, but I’ll accept what measurement professionals from all over the world have said about this topic in the published scientific literature. Measurement professionals who do not ignore the central limit theorem and who have corroborated the Argo results with multiple supplementary methods.
re: “they’re a sign you are unsure of your claims”
Sorry, but yet again, no. They are an indication of an appropriate level of disdain registered for the ridiculous pseudo-scientific nonsense to which I am responding … from folks who should know far better.
MGC, thanks for the link to Meyssignac et al. It gives an analysis of the sources of uncertainty.
Here are the seven sources of uncertainty that they list:
I note that they don’t include the uncertainty in the precision of the measuring instruments, or the drift in the instruments, but we’ll let that be.
The Meyssignac study gives results for 6 different analyses of the 0-2000 metre layer. Care to guess how many of them include all seven of those sources of uncertainty?
…
None.
How many include six of the seven sources of uncertainty?
None.
How many include five of the seven sources of uncertainty?
None.
One of the six includes four of the seven sources of uncertainty.
Two of the six include two of the seven sources of uncertainty.
Three of the six include only one of the seven sources of uncertainty.
They also use an outdated method (Von Storch and Zwiers) for adjusting for temporal and serial correlation. This leads to an underestimation of the actual uncertainty. There’s a good discussion of some of these questions here.
From the study:
You seem to be impressed by this. Me, not so much.
Regards,
w.
Here’s a simple little exercise for you to do, Willis, which demonstrates the lack of insight in your ignoring the central limit theorem, which leads to your falsely concluding that the instruments don’t have sufficient precision and that there is too much uncertainty:
1- generate 4000 random 2 digit numbers to 6 decimal places. Example: 49.583726. These values will represent the “actual” temperatures at 4000 Argo locations, were we able to measure each of them to within a millionth of a degree.
2- round each of those 4000 values to 1 decimal place. Example: 49.583726 is rounded to 49.6. These 4000 rounded values represent the temperature values as measured by instrumentation that has 0.1 degree precision.
3- Calculate the mean value of the 4000 “actual” temperatures and the mean value of the 4000 “measured” temperatures. You’ll find that the mean of the “measured” values accurately represents the mean of the “actual” values to 3 or 4 decimal places, despite the fact that no single measurement is capable of any better than 1 decimal place precision.
So no, a precision of 0.0026 degrees for every single Argo measurement is not required as you have been falsely trying to pretend. Your “objections” to the Argo ocean heat content data as having “too much uncertainty” continue to be based on incorrectly ignoring the central limit theorem.
You’ve been pretending all along that this amateurish and incorrect “analysis” of yours somehow allows you to “know better” than measurement professionals from all over the world.
This little exercise demonstrates how the network of 4000 Argo floats can indeed be capable of measuring the ocean heat content increase. Pretending otherwise remains nothing but intentionally ignorant pseudo-scientific jibber jabber.
I am more than familiar with the Central Limit Theorem and the Law of Large Numbers. So your claim that you can read my mind and discern what I do and don’t know is a joke.
More to the point, in their study they identified seven different sources of error, plus there is always instrument precision and drift. NONE of these sources of error are included in your childish Statistics 101 example above.
Your absurdly simplistic example also assumes that the errors are symmetrical around the true answer … a situation that rarely occurs in the real world.
Finally, your example does not include autocorrelation, which GREATLY increases the error of a time series of measurements.
So your example has exactly nothing to do with the real-world problem of measuring the average temperature of the ocean.
All you’ve done is prove that you truly don’t understand the complex issues involved in the estimation of uncertainty.
Best regards,
w.
Yes, I realize fully that is an “absurdly simple” example, yet it is far, far closer to the truth than what you’ve written, pretending that 0.0026 degrees C precision of individual measurements is required, when in reality no where near that level of precision is necessary.
And by the way, I never stated that you were “not familiar” with the Central Limit Theorem and the Law of Large Numbers. I stated that you ignored them in your “analyses”, and by doing so you arrived at false, incorrect “conclusions”.
You always make accusations with no proof. Let us see your proof that the:
You should have no problem doing the calculations.
BTW, just what distributions do you think that the CLT applies to.
Really? You’re not aware that the CLT applies to any distribution of randomly distributed data?
Of course it can be used on any distribution in order to obtain a sample distribution that is normal. So how does that apply to your comment:
Please show where they have not ignored the CLT in estimating uncertainty. You are quick to make assertions with no backup. Show some backup.
You don’t even know what you don’t know.
Explain how the CLT even applies to uncertainty in measurements. WE is trying to show you something and you just fly off into other directions.
Maybe you can get the international bodies that write the GUM to modify the document to include the CLT as a method to analyse uncertainty.
DO the exercise. Stop wallowing in your cesspool of intentional ignorance.
Funny how you never answer pointed questions isn’t it? I wonder why!
Funny how you never realize that if you’d just gone and done the exercise as I’d suggested, instead of babbling away like a fool, you would already understand the answers to your questions.
Willis was too nice to you. You have obviously had no training, experience, or learning in metrology (note: not meteorology).
Your inability to refrain from denigrating comments and to make cogent, logical arguments using logic and mathematics and references explicitly point to your lack of proper education.
1) If you had proper training in statistics you would know generating “random” numbers results in a Gaussian distribution, i.e. normal. That is equal values below and above the mean. No kurtosis, no skewness.
2) Rounding data that is already Gaussian in nature does nothing. See Item 1.
3)Of course the means of whatever Gaussian distribution you start with or create from the members of that distribution will end up with the same mean. It is baked in from the start.
Your mention of the Central Limit Theory shows you have no idea of how it works or what the assumption behind it are.
Go to this location. https://www.probabilitycourse.com/chapter7/7_2_4_convergence_in_distribution.php
Read carefully. It says the following:
Why do so many people quote that the LLN can be used to know that an average of temperatures gives an accurate average? Because they have read something like this when reading about the strong LLN.
Remember, X1, X2, X3, … are really the means of each of various samples taken from the entire population. They are NOT the data points in a population. This is an extremely important concept. Many folks think the sample means and the statistics derived from the distribution of sample means accurately describe the statistical parameters of the population. They do not!
Also, check out what IID means and how to get them.
Jimbecile,
Thanks for so tragically demonstrating that you are the one here who has no idea what he is talking about. Every one of your points is completely wrong.
1- “If you had proper training in statistics you would know generating “random” numbers results in a Gaussian distribution”
Right off the bat, wrong. You can generate any type of distribution you want. When I did this example for myself, I generated 4000 two digit numbers from a uniform distribution. Every value from 0.000000 to 99.999999 was equally likely.
2- “Rounding data that is already Gaussian in nature does nothing.”
It’s not necessarily Gaussian, so guess what: wrong again. Not to mention that rounding does not “do nothing”. It decreases the precision of the data. And precision is central to what we are talking about here. So guess what: wrong again.
3- “Remember, X1, X2, X3, … are really the means of each of various samples taken from the entire population”
Can’t you get anything right? Anything? Read your own reference again:
“X1, X2, X3, ⋯ is a sequence of i.i.d. random variables”
Sorry, X1, X2, X3, etc. are not “means of samples”. They are individual random variables.
Please note what you said originally.
You again betray your math only background and lack of metrology. Why would you expect measurements to have a uniform distribution? Did you convert the random numbers to a Gaussian distribution like what you would obtain from a series of measurements? If not, you have proved nothing.
Again, no metrology training, right? You are not decreasing precision, you are reducing the resolution. Precision is how uncertain repeated measurements are. IOW, how well does a measuring device perform repeated measurements. Resolution tells you the ability of an instrument to smaller and smaller increments.
I’ll say it again, as I have said here before. You can not add information to multiple measurements with a given resolution by averaging. Creating new information by adding decimal places through calculations DOES compromise the integrity of what the measurement portrays.
Your little experiment also doesn’t address the uncertainty that occurs with every measurement.
Exactly how is a variable calculated? Why do you think it is called a variable and not a single data point?
For the purposes of that exercise, any random distribution of two digit numbers will do. Sorry that you apparently don’t understand this. It is 4000 numbers that, for the purposes of the exercise, are chosen to represent 4000 individual Argo float temperature measurements.
And OK, fine, call it resolution.
“You can not add information to multiple measurements with a given resolution by averaging”
Another demonstration of a lack of understanding of the central limit theorem, and a lack of understanding of the difference between individual measurements and the mean of those measurements.
Do the exercise … and actually learn something for a change.
“Your little experiment also doesn’t address the uncertainty that occurs with every measurement”
Wrong yet again. In this exercise, rounding a value with six decimal places of “resolution” to only one decimal place is the method used to introduce “the uncertainty that occurs with every measurement”.
It’s really unbelievable how WUWT cultists like you can so comically, yet tragically, continue to pretend that you “know better” about climate change than some of the top scientific professionals in the whole world, while at the same time demonstrating such a total lack of even basic understanding.
Oh brother, you are way out of your league.
Show some references to how the CLT applies to the mean of measurements. I am especially asking for references on how the CLT applies to multiple measurements of different things by different devices.
BTW, you haven’t shown how you converted those random numbers from a uniform distribution into a Gaussian distribution.
Keep it up. You are continuing to confirm that you have absolutely no training in metrology and barely any in statistics. Have you ever wondered why others have not jumped on your bandwagon?
I made a mistake by even trying to educate you as you are an advanced TROLL. We are done here if you can not show some references for your assertions.
Everything I’ve spoken about here is easily demonstrated as completely correct by simply doing the exercise.
So go do the exercise already. Actually learn something for a change. Stop wallowing in your willful ignorance.
“Have you ever wondered why others have not jumped on your bandwagon?”
Ha ha ha ha ha ha ha !! Every major scientific organization in the entire world is in agreement on the statements I’ve posted. They are not anti-science cultists like you and your fellow WUWT sheeple.
MGC May 17, 2022 10:31 am
Here’s the exercise. I generate a fractional Gaussian noise (FGN) dataset with a length of 100,000 and a Hurst exponent of 0.9.
I then take the mean of each of 10,000 samples of the FGN dataset, each sample being 10,000 points long.
Here is the R code:
require(longmemo)
require(lawstat)
require(tseries)

thefgn=simFGN.fft(100000,.9) # create FGN data
samplen=1000 # sample length
themeans=sapply(1:1000,function(x) {
	(thestart=sample(1:(100000-samplen-1),1)) # pick a random starting point
	mean(thefgn[thestart:(thestart+samplen-1)]) # calculate the mean
})
And here is a histogram of the results. Remember that the mean of the FGN dataset is zero …
Obviously, this is both wildly non-normal and is a long way from the true mean of the data.
I will leave it to you to tell us just why this result is so far from normal, since you claim a deep understanding of the CLT.
w.
Excellent!
At a guess, you are taking non-independent samples from non-stationary data.
If I take large samples randomly from the noise
samplen=10000
themeans=sapply(1:samplen,function(x) {
    mean(thefgn[sample(1:100000, samplen)])
})
I get a much more normal distribution.
Willis’s example is irrelevant to this particular discussion because it is a time series. The classical central limit theorem does not apply to a time series. The data points are not independent of one another.
What I’m talking about is a single set of 4000 independent Argo measurements that are all taken at one particular time. The mean of that dataset can be known to 3 or 4 decimal places, even if every single data point is known to only 1 decimal place.
Willis is conflating two extremely different things, and possibly even doing so on purpose, in order to continue to evade reality.
And Goofy Gorman just nods along in clueless agreement with Willis’s off-the-mark example, LOL.
Willis also says:
“I note that they don’t include the uncertainty in the precision of the measuring instruments, or the drift in the instruments, but we’ll let that be.”
Oh please. You really want to pretend that such items would not be included under “quality control” or “bias correction” ? C’mon.
Moreover, even if the uncertainty of these measurements was several times larger than what was quoted in this paper, these results would still be more than sufficient to demonstrate significant ocean heat content increase.
Your “objections” once again just look like more amateurish ankle biting to me.
“Quality control” does not improve the precision of the instrument, or the drift in the instruments.
“Bias correction” MIGHT or might not include the drift, but assuredly won’t improve the precision.
I merely pointed out that they hadn’t dealt with either in their study.
w.
Quality control and bias correction can’t “improve” instrument precision or drift, but they do account for those sources of error.
So yes, they did “deal with” these factors.
Willis, I also noticed this statement in Meyssignac et al. 2019:
“A careful comparison between [satellite] altimeters and tide gauges at hundreds of tide gauge sites (Valladeau et al., 2012; Watson et al., 2015) indicates no significant bias between altimeters and tide gauge records at global scale with a RMSE of 0.4 mm/yr (5–95% CL) over 2002–2017.”
So much for that other false claim you’ve been bandying about, that the satellite sea level data “doesn’t match” the ground based tidal gauge data.
Thanks, MGC. As you point out, I’ve been claiming that the satellite-derived rate was too high.
The Watson et al. paper says (emphasis mine):
So their conclusion is that the satellite-derived rate is too high … funny, where have I heard that before?
They also say:
I’m definitely seeing that the claim of an uncertainty of 0.04 mm/yr is … well … let me call it “optimistic”.
This also shows that Meyssignac et. al are wrong when they say:
In fact, I knew Meyssignac et. al were wrong as soon as I read the quote … how could a paper from 2012 and another from 2015 tell us anything about bias between satellites and gauges from 2002 to 2017? …
Regarding the second study, the difference between tide gauges and satellite data is stunning … for example, they looked at specific points in time to compare instantaneous satellite and tide gauge records. Regarding this process, they say:
Say what?
First off, regardless of whether the ocean is “strongly variable” or not, the two methods should give the same answer.
Second, it means that there are accepted differences of up to 11.9 cm (~ 4.5 inches) between the satellites and the tide gauges … and this is supposed to be giving us trends accurate to ±0.4mm?
Really?
Next, they say:
Wait, what? It turns out that in some unknown number of locations, the R^2 of the time series of the sea surface height as measured by tide gauges and satellites is less than 0.5 … but instead of wondering just why that might be, they just throw out those inconvenient locations and keep going.
Science at its finest. They go on:
Once again, rather than saying “why is the standard deviation of the differences greater than 10 cm (4 inches)?”, they just throw out the inconvenient facts and bulldoze ahead. In addition, it means that somehow the difference between tide gauges of up to 10 cm (4 inches) is accepted as valid data …
Finally, from their conclusions:
Despite claims that the satellite data is accurate to ±0.4 mm/year, the error margin of their method to check drift has an error margin of ±0.5 mm/year and differences between satellite and tide gauge measurements are up to 12 cm (4.7 inches) … seems incongruous.
They also find a huge drift of “almost -2 mm/yr” for the Envisat data, and they also highlight unspecified “TOPEX-A anomalies” and “regional discrepancies observed between Jason-1 and Envisat MSL”
So I’d say that in fact, those papers support rather than contradict my statements about the errors in the satellite data …
w.
Even if (key word: “if”) we accepted a lower sea level rise rate value, we are still left with increasing ocean heat content. There remains a steric component of sea level rise due to thermal expansion of warming ocean waters.
Increasing ocean heat content remains quite real, despite ankle biting denier “objections” that try to pretend otherwise.
You are making an assertion that has no basis. Please provide your calculations that show the “heat” gained in the oceans result in a certain value of sea level rise. A reference to a paper showing this would also be helpful.
I also asked about how this heat was measured in a body of water. As you know water has latent heat which means it doesn’t translate into measurable temperature. So just how is the heat you refer to being measured?
Why can’t you calculate this yourself, Gorman? It’s not difficult.
Here’s a simple first order calculation:
dh=(1000bE)/(rcA)
where:
dh = sea level rise in millimeters
b = volumetric coefficient of expansion of sea water 210 x 10-6/ oC
E = ocean heat content increase (since 1970, to 2000 ft depth)
350 x 1021 J
r = density of seawater 1025 kg/m3
c = heat capacity of seawater 3850 J/kg- oC
A = ocean surface area m2 360 x 1012 m2
dh = (210 x 10-6)*( 350 x 1021)/[(1025)*3850*360 x 1012)]
dh= 51.7 mm.
As a first order estimate, somewhere around 52 mm of the sea level rise over the past 50 years, or roughly half of all sea level rise over that time period, would be due to thermal expansion, driven by heat content increase of sea water to 2000 m depth.
So, about 1mm per year. We’re all going drown!
You might also explain where the other “half” came from! Is water being created somewhere?
re: “You might also explain where the other “half” came from”
You really like being deliberately dumb, don’t you, Gorman.
Try glacial retreat.
Here is a page that succintly summarizes what is needed to use the CLT. How many of the four conditions are actually met.
https://cnx.org/contents/7mUmR30Q@1/Central-Limit-Theorem-Assumptions-and-Conditions
Perhaps you would like to read this page.
http://homepages.math.uic.edu/~bpower6/stat101/Sampling Distributions.pdf
Please note what random variables are when using the CLT.
Pardon, the link didn’t copy right or I did it wrong. It should be:
http://homepages.math.uic.edu/~bpower6/stat101/Sampling Distributions.pdf
DO the exercise. LEARN SOMETHING FOR A CHANGE.
Those doors are orthogonal, and both true.
If you look globally, the warming of earth is really minimal. Especially in the SH. The main warming is in the arctic areas.
I recently saw a program where they took a skeptic on a journey to see ‘climate change’. They took the good man somewhere to Alaska where there once was a towering glacier which is now a lake, and somewhere where the permafrost has melted resulting in putrid blisters from the past that also put more CO2 in the air. And then he reasons (smartly!) that if that is vegetation from the past that is now rotting, does it not prove that it used to be warmer there too? And then they tell the poor man that the warming in the past (in the Holocene) was much slower than it is now.
I think they might be somewhat right about that (excluding Eddy). It was also reasoned there that (this time) it can’t be the sun, because of its declining activity. That reasoning is correct, that’s actually my argument as well. (click on my name).
But my argument is that if it is the differential of temperature between the equator and the polar region that is driving the ‘wind’, then I do not understand why it is not warming in Antarctica as well, because it is colder there, isn’t it? But it hasn’t really gotten any warmer there in recent decades.
So the question really is: where does this (strong) warming in the areas within the arctic circle come from? The answer to that question – in my opinion – is that it comes, or has come, from the Earth itself. We all know about two major volcanic eruptions in Iceland and I think there has been more volcanic activity in the Arctic Oceans as well. I suspect that the extra volcanic activity of the earth is also more cyclical, and that it corresponds to those peaks of the 1000 year Eddy cycle. And those peaks are very sharp, going up, but eventually also sharply coming down. It looks very much that we are seeing a peak in the warming, exactly at around the same time where Eddy/ me predicted /predicts it to be…..
The 1000-year Eddy cycle | Bread on the water
Sorry. My name should have been linked to this report:
https://breadonthewater.co.za/2022/03/08/who-or-what-turned-up-the-heat/
HenryP
Sorry, but this article you reference is nothing but pseudo-scientific hogwash. It is chock full of anti-science falsehoods. Some examples:
“The Gas Law (PV=nRT) implies that due to the diffusion and equal dissipation of the extra CO2 into our atmosphere, especially TOA, the rate of warming of earth must be the more or less the same wherever you measure.”
Wrong. Ocean water has higher heat capacity, so even if the warming influence is exactly the same everywhere, areas of water coverage (like the southern hemisphere, which is largely water) will warm more slowly … which is exactly what has been observed.
“The results of my investigations revealed that one of the most probable causes for the extra warming of earth could be more volcanic activity, especially in and around the Arctic.”
Current volcanic activity releases nowhere near enough extra heat to have caused the observed warming. It is literally orders of magnitude too small. Why did you not bother to check the numbers before making such a completely unjustified claim?
I think the most rational explanation for long term cycling of temperatures and sea ice in the Arctic is that the Arctic ocean gradually warms up during periods of extensive sea ice, which increases albedo and thus is self sustaining. The ocean warms and gains tremendous enthalpy. Eventually that enthalpy overcomes the higher albedo and a long term period of ice reduction starts.
After a number of years the ice reaches a minimum state at which the heat loss from the ocean is maximized in the long sunless Arctic winters, and the ocean loses a great deal of its accumulated enthalpy. This heat loss process is increased by the high Arctic winds over the surface of the oceanwater causing greater mixing
At this point the ice begins to grow again, increasing albedo and protecting itself from the effects of wind and mixing. As the ice grows over years toward its maximum extent, the ocean begins to slowly warm, most likely from water intruding from the N. Atlantic and/or N. Pacific.
Long term cycling of Arctic ice extent and thickness seems to me to be a very predictable phenomenon. This also causes the Arctic air temperature to vary from a very cold “continental” condition to a much warmer “marine” condition” such aa we have seen recently.
We arrive at the point where the Arctic ocean has reached its minimum temperature and the ice extent and thickness are beginning to grow again
Not only does this cycling have a bearing on our understanding of climate variation in shorter periods ( perhaps such as the Little Ice Age) and the present recovery from that period, but it will also be a factor in the exact timing of the onset of glaciations.
I believe glaciation also results in the elimination of the Bearing Sea passage, and so would cut off any entry of warmer Pacific water, which I believe is what ends the Arctic maximum ice condition. Extensive ice increases albedo and without entry of warmer water, the ice won’t go away until orbital and inclination conditions overpower that albedo.
The nonsense about today’s insignificant climate change is obscuring what we could be learning about glacial periods, which would likely mean the end of civilization if we aren’t able to stop it or adapt in some way. Much of the world’s food is grown in areas that would be nearly uninhabitable during a glaciation.
Good comment. Let me think about it.
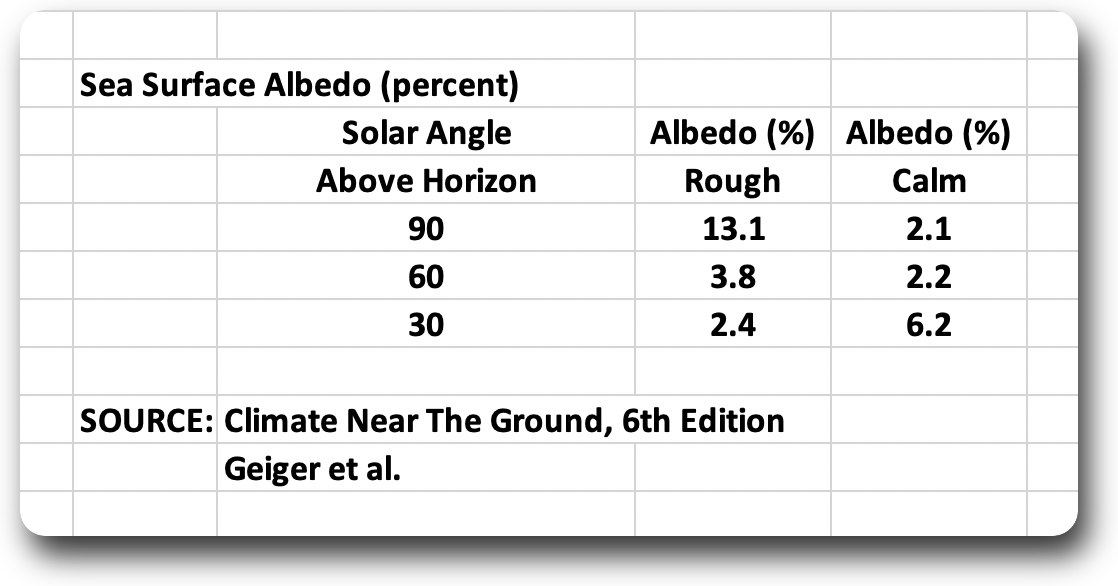
Except that sea ice increases albedo by only a small amount, if at all. At low angles, sea water reflects most of the sunlight hitting it.
I think Mark is right. I don’t think albedo is a big factor, not at that latitude.
I hate to break this to you Mark, but due to waves, the sea surface absorbs a lot of the sunlight striking it even at low angles. If it didn’t, the ocean horizon would appear to be reflective like a mirror instead of dark like, well… ocean. However we are trained in school to accept the laws of still water refraction and reflection without question…..
see fig 5
https://agupubs.onlinelibrary.wiley.com/doi/full/10.1029/2018JC014444
“we are trained in school to accept the laws of still water refraction and reflection without question”
Folks also forget that when the sun is at low angles in the sky, light is most highly scattered by the atmosphere. Most of the light striking the ocean surface at such times is not via direct low angle incidence but instead comes diffused from all directions of the sky.
Not true, Mark. Greatest albedo is sun overhead and rough seas. Even with calm seas with the sun at 30° above the horizon, ~94% of the sunlight is absorbed.
w.
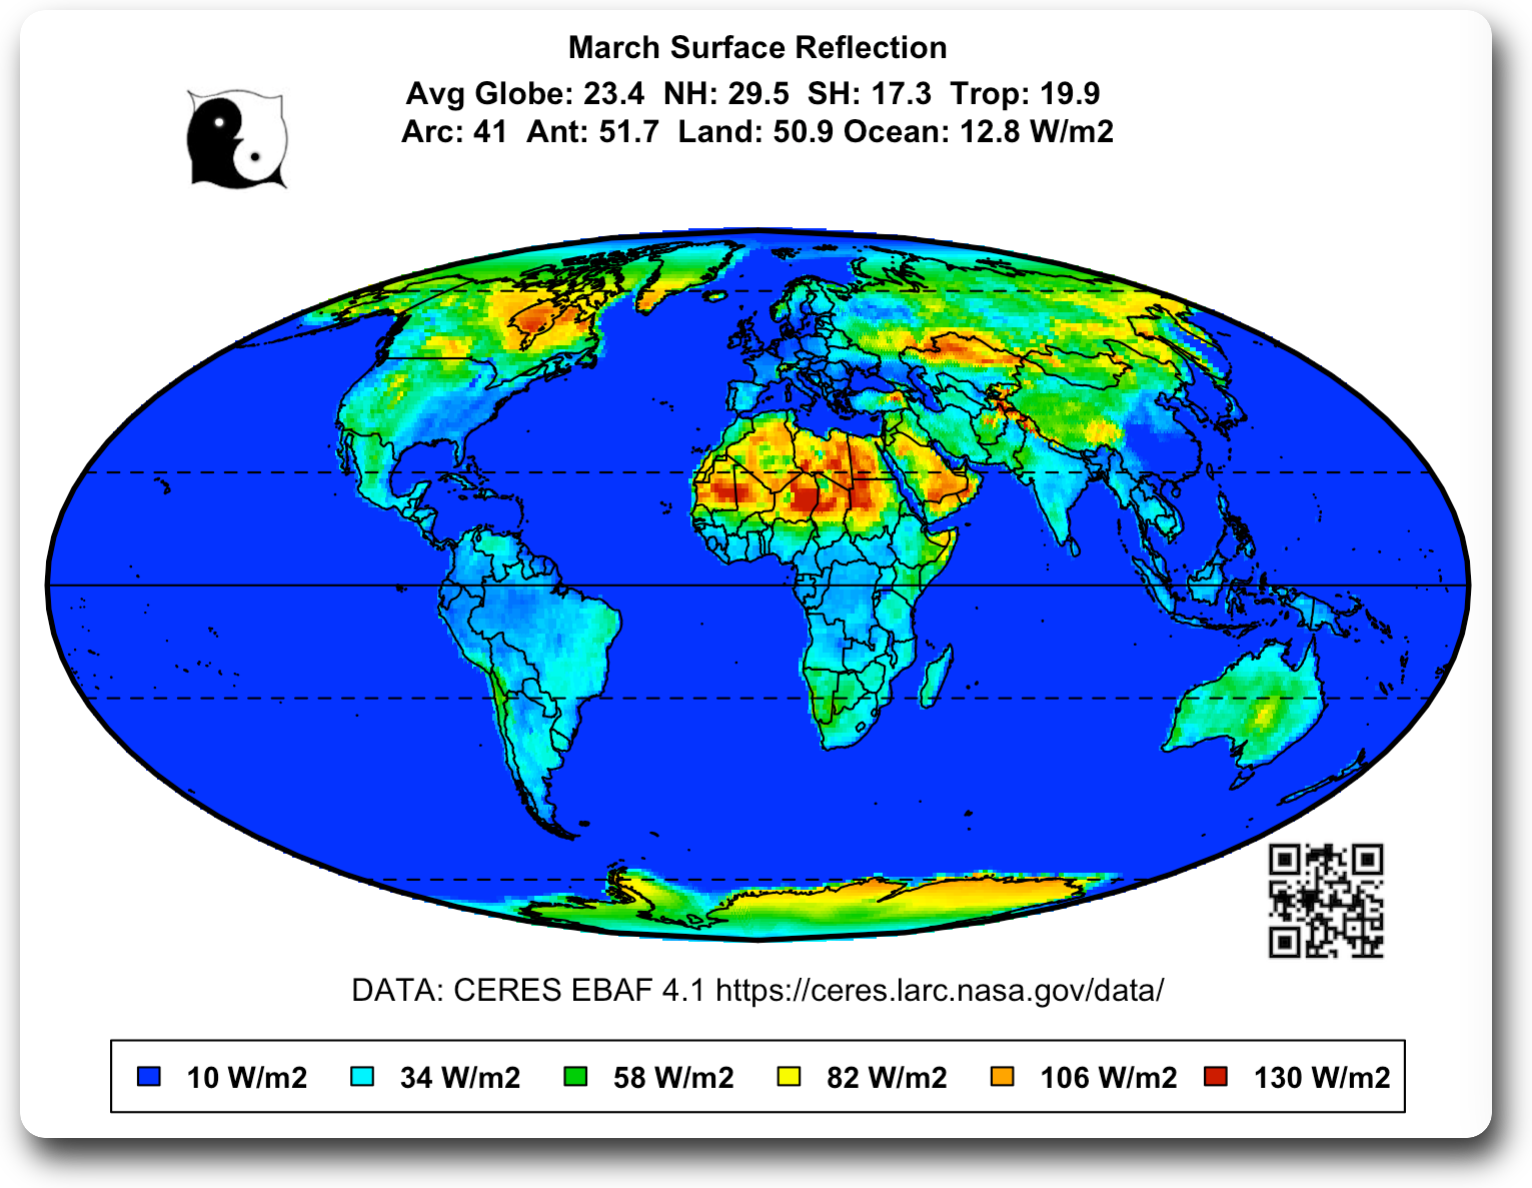
Note also the reflection off the iced-over area between Greenland and North America compared to the ice-free ocean just south of that …
w.
But if the main driver is albedo and ice extent, wouldn’t just run right to max ice extent? Is ice really that good an insulator? And you’re talking about sea water that is already near freezing for the most part.
Add in all the other factors: orbital changes, geothermal, tectonics, current oscillations, and heck, even man made effects like soot covering the ice and Russian ice breakers stirring the seas – and mix it all up and you can serve up a climate goulash with a slice chaos thrown in.
I believe this was a YouTube video. I also watched it and it was convincing. The most impressive presentation concerned the Mendenhall Glacier in Alaska. The video showed pictures of the glacier in the early 20th century and compared it to pictures from today. The glacier has retreated significantly. The video highlighted how the average temperature has increased 4 degrees F (I believe). This appears to be true. I think we read an article(s) in WUWT that showed ocean currents have shifted and this may have caused this hot spot. This makes sense to me. The Mendenhall glacier is not in any danger of disappearing anytime soon – it is massive. I also believe I read where tree trunks have been exposed. I would like somebody (Willis?) to pull all of this together.
The temperatures in this area, the receding glacier, the melting permafrost are really good talking points and convinced the gentleman in the video that the earth is warming. It would be helpful to have a concise presentation of the facts, both recent and historically and some theories on why this area is so warm compared to the past.
“The most impressive presentation concerned the Mendenhall Glacier in Alaska. The video showed pictures of the glacier in the early 20th century and compared it to pictures from today. The glacier has retreated significantly……”
Glaciers peaked in 1820 (e.g. Oerlemans, 2005) at the end of the Little Ice Age. Since 1820 glaciers have been retreating at a remarkably constant rate. Sea levels follow the same pattern. So it’s not surprising the glacier has retreated since the early 20th century.
A modestly warming planet, glacier retreat and sea level rise are primarily the planet recovering from the end of the LIA. CO2 does have some warming effect, but it’s small compared to natural warming.
Climate crisis? If it had not been for the modern warming we would still be in the depths of the LIA. Now that really would be a climate crisis.
During the LIA some Alpine villages were destroyed by advancing glaciers. Warmists should be careful what they wish for….
Chris
Jim Steele- “Due to the formation of the Antarctic Circumpolar Current, enabled by plate tectonics, Antarctica became thermally isolated from the rest of the earth initiating 1) a permanent ice cap, 2) extensive sea ice that extruded cold brine that filled the ocean’s bottom water, and 3) Intensified upwelling that increased productivity that drew down atmospheric CO2 to current levels.”
https://wattsupwiththat.com/2021/10/10/the-antarctic-refrigerator-effect/
The circumpolar current does little to protect Antarctica from atmospheric warming. The circumpolar current has increased in speed modestly since the 1980’s as the circumpolar winds have increased due to increased low latitude heat migration.
“Atmospheric Entanglement”
OMW
Add to Jim’s list the geologic formation and growth of the Transantarctic Mountain Range. This major polar continental fold mountain range provides a high elevation glacier nursery that since the Miocene was the initiation point for the development of the East Antarctic ice cap.
Surely. The weather / wind is steered by the difference in temperatures between the equator and the poles.
“If you look globally, the warming of earth is really minimal. Especially in the SH.”
Do not agree. Even in the southern hemisphere, there’s been a one degree C rise over the past century.
Ask yourself: how warm would the earth be now if that “minimal” amount of temperature increase had begun at the time of the building of the pyramids and had continued steadily since then?
I am quite confident that I have no real idea show to interpret those graphs, but when I look at them and see that almost all of them show a significant jump in temperature around 2016, followed by a decline (quite rapid in some cases) back towards where the previous trend lines were heading, I wonder what happened.
Would it be correct to think that there was some sort of injection of heat around 2016 that caused the temperature jump? If the climate included all sorts of positive feedbacks, why would the temperature start _declining_ after this heat entered the system? When I see the _decline_, I’m tempted to think that this injection of heat is slowly leaving the system, and things are returning to some sort of balance.
Am I looking these graphs completely the wrong way?
I think you interpret them correctly. Climate science has all sorts of positive (and negative) feedbacks. Climate itself? Not so much.
Chris, the jump is from the 2015/2016 El Nino.
w.
And an El Nino causes and is followed by increased cloud cover, which cools. That’s the negative cloud feedback which is not in IPCC or the models.
The PDO went positive in 2014. This is associated with a thinning of clouds reported in Dubal/Vahrenholt 2021.
The El Nino events that followed were likely related as well.
One can actually go back further in time and see the breakpoint. Starting in 1997 right after the AMO when positive shows the original pause, the jump and then the the new pause.
https://woodfortrees.org/plot/uah6/from:1997/to/plot/uah6/from:1997/to:2014/trend/plot/uah6/from:2015/to/trend
Essentially, the only warming that has occurred since the AMO phase change 25+ years ago occurred due to a reduction is reflected solar energy.
“Would it be correct to think that there was some sort of injection of heat around 2016 that caused the temperature jump?”
The real problem is that everyone presents a single line representing the entire surface. It’s nonsense.
Chris N.
Here is a simple concept that you can follow up on. Willis likely has more information than I can call upon.
Trade Winds {Easterlies} push air and water across the Pacific Ocean from the Americas in a westerly direction. Sunlight (energy) enters the near surface water of the massive Ocean, and the winds tend to pile up that water.
Search with this:: “pacific warm pool”
and look at images.
When the Trade Winds cease that warm water is released and surges back toward the eastern Pacific. Note: this is moving water, not a wave.
In the following, replace XXXXXX with cisiro
The top image shows the returning warm surface water. The accumulated energy in the “warm pool” is exposed to 6,000+ miles of atmosphere. This is the “injection of heat” so the air warms, and then that energy is carried away and begins to radiate to space. See:: Hadley Cell – – also use Images tab.
Over an unspecified time period the Trade Winds return, sunlight enters the ocean, and the Pacific Warm Pool reforms. Ocean surface heights reform and the process repeats. That’s your “returning to some sort of balance”.
Well, that didn’t work.
Here are the images with the top and bottom reversed.
 
Chris Nisbet:
You are entirely correct that there was an injection of heat into our climate between 2014 and 2016.
In 2014, China introduced decreased SO2 emission standards for then production of steel. which was implemented in 2015. Their SO2 aerosol emissions dropped from 37.5 Megatons in 2014 to 8.4 Megatons by 2016..This removal of 29 Megatons of SO2 pollution from the atmosphere increased the intensity of the sunlight striking the Earth’s surface, causing substantially increased warming.
Normally all El Ninos are volcanic induced, but in this instance it was man-made.
Here we go again with Burl’s pseudo-scientific SO2 fairy tales.
“This removal (by China) of 29 Megatons of SO2 pollution from the atmosphere increased the intensity of the sunlight striking the Earth’s surface”
There is zero data backing any sudden 2015 stair step “increased intensity of sunlight”. None. In fact, we’ve witnessed a decades long decrease in SO2 content of the atmosphere, yet scientists talk of a measured trend of “global dimming” … less sunlight reaching the earth’s surface, over that same timeframe.
And no, El Ninos are not “volcanic induced”, LOL! They are ocean phenomena.
Burl’s comments are just made-up-out-of-thin-air pseudo-scientific phony baloney, nothing more. If Burl says “X” , put your money on “not-X”.
Good work.
Have been pointing out for 15 years that I first noticed wavier jet stream tracks since around 2000 and a slight increase in global cloudiness as a consequence.
The earlier warming spell was accompanied by reducing global cloud cover and more zonal jets.
The issue of global oceanic thermal inertia is the big unknown but it does seem likely that we may now have passed the peak of the late 20th century warming period.
At the same time we appear to be seeing a shift from El Niño dominance in the Pacific towards cooling La Niña dominance.
That is one of the indicators of a change towards cooling that I proposed some time ago.
“Have been pointing out for 15 years that I first noticed wavier jet stream tracks since around 2000″
Wavier than what? The incredibly short time we’ve been analyzing them? What were they doing 500 years ago? 1000? 10000?
Maybe the oceans generally exhaust their heat at the same rate with basin-specific cycles doing the exhale work.
It is still not “a recent decline”, but long term upward trend. Instead of splitting hairs (or charts respectively), I would recommend dealing with the unterlying physics and understanding why that is. There is a lot to learn.
https://greenhousedefect.com/about-the-physical-impossibility-of-feedbacks
There is a lot to learn, as you say.
However, warmistas and CAGW proponents see a constant continuing rise that follows the growth in CO2 concentration. Some of us though see the sun, clouds, and various cycles at work in making temps go both up and down. We barely have sufficient data to recognize some other longer cycles and the real long ones have yet to reveal themselves.
I learned a long time ago that forecasting into the future is fraught with unknown unknowns. As you traipse into the future, events occur you never anticipated and those that you did don’t turn out how you anticipated they would. With temperature measurements in the past with high uncertainty along with sketchy statistics, a Global Average Temperature (GAT) that is a hope and a prayer, kinda of like a crystal ball, and lastly, very little mathematical descriptions of how this coupled and nonlinear system truly works, we are all basically making guesses as to is going to happen with temperatures.
Now that is from NASA! Maybe we should talk about it..
https://www.nasa.gov/centers/langley/news/releases/2004/04-140.html
I think the primary result of climate research has discovered that the earth’s climate seems to gets colder and then it gets warmer, back and forth- back and forth on several different time scales.
The most obvious other trend is it seems to be getting colder.
“I think the primary result of climate research has discovered that the earth’s climate seems to gets colder and then it gets warmer, back and forth- back and forth on several different time scales.”
And whenever some slight change occurs, we start sacrificing virgins, until it changes again, thinking we’ve actually effected a change.
“splitting hairs (or charts respectively)”
But I like splitting hairs.
“understanding why that is. There is a lot to learn.”
Exactly: We see a big jump in 2016, with a big El-Nino. Why did it do that. We see cooling ever since. There is much information in these plots. The question is, can we find the reasons for what we see.
Not by staring at temperature records! Understanding the physics however..
TonyL:
For the “reasons for what we see”, see my post of May 11 to Chris Nisbet, above.
As I explain, the Very Strong El Nino of 2015-2016 was man-made.
Maybe “strucchange” is simply segmenting periods of grouped low anomalies together to look back and pick a break point for the start of them.
1) NOAA SST-NorthAtlantic GlobalMonthlyTempSince1979 With37monthRunningAverage.gif (880×481) (climate4you.com)
2) PDO MonthlyIndexSince1979 With37monthRunningAverage.gif (880×475) (climate4you.com)
3) NOAA SST-Nino3-4 GlobalMonthlyTempSince1979 With37monthRunningAverage.gif (880×475) (climate4you.com)
Thank you for showing strucchange. I had not seen that set of functions before. They could be very useful.
Well done!
Never mind the data, never mind science…
“Justin has travelled all over the world for the BBC and seen evidence of climate change everywhere.”
https://www.bbc.co.uk/news/topics/cn5e8npr2l3t
What more do you need?
That’ll be the Justin who the BBC were recently forced to admit was lying.
https://notalotofpeopleknowthat.wordpress.com/2022/05/10/bbc-climate-editor-made-false-claims-on-global-warming-mail/
Is everyone named Justin a lying sack of Shite??
All the ones I’ve met, yes.
The name must be a curse.
The Solar Activity – Global Cooling Trackers – April . 2022
The Solar Activity – Global Cooling Trackers – April. 2022
1. The Solar Activity – Global Temperature Correlation.
https://blogger.googleusercontent.com/img/a/AVvXsEjbSnv27PK5uV7c0Ma7QRapv7GTZzY9Vj-edBzo4-PGCqMgI436-pZKAJyNWKAArON6oLdvaOa6-XZI7JWxkNUFXA9TLmu09PGbHcanacgzHZPDhmPT51T1alwqM8mTTdnFpygOMjn3TnfMNORzad001xsTOwbtHMtDXinlXYjVTxI-rJXnWXv6iAz8tw=w655-h519
Fig.1.Correlation of the last 5 Oulu neutron count Schwab cycles and trends with the Hadsst3 temperature trends and the 300 mb Specific Humidity. (28,29) see References in parentheses ( ) at https://climatesense-norpag.blogspot.com/2021/08/c02-solar-activity-and-temperature.html
The Millennial Solar Activity Turning Point and Activity Peak was reached in 1991. Earth passed the peak of a natural Millennial temperature cycle in the first decade of the 21st century and will generally cool until 2680 – 2700.
Because of the thermal inertia of the oceans the correlative UAH 6.0 satellite Temperature Lower Troposphere anomaly was seen at 2003/12 (one Schwab cycle delay) and was + 0.26C.(34) The temperature anomaly at 2022/03 was +0.26C (34).There been no net global warming for the last 20 years. The Oulu Cosmic Ray count shows the decrease in solar activity since the 1991/92 Millennial Solar Activity Turning Point and peak There is a significant secular drop to a lower solar activity base level post 2007+/- and a new solar activity minimum late in 2009.The MSATP at 1991 correlates with the MTTP at 2003/4 with a 12/13 +/- year delay. In Figure 1(5) short term temperature spikes are colored orange and are closely correlated to El Ninos. The had sst3gl temperature anomaly at 2037 is forecast to be + 0.05.
2. Arctic Sea Ice.
Arctic sea ice reached its maximum extent for the year, at 14.88 million square kilometers (5.75 million square miles) on February 25. The 2022 maximum was the tenth lowest in the 44-year record.
Fig.2 Arctic Sea Extent (NSIDC)
Arctic sea ice extent on 05/01/22 (Lt Blue) was 13,571,000 sq kms the twelfth lowest on record, and 150,000 sqkms above the 2011- 2022 average
3.Arctic Sea ice volume.
Average Arctic sea ice volume in April 2022 was 23,000 km3. This value is the 9th lowest on record for April, about 2,300 km^3 above the record set in 2017.
See Data at: http://psc.apl.uw.edu/research/projects/arctic-sea-ice-volume-anomaly/#:~:text=February%202022%20Monthly%20Update,mean%20value%20for%201979%2D2021.
4.Sea Level
Fig. 3 Sea Level https://climate.nasa.gov/vital-signs/sea-level/It can now be plausibly conjectured that a Millennial sea level peak will follow the Millennial solar activity peak at 1991/92 . This may occur at a delay if one half of the fundamental 60 year cycle i.e at 2021/22. Fairbridge and Sanders 1987 (18).The rate of increase in sea level from 1990 – present was 3.4 millimeters/year. The net rate of increase from Sept 13th 2019 to Jan. 03 2022 in Figure 3 was 2.3mm/year. If sea level begins to fall by end 2022 the conjecture will be strengthened.
5. Solar Activity Driver and Near term Temperatures
An indicator of temperatures for 5 – 6 months ahead is provided by the SOI graph.
Fig.4 30 Day moving SOISustained positive values of the SOI above +7 typically indicate La Niña (cooling) while sustained negative values below −7 typically indicate El Niño.(warming) Values between +7 and −7 generally indicate neutral conditions. Values at May 01 2022 indicate a possible strong La Nina in Sept/Oct this year leading to cooling. Conversely , the solar activity of cycle 25 is increasing towards a 2024/5 peak with possible warming. We will see which trend dominates September’s sea ice extension and volume minima.
http://www.bom.gov.au/climate/enso/#tabs=Pacific-Ocean&pacific=SOI
Basic Science Summary
The global temperature cooling trends from 2003/4 – 2700 are likely broadly similar to or probably somewhat colder than those seen from 996 – 1700+/- in Figure 5.(.3) From time to time the jet stream will swing more sharply North – South. Local weather in the Northern Hemisphere in particular will be generally more variable with, in summers occasional more northerly extreme heat waves, droughts and floods and in winter more southerly unusually cold snaps and late spring frosts.
The IPCC -UNFCCC “establishment” scientists deluded first themselves, then politicians, governments, the politically correct chattering classes and almost the entire UK and US media into believing that anthropogenic CO2 and not the natural Millennial solar activity cycle was the main climate driver. This led governments to introduce policies which have wasted trillions of dollars in an unnecessary and inherently futile attempt to control earth’s temperature by reducing CO2.
Forecasts will be updated here as appropriate. To review the detailed data and the references on which this cooling paradigm is based see the links below:
A : http://climatesense-norpag.blogspot.com/2021/08/c02-solar-activity-and-temperature.html
Net Zero Threatens Sustainable development Goals. see References in parentheses ( )
B : http://www.ijaos.org/article/298/10.11648.j.ijaos.20210502.12 The Impact of CO2,H2O and other Greenhouse Gases on Equilibrium Earth Temperatures
C : https://arxiv.org/pdf/2006.03098.pdf Dependence of Earth’s Thermal Radiation on Five Most Abundant Greenhouse Gases
Solar “activity” Cycles.
Earth’s climate is the result of resonances and beats between the phases of cyclic processes of varying wavelengths and amplitudes. At all scales, including the scale of the solar planetary system, sub-sets of oscillating systems develop synchronous behaviors which then produce changing patterns of periodicities in time and space in the emergent temperature data……………..
Wasn’t the ice supposed to be gone by 2013 ?
“NASA GISSTEMP Global Mean went above 1.5C for 2 months in 2016”
What base period is this using? The download page for GISTEMP only shows a maximum anomaly in 2016 of 1.37°C, using the 1951-1980 base period.
“Hmmm, sez I … why not since then?”
Maybe because that’s when the last big El Niño was.
“They are selected, and their uncertainties estimated, by the Bai & Perron algorithm implemented in the R computer language package “strucchange”.”
I don’t know anything about that algorithm, but is it applicable here? Anything that produces a fractured graph seems to me to be suspect when it comes to global temperatures.
“But this century, for a good part of the period from 2000 to the end of 2014, the rate of rise of most of the datasets was much less than that.”
Judging from your graphs, shouldn;t the real question be, what caused the massive jump in temperatures in 2016, rather than why they have been cooling since then.
What is plotted is actually the GISS Ts met Stations only index – no ocean data. You can find the file here; it fits the description, reaching 1.65 and 1.64 in Feb/Mar 2016, but elsewhere under 1.5. And you’ll see from the graph that it finishes in 2019. It isn’t GISS Land/Ocean
Thanks, that makes sense. Of course, missing 2020 might explain why the four year trend from 2016 is so sharp.
Thanks, Nick. The data I used was global, but it was the old version of GISS.
I’ve replaced the graphic with the up-to-date GISS Global LOTI data from here.
w.
Are you sure? GISTEMP 3 only show a maximum monthly value of 1.35°C for land and ocean.
https://data.giss.nasa.gov/gistemp/graphs_v3/graph_data/Monthly_Mean_Global_Surface_Temperature/graph.txt
Giss Ts is not an old version of LOTI. When Hansen started global temperature calcs in 1987, there was no SST dataset, so they extrapolated from land data, with islands playing a key role. GISS kept that going as GISS Ts in case people were dubious about using SST. Those doubts faded, so Ts was finally put to rest in 2019.
I think that is what Willis means by “old version”.
My mistake then, but he did say he was using a global set.
“Anything that produces a fractured graph seems to me to be suspect when it comes to global temperatures.”
It’s actually a version of the SkS Escalator
You can present a rising graph as if it always has a negative slope, as long as you don’t count the abrupt rises that you create between the declines.
Yep and if you do it for the last 10,000 years it’s a negative slope. Nick, it’s time for you to stop.
Nick
Contrarians or realists has nothing to do with it. Both groups are as blind as each other, and need to sit down and take the time to understand the atmospheric machinations that actually control the temperature record, especially the greater detail and higher latitudes provided by the satellite data. What is being measured, what was the direction of transport that caused the anomaly, and where was the origin. No one is checking what causes the anomalies, its mostly guess work.
Both the red line and the blue line are reasonable curve fits if you use about a 3/4” (2cm) wide felt marker to draw them…..
Breakpoint analysis is purely a mathematical construct that tells us nothing about the climate. On the other hand those breakpoints do exist in the data so our understanding of climate change had better account for their existence, especially when they’re spanning periods longer than the models reproduce.
Yes, exactly Nick. Its the SkS Escalator all over again.
I couldn’t help but notice that in the article there was no discussion whatever of the large abrupt temperature rise around 2015. It is the most pertinent feature of the entire temperature trend over the past few decades, yet no mention was made of it.
And honestly, I didn’t find that omission to be much of a surprise either.
MGC, learn to read. The temperature rise was due to the 2015-2016 El Nino, which if you’d actually read the post you’d have noticed I pointed out directly, viz:
So here you are being a tendentious unpleasant illiterate jerk again … which I don’t find to be much of a surprise either …
w.
Doesn’t matter what caused the break, Willis. The fact remains, you didn’t ever mention that in 2015 there was a large 0.3 to 0.4 degree stair step temperature increase.
Let me be clearer on the point I’m making: if a reader went just by your textual description and didn’t look carefully at the accompanying graphs, said reader might be (falsely) led to believe that the overall temperature trend was actually down. In fact, some comments here seem to indicate that this might actually be the case for some readers. But of course there is no such downtrend.
It’s just as Nick noted: “You can present a rising graph as if it always has a negative slope, as long as you don’t count the abrupt rises that you create between the declines.”
Pass. First Rule of Pig Wrestling now applies.
w.
Yep. You got the right answer.
BTW, did you know 0.3 to 0.4 is a humongous jump in temperature? /sarc
Translation: Willis doesn’t want to admit to potentially misleading some readers because of having left out pertinent information in his textual description.
“if a reader went just by your textual description and didn’t look carefully at the accompanying graphs, said reader might be (falsely) led to believe that the overall temperature trend was actually down.”
No they wouldn’t.
Yet another typical “Nuh Uh because I say so”.
C’mon now. Let’s be serious here, Tim. And (gasp!) actually honest. Here again is what I’m commenting on:
“Clearly, there has been a sea-change in the surface temperature changes in the 21st century. For most of the last half of the 20th century, temperatures were rising on the order of 0.15°C per decade. But this century, for a good part of the period from 2000 to the end of 2014, the rate of rise of most of the datasets was much less than that. And in all seven of the datasets, since the breakpoint before the 2015/16 El Nino, the temperatures have either been near level or dropping.”
One might very easily be misled into concluding, based just on this textual description alone, that the overall trend has changed to flat or down. Or at the very least slowed.
But not one of these things has actually happened. Not one. There was a large stair step increase at the 2015 “break point” and the overall trend remains decidedly up.
In fact, the overall trend this century for most if not all of those temperature datasets is actually more than the 0.15 C per decade rise that was stated as the increase during last half of the 20th century. But one would almost certainly never, ever realize such a fact from a reading of that textual description.
That textual description of 21st century trends remains a poor, incomplete, and potentially misleading description.
Thanks for that lovely (if incomplete) picture of the wave crest.
No idea if I’m doing this right, but using the same algorithm with all the data and 5 breakpoints gives me this.
Willis writes “My guess is that those three ground datasets, GISS, HadCRUT, and Berkeley Earth, are contaminated by the Urban Heat Islands or excessive “homogenization”. However, that’s only a guess.”
My guess is that the satellite datasets are systemically biased due to changes in the warming atmosphere altering the structure of the atmosphere and thereby invalidating the underlying calculations of warming in the models that in turn underly those satellite dataset calculations.
Plus, as you say, increasing UHI effects and I think land use changes.
Satellite data gets “systematically biased” by the effect of cosmic rays on the sensors, and nobody goes up there to recalibrate them….
https://mdpi-res.com/d_attachment/aerospace/aerospace-08-00062/article_deploy/aerospace-08-00062-v2.pdf?version=1615169416
https://www.mdpi.com/2226-4310/8/3/62/htm
a downvote for research ?…someone’s not thinking…
Some people on here are morons. People who automatically downvote anything Nick Stokes says are good examples.
Thanks Willis, very helpful.
classic cherry picking! going back 10/20 years, really? but, hey, it always works better with graphs!
tell this to people in India and Pakistan and the US Southwest.
sheesh, are people still falling for this? sigh
Cherry Picking? In what sense? From what I see the author is simply making observations and illustrating those observations with graphics. I see no statement of cause and effect. The point he is making is simply: I had a thought the other day when I read this…”NASA GISSTEMP Global Mean went above 1.5C for 2 months in 2016.” And the rest are his well illustrated thoughts. What’s to fall for? Nicely done in my book.
Chris makes an accusation of cherry picking, then proceeds to cherry pick three places on the globe.
Sigh (as Chris would say)
Indeed.
It’s ok Chris
Was the Indian/Pakistani heat wave caused by CO2?
Yes
Same co2 that is freezing our butts off in western canada
It does it all
Carlo, Monte
“Was the Indian/Pakistani heat wave caused by CO2?”
No, it was caused by a stalled High-Pressure weather system.
Temperatures always skyrocket in such weather systems
Be reasonable folks! It has never been warm before in the US Southwest, India, or Pakistan. Obviously Chris wins. Those of you raising points about unusual cold should remember that all warm temperatures are climate change and all cold temperatures are just weather. Not sure why Chris modestly failed to press that vital point.
Chris writes “classic cherry picking! going back 10/20 years, really?”
Do you think the breakpoint analysis would have behaved differently if it had been a longer series?
More work needs to be done on the identified increase in 2005. So odd.
amac,
2005 was the year when a significant shift in δLOD was reported. I used this as a trigger to look for shifts in global weather patterns from zonal to meridional and found this in 2007 West African Monsoon 2007
The key point is that the climate operates over a 60-year natural cycle of 30 years zonal and then 30 years of meridional weather patterns. We are now well into the meridional part of the cycle as Stephen Wilde comments above.
All of this meteorological science of natural climate change was first established by the Russians in the 1940s.
The temps since 2015 will fall back onto the level of 2005. See:
“Climate Pattern Recognition in the Holocene, part 8” All reasons explained.
It’s not looking much like a hockey stick, is it?
Well, flipped down maybe and after breaking the handle
I’m still not on board with removing urban heat islands. It seems more reasonable to incorporate surface budgets into the physical models, instead of acting like surface properties don’t change.
The urban heat islands, surrounding farm land budgets, and desiccated forests (e.g. reduced continental cloud nucleation), are certainly not external to the climate. And they are certainly not limited to surface albedo effects (which is the extent of their influence in current generation CMIP).
Ultimately, if the surface is radiating more on average than it did in prior times this is useful information. A higher surface radiating temperature would certainly offer more radiation to the lower atmosphere, all else being equal. There are several watts to be found there. Less energy delivered aloft by latent heat, more circulating in the boundary layer by sensible turbulent flux. It has a similar finger-print to CO2.
This necessarily reduces CO2 sensitivity in physical models. However, I recognize the issues with homogenization smearing UHIs over the landscape. That’s a separate issue.
Back in 2016, after studying climate change since 2006, I decided to move from NH to Florida. One of the big reasons was a half-hour lecture from a series “The Physics of History” by Professor Helfand of Columbia University, M.S. in Physics, Ph.D. in Astronomy, on Milankovitch Cycles. The attached chart shows temperatures for the past 20,000 years derived from ice core records from Antarctica and Greenland. The “big” cycle of about 100,000 years, shows that we have now had a “typical” 10,000 years of warmth, and the chart clearly indicates a cooling trend including the infamous “Little Ice Age” which was the coldest earth has been during the current warm period.
While the “big” cycle is, overall, a long one, the transitions are consistently rather fast as shown in his charts. The same “fast” transitions are equally apparent from a chart of sea levels on page 58 of “Climate Change in Prehistory” by Burroughs, a book with a 20-plus page of some 300-plus published scientific references.
The big cycle is caused by planetary influences which change the ellipticity of earth’s orbit which, as the ellipticity increases, bring about short, hot summers and long, cold winters. Recall the “news” about a year and a half ago about the interesting planetary conjunction in the evening sky of Jupiter and Saturn, working together to elongate earth’s orbit.
The sea level chart in the Burroughs book covers the start of the last ice age. It shows a precipitous drop in sea level at the start of the ice age. Precipitous, in this case, was a straight drop of about 200 feet in about 8,000 years. It takes a lot of cold weather over a long period of time to transfer and convert all that ocean water into land glaciers. Conversely, as the ice age ended, it took some 14,000 years to melt all the ice and bring the oceans back up about 400 feet.
Thanks for this.
The dominant variables are always the answer to behavioral patterns.
Hi Willis
During January and February with carryover into March, of 2016, the large anomalies in temperature were in northern Russia not far from the Arctic ocean. A temperature increase of 7C (-27 to -20). The UAH report by John Christy at WUWT noted the locations.
I employed a graduate scientist who was filling in time before taking a position at a university to research the temperature anomalies at those locations and the prominent change was that the wind direction was persistently from the south west, rather than the NNW during those months.
It was the hang over from the large El Nino during 2015. See temperature chart attached.
2015 was the second largest Pacific ACE since 1982. There were other significant effects.
The NH / Arctic region saw the increase, it was not global.
Thank you for your great posts.
Martin
What seems remarkable about all those graphs is that in every case the current temperature, as indicated by the final trend line is warmer than would have been expected if the previous trend had continued.
Excellent observation, Bellman.
”the final trend line is warmer than would have been expected if the previous trend had continued.”
Start your ”trend” here, or maybe here. What about here or even here……
Point? Trends are purely subjective but the further back you go the more meaning they have.
“Trends are purely subjective but the further back you go the more meaning they have.”
False. If some new influence has suddenly and significantly altered the trend (and human greenhouse gas emissions are an excellent example) then it does not make sense to pretend that long stretches of time prior to that new influence should be considered to be part of the current trend.
Your y axis is missing any scale, and you don’t quote a source for your proxy data.
But I’m not sure what your point is apart from that. I’m talking about this article which is only talking about the last 20 years. I doubt if a trend based on thousands of years will be able to say much about the last seven.
”Your y axis is missing any scale, and you don’t quote a source for your proxy data.”
Oh boo hoo.
Can we explain (with solid science) the huge discontinuity around 2015? Because if we don’t have a real good handle on that, how do we begin to understand the other much small variations?
And whatever the explanation, the measurements from Mauna Loa tend to suggest it wasn’t a direct response to atmospheric CO2 concentration.
Doubtful. I suppose they’ll say it’s ocean belches. Even then, at the peak of the latest belches it only brought globally averaged temperature estimates to the extreme low end of the multi model mean envelopes in CMIP6. This suggests less than alarming outcomes based on the current observational estimates, and a crack in the foundations of policy. The consensus framework of research science is facing great challenges https://metamodel.blog/posts/model-meritocracy/
Mike
Does the satellite data record heat transport during that period, or residual / retained heat as a result of a CO2 or high pressure area effect ??
Using data at one month intervals as anomalies gives no chance of understanding what is really occurring. No one bothers to understand the reason for the anomaly in the affected area.
Mike Smith:
The huge discontinuity around 2015 was explained earlier in this thread. It was caused by a man-made El Nino.
See my post to Chris Nisbet, May 11, 2022, 9:42 pm, above.