Frans Schrijver
Klimaatfeiten.nl (in Dutch)
Apr 15, 2022
The general view in society is that human emissions of CO₂ are the all-determining cause of the increased concentration in the atmosphere. Most scientists and even many climate skeptics do not question this. There is some debate about how long this extra CO₂ will stay in the atmosphere, but that’s about it. That’s remarkable, as several scientists have published extensively on the flaws and inconsistencies of this narrative. By looking at the significant increase in the CO₂-flows from and to land and sea it’s in fact easy to see that the CO₂-rise is largely due to natural causes.
The idea that human CO₂ is the all-determining cause of the increased concentration is based on the assumption that the natural inflows and outflows are always and exactly in equilibrium with each other. Based on this perfect equilibrium thinking, human emissions, even though they are relatively small, cause a perturbation year after year. In the so-called global carbon budget[2] about 10 PgC of CO₂ is added every year, while the absorption flux has only increased by 6 PgC/yr (1 Petagram = 1 Gigaton = 1 billion tons). The concentration therefore continues to rise indefinitely as long as people emit CO₂.
To support this idea it is also assumed that human emissions accumulate in the atmosphere. Where you would expect a single residence time for a reservoir with in- and outflows, the IPCC-models calculate with a small residence time of about 4 years for natural CO₂ and a large one for human CO₂: “The removal of all the human-emitted CO2 from the atmosphere by natural processes will take a few hundred thousand years (high confidence)”.
Several scientists, including Murray Salby[9] and Hermann Harde[3], have published extensively on the flaws and inconsistencies of this narrative. They also showed that it is very illogical to think that a slight increase in the up-flux cannot be compensated by a larger down-flux. It’s like increasing the heat energy flow in a house by 5% and expecting that the temperature will keep on rising forever.
Despite this, belief in the IPCC’s model for the increase in concentration is persistent. In this article we will focus on one of the strangest assumptions: the idea that the in- and outflows are stable and in perfect equilibrium. Although they are about 20 times larger than anthropogenic fluxes and have different drivers for up and down, natural flows are not included in the material balance used in the models.
It is in fact easy to see that the increase in the CO₂ concentration is for the most part the result of natural changes, based on the following unmistakable observations.
- Fluxes to and from land and sea have increased significantly since 1750.
- The increase in these fluxes is natural, i.e. not due to human emissions.
- The growth of the natural fluxes can only take place at a higher concentration in the atmosphere.
- Natural fluxes have increased since 1750

The IPCC’s AR5 report[6] clearly shows that natural fluxes to and from land and sea have increased. We can see this in the well-known figure 6.1 from the AR5 report. In this figure (Figure 1) you can see that the total human emissions are almost 10 PgC/yr. The natural fluxes are much larger. To and from the sea this is about 80 PgC/yr, to and from land about 120 PgC/yr.
The fact that these natural flows have grown considerably since 1750 is visible in the figure from the color of the arrows. The black arrows indicate the original equilibrium situation as it once was in 1750. The red arrows indicate the new flows or the changes since that time. Emissions from the oceans have increased by 17.7 PgC/yr, emissions from land by 11.6 PgC/yr, so all together this amounts to almost 30 PgC/yr. The natural down fluxes have increased even slightly more.
If we show the important flows horizontally and in the correct proportion, the simplified picture looks like this (Figure 2).

It is now clear at a glance that natural emissions have increased by a factor of 3 more than human emissions. We also see that the natural absorption has increased, but less than is needed for balance. This leaves a net increase of about 4 PgC/yr towards the atmosphere.
- The increase in CO₂ flows is natural
The second question that has to be answered is what is the cause of this increase; is it a natural flux change or is it the result of human influence?
Oceans
Henry’s Law plays a central role in the inflows and outflows from the sea. This law says that the amount of dissolved gas in a liquid is directly proportional to the concentration of the gas. With a high CO₂ concentration in the air, water absorbs more CO₂; at a low concentration the absorption is lower. In addition, the ratio depends on the temperature. At a low temperature, water can contain a relatively large amount of CO₂; at a high temperature less (warm beer contains less carbonation than cold beer).

This means that temperature has a direct influence on the ocean’s emissions. A high temperature means more emission and less absorption, a low temperature exactly the opposite. We know that the global temperature has increased since 1750 by about 1 °C. The question is: how great is this influence?
Hermann Harde[5] has performed a calculation based on physical data. Using Henry’s Law, he calculated the change in partial CO₂ pressure with a temperature increase of 1 °C. From measurements it is known how much the outflow increases or decreases depending on the change in the partial pressure. At 1 °C temperature increase, this results in an increase in emissions from the oceans of 19 PgC/yr. This is in good agreement with the increase of 17.7 PgC/yr from the IPCC report of 2013.
It’s important to mention that this temperature sensitivity deviates from calculations that are based on ice core measurements in Antarctica. These data show a ratio of the order of 100 ppm at a temperature increase of 10 °C, so much smaller. However, it is highly questionable whether this ratio is correct. As early as 1978, Stauffer and Berner[12] concluded: “We estimate the fraction of CO₂, present in bubbles to be only about 20%. The remaining part is dissolved in the ice.” Other scientists such as Jaworowski[7] and Harde[4] have also discussed major imperfections of ice core measurements in various publications. Contrary to what is often assumed, the ice layers are not a closed system. The air in the air bubbles in the deep ice layers no longer has the same composition as when the air bubbles were formed.
The calculation of Harde is far more reliable as it is based on reproducible physical data and confirmed by the observed larger emission from the oceans. This greater emission leads to a higher concentration in the atmosphere and thus, under the influence of Henry’s Law, also to a greater absorption by the oceans.
Land

With respect to land emissions we have to distinguish between plant respiration and soil respiration. About half of the CO₂ that plants absorb through photosynthesis disappears almost immediately into the atmosphere in the form of plant respiration. The other half is converted into biomass (leaves, wood, roots, etc.) that ends up on or in the ground.
The study of Jae-Seok Lee (2011)[8] shows that the soil emission is strongly dependent on temperature. Lee’s graph (Figure 4) shows that there is an exponential relationship between soil temperature and emission. A 1 °C increase in soil with a temperature of 14 °C leads to 15% to 20% higher emissions.

A 2016 study by Zhang et al.[13] found that emissions in China from the soil had increased by an average of 28% over 50 years. If China is representative for the rest of the world, the increase in soil emissions is about 17 PgC/yr. This is greater but still comparable to the IPCC’s 11.6 PgC/yr.
The absorption of CO₂ on land has also increased. The world has become greener under the influence of the higher CO₂ concentration (Figure 5, left). According to NASA[14], the greening has resulted in an increase in plants and trees over an area equivalent to twice the size of the United States.
A 2017 study by Peng Li[11] has shown that the Net Primary Production (NPP) has grown by 11.8 PgC/yr since 1960 (Figure 5, right). The NPP is the amount of CO₂ converted to biomass by plants (during photosynthesis) minus the plant respiration. The growth of the NPP illustrates that the absorption on land has increased and confirms the aforementioned figures from the IPCC.
So also for land it is clear that temperature plays an important role in the rise of the CO₂ fluxes. The increase of the land fluxes is not related to human emissions, but can be well explained by the global warming of 1 °C. The absorption of CO₂ on land has increased as a result of the global greening, under the influence of the higher atmospheric CO₂-concentration.
- The growth of the natural fluxes can only take place at a higher concentration in the atmosphere
So the increase in flows to and from land and sea has natural causes. Emissions from the sea and the soil respiration are temperature sensitive. Due to the increase in the average global temperature of about 1 °C, these flows have grown by about 30 PgC/yr since 1750.
The absorption flows have also increased, with concentration being the driving factor. At sea, absorption increases with a higher concentration in the atmosphere based on Henry’s Law. On land, the higher CO₂-concentration makes the earth greener: plants grow faster when there is more CO₂. This causes a higher NPP (Net Primary Production) and therefore more absorption.
Or to put it in another way: the larger down-fluxes to land and sea are only possible due to higher concentration in the atmosphere. Also in a situation with no human emissions at all, but still a similar temperature rise (like e.g. in the Middle Ages), the CO₂ concentration would have to go up.
The following graph (Figure 6) shows again the main atmospheric flows, but now with the main driving forces.

It’s also obvious from this picture that it makes no sense to assume that human CO₂ accumulates in the atmosphere, as the IPCC says. It would be very illogical if the down-flux under the influence of the higher concentration does increase for natural CO₂, but not for human CO₂. Nature does not distinguish between human CO₂ molecules and natural ones.
The IPCC still makes a distinction between residence time and adjustment time, where the adjustment time is defined as the time for atmospheric CO₂ to re-equilibrate following a perturbation. In their view the adjustment time is much longer than the residence time. But such a distinction makes no sense as all the (natural) sinks treat all CO₂-molecules in the same way. If the oceans can absorb more CO₂ based on Henry’s law, they will do that for both natural and human CO₂. The fact that in the ocean all sorts of biological and chemical processes take place is perhaps interesting, but not at all relevant. There is no separate drain for human CO₂.
To summarize:
- The 1 °C increase in the average global temperature has resulted in a higher annual natural emissions from land and sea.
- This increase in natural emissions is also visible in figure 6.1 of AR5 (+30 PgC/yr).
- The increase in both natural and anthropogenic emissions has led to more CO₂ in the atmosphere.
- The higher concentration results in a greater down-flux to both sea and land.
- The increase in concentration in the atmosphere is the result of a combination of increased temperature and human emissions.
The calculated impact of human emissions
In 2019 Hermann Harde[5] worked out a calculation model to determine how great the influence of humans is on the rise in CO₂ and how great the influence of temperature is. In doing so, he applied the following principles:
- The CO₂ concentration in 1880 was 280 ppm (parts per million).
- Human emissions have gradually increased to 10 PgC/yr (based on emissions data).
- The flow of CO₂ from land and oceans to the atmosphere has increased proportionally with the increase in temperature.
- The annual absorption of CO₂ in is proportional to the concentration in the atmosphere. There is only one residence time for all CO₂.
It turns out that this simple model does an excellent job in describing the increased concentration in the atmosphere and also provides logical explanations for all the other observations made so far. In the following chart (Figure 7), the blue line shows the concentration increase due to anthropogenic emissions (human CO₂) and the purple line the concentration increase due to emissions due to increased temperature. The green line is the sum of the two. The green line corresponds well with the measurements in Mauna Loa (blue blocks).

It turns out that the impact human emissions on the CO₂-concentration is relatively small. In his calculations, only 17 ppm (less than 15%) of the total increase is due to human CO₂. The vast majority of the increase is the result of the increased global temperature.
The good correlation in the chart in Figure 7 is of course no proof of Harde’s model. As to speak with Richard Feynman: “We can’t prove anything. We can only disprove something.”. But at least his model is in line with the observed drivers of natural emissions and absorptions and similar to many other well-known physical processes. Unfortunately, that cannot be said about the standard model the IPCC is using.
References
- Chen et al.: China and India lead in greening of the world through land-use management, 2019.
- Friedlingstein et al., Global Carbon Budget 2020, 2020
- Harde: Scrutinizing the carbon cycle and CO2 residence time in the atmosphere, 2017
- Harde: Reply to Comment on “Scrutinizing the carbon cycle and CO2 residence time in the atmosphere”, 2017
- Harde: What Humans Contribute to Atmospheric CO2: Comparison of Carbon Cycle Models with Observations, 2019.
- IPCC: Fifth Assessment Report, 2013
- Jaworowski: CO2: The Greatest Scientific Scandal of Our Time, 2007
- Lee: Monitoring soil respiration using an automatic operating chamber in a Gwangneung temperate deciduous forest, 2011.
- Murray Salby presentation in Hamburg: What is Really Behind the Increase of Atmospheric CO2?, 2018
- NOAA, National Centers for Environmental Information: Map of Total Sea-Air CO2 flux
- Peng Li et al.: Quantification of the response of global terrestrial net primary production to multifactor global change, 2017.
- Stauffer, Berner: CO₂ in natural ice, 1978
- Zhang et al.: Rising soil temperature in China and its potential ecological impact, 2016.
- NASA: Carbon Dioxide Fertilization Greening Earth, Study Finds (website)
We need more CO2. Plants love it!
Halve atmospheric CO2 and the planet dies.
Actually, that happens experimentally about 150ppm. So from present levels a bit more than half.
Tell that to Nick Stokes. He said in a prior post that CO2 is not a limiting factor in the photosynthesis… one of the several NS gems….
That’s a red herring thrown out by alarmists, along with the difference between c4 and c3 plants – as though plants are currently at max productivity and any co2 couldn’t possibly help.
I guess the 15-20% greener planet in the past 50 years of co2 growth, as certified by woke NASA, is just a fluke?
I hope soon the positive environmental news will make its way out into the general public and shut up the destructive alarmists for good.
Picky, picky. Humans are fine up to at least 10,000ppm.
That is wrong. There is no “natural increase” in the amount of CO2 in the atmosphere. Nature is removing CO2 from the atmosphere, each year, not adding it. Mankind has added about 180% of the measured increase in the amount of CO2 in the atmosphere since 1959.
We know from reliable measurements that every year since 1959 the amount of CO2 in the atmosphere has increased by less than the amount of CO2 which mankind has added to the atmosphere (with the arguable exception of 1973, a year in which the two numbers were very similar).
In other words, mankind increases the CO2 concentration in the atmosphere, and nature reduces it (since 1959, at least).
That means the only reason that the atmospheric CO2 level continues to rise is that mankind is adding CO2 faster than nature is removing it.
I sometimes say that all of the rise in atmospheric CO2 concentration since 1959 is due to mankind’s emissions, but that’s not quite precise. Actually, in those 63 years, mankind has added about 180 ppmv of CO2 to the atmosphere, nature has removed about 79 ppmv from the atmosphere, and the atmospheric CO2 concentration has risen by the difference between those two numbers: about 101 ppmv.
So mankind can take credit for about 180% of the (beneficial!) rise in atmospheric CO2 concentration since 1959.
The “effective” residence time (a/k/a the “adjustment time”) for CO2 added to the atmosphere is about fifty years, making the half-life about 35 years. That’s much longer than you would guess from the decay rate of the 14C “bomb spike.” This is a log scale plot of the decline of 14C levels in the atmosphere, following the atmospheric test ban treaty:
http://2.bp.blogspot.com/-G79oXdgIZC4/UnteTCVaGGI/AAAAAAAAAA0/AbSzY3s5ZP0/s1600/logc14.jpg
When atmospheric tests of A-bombs and H-bombs suddenly ceased (because of the atmospheric test ban treaty), the 14C concentration dropped on a near-perfect exponential decay curve, with a half-life of 11.5 years, implying a residence time of 16.6 years.
(Note: ¹⁴CO2 is 4.5% heavier than normal ¹²CO2, which affects biological uptake and diffusion rates slightly. But not much.)
16.6 years is obviously much shorter than the 50 year effective lifetime of atmospheric CO2 emissions. Can you guess why?
The answer is that some of the processes which remove ¹⁴CO2 from the atmosphere do so by exchanging it, one-for-one, for ¹²CO2. Those processes cause the fraction of 14C in the atmosphere to decline without actually reducing the amount of CO2 in the atmosphere. That means the 11.5 year half-life and 16.6 year residence time are necessarily less than the effective lifetime / adjustment time of CO2 emissions.
That 50 years effective lifetime is deduced from measurements.
It is the result that Prof. Richard Lindzen reported during the Q&A (3rd video) of this (excellent!!!) lecture:
● Part 1:
https://www.youtube.com/watch?v=hRAzbfqydoY
● Part 2:
https://www.youtube.com/watch?v=V-vIhTNqKCw
● The Q&A which followed:
https://www.youtube.com/watch?v=69kmPGDh1Gs (including his discussion of CO2 atmospheric lifetime)
That’s also the approximate result that Dr. Roy Spencer found:
http://www.drroyspencer.com/2019/04/a-simple-model-of-the-atmospheric-co2-budget/
That’s also the approximate result that I got, first with a little program to simulate declining CO2 levels, based on the historical CO2 removal rate as a function of CO2 level, and then with a modified version of the program based on Dr. Spencer’s model; the source code is here:
https://sealevel.info/CO2_Residence_Times/
Ferdinand Engelbeen reported roughly the same result, here. He has done the clearest and most thorough examination of the cause of rising CO2 concentration which I’ve found, here:
http://www.ferdinand-engelbeen.be/klimaat/co2_origin.html
CO2 follows temperature. It does not force it. You have cause and effect mixed up.
What are you talking about, Chaswarnertoo? I said nothing about temperature.
In the ice core records we can see that CO2 trend reversals generally lagged temperature trend reversals during glaciation/deglaciation cycles. That is strong evidence that global temperature affects the amount of CO2 in the atmosphere, but it does not mean nothing else affects the amount of CO2 in the atmosphere.
Glaciation / deglaciation cycles are generally estimated to correspond to about a 5-10°C variation in average global temperature. (More where there’re ice sheets, of course.) That drives about a 90 ppmv change in atmospheric CO2 level (though it takes thousands of years to be fully realized).
But we’ve measured a 101 ppmv increase in atmospheric CO2 level since 1958:
https://sealevel.info/co2.html
For global warming to cause such a large increase in CO2 level would obviously require MORE than than the 5-10°C global temperature change that the Earth sees when going from glacial maximum to peak interglacial warmth. So, are you contending that the Earth has warmed by > 5-10°C since 1958?
Chalk me up as agreeing with Dave Burton and Rud Istvan and anyone else agreeing with what they believe.
I don’t believe anything, I have stuff I know because scientifically proven, stuff I suspect is true but cannot prove, and lots and lots of stuff I know is just provably wrong. Like:
You want to continue, I have another 20 or so facts to sling.
If I knew agreeing with you would make you so grouchy, I would have skipped doing so.
“I’m smart enough to know that I’m dumb.” — Richard Feynman
While Rud Istvan (and Willis Eschenbach, and Nick Stokes, and Leif Svaalsbard, and …) will suffer from many magnitudes fewer “brain farts” than I do, he is not immune from them.
I will “chalk you up” as being “unwilling to download a global mean dataset, plot the results for myself, and check whether the specific proposition being made is ‘reasonable’ (or not)”.
At what point did Dave Burton or Nicholas McGinley bring temperature into the discussion? Neither of them are saying (nor am I saying) that a change in CO2 is necessarily responsible for the observed minor beneficial increase in temperature. I would say that temperature normally drives CO2, CO2 can provide a very minor positive feedback (so-called enhanced greenhouse effect) that can be overwhelmed by the many natural negative feedbacks that maintain homeostasis, and it is quite possible to drive CO2 concentration out of equilibrium through a steady accumulation of emissions.
Why is it so hard to understand that human emissions have been nearly double the increase in the amount of CO2 measured in the atmosphere? We certainly don’t know the exact quantity that was emitted, and even the exact CO2 concentration change is not known with absolute certainty, but when the amount we emit is about double the amount that CO2 increases, it should be obvious to any scientifically-literate person that the extra human-emitted CO2 had to be absorbed by nature. If nature is a net sink, it can’t simultaneously be a net source.
Did you click on the wrong “Reply” button ???
My post was an (admittedly bad) attempt at humour, highlighting the dangers of religiously accepting absolutely everything that a “guru” says without question.
It had nothing whatsoever to do with the specific scientific issues being discussed elsewhere in this sub-thread.
Well then what the hell were you saying?
Now you seem to be saying I have the opinions I do because of some slavish devotion to one or another “gurus”, to use your terminology.
I argue with anyone who says anything I disagree with, if I think it is worth my time, or if I feel irked, or any number of other reasons.
I never agree with anyone about anything just because of tribes or some perceived authority some person may have.
Thinking (and behaving) scientifically demands that we subsume ego, feeling, pride, and anything else that might interfere with an objective analysis of the facts and data at hand.
I have, in many comments below, gone into detail regarding why I am saying I agree with Dave’s opinion here.
It was faster to agree than to restate what they had said.
And look what happened. Rud felt the need to jump all over me for suggesting that what he said was a mere belief, even though in his comment below addressed to the author, he did not say he “knew” the author was wrong, but merely that “This post’s finding is probably (and unfortunately) not correct.”
Apparently he needed to give me crap because I referred to his view as a belief.
I had not even realized, until Dave Rich’s comment just above, that apparently there are people who feel that agreeing that human additions of CO2 to the air have had an effect of increasing the total amount measured in the atmosphere, is the same as agreeing with warmistas about the effect that CO2 has on the temperature of the planet.
And Mr. Rich is correct, and I wish to thank him for making his comment, that the two propositions are totally separate.
The more I read here, the more I like my swimming pool analogy:
“Okay, an analogy might be, we have a huge swimming pool, and it is raining. We do not know how much rain is falling into the pool, but we know we are adding 1″ of water a day to the pool with a hose.
But every day, the pool is only rising by 1/2 an inch.
So, no matter how much the rain is adding, just from what we are adding with our hose, we know a lot is leaking out, almost half of what we are adding with the hose is not showing up in the level of the pool.
So therefore, just what we do know, and not needing to account for what we are unsure of (the rain, someone pissing in the pool, etc), we know for sure that the ground under the pool is on a net basis absorbing water from the pool, not adding to it even more.
Even if water from the water table in the ground is adding water to the pool, it is more than made up for by some leaks in some other place in the pool.”
None of that analysis of CO2 accumulating or disappearing into one or more sinks, has anything to do with the effect of the CO2 once it is in the air, nor does it mean that what is happening right now with CO2 at 400+ ppm applies to all situations and all time periods that are not now .
The reason temperature comes into play is that temperatures were increasing naturally after the end of the Little Ice Age up until say, 1940. This temperature change would obviously cause the seas and soil to give up some of their stored CO2 to establish a new equilibrium.
Human emissions are just the tail of the elephant. Just because it grew doesn’t mean it was responsible for the higher level of CO2 in the air, when natural fluxes are ten times bigger.
It’s interesting that even though human emissions have greatly incresed over the past half century, CO2 levels grow in the 2-3ppm level every year.
“I will “chalk you up” as being “unwilling to download a global mean dataset, plot the results for myself, and check whether the specific proposition being made is ‘reasonable’ (or not)”.”
Then you should also chalk yourself up as attributing to me an entire compound sentence worth of things that I never said and that do not at all represent anything what I think.
I see now that you meant your comment humorously, but I am at a loss to see the humor.
“It had nothing whatsoever to do with the specific scientific issues being discussed elsewhere in this sub-thread.”
Then what did it have to do with?
Because the specific scientific issue at hand was ALL I was referring to when I indicated agreement.
If you somehow got the idea I am a sycophantic devotee of those with whom I agree, you are mistaken.
This idea that by agreeing or disagreeing with someone about one particular thing, automatically casts one’s self and all other thoughts and beliefs in with the totality of those others’ beliefs, is something like what people on the left do, when to disagree with any small part of their group think instantly and forever casts one down with the sodomites and forever taints one as “other”.
I do not think that way, never have, and never will.
I think for myself, and I agree or disagree with others on an issue by issue basis, strictly.
The climate of the earth is governed by 2 prime movers, and 2 prime movers ONLY:
1: The output of the sun.
2: The temperature of this region of space.
In fact, “greenhouse gasses” is a misnomer and a term for idiots and morons, because to even use the term “greenhouse gasses” shows a 100% lack of understanding how a greenhouse works. Greenhouses don’t work because they use “special magic gasses that defy all laws of physics”. Greenhouses work because they deny convection. This will work regardless of what gasses propagate in the greenhouse.
You could have a greenhouse full of Oxygen, Carbon Dioxide, or even Argon or Neon. It would still function in exactly the same way – the denial of energy removal through convection.
letmepicyou wrote, “2. The temperature of this region of space.”
Eh, what?
Space has no temperature.
letmepicyou wrote, “In fact, ‘greenhouse gasses’ is a misnomer and a term for idiots and morons…”
You’re correct that “greenhouse gasses” is a misnomer, because greenhouses don’t work that way. But that doesn’t mean only idiots use the term. It is standard (albeit unfortunate) terminology for a fairly well understood warming effect.
You are nit-picking. Lots of terms have meanings which are different from the literal meanings of the words… like nit-picking, for example.
I sometimes write “so-called GHG” or “so-called greenhouse warming” but that gets cumbersome. Yes, is poorly named, but do you have an alternative term to suggest?
Nearly everyone knows that “GHGs” and greenhouses warm things in different ways. Well, everyone except Prof. David T. Suzuki, PhD, CC, OBC, FRSC, the Dean of Canadian Environmentalists.
Anyhow, so-called (yes, misnamed) “greenhouse warming” is important. It is a major reason that that the Earth is not covered with ice nearly to the equator. The anthropogenic contribution to it is modest and benign, but it isn’t zero.
You can learn about it here:
https://sealevel.info/learnmore.html?0=physics#brief
Bravo Dave!
You suffer fools well.
Seim and Olsen (University of Oslo) did experiments in 2021 that proved exactly what you are saying.
Two guys who did some experiments “proves” that everyone else and all other data are wrong, forevermore and by definition?
The entire basis of the scientific method is that no single set of observations or claims can be taken to be absolute, especially not until those findings are shown by multiple iterations to be both repeatable and reproducible.
Even then, the implications of the findings must be evaluated in the context of the totality of the evidence.
And no single interpretation of what something means can possibly discount and disqualify other interpretations of the meaning of such.
Such reasoning, or lack of it, seems to be exactly how it is that the warmistas discount, disregard, and ignore the entire library of information that is contrary to what they have concluded is an absolute fact.
Correct, Dave B, you said thing about temperature at all. The article above integrates temperature changes (which are real) with anthropogenic emission rates. Your long piece above is rendered moot when you fail to include the largest driver of CO2 increase and decrease: temperature.
All your numbers show nothing if you do not consider delta T over the same time period. And you don’t.
To learn how to do this, put down your old notes and read the WUWT article. It is very informative.
Dave Burton is correct. If ΔT had that great of an effect on atmospheric CO2, the CO2 rise caused by the Medieval Warm Period would stick out like a sore thumb in the Law Dome DE08 ice core… It doesn’t.
The one observation that would support a large ΔT component to the recent rise in atmospheric CO2, isn’t present in the only observational data set that would resolve it.
While I have no doubt that the ΔT effect has generally been underestimated, particularly during the Early Holocene and Pleistocene, the Law Dome ice core has adequate resolution over the past 2,000 years. The Law Dome DE08 ice core matches plant stomata chronologies fairly well and overlaps the instrumental record. Ice cores with longer record lengths, that “see” farther back in time, are of much lower resolution and clearly do not capture centennial scale ΔT-driven CO2 fluctuations that are clearly resolved in plant stomata chronologies.
After the last glaciation, temperatures rose about 6°C. CO2 increased about 100 ppm.
In the last century CO2 has risen about 130ppm. This was preceded by no comparable temperature rise.
There is a very obvious cause. We have put directly about 500 Gtons C into the atmosphere. It needs 250 Gtons remaining to raise the ppm by 130.
Hockey stick away 😉
Hopefully you won’t need your extra blanket
Just because Nick is nearly always wrong, doesn’t mean that he is always wrong. We’re talking about direct empirical measurements here, not overcooked models.
So if we both agree that the date presented here by Nick Stokes is correct, are we also saying he is our guru and everything he says is the gospel truth, by definition?
Truly, I do not understand why so many skeptics feel that conceding the point that burning fossil fuels has raised the concentration of CO2 in the air to present values, somehow also implies that anything else warmistas believe must therefore also be true?
It may be that CO2 has been as high as it is now at other points in time in recent geological periods, and we have somehow not found any evidence of that.
But it has to be taken as more likely than not that the data from earth history on CO2 concentration is in fact largely accurate.
Even if there have been brief excursions of far higher amounts of CO2 than our proxies have identified, if these were common or even occasional, we should have randomly seen some evidence of that in proxy data.
Beyond that, picking and choosing what to pay attention to is where the warmistas have gone wrong, and is their glaring blind spot.
If we somehow have no idea what the concentration of CO2 has been over the past millions of years, how can we have confidence in any other data from analysis of proxies?
Warmista want to argue that treemometers are the last word in determining past temperatures, even though there is no logical way to show that they contain any verifiable data at all of past temperatures. And at the same time, they make every lame excuse imaginable to discount the far more consistent and reliable and independently verified proxy temperature data from ice cores in Greenland and Antarctica.
Rewriting history, selective attention to data, dogmatic thinking…Doing such things obfuscates knowledge, and kidnaps rationality.
The thing here is that half of our cumulative CO2 emissions aren’t still in the atmosphere. However, we have increased the total pool of CO2 being actively exchanged between the atmosphere, biosphere, oceans, etc. The result of this complicated material balance equation is an increase in atmospheric CO2.
Some of the increase (20-50%) is due to a combination of land use changes and post Little Ice Age warming. However, unpacking all of the individual components isn’t practically doable.
Great News, isn’t it Nick
Finally, with a bit of human intervention, plant life has been lifted from basic survival rations of CO2.
Be very happy, and hope it continues to increase for many years to come. !
PS, notice how the CO2 helps tree rings.. refer to Mann et al who produced a wonderful graph showing the massive beneficial effects of decent amounts of CO2 plant food on tree growth.
There is a lag. About 300 years, as you well know.
shh.. don’t let the facts get in the way of Nick’s little fantasies.
In the past 170 years, CO2 leads the temperature increase…
With 0.8 C increase since the LIA, the CO2 increase should follow with 10-13 ppmv. The real increase is 120 ppmv…
Oh dear, Ferdi doesn’t understand the huge amounts of extra relased by the warming land surface….
… even though the AGW glitterati go on and on about the huge releases from permafrost and peat etc.
These increases dwarf the human CO2.
But just ignore them
The whole carbon cycle is now operating at a faster rate, to the benefit of all life on Earth. !
b.nice, not so nice to accuse someone of not understanding physics, when you clearly do not understand that a cycle doesn’t add or remove CO2, only moves a lot of CO2… as long as ins and outs are equal.
As is clearly demonstrated by the oxygen balance, the biosphere is more sink than source, the earth is greening. Thus even if land releases of CO2 doubled, land uptake of CO2 more than doubled and the net result is more uptake than release and thus not the cause of the CO2 increase in the atmosphere…
https://tildesites.bowdoin.edu/~mbattle/papers_posters_and_talks/BenderGBC2005.pdf
Fig. 7, last page.
Nick
And so much for AGW, you have just once again proved the point. I have been telling you for a long time you know the truth, just have courage to admit it.
Interesting! So where would the temperature be according to your graph at year 1000? Oops, there goes your theory down the gurgler.
You walked right into that one. 🙂
Back to the drawing board……
Actually, CO2 and Oxygen are directly proportional. The more CO2 is in the atmosphere, the more OXYGEN is in the atmosphere.
Back when centipedes were 5 feet long and dragon flies were nearly as big as people are today, the earth was RICH in CO2, as evidenced by the titanic forests that covered the planet, and equally rich in Oxygen, which is what causes insect life to grow larger.
In fact, the fractalization of life is a natural phenomenon. Everything in the universe started out bigger and through the progression of the system repeats itself in ever smaller expressions. Generation 1 stars after the big bang were HUGE and unstable. Those stars quickly exploded (it’s likely NONE are left currently) to give rise to the next generations of smaller stars. Our own sun is a 3rd or possibly 4th generation star.
Eventually the fractal progression reaches a finite limit where the energy necessary to propagate the next fractalized emission has been depleted. This was evidenced right here on earth with the Nephilim and other “giants” that once roamed the earth. One of the main reasons the powers that be don’t want us to know about or believe in giants in earth’s history is because its solid evidence for bio fractalization.
Everything in the universe exists as a fractal expression of its progenitor.
Duuuuuuuude, what are you smoking?
Actually, O2 levels are falling while CO2 is increasing…
As far as I know, burning fossil fuels uses an equivalent amount of O2…
Or breathing, etc.
Nobody is denying that the burning of fossil fuels causes the reduction of O2 proportionally, hence the nice correlable graphics. But that does not preclude other important sources of CO2 that have contributed to the net increase of CO2 in the atmosphere, such as the increase of soil respiration with increasing temperature and ocean degassing.
Chris, if humans add about 10 PgC/year as CO2 and the increase in the atmosphere is only about 5 PgC/year, then nature as a whole must be a net sink for 5 PgC/year CO2. Except if CO2 escapes to space, which it doesn’t.
A net sink is not a source of CO2, even if some natural source doubled over time, other natural sinks more than compensated for the extra input and at the end of the year the sum of all natural ins and outs was a net sink thus with negative contribution to the increase, now over 60 years since we measure the CO2 levels accurately at Mauna Loa and the South Pole…
Moreover, both the ocean surface and vegetation are proven net sinks for CO2, despite increasing temperatures for the ocean surface.
I think you should read Hermann Harde, 2019. (referenced by Frans Schrijver). Hermann covers all the arguments you have put forward over the years.
Chris,
I have read Hermann Harde 2017 and as result wrote a rebuttal as he made several fundamental errors in his essay:
http://www.ferdinand-engelbeen.be/klimaat/Harde.pdf
The essential error he and many others (Salby, Berry,…) and now Frans, make is to assume that the atmosphere is a simple one-way container with unidirectional fluxes from input(s) to output(s), where the outflux is directly proportional to the height/pressure of CO2 in the container.
That view is completely wrong and all calculations based on that view have no connection with reality.
Almost all natural fluxes are biological and/or temperature caused, bidirectional and hardly influenced by the CO2 pressure in the atmosphere…
I don’t think his 2019 work is any better, as his newest work (2022) still contains the same fundamental error(s)…
Note that the waveforms are not exactly the same.
There are independent processes, not just the dependent combustion. If the seas warm they outgas some of their CO2 without affecting atmospheric O2 immediately.
That is right, also because warmer oceans degas some O2 and cooling absorbs some O2. But the general trend is that for each CO2 at least one O2 was used (plus for eventual present H)…
Frans wrote, “The idea that human CO₂ is the all-determining cause of the increased concentration is based on the assumption that the natural inflows and outflows are always and exactly in equilibrium with each other.”
That’s nonsense. The fact that the increase in the amount of CO2 in the atmosphere is due to our emissions is determined from measurements, not any sort of assumptions:
1.We know how much CO2 there is in the atmosphere, since we measure it quite precisely (since 1958), so we know how much it is increasing.
2.We also know how much CO2 is emitted from burning fossil fuels and making cement, because the bean-counters keep track of such things.
If you subtract the former from the latter, the difference is the amount of CO2 which Nature removes each year.
Frans wrote, “the IPCC-models calculate with a small residence time of about 4 years for natural CO₂ and a large one for human CO₂: “The removal of all the human-emitted CO2 from the atmosphere by natural processes will take a few hundred thousand years (high confidence)”.
Very long residence times are calculated by integrating the hypothetical “long tail” of the CO2 decay curve. The practical “effective residence time” (a/k/a the “adjustment time”) for CO2 added to the atmosphere is about fifty years, making the half-life about 35 years.
How do you measure the sources I’ve talked about above: Primary and secondary volcanism; Rifting process; Hydrothermal vents (worldwide). Can you get me a credible source for this measurement (a single one with data).
As I just explained, J N, in the comment to which you replied, that is irrelevant.
All those things, along with biological sources and sinks, dissolution into the oceans, rock weathering, etc., are lumped together. When added together (with sources counted as negative and sinks as positive), all those things sum to be the net rate of natural CO2 removal from the atmosphere.
We needn’t know any of those parts of that sum to know the sum. We know what that sum is (approximately), because we know the rate at which the amount of CO2 in the atmosphere increases, and we know the rate at which we’re adding CO2. The net natural removal rate is the difference between those two figures.
Let’s try an analogy. Suppose you have a tip jar on the bar, and:
You don’t need to know anything else to be able to conclude that someone took 80¢ from the jar.
You needn’t be able to tell who took it, nor how many peopled contributed money and how many removed money.
It could be that some people put $50.00 into the jar and others removed $50.80.
You don’t need to know who took what to know with certainty that the net sum of other people’s additions and removals was 80¢ removed.
Just for your information, nature puts 95% of the tip in the jar. humans about 5%.
Nature will claim most of the contribution and you will not have much of a claim on whats in the jar.
Is it math or logic that eludes you?
If you have to ask, you probably dont know either. But convince me. Tell me how 95 becomes 97.5% from the next poster.
Makes sense to you?
Joe, a balance has two sides: income and expenses. Some skeptics here have a one sided balance with only income and forget the expenses…
In: 95% natural, 5% human
Out: 97.5% natural, 0% human
Net result: -2.5% natural, 2.5% increase in the atmosphere.
The latter (near) entirely caused by humans.
Richard asked:
Is it math or logic that eludes you?
I can see you not good at math, but what is your logic?
Let me propõse an alternative:
In: 115% natural + 5% human (as compared to previous input, i.e. of the 20% extra input only a quarter is due to humans)
Out: 117.5% natural, 0% human
Net result: 2.5% increase. Is that net increase 100% due to humans or just 25% of that increase?
Chris, it still is 100% human:
The net balance for natural fluxes is:
115% – 117.5% = -2.5%
The net balance for the human contribution is:
5% – 0% = 5%
A negative balance can’t contribute to an increase…
Again, a balance has two sides, but it seems that many skeptics here only look at the inputs and forget the outputs…
What we know is what humans emit with reasonable accuracy thanks to taxes on sales.
What we know is the increase in the atmosphere with reasonable accuracy, thanks to some 70 monitoring stations on least contaminated sites.
We don’t have accurate measurements of the natural fluxes, only rough estimates, but we don’t need them at all. Roughly:
increase in the atmosphere = human in – human out + natural in – natural out
2.5 ppmv/year = 5 ppmv/year – 0 ppmv/year + X – Y
X – Y = -2.5 ppmv/year.
No matter what X and y are:
If X = 10 ppmv/year, Y = 12.5 ppmv/year
If X = 100 ppmv/year, Y = 102.5 ppmv/year
If X = 1000 ppmv/year, Y = 1002.5 ppmv/year
The absolute heights of X and Y have not the slightest importance for the observed result, only the difference between both has and that is known with sufficient accuracy.
I understand your little arithmetics where you single out the human part of the increase. What I try to say is that if there are several sources that contribute to the increase of atmospheric CO2 (e.g. soil respiration due to higher T) why focus on the human portion? Who knows without the extra soil respiration natural sequestration/absorption would have coped easily with the human influx. You are assuming an equilibrium between natural in and out flux. That is not necessarily the case. You cannot just assign one culprit. In my hypothetical case a quarter of the increase is due to humans.
Chris, I am not assuming anything, the result is calculated, not assumed.
If nature was a net source, the increase in the atmosphere would be larger than the human input.
If nature was a huge sink, there would be a decrease in the atmosphere, despite the human input.
As the increase is between zero and the human input, nature is a moderate sink
In all cases, the sink rate is proportional to the extra CO2 pressure above the equilibrium between ocean surface and atmosphere for the average ocean surface temperature.
Which is a nice example of Le Chatelier’s principle for a system in dynamic equilibrium.
Of course it is a matter of some extra abnormal input against all the rest.
If your local bank shows a gain of only $600 at the end of the year while your own deposit was $1200 in that year without any withdrawal, do you think that it is your neighbors, much larger, deposit that caused the gain of the bank?
Yet, as far as I can tell, what Mr Burton says is not refutable.
Dave
Most of what you are saying is correct for right now. But CO2 has gone up and down by 1000s of ppm over geological time so clearly the environment is not just a sink. If that were the case all life would have ended a long time ago.
Nobody is saying that nature is “just a sink”. The reason why the net natural flux is a sink right now is that there is a driving force. There is more CO2 in the atmosphere than there “should be” based on Henry’s Law and the current average temperature of the ocean surface. The extra CO2 is the result of centuries of accumulation of our emissions.
The extra CO2 is transient but the rate of adjustment is slow enough that the gradual accumulation is possible.
The extra CO2 is NOT A PROBLEM.
The extra CO2 is BENEFICIAL.
The extra CO2 is THANKS TO MAN.
Agree 100%.
David said it many times
Bob,
I should maybe let Dave speak for himself, but I want to respond because I am sure you are misinterpreting what he is saying.
He is not saying the situation at the present time is and has always been the case in any absolute sense, just that it is true right now, with CO2 at 400+ ppm, having increased sharply over a relatively short amount of time.
What you are saying about CO2 going up and down by 1000s of PPM over the geological record is factual, but in the context of geological time, the recent increase is instantaneous.
Dave is not saying nature is just a sink, only that it is right now a net sink. Clearly.
We are adding more than is showing up in the air over the course of each recent year.
As I have said on this thread, a cautious person ought to, IMO, leave some room for doubt.
But the things that would have to be believed in order to believe that human contributions from fossil fuel use is not adding CO2 to the air on a net basis, are a longish list of improbables, including the notion that we really have no idea what the level of CO2 has been for the past millions of years.
See again the swimming pool analogy.
One does not need to know how much CO2 is being emitted from volcanic and tectonic sources to know that there is a net absorption of CO2 by the biosphere and the oceans and wherever else it may be being absorbed, at the present time.
As determined from ice core data, we know CO2 has been increasing for thousands of years, presumably by ocean outgassing as the seas have warmed up, even as the Earth had been in an overall cooling trend. We cannot say, by any methodology I am aware of, what the actual amount of outgassing was in prior millennia, since we do not know how much was being taken up by the biosphere.
But we do know that more CO2 was escaping the ocean that was being absorbed and incorporated int the biosphere, because the amount retained in the air was increasing over time.
Because the CO2 levels are an equilibrium between air and sea & land, very much dependent on temperature, and the fluxes are 10x bigger than human emissions, and the source/sink of the oceans so vast – CO2 levels growing while human emissions grow, is just a correlation, and explains why the decrease in human emissions was so hard to detect in the CO2 measurements during the worldwide lockdown.
The temperature dependent co2 level is now 295 ppm, the oceans and forests will continue to act as sink until that equilibrium is re-established.
There is NO direct measurement that proves the atmospheric increase is exclusively the result of anthropogenic emissions. The increase is approximately half of the anthro’ emissions. It is assumed that the increase is anthropogenic. That is the point of the article!
How about addressing each of his points and demonstrating where and how they are wrong? All you are doing is reading out of your catechism book.
Dave is just using the law of conservation of mass which is the basis for the mass balance. Yes, we make the assumption that matter cannot be created nor destroyed when we use the mass balance. No other assumptions. Not even any estimates of all the different sources and sinks. Those are irrelevant. I know from experience that you can’t get it. This comment is for others.
You fail to acknowledge that carbon can be moved in and out of a closed system. That is, there are vast quantities of organic material temporarily sequestered in the permafrost of the tundra. Previous seasonal changes had little impact. However, once the freezing point started being crossed frequently, release of CO2 and CH4 increased. Carbon is effectively being ‘created.’ That is, it is being introduced into the Carbon Cycle where is was previously excluded.
As the Bahamian seas warm, the precipitation of limey muds increase.
But, probably most importantly, as the seas warm, they are less able to extract CO2 from the atmosphere. The NASA-documented greening of Earth has the potential of sequestering an imbalance in CO2, but it takes time for trees to grow and reach their optimum withdrawal. Thus, the Summer draw-down phase can’t keep up with increasing emissions.
In many instances, the error bars around the natural emissions are greater than the anthropogenic emissions, and, strictly speaking, we can’t say what the mass fluxes are with sufficient precision to reach a conclusion. Yet, many, such as yourself, are convinced humans are the responsible agent simply because they produce about twice the annual growth in atmospheric CO2. The author of this article addresses that point, yet no one has yet directly responded to it.
Clyde, please…
There is not the slightest reason to know any individual natural in or out flux of CO2. None. It is completely unimportant, as we know the exact result of all natural fluxes together at the end of the year: more sink that source. That is all we need to know.
I dispose $100 per month in my deposit at the local bank and at the end of the year, the local office shows its result: a gain of $600 over the full year.
Your reaction is that the bank makes a profit, due to your neighbor who disposed and did withdraw thousands of $$ a month, for I don’t know the exact amounts, only that it is many times more than my deposit.
My reaction is to get my money back as fast as possible, because that office is making a loss every year again…
To make the analogy more realistic, instead of the bank sending you a monthly statement balanced to the nearest $0.01, they would have to adopt a policy of sending you a statement showing your balance (and everyone else’s) as $xxx +/- 68%.
Clyde you clearly don’t understand what is said:
I do need only the result of my own deposit and the total result of the bank at the end of the year, without knowing anything of anybody else’s account there, to know that the bank without my money would make a loss…
Sorry equilibriums don’t work that way.
As far as I know, the dynamic CO2 equilibrium between ocean surface and atmosphere is a quite stable change of around 8 ppmv/K for Antarctic temperatures, or 16 ppmv/K for global temperatures over the past 800,000 years.
That is not by coincidence also the equilibrium change for a single seawater sample with temperature for the current average seawater surface temperature (12-16 ppmv/K) per Henry’s law.
Any excess CO2 injection (whatever the source) above that equilibrium (currently around 295 ppmv) would be met with less emissions form the warm parts of the oceans and more absorption in the cold parts. That is Le Chateliers principle.
That is exactly what we see today: the 120 ppmv above equilibrium pushes about 0.24 ppmv/year extra in the oceans (and plants), that is the difference between the ocean outgassing and absorption (both around 20 ppmv/year as base when in equilibrium) and plant absorption and decay.
That is a quite linear response to any extra CO2 above equilibrium, which gives an e-fold decay rate of over 50 years or over 35 years half life time.
There has been a 3 fold increase in CO2 emitted by Termites over the last 20 years. I have derived this from a very accurate model and a count of Termites. If you doubt this, you are welcome to recount them.
Sarcasm detected, but your implied point being that Dave is making assumptions or a bogus model is totally off base. Conservation of mass, total mass of the atmosphere derived from atmospheric pressure and surface area of the earth, concentration of CO2 in the air (change over time), fossil fuel production records, cement production records. Nothing else needed to prove that the sum of all other CO2 fluxes is a net sink by a margin so large that the small errors in each of those measurements are tiny in comparison.
DB, agree. But IMO there are simpler and more basic ways to show ‘That is wrong’. Just posted below.
Warming oceans outgas CO2.
migueldelrio wrote, “Warming oceans outgas CO2.”
Not when the atmospheric CO2 level has increased by 49%.
The temperature dependence of Henry’s Law decreases effective CO2 solubility in water by about 3% per 1°C of surface water warming:
A 49% increase in atmospheric CO2 partial pressure increases effective CO2 solubility in water by 49%.
Which one has the greater effect, migueldelrio? +49% or -3%?
So how do you justify the variation of CO2 in the atmosphere in the Carboniferous, in the Cretaceous, etc?? These periods are preceded by periods of smaller amounts of CO2 in the atmosphere. What where the species “burning” in those times? how do you explain the highs and lows of CO2 in geological times?? Homo Sapiens has roughly 300 000 years and we are to blame only since 1950 for the increase of CO2 in the atmosphere, it seems…And we are talking about differences in the range of 1000 ppm. By the way, CO2 in the seas does not come only from the atmosphere, so your numbers have no meaning and Henry’s law cannot be directly applicable.
Justify, or explain?
Here is one way it is removed from the air:
Here are two ways it can be released again:
http://cdn.sci-news.com/images/enlarge7/image_8936e-Chicxulub-Asteroid.jpg
Exactly!! Thanks for the Illustration. Clearly Dave must check for other sources of Carbon movement in nature other than anthropogenic, do you agree? 🙂
Rifting and hydrothermal vents still happen today…
I understand your point.
And I think I understand what Dave is saying as well.
I do not know if I would have said it exactly as he did, but the point he is making is that CO2 is now so much higher a concentration in the air than it was a hundred years ago, and at all points in time prior to that were we have measured it, that ocean outgassing due to slight atmospheric warming has effectively ceased, on a net net basis.
He stated that in places the ocean is very warm, there is outgassing, but this is more than made up for by the parts of the ocean surface that are very cold and absorbing CO2.
He also seems to have done the math on the overall effect of increasing CO2 in the air, vs the tiny amount of overall ocean warming.
I would have added the caveat that the ocean was not in equilibrium with the air prior to any human caused effects, as the lag is nearly a thousand years between atmospheric warming and the ocean responding fully to this change, at least as determined by the ice core data.
I think it may even be likely the ocean is still warming up at the deepest layers due to the interglacial starting.
Even a small pond will not warm up at the bottom in an entire Spring, Summer, Fall cycle, after a single Winter of cooling.
So, yes, to the extend that one should always be cautious of speaking in absolutes, I see your point.
I took Dave’s point to be that the amounts of CO2 added to the air by burning fossil fuels is more than enough to account for the recent increases.
All that we know from Earth history and the ice cores backs up the view that CO2 would not be over 400ppm if not for burning fossil fuels.
I myself am only going to say it is highly probable, not assert it is an absolute fact. like the clear sky is blue.
“I would have added the caveat that the ocean was not in equilibrium with the air prior to any human caused effects” – Precisely, the caveat that makes all the difference. That’s why I disagree mostly with Dave. And the oceans are still not in equilibrium nowadays, due to the unaccounted thermal processes occurring in their bottom. Search for CO2 production processes near Hydrothermal vents for instance. This is a highly neglected process as well as the ongoing rifting process.
I have made the point myself at various times that the amount of natural CO2 release from volcanic and tectonic sources is very poorly measured and almost certainly vastly underestimated.
But even taking that into account, it would be an amazing coincidence, one I cannot believe, that CO2 is randomly higher now that at any time for which we have proxy data from the past.
It is not impossible that all of those proxies are wrong, but there are so many of them, over such a long period of estimates by so many researchers, using so many methods and source of data, that I do not believe it, given the weight of the evidence.
Our knowledge of past values of global temps, or at least temps at many discreet points in time and location in the past, is one of the most compelling reasons to be sure the warmistas are full of crap.
If we cannot trust what geologists have learned about earth history over the past hundreds of years, then anything is possible, and we know nothing.
In that case, maybe warmistas are correct.
I personally aint buying any of that.
You have all these potential “usines” of CO2 in the oceans. Who accounted their CO2 production and the consumption nearby by local biological comunnities?
And their rhythm of CO2 consumption/production is not known. A slight increase in oceanic volcanism and be responsible for CO2 increase after by outgassing. We simply don’t know. That’s why all this CO2 thing is so controversial (and I’m not even talking about the controversy about his real role on climate, only about the net balance and possible sources).
We definitely do not know and cannot know the details of how the myriad sources and sinks combine to result in the net sink. But we can absolutely show that there is a net sink.
Do you grasp the concept of the mass balance?
Do you grasp the concept of of the origin of plots to make a mass balance?
Most CO2 from undersea volcanoes is simply dissolved in the deep oceans under the extreme pressure at that depth and the under saturated waters for that temperature. Except if the gases reach the atmosphere (Bermuda triangle someone?).
The volcanic vents around mount Etna were measured during several years, it is one of the five most active volcanoes on earth and when extrapolated for all subaerial volcanoes, the CO2 releases are about 1% of human emissions…
https://www.nature.com/articles/351387a0
Convection, Upwelling, food chains (yes, there are lots of living beings near hydrothermal vents). Considering your justification, it was impossible to have volcanism because materials come from extreme pressure and huge depth (even more spectacularly in Cape Verde and Hawai which are “hot spot” volcanoes. I don’t know any reason why CO2 should not reach the atmosphere from ocean depths.
J N, it was about the undersea volcanoes, which top still is 1,000 and more meters below sea surface. Of course that CO2 will reach the top, but probably immediately dissolved in the cold waters of the deep oceans…
All that means is that the proportion of CO2 from outgassing versus plant respiration and decomposition shifts as the Earth warms.
Burton focuses on CO2 in solution and ignores what is going on with plant/soil respiration and biological decomposition. It is basically cherry picking to only look at one source and ignore the others.
No, Spencer. That’s not what Burton does.
He knows about conservation of mass and is able to do 2nd grade math.
It has been said (many times) that when someone has run out of good reasons to object to an argument, they resort to insults.
Thank you for admitting you have run our of logical ripostes.
LOL Clyde! I was remarking on how you reverted to disparaging Dave Burton, by dismissively referring to him as “Burton”.
And the subtraction problem admittedly may be 4th grade math now that the public schools have been decimated.
He’s oversimplified the problem. CO2 levels barely reacted to decreased emissions during lockdown.
And why is it that nature seems to absorb half of human emissions regardless of the level? If human emissions resulted in levels increasing by ~2.5ppm a year say 50 years ago, why is that still the case today, with much greater worldwide emissions?
As far as I know the co2 measurements done at Alert, where it always cold, were in agreement with Mauna Loa – though the ups and downs of the seasons was much greater.
To me, this would indicate that CO2 establishes an equilibrium fairly quickly – the seasonal cycle is also proof of this.
Though, I have to say it could be more likely proof of equilibrium established with ground sources, riding on top of the balance with the sea, which is probably taking longer to establish since the sea is so deep.
There is a third way that it can be released. When rain falls on exposed limestone and when the rootlets of plants breakdown limestone to obtain nutrients.
A fourth mechanism is when organic material is sequestered on shorter timescales than subduction. Notably, that is in the high northern latitudes. Now, warming is allowing microbial decomposition of the buried organic material and releasing CO2 and CH4.
A fifth mechanism to consider is that as the CO2 increases in the oceans, it encourages phytoplankton blooms. With the seasonal die off, the plankton immediately begins to decompose and release CO2. Because the surface waters are warmer than formerly, less CO2 can be absorbed and the CO2 will have to be released to the atmosphere.
Of course there are a welter of such factors.
I only meant to list a couple of large ones that occur over vast amounts of time and involve vast amounts of CO2, and also which may not have occurred to everyone.
CO2 was not lower prior to the Carboniferous, so there’s that.
As a matter of fact was my fault. I should have said Permian after the Carboniferous depletion. Eve so, was lower in the silurian. These are examples that nature, without man, is not always a net sink of CO2.
You are saying that the OCO-2 maps are wrong, that there is no significant out-gassing taking place in the oceans?
And, you are completely ignoring the soil and plant respiration, which Frans went to some length to explain.
Nobody is ignoring any data or claiming anything except that the law of conservation of mass is true.
The law of conservation of mass doesn’t apply when you have no idea of the masses involved.
I’d bet money that if humans get to net-zero or to a totally carbon free economy (maybe with the help of magic…) and if climate conditions were basically the same – those humans will be perplexed that co2 emissions will still be growing in that 2-3ppm range.
Wrong: Bookkeeping apllies also in a dynamic case.
Clyde, nobody says that there is no outgassing in the tropics, all what is said and proven, is that nature is more sink than source. Proven by the mass balance. That is all.
The way I read Burton’s statement, he is claiming that there is no longer any out-gassing after a 49% increase.
Clyde, The observed greening of the earth shows that plant and soil respiration is a net co2 sink.
Interesting, and I upvoted you
But it brings up the question, has anyone measured the co2 dissolved in the oceans over the past few decades?
There are lots of processes to affect CO2 in the oceans, biological and chemical like buffering, so that needs to be studied before one can say d(CO2)=(human emissions)/2.
Then again I really don’t care about the CO2 levels, CO2 is life so it could double and I would consider that a good start.
But for the sake of science, the whole cycle needs to be studied well.
It takes hundreds of years for that response.
The ice core data on that is very clear, as is proxy data from many other sources.
We also know that it was very warm for 1000s of years earlier in the Holocene, warmer than now, and there was nothing like modern levels of CO2 in the air.
I do not see what is so hard to believe that we accidently saved the biosphere from CO2 starvation extinction.
Dave seems not to understand that CO2 was increasing and decreasing a lot in the atmosphere when we where not here as species….
I did not see where Dave said anything that should cause you to say that.
I did not see him say that humans adding CO2 by burning fossil fuels is the only way that CO2 can increase.
Just that it is one way.
I think Dave Burton has it right.
The problem is here “There is no “natural increase” in the amount of CO2 in the atmosphere. Nature is removing CO2 from the atmosphere, each year, not adding it. Mankind has added about 180% of the measured increase in the amount of CO2 in the atmosphere since 1959.”. This is nonsense.
How so?
Clearly we are adding more to the air than is staying in the air.
We have increased the amount of fossil fuels we burn hugely in just a few decades, and yet the amount it is increasing every year has only increased slightly.
We are adding some for sure. If it is more or less than nature we don’t know for the reasons I’ve pointed (lots of unknowns due to geological processes). You are probably not understanding my point. I think that Anthropogenic released CO2 is less than Dave is saying because he is not accounting with other natural release sources.
You don’t need to account for the details to know that CO2 is accumulating at a rate LOWER than the rate of emissions. That can only be the result of nature being a net sink that absorbs about half of what we emit. Nature can’t simultaneously be a net sink and a net source.
Because if it was true all life would have died off long ago.
I took him to mean on a net basis.
Obviously he know that there are many sources of CO2 such as you have mentioned.
But I doubt his “net” estimation because we simply do not know that. The sources I mentioned are not accounted anywhere. We do not even know the amount of thermal activity and chemical reactivity of all these stuff (mostly hydrothermal vents).
What he said, and I may have read him wrong, but after years of conversations here and on Twitter, etc, I think I know his point of view, anyway…what he said was that we have a very good idea of human additions of CO2 because bean counters keep track of how much fossil fuels we dig up and pump out of the ground and burn every year.
Given that this adds up to more than the amount that is showing up in the yearly increases in the atmosphere, then if everyone has underestimated natural sources, that simply means that even more is being absorbed by the ocean and the biosphere.
Okay, an analogy might be, we have a huge swimming pool, and it is raining. We do not know how much rain is falling into the pool, but we know we are adding 1″ of water a day to the pool with a hose.
But every day, the pool is only rising by 1/2 an inch.
So, no matter how much the rain is adding, just from what we are adding with our hose, we know a lot is leaking out, almost half of what we are adding with the hose is not showing up in the level of the pool.
So therefore, just what we do know, and not needing to account for what we are unsure of (the rain, someone pissing in the pool, etc), we know for sure that the ground under the pool is on a net basis absorbing water from the pool, not adding to it even more.
Even if water from the water table in the ground is adding water to the pool, it is more than made up for by some leaks in some other place in the pool.
Do you grasp the concept of the mass balance?
Do you grasp the concept of the origin of plots to make a mass balance?
But, he astutely ignores discussing them.
Note what recent research is claiming:
https://scitechdaily.com/new-research-shows-estimates-of-the-carbon-cycle-vital-to-predicting-climate-change-are-incorrect/
I have no idea if the result of the paper is accurate, but if it is it makes much of the discussion here not very accurate. The authors claim that the measurement used by the IPCC on the land flux of CO2 are off by 3X the amount of CO2 human produce. This was Freedman Dysons point Freeman Dyson – Scientist – The balance of carbon in the atmosphere – Web of Stories
This is similar in my view to the assumption that geothermic heat adds nothing to the surface temperature. What does new research show? 15% of ocean heat content comes from geothermic. If this is accurate, a bunch of changes are in store for out understanding of the earth’s energy budget.
At last someone touches the spot!!!
There is no more point in discussing each and every source and sink than there is in discussing the middle names of each person in the census.
It would be interesting to know more about the many fluxes and how they are changing. It is utterly irrelevant to the question of whether those fluxes are a net source or a net sink.
An analogical assertion without support.
I have provided support for changes in the fluxes and what the probable error bars are. You just pontificate.
https://wattsupwiththat.com/2022/03/22/anthropogenic-co2-and-the-expected-results-from-eliminating-it/
Clyde,
You and I have discussed these points over probably going on a dozen head posts over the course of months.
Several others have likewise attempted to find some way to disabuse you of your pet beliefs. All without the slightest impact.
To my recollection, you have never acknowledged that conservation of mass requires a mass balance taken over the atmosphere to be a valid concept. In fact, I am pretty sure that you told me that the “mass balance doesn’t close”. (Which is like saying we have no way to figure out the value of x if x = 1 + 1).
You keep going back to the well to draw out another irrelevant example of a natural flux that we a) can’t measure accurately, or b) is bigger in magnitude than anthropogenic emissions.
I do not assume that you’re disingenuous, but a person trying to be a troll would not in the end, make different arguments.
No J N, it is math and logic.
And what else? It is NOT a claim that the increased CO2 causes a temperature rise or that it is harmful in any way.
Trying to deny math and logic is not a good way to win the argument against climate alarmism.
Where is your math and logic?
What math and logic? The problem here is that most people are thinking in systems in equilibrium and CO2 sources change through time. Is that was not true, CO2 would be constant throughout geological times (prior to man), which is not true, even in the last 400000 years. Everything changes the balance of CO2 (amount of biomass, temperature, etc, etc.). most guys here are considering the Earth as a system perfectly in equilibrium and the Earth in an imbricated amount of sub-systems, Highly Chaotic and dynamical. So nature exchange periods of net sink of CO2 with periods of net source (with or without man). The rhythm and the reasons for this are highly unknown.
Burton is regurgitating the standard paradigm. This author is challenging the prevailing view and I have yet to see anyone even attempt to disprove Frans’ points, let alone succeed in dismissing them.
Clyde, the author uses the ideas of authors which were refuted long time ago (CO2 in ice, Jaworowski) and uses a complete wrong scheme of the CO2 cycle, used by many of his references (Salby, Harde, Berry,…): one-way input, container, output, while the bulk of the CO2 fluxes are bidirectional, and don’t change the amounts in the atmosphere when in equilibrium.
All completely wrong, because of that misconception, which is the base for his complete wrong conclusions.
The conclusions of his writings violate the mass balance: you can’t have one way human emissions and a net addition from all natural sources, as that would give an increase in the atmosphere that is larger than from human emissions alone.
We see a smaller increase than from human emissions alone, thus nature is a net sink not a net source.
Any nice theory that violates one single observation is rejected. That is the case for Frans Schrijver, Harde, Salby, Berry,..
The author questions the reliability of the ice core data. Unless someone can come up with good reasons why the concern is invalid, then there is a cloud handing over the broad sweeping conclusions from ice core data.
None of the discussion by the author is relevant to the question. Some of his points might be right, some wrong. None of them relevant.
If Biden gets 400 million votes, do we need to ask all 168 million registered voters how they voted and be certain they are telling the truth in order to be able to know whether there was fraud?
Yet another dogmatic assertion without support! To discredit the author’s conclusions you need to take them in order and demonstrate with “numbers and logic,” why they are wrong. Instead you present yourself as an authority whose statements need no support or citations.
If you give me 37 claims of evidence that the moon is made of green cheese, I’m not going to be willing to review them each in turn and dispute them when it is demonstrably impossible for the moon to be made of coagulated dried bovine proteins and lipids.
If you claim that it’s invalid to use a mass balance calculation over the atmosphere to show that half of our CO2 emissions into the atmosphere are removed by the net effect of hundreds of highly complex and practically unmeasurable source and sink fluxes, then there is no common ground for discussion.
The author hasn’t read anything about the modern ice core measurements and relies on speculations of 30 years ago which meanwhile are fully rejected…
That’s complete B.S. and so is the original article. Neither of you account for volcanic action. Mount Saint Helen’s put more co2 into the atmosphere than one year’s worth of humans global contribution. 80% of the world’s volcanic activity occurs beneath the oceans. If there is an increase of the co2 it seems reasonable to assume an increase in underwater volcanic activity.
Do you have a citation for your claim about Mt. St. Helens?
Platlin wrote, “Mount Saint Helen’s put more co2 into the atmosphere than one year’s worth of humans global contribution.”
Where on earth to people hear such nonsense? Mankind adds about 35 Gt of CO2 to the atmosphere each year, not counting “land use change” effects. The USGS estimates that the 1980 Mt. St. Helens eruption added 0.01 Gt of CO2 to the atmosphere.
https://www.usgs.gov/programs/VHP/volcanoes-can-affect-climate#:~:text=The%201980%20eruption%20of%20Mount%20St.%20Helens%20vented%20approximately%2010%20million%20tons%20of%20CO2%C2%A0into%20the%20atmosphere%20in%20only%209%20hours.
See if you can see the spike in CO2 level from any volcano?
The biggest volcanos actually cause a slight, transient reduction in the rate of CO2 level increase.
What’s more, “volcanic action” is irrelevant to how we know that mankind is responsible for about 180% of the increase in atmospheric CO2 since 1958. Volcanic action is just a component of the natural fluxes, the sum of which we can calculate from the available information.
We needn’t know any of those parts of that sum to know the sum. We know what that sum is (approximately), because we know the rate at which the amount of CO2 in the atmosphere increases, and we know the rate at which we’re adding CO2. The net natural removal rate is the difference between those two figures.
Probably because the atmospheric CO2 is more sensitive to temperature changes than anything that Man does.
Perfectly agree!
No, it is the reaction of mainly tropical forests to the increased scattering of sunlight after the Pinatubo, that enhances photosynthesis. That can be seen as an opposite change in CO2 and δ13C. If the reaction was from the ocean surface, CO2 and δ13C would change in parallel.
“There is no “natural increase” in the amount of CO2 in the atmosphere. Nature is removing CO2 from the atmosphere, each year, not adding it.”
My oh my!! Another everythingologist that does not have the slightest clue about Earth Systems. Apparently the authors from the Figure 1 do not have the same clues either, considering that their oceans are a monotonous bottom covered by sediments… The primary and secondary continental volcanism is always adding CO2 to the atmosphere. The amount is clearly in default in the Figure 1 (only considers volcanoes, not secondary volcanism processes). Go to Iceland and you will see gases coming from several places without an active volcano (CO2 included). There is another source, always forgotten, which are submarine volcanoes and the rifting process itself, as well has the huge amount of hydrothermal vents (that seems to have also a role in convert organic Carbon in CO2 (imagine that)(search google). In a warming world is perfectly logical that the oceans “outgase” more CO2 including this new added one (and isotopically similar to the one coming from burning fossil fuels).
I think he meant as a practical effect over the time scale in question, IOW a few decades.
Obviously CO2 has been increasing over the entire interglacial period, as it has always done until full glacial conditions reemerge.
Even so, in few decades, you can have great increases or decreases of CO2 balance in the sources I mentioned. The geological records miss resolution to be comparable to instrumental measurement of atmospheric CO2, just that. We simply do not know if we were getting the same amount of variation in the past because the data comes from proxies, not instruments. Considering this, we cannot directly compare data. If you had only a point representing the last 100 years of CO2 what that would be? That’s more or less what’s possible from geological proxies at best.
That is true, there is a resolution issue with proxy data.
It is unclear exactly how much adjacent layers in the ice cores may have exchanged CO2 over long stretches of time, for example. Although there is also a large degree of disagreement on the question of how uncertain or not this data is.
I am also aware that there are some samples of air from past historical times which show a high CO2 concentration.
Which is why I try not to speak in terms of “facts” and “knowing”.
I can only say what I believe to be the case based on the total weight of all of the evidence I am aware of.
And if we go back a few years before Ice Cores could be used to study CO2, for instance in varved deposits, things are even worst. We simply do not know if the rhythm of CO2 change then was similar or comparable to nowadays. Saying that we are now increasing the CO2 quicker than anytime in the past it is a feeling, not science.
I am pretty sure it is more than a feeling.
*cues music*
https://youtu.be/ufQUxoidxkM
I would not say at anytime in the past.
Just that we have zero data that it has ever been at present levels over the past many millions of years.
So if there have been belches in the recent geological past that raised CO2 to present day levels, it must not have persisted for very long.
Likely if that has happened from a large impact or volcano or whatever, the CO2 itself did no harm. On the contrary, it must have made everything grow much faster, just like it does now.
True, because it will induce greening and extract it from the air. Increased availability of CO2 in the oceans will accelerate the rate of deposition of limey muds in the tropics, sequestering the CO2 as carbonates. What happens with calcareous shell-building organisms when the raw material becomes more abundant and it takes less energy to extract it from the water?
Well…

https://www.sciencedaily.com/releases/2016/01/160116215419.htm
So, you are agreeing with me?
No, I think he is agreeing with you.
As do I.
What you said was exactly what I was referring to.
Nevertheless, I am still waiting for some hard evidence that CO2 was ever as high as it is now over the past several million years.
The long standing proxies used by geologists and published in Earth history texts before the era of global warming alarmism, showed that it has been many tens of millions of years since CO2 was over 400ppm.
Keep in mind that I am aware of the temporal resolution of geologically derived proxy data.
Anyway, I do not think anyone here is disputing that data.
The impasse seems to be regarding how much CO2 is being released worldwide on a yearly by fossil fuel usage, vs the total amount that is accumulating in the whole of the atmosphere per year, and how those two numbers compare.
Just so I can understand what we are supposedly disagreeing about, are you disagreeing with estimates of how much CO2 is released every year by fossil fuel usage, or do you disagree with estimates of the amount of CO2 is represented by the several PPM of increase every year in recent decades?
Or is it something else?
I think it is something else, but please, so we can make some progress, lets go over it one thing at a time, eh?
My position is that we know the fossil fuel releases better than anything, although there is reason to believe that they are a lower bound.
I believe that the monthly MLO values have a greater uncertainty than the anthropogenic emissions. MLO, while approximately mid-point to the range in seasonal and annual changes, may not be a good indicator of the global mean.
Those who are relying on the mass balance argument are treating the global fluxes as though they are exact when I and Roy Spencer are of the opinion that the natural values have been manipulated to make a case for mass balance.
Clyde,
You are probably not aware that Mauna Loa is NOT used for the global CO2 content of the atmosphere. The average of several near-surface stations is what is used as “global”. Accuracy +/- 0.2 ppmv, better that for human emissions (+/- 0.25 ppmv), but the latter may be underestimated by human nature to avoid taxes…
https://gml.noaa.gov/ccgg/about/global_means.html
But the difference between MLO and “global” anyway is small…
Dr. Spencer BTW also is sure that humans are the cause of the CO2 increase in the atmosphere, after some initial doubt and following discussions.
If you can manipulate CO2 measurements at some 70 “background” stations all over the world, maintained by different organizations of different countries, one must have a lot of power to silence everyone involved…
But I don’t think that is what Dave means.
If not, then I am misunderstanding something here which I thought I understood.
The Assertion is a NET atmospheric increase from 280 PPM to 419 PPM, requiring a NET 295 GtC increase in the atmosphere.
( What are you disputing? What are you asserting is the correct answer?)
The assertion is that over the time period of this increase, total human CO2 output has been 650 GtC
(What are you asserting if this is wrong?)
Are you saying there would be some dangerous cooling if it wasn’t for man’s contribution of C02?
Jim wrote, “Are you saying…”
If you have a question about something that I’ve written, please quote it. Otherwise I have no way of knowing what you’re asking about (especially when your comment is far down the page from mine).
In fact he did not say a single thing about temperature. Temperature drives CO2 concentration under most circumstances but not all circumstances. In the current state of things, many decades of steady accumulation of emissions in excess of what dynamic natural sinks are able to absorb, has resulted in CO2 rising faster than it would have risen due to warming out of the Little Ice Age.
“Nature is removing CO2 from the atmosphere, each year, not adding it.”
If that statement were true, all green plant life would have gone extinct. long ago. Of course nature is adding CO2 to the atmosphere, that is why it is called a “cycle”.
I think what he means is for the past 60+ years or so, since we have been adding it by burning fossil fuels.
Adding so much CO2 has tipped the scale to net absorption by the biosphere and the ocean.
It must be doing that, because just what we add from burning fossil fuels is way more than we can measure staying in the air over each year.
I wrote, “Nature is removing CO2 from the atmosphere, each year, not adding it. Mankind has added about 180% of the measured increase in the amount of CO2 in the atmosphere since 1959.”
Robert of Texas replied, “[you wrote] ‘Nature is removing CO2 from the atmosphere, each year, not adding it.’ — If that statement were true, all green plant life would have gone extinct. long ago.”
Come on, Robert, can’t you at least read the very next sentence before replying? What part of “since 1959” is unclear?
up-voted, yet the word “NET” preceding “CO2 from the atmosphere” would have helped.
Very clear Dave. Thanks.
Judging from some of the other comments, apparently it’s not clear enough. But thanks, Tom.
You cannot make people understand that which they are determined to not understand. It appears from the rating of your post that a substantial number, perhaps a majority, of the readers here reject the logical explanation for the atmospheric CO2 increase since the Industrial Revolution. I find this somewhat discouraging.
Prove it. You may be so dim as to not see any other possibilities but I, and others, are not. You have the elephant’s tail and I am suggesting there is an elephant attached.
We know how to use math and logic to inform opinion and emotion.
Do you grasp the concept of the mass balance?
Except they started rise before that. You gloss that other pretty easy with your “logic”
I personally would like to delineate what exactly we all agree on and from there we can isolate just those items various individuals here are disputing.
Certainly we all agree on a large number of separate details.
Can we agree that the rate of increase has changed dramatically in recent decades?
The problem is that is not even a blink in geological time. So your statements for all intensive purposes are meaningless, aside from the fact that CO2 started rising 50 years prior to that.
Bob, we don’t have very detailed CO2 levels from geological times. We have a much better resolution (560 years) for the past 800.000 years and these did show a rather constant ratio between CO2 levels and temperature. For the current ocean surface temperature, that would be around 295 ppmv, not 415 ppmv…
Even better resolution (20-25 years) for the past 120,000 years, very good resolution (8 years) for the past 150 years and monthly values since 1958. Before 1958 nobody did even know that there were seasonal variations…
There is some 5-10 ppmv CO2 rise over the Holocene and a similar rise in CH4. No origin known, but even for that small rise, humans may be the cause by shifting their lives from hunting to agriculture and burning forests to clear land.
Since about 1850 the origin of the CO2 rise is completely clear: human use of fossil fuels. Every single observations supports that conclusion and none refutes that.
Every alternative explanation violates one or more observations, so insisting that everything else than human emissions is to blame is a lost case, as that is one of the few points where the IPCC is on solid ground. There are better arguments, where the IPCC is wrong on multiple observations…
Ferdinand
Are you really trying to say that the only natural control on how much CO2 is in the atmosphere is temperature? Where does the CO2 that out gases from the oceans come from in the first place? is it 100% animal respiration driven? I am not debating your calculations but there is much more to this cycle over geological time spans, and while i don’t have the time to go looking I am sure I have read many studies that show swings of over 70 PPM over the last 200,000 years.
Bob, please, I was talking about the past 800,000 years, not millions of years, where there is a nice correlation of about 8 ppmv/K between temperature and CO2 levels in the atmosphere. That includes the swings of 100 ppmv between glacial and interglacial periods. See the Vostok ice core measurements. Most of the differences is from the (long) lags between temperature and CO2 changes.
8 ppmv/K is for Antarctic temperatures, for global temperatures that should be around 16 ppmv/K. Not by coincidence about the change of solubility of CO2 in seawater with temperature (12-16 ppmv/K for current average seawater surface temperatures).
Antarctic ice cores sample global CO2 levels, proxies like stomata data sample local/regional CO2 levels, but in general have a better resolution to see local/regional variation, still not necessarily global.
BTW, the current increase of 120 ppmv in 170 years would be visible in all ice cores, including the 800,000 years Dome C record (560 years resolution) at a lower amplitude (around 35 ppmv), still certainly visible in the record.
Good point about the C14 residence time being too short because of exchange with C12.
You’re clearly right.
Ferdinand Engelbeen has been pushing his mass balance argument very persuasively for years. With a great deal of head-scratching I worked out that by his argument then any separate CO2 production sub-unit in the world’s CO2 system could, by the same arguments, be considered the cause of atmospheric CO2 increase. Please don’t ask me to repeat the process, it made my brain hurt.
The isotope changes could be simply explained by the fact that planktonic carbon fixation may or may not be changed by nitrogen pollution (Haber process, changes in dominant species), dissolved silica run-off (diatom increases), sewage, phosphate, organic fertiliser etc runoff, or all three (see the Sea of Marmara for the way these may have catastrophic effects on the warming rates of affected sea areas).
Here’s one guess about the light isotope signal: oil/surfactant/lipid pollution warms the sea surface, increases stratification and by supressing wave action reduces stirring and hence the bringing of nutrients up into the light zone. Oleaginous plankton release lipids which smooth the surface and allow light penetration to the still nutrient rich lower levels, while countering the reduced CO2 levels (less stirring from the lack of breaking waves) by switching their carbon fixation to the carbon concentration mechanism (CCM) that prescient evolution has prepared for just this situation. The CCM discriminates less against the heavier carbon isotopes so the carbon export to the deep sea is isotopically heavier: light isotope is misinterpreted as a fossil fuel burning signal.
We do not live on a planet ruled by Gaia — we are dominated by the Goddess Oceana, more than three times the size of the terrestrial ecosphere.
JF
Julian its all about CHANGE in co2 fluxes in the last century.
Exactly : CHANGE, the central word here is Change!!!! Most opinions here think the Earth as a system in perfect equilibrium. The problem is that sources and sinks of CO2 CHANGE depending on many factors, including temperature. Thanks Hans.
Sure! From the vostok ice core we can derive the value of current natural temperature dependent co2 equilibrium: that is 292 ppm, the rest of the observed rise is human addition.
No, that 50 year residence period was not measured. It was invented out of thin air by Houghton. He needed it to be that high for the models quoted in the IPCC reports to work. There is a graph I have not seen for many years that compares all the different empirical and experimental measurements of CO2 residence time. They all came in at less than 10 years.
Crisp the decay rate of any excess CO2 in the atmosphere is measured, not invented.
Residence time and excess decay rate are two complete different things with very little in common. Residence time is comparable to the flow of goods (thus capital) through a factory, decay rate is how much gain (or loss) the capital put in that factory makes.
You can double the throughput and make a loss (because you have to pay more overtime) or get from a loss to a gain. No clear connection between the two…
The formula for residence time is:
Mass / throughput
For the current atmosphere that is:
830 PgC / 210 PgC/year = about 4 years
No matter the direction of the fluxes. If half a year the fluxes are from the oceans to vegetation through the atmosphere and the other half the fluxes reverse, the residence time still is 4 years, while the net effect may be zero change in the atmosphere or a small loss or a small gain at the end of the year.
The formula for the e-fold decay rate for a linear process is:
Tau = cause / effect
To get 1/e or 37% of the initial extra amount above equilibrium.
For different years that gives roughly:
In 1959: 25 ppmv extra CO2 in the atmosphere, sink rate 0.5 ppmv/year, tau = 50 years, half life time 34.7 years
In 1988: 60 ppmv extra, 1.13 ppmv/year, tau = 53 years, half life time 36.8 years
In 2012: 110 ppmv / 2.15 ppmv/year, tau = 51.2 years or a half life time of 35.5 years.
Looks quite linear to me.
Ferdinand, once again you make the system as static. The Earth’s greening can decrease residence times for instance. If emissions cease, it can do that in a logarithmic way due to CO2 starvation.
J N,
Nothing is static in what I said…
The residence time nowadays is around 4 years.
As the earth is greening, that gives more in and out flows for vegetation, thus reducing the residence time.
On the other side, as the CO2 mass in the atmosphere is increasing, the residence time also is increasing if the throughput remains the same.
I have looked at the older and younger estimates of the residence time and it seems that the more recent give a longer residence time…
Not important at all, as to remove any extra CO2 above a dynamic system in equilibrium, that is a totally different mechanism than what makes the residence time and involves the differences between inputs and outputs, not the height of the throughput.
The difference between inputs and outputs is a matter of extra CO2 pressure (pCO2): if that increases, less CO2 will be released out of the warm parts of the oceans and more will get into the cold parts.
That has no influence on the CO2 release of starving vegetation, but enhances the uptake by living vegetation.
The net effect is a remarkable linear response of both together on the extra CO2 in the atmosphere above the dynamic equilibrium between ocean surface (dictated by its average temperature) and the atmosphere.
That is a measured about 0.2%/year of the ΔpCO2 between atmosphere and ocean surface. Or about 2.4 ppmv/year for the current 120 ppmv above equilibrium.
If human emissions ceased today, the above sink rate would remain the same in the first year, thus reducing the atmosphere with 2.4 ppmv, next year thus a little less and so on until equilibrium is reached and then gets zero. The e-fold decay rate then is about 50 years or a half life time of around 35 years…
Crisp, the decay time of any excess CO2 (whatever the cause) above the temperature established equilibrium between ocean surface and atmosphere is measured, not invented.
The formula for the decay of any excess for a linear process is:
Tau = cause / effect
Where Tau = the time needed to reach 1/e or 37% of the initial excess.
In 1959: 25 ppmv extra CO2 in the atmosphere, sink rate 0.5 ppmv/year, tau = 50 years, half life time 34.7 years
In 1988: 60 ppmv extra, 1.13 ppmv/year, tau = 53 years, half life time 36.8 years
In 2012: 110 ppmv / 2.15 ppmv/year, tau = 51.2 years or a half life time of 35.5 years.
Looks very linear to me.
Nothing to do with the residence time which has a totally different formula:
Residence time = mass / throughput
No matter the direction of the throughput.
Currently: 830 PgC / 210 PgC/year = about 4 years.
Perfectly agree!
The earth is warming up and that causes many natural sources of CO2 to increase their emissions.
The growing human population using more energy is just another source of CO2.
Proper bookkeeping, on a year by year basis, should be performed.
This bookkeeping should also be done regarding CO2 sinks.
Do you grasp the concept of the mass balance?
Again? Do you understand the concept of a dynamical system?
J N, too many here only look at the increasing sources and forget the increasing sinks… For a balance you need both sides…
DB says “We know from reliable measurements that every year since 1959 the amount of CO2 in the atmosphere has increased by less than the amount of CO2 which mankind has added to the atmosphere (with the arguable exception of 1973, a year in which the two numbers were very similar). In other words, mankind increases the CO2 concentration in the atmosphere, and nature reduces it (since 1959, at least).”
We are told that termites emit over 2 times the CO2 that humans do. It follows from your logic that all the atmospheric increase is from termites or at least 2/3 of it. The rest of nature emits 20 or 30 times what humans do. Isn’t it reasonable to think the increase id due proportionally to the sources?
DMA, that reasoning is wrong.
To repeat the same example as in other places: if I dispose $100 per month and the local office of the bank at the end of the year proudly announces its yearly balance that shows a gain of $600 all over the year, I am pretty sure that the local office makes a loss without my contribution, whatever my neighbor disposed that year (even if that were millions that year).
It is not about what individual natural fluxes did or didn’t. It is about the effect of our CO2 emissions on the total amount of CO2 in the atmosphere. Even if some natural source doubled, some other natural sink(s) must have increased to get the net result, which is more natural sinks than sources over the past 60+ years.
Except again, prior to man contributing to the mass balance what kept the net sinks of nature from depleting the atmosphere a long time ago? You can’t say that nature is a net sink right now without explain how at some point it wasn’t and how that mechanism isn’t functioning today.
Current equilibrium CO2 level is 295 ppm, so the natural exponential sink is between 400 and 295 ppm.
In your comments you contradict the head posting here, but it is not readily apparent that the head posting is really wrong or misrepresenting somehow, even though you seem to say that it is?
In particular, you say:
“That is wrong. There is no “natural increase” in the amount of CO2 in the atmosphere. Nature is removing CO2 from the atmosphere, each year, not adding it.” Mankind has added about 180% of the measured increase in the amount of CO2 in the atmosphere since 1959.”
However, in the head posting, following the author’s “Figure 2”, it says the thing which you appear to be contradicting:
“It is now clear at a glance that natural emissions have increased by a factor of 3 more than human emissions..”
— note that the head post’s author lists natural water body outgassing, land use, plant respiration and volcanism as natural emissions, all of which sounds like reasonable data to look at? The author pays special attention to which part of the outgassing is an *increase* measured since 1750, at about the height of the Little Ice Age, I suppose.
Now this is quite a discrepancy in what we might define as ‘truth’ here, i.e., Nature is *not* tending to increase CO2 according to *you*, *no* natural increase, while the article posting shows a very large natural production or output since 1750 !
If I go back to quoting your (Dave Burton’s) comments, maybe some explanation can be found for the seeming discrepancy right away, as you say
“Mankind has added about 180% of the measured increase in the amount of CO2 in the atmosphere since 1959.”
So, it would seem that you are talking *net* increase in CO2, *not* the total increase as such? So which is the fair or helpful way to compare the human contribution, as contributing to ‘net’ amount, or as contributing to ‘total’ CO2 output, or total *change* in output, actually?
If we were operating in a context where we could readily switch energy sources and stop all CO2 production, it might make sense to consider us humans as responsible for ‘net’ increase, as we might be able to change that quite soon then, lowering the net addition to the atmosphere in a significant way. However, as far as I can tell, we aren’t currently in that position at all. That is the point of the head article here!
The author is not comparing *absolute* numbers, he is comparing what we have done in the last 272 years, vs. what Nature has done,
That is , he is comparing the change that Nature has made in the same time span of over 200 years. If we are expecting a lead time of a hundred years or more in our own ability to *reduce* CO2 emmissions again, which I think is reasonable (especially given fuel burning developments in China and India), *then* what should we expect Nature to be doing by that time? Even if we eventually succeed in switching to some other energy source, might not Nature have left us behind again, doing other things to alter either gas levels or temperature or both? It seems to me that the head posting author here is making the fairest comparison, given the lead times involved (for humans in general) to meaningfully change what is happening with fuel burning!
The other consideration, of course, is whether some particular increase in CO2 is really much of a problem, no matter *who* does it. So what if, say, there might be 20 centimeters of sea level rise in the next hundred years, why, just move back from the water line a bit, how about that?
“If we were operating in a context where we could readily switch energy sources and stop all CO2 production, it might make sense to consider us humans as responsible for ‘net’ increase, as we might be able to change that quite soon then, lowering the net addition to the atmosphere in a significant way. However, as far as I can tell, we aren’t currently in that position at all. That is the point of the head article here!”
You seem to be saying that the factual source of increases in CO2 depend on whether or not we can readily stop burning fossil fuels?
From a scientific or logical perspective, this makes zero sense whatsoever.
Are you claiming the point of asserting that humans have nothing to do with increasing levels of CO2, is that we are not in any position to stop emissions anytime soon?
This is the point of the article?
Physical reality has nothing to do with the relative imperatives of human activity.
I wasn’t imposing anything on physical reality, just taking reality into account.
Let’s say I decide that the room that I’m standing in has a certain surplus of CO2, so the best thing to do is for me to stop breathing for an hour or so! I mean, on the level of personal consequences, I am contributing CO2, right, even if other people, or maybe animals, even, are in the same room? Without changing the physics at all, how you compare my CO2 output to everyone else’s might well depend on what you expect me to do about it!
In fact your CO2 is just recycling CO2 back to the atmosphere where it was taken out by plants a few months to a few years before… That is a CO2-neutral cycle
The difference with fossil fuels is that its CO2 was taken out of the atmosphere many millions of years ago and now released at high speed in the current atmosphere…
If that has dire consequences, that is doubtful…
David,
The essential error Frans makes is looking only at the changes in natural inputs and doesn’t take into account the natural sinks, which have grown even faster.
That makes that according to him (and several others) nature is responsible for the bulk of the CO2 increase in the atmosphere, while in reality nature is a net sink for CO2, not a source and near all increase is from the human contribution.
If that has consequences is a complete separate question and is not the main point of discussion here…
Various mappings using OCO-2 data have shown the highest CO2 levels on Earth corresponding to the locations of the densest vegetation on Earth. If this vegetation is not increasing CO2 at a higher level than areas of human activity, then what is causing this mapping result?
Bill, that is caused by the ocean’s temperature. Vegetation in the tropics is about CO2 neutral: a source during El Niño and a sink during La Niña or with huge volcanic events (Pinatubo). The upwelling of deep ocean waters near the equator releases a lot of CO2 while a lot of CO2 is absorbed near the poles which sinks into the deep oceans to returns hundreds of years later at the surface near the equator.
The amount of CO2 circulating that way is estimated around 40 PgC/year, again slightly more sink than source (currently about 1.5 PgC/year) in the past 1.5 century.
Ferdinand, did you see the map? Better to. Bill is right. Sometimes, these values, over rainforests, are overall 16 ppm higher than other places over the oceans and less vegetated landmasses. These fluxes are measured in almost realtime, so the ocean’s temperature is not the cause. More biomass decaying can also be a reason. After all we use some fermentation organisms to make bread and beer by harvesting their released CO2.
I’m also confused by this phrase you said before (“Most CO2 from undersea volcanoes is simply dissolved in the deep oceans under the extreme pressure at that depth and the under saturated waters for that temperature. Except if the gases reach the atmosphere (Bermuda triangle someone?).”. I answered “upwelling”. Are you contraditing yourself?
J N, the response of tropical vegetation depends a lot of temperature and drought conditions, with extremes during Pintubo, El Niño and La Niña. I want to see the OCO-2 data for Enso-neutral and each of these extreme conditions, before one can calculate the long term contribution of these forests…
Deep ocean cold water upwelling counts for a lot of CO2 release near the tropics and cold water sinks near the poles for a lot of CO2 uptake. Undersea volcanoes are emitting CO2, but in a medium where already enormous quantities of CO2 are present. As far as the undersea volcanoes don’t recycle carbonate deposits from the sea floor.
As far as I know, the CO2 level in the deep oceans didn’t increase a lot.
In comparison: if all human CO2 since 1850 gets ultimately dissolved in the deep ocean waters, that increases the total amount in the deep oceans with less than 1%. When in equilibrium with the atmosphere, that gives an increase of 3 ppmv in he atmosphere…
Dave, I never denied that there is a net emission to the atmosphere as we can see from the rising CO2 concentrations. My point is that since 1750 also the natural fluxes have changed. Also the IPCC confirms that these fluxes were smaller before the industrialization. The simple fact that at the end of the year we have more sink than source does not proof anything. Both natural emissions and absorptions are now larger.
…and if you remove human emissions, what does the annual PPM CO2 level do?
See Figure 7, magenta line.
Which is completely wrong, as that is based on the one-input-reactor-one-output picture of Harde e.a.
The current net CO2 absorption by nature is some 2.4 ppmv/year for 120 ppmv extra pressure above equilibrium with the ocean surface according to Henry’s law.
If you remove human emissions, that would be the drop in the first year.
At the end of the year the pressure difference drops to 117,6 ppmv and the absorption drops to 2.35 ppmv/year in next year, etc… until equilibrium is reached again at about 295 ppmv.
E-fold decay rate over 50 years, half life time over 35 years.
Then in your world the seas don’t respond to temperature, nor change their uptake or emissions of co2. The world warmed up to almost current temps by the late 1930s from the cold depths of the 1700s – co2 would have to have started increasing from just the increased ocean emissions.
Human emissions just conveniently came along when natural fluxes were already increasing.
Please read the article again.
This line of argument does not really help. First of all, atmospheric CO2 rises at a much lower rate than anthropogenic emissions anyway. Second, if this raises temperatures, which leads to more CO2 emissions from natural reservoirs (is that not one of the “tipping points”?), the cause would still be anthropogenic. Nothing has changed.
The big question is, if temperatures possible rise because of something else than CO2. And there is one big thing you all have totally overlooked..
https://greenhousedefect.com/contrails-a-forcing-to-be-reckoned-with
A BIG CHANGE is happening in CO2 according to Mauna Loa.
You can go to the Mauna Loa site showing this.
Click on this: https://gml.noaa.gov/ccgg/trends/graph.html
At this site select the CO2 “Interactive Plot”
The first graph shows the CO2 seasonal cycles from 1958 to now.
Just below the graph there is a slider on the left.
Move the slider to the right until about 2010 is shown on the left and then up to now.
You can now easily read that the month of MAY is always the highest level of CO2 each year.
This changed in 2021 and drastically changed in 2022. FEBRUARY is now the maximum. Then a DECREASE in MARCH.
I don’t know why such a major change occurred.
That is interesting and unusual. Something similar occurred in 2000 but not to the same degree, with April higher than May.
Yes, I agree with you. I was surprised at this very large change. No statistical analysis needed!
It will be very interesting to follow the levels of the next months.
I also try to see the relationship between CO2 at Mauna Loa and a variety of temperature measurements. How is the correlation between the two variables?
I find such on the following site: https://www.climate4you.com/
However this is the only site showing this possible correlation.
I find that from 1958 to about 1978 while CO2 was increasing slowly, temperature was decreasing slowly. Then from 1978 to 200, certainly both increased and a correlation is OK. Then after 2000 we have very large variations in temperatures (El Nino etc.) and hard to see a correlation.
If somebody knows other sites showing graphs with some possible correlation of these two variables, I would be very happy to visit them.
My understanding is that the raw measurements at Mona Loa have always been very noisy.
The smoothly formed Keeling curve is a highly smoothed average of many readings, at least as far as I understand what it is saying.
Yes, but RD is talking about the monthly trend that consists of many data points.
IDK.
I do not have the patience for such minutia.
I was doing some house painting recently.
I painted a whole wall with smooth even strokes, but some places were still wet long after the rest had dried completely.
So, what are you depending on for CO2 measurements and possible correlation with increasing temperatures?. You have a better source of monthly CO2 concentrations? Can you share it? I am certainly more than whiling to use it.
Can you give a reference to it?
No, and I did not mean to imply that I have any sources for month to month CO2.
I certainly do not try to make correlations which I have long since become satisfied do not exist.
I am more of a big picture guy.
All I was saying is that the measurements are noisy, I do not see any compelling reason to look at them so closely as month to month, and that what matters is the overall increases over time.
It is clearly increasing by several ppm per year, and there is no discernable correlation with global temps at the scale of decades or centuries.
There is a clear correlation at the scale of many thousands of years, and equally clear that at this scale, temperature leads CO2 concentration.
Also, it is clear that the biosphere is made of CO2, every molecule of everything that has ever lived can be traced back chemically to 6CO2 + 6H2O, catalyzed by chlorophyll, and using the rays of the sun as an energy source, gives one molecule of glucose and 6 molecules of O2.
This is your statement:
“It is clearly increasing by several ppm per year, and there is no discernable correlation with global temps at the scale of decades or centuries.
There is a clear correlation at the scale of many thousands of years, and equally clear that at this scale, temperature leads CO2 concentration.”
OK. You believe numbers from thousands of years, but not the numbers of Launa Loa. OK.
When did I say I do not believe them?
I said clearly it is increasing year to year.
How is that saying I do not believe the numbers from Mona Loa?
Short term data from individual locations is noisy, clearly.
Measurements taken at polar locations varies, maps of local CO2 concentration show blobs and bubbles moving around, etc.
I am not at all sure what you are disagreeing with at this point.
Look, if you find the monthly reading peculiar, by all means have at it.
I just do not see how it fits in with the subject at hand, is all.
https://youtu.be/x1SgmFa0r04
Sometimes there is information in higher temporal-resolution data that can help explain the big picture.
https://wattsupwiththat.com/2021/06/11/contribution-of-anthropogenic-co2-emissions-to-changes-in-atmospheric-concentrations/
“Sometimes there is information in higher temporal-resolution data that can help explain the big picture.”
I am not going to disagree with you, because I would not even know what I was disagreeing with at this point.
I am honestly not sure what exactly is being disputed in this sub thread.
Somewhere here you asked about the OCO satellite data.
Do you know what the heck ever happened with that data?
It was a whole satellite sent up to visualize CO2, and it has been pretty much memory holed AFAICT.
But what was published that I am aware of showed that CO2 is not very well mixed.
It moves around in bubbles and swirls, looking more or less like imagery of upper level moisture flows.
The variations are not very small either, tens of PPM over short distances.
But most of the images released are averaged values.
There is stuff like this from nullschool.
You can run it backwards and see how much a given spot has changed just in a matter of days:
earth :: a global map of wind, weather, and ocean conditions (nullschool.net)
Nicholas, a variability of 2% of full scale for CO2 where 20% per season is exchanged with other reservoirs is very well mixed…
Moreover, all measurements over land are very noisy, as e.g. in the first few hundred meters in a forest you can measure between 250 and 500 ppmv, depending of sunlight and inversion…
And are always noisy over rainforests in the direction of more CO2 release?
Fernando,
It is pointless to quibble over what is meant by the term “well mixed”.
If the subject at hand is a discussion of a variance of a few PPM on a month to month basis, then it is not well mixed.
If 2% is the criteria for what constitutes well mixed, then it is well mixed.
But 2% is over 8ppm, which is more than the variance seen in the swirls on any of the charts I have seen, including the nullschool data, the OCO data I have seen, etc.
I started out with the simple comment that the measurements taken at particular locations is noisy, so I do not think we disagree on anything substantive, not even basic definitions.
When I say that CO2 is not well mixed, I am talking about the data presented in visualizations such as this.
I know this is made from modelled results, but I assume those models use as input various measurements taken at discreet points.
As you say, there is a large amount of variation on short term basis at individual locations, but overall, the air is mixing up everything all the time.
https://youtu.be/x1SgmFa0r04
https://youtu.be/syU1rRCp7E8
Taken to be actual data, the swirls and bubbles of varying concentrations of CO2 show in these videos demonstrate to me that it may not be very fruitful to look at tiny discrepancies in the month to month levels shown in the plots at the top of this subthread.
So, even using your definition of “well-mixed,” you appear to be acknowledging that locally CO2 can have a variation of +/-125 PPM. That becomes questionable as to whether it is always well-mixed.
Clyde, CO2 is well mixed in 95% of the atmosphere, even including the seasonal variability, when over 20% of all CO2 moves in and out the atmosphere. Less than 2% of full scale or less than +/- 8 ppmv, seasonal swings included.
For 5% of all air, near huge sources and sinks, the local CO2 levels are not well mixed. That is the case for the first few hundred meters over land, in the middle of towns, middle of vegetation, near a cement factory, a power plant, etc.
That is why you shouldn’t look for “global” CO2 levels on land, except on the top of mountains, in the middle of deserts or coastal where the wind in general is from the seaside…
Well mixed doesn’t imply that any release at any point on earth is immediately seen on the other side of the globe…
It takes 6 months to see the CO2 increase at sea level in the NH to reach Mauna Loa and it takes about two years to reach the South Pole.
Still we may call that well mixed.
The simple message thus is: don’t measure CO2 levels over land except where a minimum of contamination is:
http://www.ferdinand-engelbeen.be/klimaat/co2_measurements.html
Burton asserted that after a 49% increase in CO2 there was no longer any out-gassing. I sarcastically pointed out that the original OCO-2 maps clearly delineated out-gassing.
It seems that NASA has removed all the early compilations of CO2 concentrations and only provides raw data for internal and academic use. While it it theoretically available to everyone, they don’t make it easy. While NASA hasn’t disavowed the early finished maps, and they can sometimes be found on YouTube, they have apparently removed all the finished maps from official NASA websites. [Somebody prove me wrong, please!]
CO2 concentrations vary temporally, laterally, and vertically. So, it all depends on how one defines “well-mixed.” I would prefer that a 2-sigma variance be associated with a nominal value and side-step the argument about “well-mixed.” It is clear that it is not as well-mixed as nitrogen and oxygen, and may be similar to WV, as you suggested it resembled.
Clyde, the variability of O2 is as “high” as for CO2, but the difference is that 8 ppmv on 400 ppmv (today) is easily measurable and visible in graphs, but 8 ppmv on 210.000 ppmv is far more difficult to measure and need a detailed plot.
One thing that complicates any such effort to correlate recent temps with CO2 is bound to be obfuscated by the fudging of the global temperature records.
Remember the pause?
Remember how it was erased a few years back?
The climate chiropractors have made it very difficult to trust any recent temperature data. Impossible for me.
But overall:
No, it did not change in 2021! I think you are getting ahead of the data. There have been several times in the past when there was a halt in the Winter CO2 growth showing up around February-March, probably because it is so cold that it shuts down biological decomposition. Check it again in a couple of months.
“There was several times in the past……”
OK. Show me when. Can you? Show me.
I have no problem waiting a couple of months.
You can show yourself. Just go to the graph whose link you provided. Take a look at 1972, 2008, and 2019. They, and others, have shoulders during the January-March time-frame resulting from a slowdown in the seasonal growth.
Keep in mind that the most recent data are subject to change by the suppliers, and they often change even older data.
OK. Show me when.
It looks like April is on track to probably be higher than either February or March.
OK with me. Never seen this before. I am not making predictions. I simply noted the BIG CHANGE in the annual CO2 cycles. Do you agree with this?
Where do you get that April is on track to “probably” be higher than either February or March????? This would really be something. I am not predicting, simply waiting.
And you have data to predict this? Show me.
David,
Based on my personal observations and study since 2006, I find your presentation far more believable than the discussed presentation. I also find Richard Lindzen to be far more believable than his opposition. The presentation ignores the higher temperatures which existed for several thousand years prior to the Little Ice Age, and the fact that no one has shown any higher CO2 back then.
I continue to claim that the percentage of CO2 in the atmosphere is due to our burning of coal especially, is highly beneficial to plant growth, and has minimal effect on temperature, which in turn is affected more by the likes of cloud cover and changes in solar input by natural causes including planetary effects on earth’s orientation and orbit.
The slower rate of atmospheric rise compared to fossil fuel consumption/CO2 atmospheric production is very easy to explain. Roughly 50 percent of fossil fuel emissions are biologically sequestered annually. We haven’t enough data to parse this on decadal, centennial, millennial, and geologic time scales. But roughly half.
BtW, that simple observation also proves the Murray Salby nonsense was just that. Nonsense.
Rud, you are clearly omitting several geological sources of CO2 emission and sinking… Not as simple as you say. Instead of naming nonsense to Murray Salby words, check for your own ocasional involuntary nonsense.
Given the role CO2 plays with carbon being a basic building block for all life on earth what is the mechanism that ensures it remains or returns to the surface where all the sinks and sources are? Why isn’t there always a higher concentration of CO2 at the surface?
What mechanism ensured that CO2 would be captured in the ice cores when the freezing point of CO2 is much lower than that of H2O?
The main geological sequestration is limestone formation from marine micro-organisms. And the main geological recycling into the atmosphere is via plate techtonics, whose subduction zones heat the limestone and release CO2 as mafic volcanos.
And the rifting process, and Hydrothermal vents, and volcanism (primary and secondary)?
Rud,
Like most people you continue to neglect the significant geologic role of inorganic carbonate precipitation from seawater by the formation of oolite sand grains in the swash zone of coastal carbonate-sand beaches and shoals.
The Oceanic Central Heating Effect
Estimates vary but between 30% and 50% of the limestone in the geologic record is formed by inorganic precipitation. Carbonate ramps are a key factor here.
Exactly!
Rus is correct.
On concentrations, air gets mixed by wind and convection, etc.
On the ice cores, it’s just physical capture of air, whereby air gets trapped between pores by accumulating snow, and eventually the pores get sealed off by pressure from weight above.
“…what is the mechanism that ensures it remains or returns to the surface…”
Nothing “ensures” that it does.
That which makes it’s way back into the air once it is sequestered is pretty much by chance, except in the case that we dig it up or pump it out and burn it.
It can be released from volcanoes after being subducted into the interior of the Earth when an ocean plate is pushed down into the mantle of the Earth.
It can be burned by natural processes when for instance a coal seam is exposed by erosion and lightning sets it on fire. Large areas of Wyoming is littered with coal ash, called clinkers, that got there by this process in just the recent geological past.
Most of the coal and oil and nat gas that ever formed has made it’s back into the air by natural processes and ass oxidized.
Another way is from extraterrestrial impactors vaporizing huge amounts of carbonates in the rocks it affects at and near the point of impact.
In fact, nothing but the grace of God and random luck (take your pick) has made sure that the biosphere has had a continuous and sufficient supply of CO2 to avoid going extinct since life first colonized earth billions of years ago.
It is not a law of nature or anything.
Go to the Grand Canyon sometime and look at over a mile thick of solid CO2 that has been sucked out of the air and sequestered from being useful to the biosphere.
Those rocks and others like them are one reason that CO over time looks like this:
Here is another version on a shorter time scale:
“was oxidized”
Oops.
Very interesting. But where is Figure 7?
Oops, fixed.
Where is Fig 7?
This post’s finding is probably (and unfortunately) not correct. There is a simple yet very robust way to show that. And a second way to confirm the first.
Photosynthesis preferentially uses the lighter 12C isotope rather than the also stable but heavier 13C isotope. The result of sequestering hundreds of millions of years of photosynthetically produced fossil fuels is mainly 12C sequestered, thereby enhancing the ratio of 13C remaining in the atmosphere. As fossil fuels began to be consumed in significant quantities circa WW2, it can easily be shown using mass spec that the proportion of 13C to 12C has since been declining. That cannot be because of the post’s contemporary carbon biosphere cycle affected by slight warming. It has to be because fossil fuel consumption frees lots of previously sequestered 12C. And therefore the Keeling Curve rise in total atmospheric CO2 isn’t mostly from the slight warming, Henry’s law, and all that. It is mostly from fossil fuel consumption. The last few decades observationally declining trend in the atmospheric 13c/12C ratio is easy to verify online.
As a Lemma concerning Henry’s Law and the oceans, the ocean temperature (and salinity) is remarkably stable (at about 4C) below the thermocline. Recent posts here explained the underlying physics. This was known long before ARGO. The thermocline is ‘mostly’ (80%) at most 750 meters deep; it is a bit shallower (600 meters) over much of the vast tropical ocean. There is literally zero temperature change below 2000 meters, deliberately the ARGO design max depth for OHC measurement. (I imaged these details by latitude in essay Missing Heat in ebook Blowing Smoke. I reposted that image in my post here on ‘ARGO-fit for purpose’ a few years back.) There simply is not enough dissolved CO2 above the ‘main’ (80% of delta T) thermocline for Henry’s Law and about delta 1C at the surface to explain the Keeling Curve. The oceans average about 4000 meters depth. That entire column is CO2 saturated. Only at most about 750/4000 or 20% is even subject to any Henry’s law argument at all. Oceanography 101.
Why do we, especially the politicians take any notices of so called data from Models.
A model is just someone’s guess run through a computer.
What about the fact that the World is getting greener.
That must affect the amount of CO2 in the atmosphere.
And let’s not forget the Asian practice of burning off the stubble each year, plus Methane from the growing of Rice.
It’s all guesses & modelling, all rubbish.
Never mind, the lights must soon start to go out.
Michael VK5 ELL
I have seen no compelling reason to have any doubt that human activities, including burning fossil fuels, is raising CO2 concentration in the atmosphere.
None of the arguments to the contrary seems very compelling
The weight of all of the data and evidence leads me think it is highly probable that the increases we have measured in recent decades is not something that would have happened if humans were not digging stuff up and burning it, or heating it in the case of limestone for cement, plaster, mortar, concrete, etc.
The GISP data also clearly shows many periods in the Holocene far warmer than recent years, and those years do not show anything like 400+ ppm of CO2, even though those higher temps persisted for thousands of years.
Antarctic cores show a clear lag of hundreds of years between warming temps and increasing CO2 levels.
But by all means, anyone who feels compelled to try to prove otherwise can spend all the time they want analyzing and writing up their findings and ideas, AFAIAC.
It seems pointless though.
Since CO2 in the air has no downside, it forms no part of the many refutations of the warmistas.
McGinley fails to realize that under current CO2 emissions scenarios, temperatures in the coming decades will fly well off the top of his chart. Why is he considering only temperatures in “recent years”?
McGinley also doesn’t consider the rapidity of the current temperature change in comparison to prior changes seen over the timeframe of his chart. The rate of temperature change occurring now and in the coming decades is an order of magnitude larger, at least, than anything else on his chart.
Maybe, just maybe, however unlikely, there won’t actually be a problem with the several degrees higher temperatures that can be expected under “business as usual” conditions. But there’s almost certainly a problem with the rapidity of the change. Historical data tells us that rapid climate changes in earth’s past have typically led to massive extinction events.
Its kinda like there’s no problem with an automobile going 60 mph, and there’s no problem with an automobile being parked and not moving. But there’s a big problem with rapidly going from 60 mph to zero mph by running head first into a tree.
“CO2 in the air has no downside” ?? Highly, highly unlikely to be correct statement.
Can you explain why the US Climate Reference Network shows no change in temperature in the US since 2005? Why has the Antarctic gotten colder? You have a poor grasp of the data and don’t seem to understand the role of adjustments to raw data that introduce spurious positive trends.
Nelson asks: “Can you explain why the US Climate Reference Network shows no change in temperature in the US since 2005?”
How many times must you willfully obtuse folks be reminded that there is a lot of noise in temperature trends, and that there are local and regional variations in those temperature trends?
The U.S. represents less than 2% of the world’s surface area. And we know that there can be fairly large “pauses” in warming, both regionally and globally. Despite all that noise, the long term trends remain decidedly up, up, up, up, up.
“adjustments to raw data that introduce spurious positive trends”
And now here we go again with the wildly delusional conspiracy theory nonsense.
Long term since 1980?
Hippo fossils found in the Thames river 140,000 years old falsifies your statement. Frozen human bodies emerging from under European glaciers 6000 years old falsifies your statements. Vikings living in Greenland and growing grains 1000 years ago falsifies your statements. It is clear all these events were from long term warmer climate with no human cause.
Here’s Doonman comically pretending that natural climate change in the past is “evidence” that “falsifies” the idea that current human actions also alter the climate.
You folks should really listen carefully to yourselves. Your “arguments” are just SO wildly ridiculous.
How many examples do you need to see of the historical data being altered to change you mind from the belief that it has not occurred?
How many statements from people that no global warming was occurring in the 1990s, and then those same people pretending they never said those things and presenting altered versions of their data that proves they fraudulently altered their own data sets?
Do we believe James Hanson in the 1990s, or the same person 10 years later saying the opposite?
How about Mark Serreze? Should we forget his statements from the early 1990s that there was no evidence of warming, or do we believe him when he claimed that the arctic was on fire ten years later?
Should we forget what the IPCC published in the 1990s just because they have rewritten the past to become ever scarier and more dire?
How about Tom Karl, when he showed in 1988 that the earth had not warmed at all for most of the 20th century? Should we forget about all of that because he pretended a few decades later he never said what he said or showed what the data showed?
I fail to realize?
You are badly mistaken.
It is you and your bed-wetting ilk who have no idea what you are talking about.
Every detail of every single assertion you make here has been amply and thoroughly refuted many times over.
We are in an ice age.
When the interglacial ends will be the real catastrophe.
The Earth is far too cold for a biosphere that has evolved on a far warmer planet.
CO2 is low, far too low for a biosphere that evolved and is well adapted to CO2 levels many times higher than present levels.
We know what happens when any life form is starved or subjected to too-cold conditions, and then it suddenly gets enough food and has more hospitable temperatures restored.
It does not die of shock, it revives and thrives.
The amounts of change in temp you are frightened of are a tiny fraction of the changes that occur in any spot from day to night, or from week to week, or season to season.
There is absolutely nothing unprecedented about the present global temperature regime.
Not a single thing is outside of even the historical range, let alone unprecedented on longer time scales.
You are simply wrong. badly so.
Misinformed.
Lied to and led along a false narrative to a completely errant and mistaken view of everything you are talking about.
The only way for anyone who is capable of using the internet and typing intelligible sentences to be so badly wrong is by never actually CHECKING ANY DETAIL OF WHAT YOU BELIEVE FOR YOURSELF.
But I have good news for you.
The end of the world is not upon us.
There is no climate crisis.
The sky is blue, the grass and trees are green, the clouds are white, the rain is wet, and everything is just as it has always been regarding the weather on the Earth.
I leave it for your long overdue homework to check on the original sources of data for each and every one of your fearful and breathlessly stated contentions.
Then get a good nights sleep for once in your life.
Doomsday is cancelled.
Nick, every comment I made was correct in regard to the graph which you presented as “evidence” that there is “nothing unusual” going on currently with climate change. Here are those comments again:
We can expect temperatures in the coming decades to zoom right off the top of your chart.
The current rate of temperature increase is far faster than any rate of increase seen on your chart.
And the rate of increase of known greenhouse warming gas CO2 is currently over 100 times faster than any naturally occurring change in millions of years.
MGC:
“Nick, every comment I made was correct in regard to the graph which you presented as “evidence” that there is “nothing unusual” going on currently with climate change. Here are those comments again:
We can expect temperatures in the coming decades to zoom right off the top of your chart.
The current rate of temperature increase is far faster than any rate of increase seen on your chart.
And the rate of increase of known greenhouse warming gas CO2 is currently over 100 times faster than any naturally occurring change in millions of years.”
Alarmists have been saying such things for several decades now, and nothing like what they are warning of has come to pass, at all.
There are other threads where all of this is the central topic, and I am not gonna go off on a tangent any more than I have already done so here.
You made your point, I made mine.
If you are unaware of the data tampering that has occurred, you should look into it, or engage on the topic on a thread dedicated to that subject.
“and nothing like what they are warning of has come to pass, at all.”
False. Observed temperature rise, observed sea level rise, observed ice melt, etc. are all currently following the projections that were made decades ago.
re: data tampering
I’ve looked into it. What convinces me that claims of data tampering are largely bogus is that there are lots of natural markers that are also following the very same trends. Markers such as last spring frost dates, first spring bloom dates, first fall frost dates, changes in plant hardiness zones, changes in animal migration patterns, etc.
Oh, but maybe those dastardly scientists have been conniving with the plant and animal kingdoms, too, in order to orchestrate a vast worldwide multi-species conspiracy!
OMG LOL.
Maybe try again, Nick.
The problem is that recent ag science research in the US at least, shows that growing seasons are expanding, e.g. the difference between LSF and FFF dates, while the peak heat accumulation over that lengthened growing season is stagnant to down. That means that max temps are not going up but that minimum temps are.
Changes in animal migration are more influenced by growing season changes than by actual temperature.
Data tampering *is* happening. All with the purpose of showing that annual average anomalies are going up on a global basis. The problem is that annual average anomalies on a global basis result from cramming northern hemisphere and southern hemispheres together creating a multi-nodal distribution (cold in one hemisphere with hot in the other) that can’t be simply described by the typical statistical descriptions of average and standard deviation, And this doesn’t even begin to describe the problem with trying to analyze a time-series phenomenon made up of cyclical processes by using a multi-nodal distribution.
Really, Tim? This ridiculously inane “multi-nodal distribution” excuse again?
The height of adult humans is also multi-nodal: males are taller than females. Doesn’t mean that there is some “problem” with our description of the trend of increased human heights over the past several hundred years.
You’re just blowing laughably bogus pseudo-scientific smoke. Again. But that’s what WUWT does to people.
Multi-modal distributions are not adequately described by the typical two-factor characteristics of average and standard deviation.
Try buying T-shirts sized to the averaged of a combined man/woman distribution! The T-shirt won’t fit the largest portion of the distribution. That’s why men and women clothing is sized differently in the stores!
Take the human height distribution. Did the trend go up because the heights of women increased but not men? Did the trend go up because the heights of men increased but not women? Did the trend go up because the heights of both men and women went up?
Trending the average of the multi-modal distribution of human heights simply won’t tell you the answer. Neither will trending the average of of global temperatures! You can’t tell from the average what went up!
The only one here blowing smoke happens to be you. Do some reading on multi-modal distribution analysis! I have yet to find one that states that the average and standard deviation are adequate descriptors for multi-modal distributions. Can you provide a link to someplace that does? I’m not going to hold my breath waiting just so you know.
Tim says: “Multi-modal distributions are not adequately described by the typical two-factor characteristics of average and standard deviation”
So what? Those two factors are still sufficient to understand that a rising temperature trend exists. Pretending otherwise is nothing but bogus handwaving jibber jabber.
“You can’t tell from the average what went up”
Again, so what? We have the data that does describe the overall distribution in more detail. We DO know what is going up. DUH.
You still want to falsely pretend (i.e. lie to yourself and others) that just because the data is multi-modal, that is somehow a “valid” reason to disregard the overall trend. Sorry, but no. That kind of “argument” is totally ludicrous. You’re still just making up juvenile excuses in order to pretend away the reality of the rising temperature trend.
But this is nothing new. Making up juvenile excuses in order to pretend away reality is a badge of honor among WUWT cultists.
“So what? Those two factors are still sufficient to understand that a rising temperature trend exists. “
Wrong! The whole point is that with a multi-mode distribution the average simply can’t be used to identify a trend in anything associated with the distribution!
Again –
Each of these result in different impacts on the Earth’s biosystem. If you don’t know which of these is occurring then how do you determine what reactions are necessary?
You apparently don’t even realize that the average can stay the same while both minimums and maximums change as long as they change in opposite directions by the same amount! Pause in warming anyone?
Can *YOU* answer any of the 5 questions above? I’m not going to hold my breath waiting for an answer from you.
“Again, so what? We have the data that does describe the overall distribution in more detail. We DO know what is going up. DUH.”
If you *know* what is going up then why can’t you tell us? Give us a link to the data showing you what is going up. Who is “we”, btw?
“You still want to falsely pretend (i.e. lie to yourself and others) that just because the data is multi-modal, that is somehow a “valid” reason to disregard the overall trend.”
A trend that can’t tell you what is going on, in detail, *is* a valid reason to disregard the overall average trend. With a multi-modal distribution of the heights of men and women, how does an increasing average help you identify what is actually happening? Instead of height assume it is the incidence of skin cancer in men and women! You need to know, in detail, what is causing the increasing trend in order to identify required corrective actions. Is skin cancer in women going up or down? Is skin cancer in men going up or down? A one-size-fits-all solution could cause more problems instead of fewer!
The same thing applies to temperature. If minimums are going up thus producing longer growing seasons and higher food harvests then why do we want to tamper with any change that is going on? If you just assume that it is max temps going up that is causing the positive trend in the average and you apply solutions based on that you might just be cutting your own throat by causing increased global food shortages!
The fact is that *you* have no idea about what is really happening on this Earth. You are merely parroting the agenda of a “consensus” clique.
“Again –
”
Is this nonsense still going on.
The answers are Yes, Yes, Yes, No, No.
And this has nothing to do with whether global anomalies are multi-modal or not.
“With a multi-modal distribution of the heights of men and women, how does an increasing average help you identify what is actually happening?”
It helps you identify that something is happening. You can drill down on the data to get a better idea of what is actually happening.
“Is skin cancer in women going up or down? Is skin cancer in men going up or down? A one-size-fits-all solution could cause more problems instead of fewer!”
Indeed there can be problems with assuming men and woman are the same. But your approach is to simply disregard any trend until it can be split up into appropriate units. Imaging you know that cancers on average are going up, but deciding to do nothing as you can’t tell if it’s going down in some group.
“ If minimums are going up thus producing longer growing seasons and higher food harvests then why do we want to tamper with any change that is going on?”
And now you are doing what you are complaining about. Assuming you can make a simple prediction based on a single statistic.
“with a multi-mode distribution the average simply can’t be used to identify a trend”
Baloney. Pure, 100% utterly ignorant baloney. As Bellman notes, you know that something is going on. You most certainly *can* identify a *general* trend, even if you don’t know all the details.
And as Bellman has also noted already, the answers to Tim’s five intentionally ignorant questions are also all well known. In fact, Tim has already demonstrated that even HE is aware of many of those answers himself! So why is Tim so stupidly continuing to pretend (LIE) that no one knows the answers to those questions?
Yep, yet another ridiculously pathetic vomitus of lame-brained, anti-science, deliberately dishonest denier excuses, blindly trotted out in order to try to hide from reality. Tim sadly continues to pretend & pretend & pretend & pretend (i.e. LIE & LIE & LIE & LIE) about how details of the changes of the distribution are supposedly “not” known, when of course those details are quite well known.
So typical of WUWT cultists. Intentionally ignorant. Deliberately and dishonestly dumb. And proud of it.
Such an abominable disgrace.
In other words, all you have to offer is the argumentative fallacies of a false appeal to authority and ad hominem.
Typical for you. Not a single actual refutation of anything and no actual answers to my questions.
Pathetic!
Bellman already ripped to shreds, completely, your laughably ludicrous nonsense, Timmy Boy. Nothing more needed adding. So I didn’t.
I noticed you didn’t respond when asked why you pretend (LIE) that the answers to those five intentionally ignorant questions of yours are supposedly unknown, when the answers are actually very well known. So well known in fact, that even you already knew many if not most all of the answers, LOL.
And sorry, but no, pointing out that someone is pretending and lying is not a “false appeal to authority” nor is it “ad hominem”. It is mere statement of fact.
Pretending and lying. Pretending and lying. That’s what WUWT does to people.
And Nick, it seems to me that you (along with many others) imagine there are two and only two positions on human induced climate change. It is either “it is not a problem at all” (your position) or “it is the worst existential catastrophe ever”. You seem to make no room for any position anywhere between these two. This is what is called the “false dichotomy” logical fallacy.
But of course there is more than ample room for other positions. One such position is that there are good chances that human induced climate change can create quite costly repercussions in the coming decades, and limiting those repercussions is a sound long term investment.
This last position is pretty much where I stand. Doing nothing about climate change will cost us far more in the long run than taking action would.
In any event, I refuse to simply pretend that nothing at all is going on, and will adamantly call out those who do pretend that way.
“And Nick, it seems to me that you (along with many others) imagine there are two and only two positions on human induced climate change.”
No, I do not imagine that at all, MGC.
I have been involved with this topic for most of the past 33+ years at some level or another, and of course I am aware that a range of opinions exist.
Bu this is not the subject at hand in this discussion thread, so my not bringing into the conversation the full range of opinions does not reflect my understanding, or lack thereof, of the range of opinions that exist.
MGC,
While we agree on the cause of the CO2 increase in the atmosphere, you (and the IPCC) are on shaky grounds if you believe anything that climate models produce.
Current climate models are not fit for purpose, whatever scenario you use: while the real emissions simply follow the “business as usual” scenario, temperatures follow the lowest increase speed of the models. 95% of all model runs of AR6 are running way too hot.
The theoretical effect from a CO2 doubling (280 to 560 ppmv) is about 0.7 C, all the rest is from the “fortifying effect” of positive feedback’s like more water vapor which are not found where they should be:
https://clintel.org/new-presentation-by-john-christy-models-for-ar6-still-fail-to-reproduce-trends-in-tropical-troposphere/
And the current increase was entirely natural up to 1950, even according to the IPCC, because there was not enough extra CO2 in the atmosphere to have any measurable effect. Cause unknown. That natural increase didn’t suddenly stop in 1950…
“95% of all model runs of AR6 are running way too hot.”
Sorry, Ferd, but this is patently false. Just another piece of lying propaganda spoon fed to you by the likes of WUWT.
But why is the hindcast so hot? Where are the cold models?
The REAL TEMPERATURE Being always (except for the 2016 El Nino), in the lower part of the uncertainty of the graphic you posted is “running too hot for me.”, so Ferdinand is right. And that graphic has a few recent tweaks for AR6, mainly to recenter things to reality. The prior graphic was a lot worst. And things seem to be getting even more bad lately, mainly if that “plateau” or even the downtrend since 2016 is kept for a bit longer. Maybe they’ll fine tune them for AR7 again.
MGC,
Two points: The chart you show is for the surface temperatures (and even for the “hottest” series) while Christy’s run is for the higher troposphere in the tropics, where according to theory and models the fastest increase in temperature should occur, due to the largest positive feedback: water vapor. Which is not found there.
Moreover, as usual, I do look at both sides of the story, and have found a “rebuttal” of Christy at RealClimate, that implicitly shows that Christy is right:
https://www.realclimate.org/index.php/archives/2016/05/comparing-models-to-the-satellite-datasets/
That is about AR 5, but AR6 is even worse…
While they lament about start datum/period, it is about the speed of warming…
Have a look at the histograms at the end. All models should be between the range of the satellite measurements, or they are simply worthless.
75% are running too hot for global temperatures and 80% in the tropics even for the “hottest” satellite series…
Gavin Schmidt even admits that in an article of Science, but does nothing to make his own model any better (thus cooler…):
https://www.sciencemag.org/news/2021/07/un-climate-panel-confronts-implausibly-hot-forecasts-future-warming
Ferd first said “95% of all model runs of AR6 are running way too hot.” Now its “75% are running too hot”.
Let’s try to have some consistency here, please.
The key variable here for model accuracy is the transient climate response (TCR). As you’re likely aware, TCR is still not tightly defined. Granted, maybe the true TCR value is a bit lower than values currently used in models. That doesn’t in any way mean that models are “simply worthless” as Ferd would like to pretend.
Ferd is just blindly parroting the WUWT party line, which seems to be “if the models aren’t absolutely perfect, then they are completely worthless”. Sorry, but this notion is silly, immature, and irrational.
The bottom line remains unchanged: the world is warming, it is because of human greenhouse gas emissions, and it presents potentially costly repercussions in coming decades.
MGC,
It is 95% for Christy’s runs in the upper troposphere, where the warming should be fastest according to theory and models and compared to his own UAH 6.0 satellite temperature series.
75% and 80% is what RealClimate finds for near surface modeled temperatures and several satellite series, even if some of these series are also somewhat “modeled”.
The main problem is that the models take into account too much positive feedbacks, especially water vapor feedback, that is not found where it should be: in the higher troposphere of the tropics.
That also is reflected in the huge variability of each model within the band: nature reacts much slower with far less variability, for the simple reason that there are a lot of negative feedbacks in real life (water in all its forms) that makes climate on earth rather stable and inhabitable.
I have 35 years experience with (chemical) models. If a model doesn’t reflect reality, it is simply worthless, not fit for purpose and must go back to the design table. If you don’t understand that, then you don’t understand anything of models.
Even if a model reflects reality, it can be just by coincidence and only further evaluation will show if the predictions of the models will fit reality in the future. That are only the models that are in the band of real temperatures today, thus with the lowest TCR.
Even if (and that is far from sure) all warming since 1950 is from the extra human CO2 (up to 1950 it was all natural), then the warming is modest and within the 2°C of the Paris convention:
https://www.woodfortrees.org/plot/hadcrut4gl/from:1950/plot/hadcrut4gl/from:1950/trend
0.9°C over 72 years or 1.9°C in the year 2100 with business as usual (as is the case until now)…
re: “If a model doesn’t reflect reality, it is simply worthless”
Really? Still stuck on binary black and white judgments? No room for anything in-between? How about daily weather models, with their still fairly large percentages of incorrect reflections of reality. Are they “simply worthless”? No, of course not.
Not to mention that, if one takes a completely literal reading of your statement, then all models, by definition, are “simply worthless”, because no model ever genuinely reflects reality.
It appears to me that you’re just looking for excuses to dismiss climate models entirely out of hand, and do not want to allow that, although climate models remain imperfect, their utility is, like weather models, far from zero.
Perhaps the greatest utility of climate models will be that, in examining differences between model projections and observations, we will gain greater understanding of how the earth’s climate system behaves.
MGC, weather models do quite good for the next 24 hours in most circumstances and also good for up to a week is stable conditions. They have been proven reliable for short term predictions.
Most climate models are proven unreliable already for 10-years predictions, thus are not fit for purpose for long term predictions. That is difference.
I haven’t said or implied that all models are worthless, only that models which prediction of the temperature increase is not within the range of the satellite measurements is worthless and need rework, because some parameter(s) get(s) out of control. Or there may be a fundamental error in one of the assumptions at the base of the calculations, or…
Again, a model that doesn’t fit into the range of reality today is not fit to predict the far future. As good as a weather model is not fit to predict 14 days ahead, if it is already wrong after 24 hours…
I don’t think that you have much experience with models: a model reflects everything what scientists think that influences some process and to what extent.
If some small influence is unknown, one may build the best model of the world, it can get a disaster (own experience: a raw material supplier who swindled with one of the specifications)…
Do you really think that one knows all possible causes that influences climate? What caused the changes between warmer (Minoin, Roman, Medieval) periods and colder (Little Ice Age) periods and back? Deep ocean oscillations?
As long as nobody can explain these 1000-1200 year oscillations, nobody can assume that all warming of today is from our CO2…
I view the differences between climate model projections and actual observations as being similar to a weather report that predicted 8 inches of snow, but 6 inches of snow actually fell. And yet you and your ilk still want to pretend how “wrong” and how “worthless” the projections were. To me, that’s silly, irrational, and immature.
MGC,
If you don’t see that 6 or 8 inches of snow still is a good prediction, but 1.5°C or 4.5°C per century is the difference between no problem and a disaster, then we better can stop this discussion.
If you build a bridge with such a “tolerance”, it will collapse or you build it three times to heavy (thus too expensive), the latter is happening now, thanks to the extreme models…
It is very simple: if a model is not within the (already wide) borders of the observations, then it has no value at all.
If you don’t understand that, then you don’t know where you are talking about…
Observations versus models to date is quite similar to 6 inches versus 8 inches of snow.
1.5 degrees versus 4.5 degrees increase is largely a function of our (as yet unknown) behavior going forward. For any given emissions scenario, the error bars are no where near that large.
And by the way, bridges are always built with a 3x or more safety factor. They are designed to hold three times or more the expected load, and always have been. Similarly then, using those kinds of common safety management practices we should also be planning for up to 3x worse climate change scenarios than the mean expected projection.
Moreover, common safety management practices have long been that the less precisely a danger is known, the more careful you need to be. Your argument about the supposed lack of precision of climate models is actually an argument for greater diligence.
MGC,
You still (don’t want to?) get it:
The 1.5-4.5 degrees are the result of different models for exactly the same scenario of future emissions, where 1.5 degrees is within the wide margins of what is seen in the real temperature increase.
Again, a model that is widely outside these margins has something fundamentally wrong in its calculations or basic assumptions and is worthless. Back to the design table.
Building bridges is based on centuries of knowledge of materials and mechanical laws. Where indeed they include a safety margin.
No mechanical model will show such wide margins for the same design, or it would be questioned and one would look why that model gives such strange answers outside other models with proven record. Not so for climate models.
Building climate models is based on 30 years of study of climate, where many influences not even are known to any extent (short and long term ocean oscillations), or not even calculable (e.g. clouds and cloud effects).
The problem is that in the case of climate change the cure is worse (and far more expensive) than the effect. Take e.g. the results of the Dutch KNMI sealevel increase, based on some climate model:
https://www.deltares.nl/nl/nieuws/nauwkeuriger-inzicht-huidige-zeespiegel-langs-de-nederlandse-kust/
The measured trend is some 18 cm per century. The KNMI model predicts between 40 and 80 cm per century and last year before the Cop in Glasgow, they press released over a meter per century.
Pure nonsense, as that was already refuted with the real trend, which doesn’t show any acceleration…
If the Dutchmen would have taken that serious, they should have spent again billions to defend their houses against the rising sea surface… for nothing than a failed model…
If you have a lot of money to spill, no problem, but for the moment there are worse problems to deal with than climate change disasters, which refuse to materialize…
Ferd says: “the real (sea level rise rate) trend, which doesn’t show any acceleration … failed model … blah blah blah blah blah”
That Dutch projection you reference does not rely on the kind of intentional ignorance you prefer, which, based on a narrow and incomplete look at the data, leads to hasty and unwarranted “conclusions”.
That Dutch projection takes into account more than just their local historical trend. They also factor in what has been going on in the rest of the world. They know that sea level rise has been accelerating worldwide; they understand why that acceleration has not yet reached the Netherlands; and they also realize that the global acceleration will reach the Netherlands shortly.
Your “failed model” claim is every bit as silly as pretending that there’s no reason to make any plans for an impending storm, simply because the weather in your town happens to be fine today, blindly disregarding the fact that the storm has already made landfall at other locations and your town is directly in the storm’s path.
“Your “failed model” claim is every bit as silly as pretending that there’s no reason to make any plans for an impending storm, simply because the weather in your town happens to be fine today, blindly disregarding the fact that the storm has already made landfall at other locations and your town is directly in the storm’s path.”
Bad analogy. In the weather case you are tracking reality. In the climate model there is no reality, just a mathematical algorithm.
Yet another WUWT fairy tale fantasy from Tim. Why am I not surprised? That’s what WUWT does to people.
In the analogy, “the storm has already made landfall at other locations” equates to locations where sea level rise has already accelerated. That is known, measured fact, not “just a mathematical algorithm”.
And by the way, for completeness, here’s what’s been going on worldwide with regard to sea level rise:
IPCC AR6 (2021):
“Global mean sea level (GMSL) rose faster in the 20th century than in any prior century over the last three millennia (high confidence), with a 0.20 [0.15–0.25] m rise over the period 1901 to 2018 (high confidence).”
“GMSL rise has accelerated since the late 1960s, with an average rate of 2.3 [1.6–3.1] mm 34 yr-1 over the period 1971–2018 increasing to 3.7 [3.2–4.2] mm yr-1 over the period 2006–2018 (high confidence)”
“tide gauge reconstructions that extend back to at least 1902 showed a robust acceleration (high confidence) of GMSL rise over the 20th century”
The IPCC also states that a global rise “approaching 2 m by 2100 and 5 m by 2150 under a very high greenhouse gas emissions scenario cannot be ruled out due to deep uncertainty in ice sheet processes.”
Another situation where a lack of certainty points to more caution required, not less.
Not to mention that under the “business as usual” emissions scenarios that you deniers want to embrace, we can expect that sea level rise and sea level rise acceleration due to those emissions will continue for centuries if not millennia into the future.
MGC,
To show you how you are duped by the IPCC, KNMI and especially the Australian CSIRO: there is no acceleration in sea level worldwide in tide gauges. None.
Willis Eschenbach used all available tide gauges all over the world and didn’t find any acceleration. What he did find is that the Australian CSIRO in some way mixed the satellite measurements (over 3 mm/year) with the tide gauge measurements (about 2 mm/year) over the past near decades.
That is scientific fraud of the worst kind: never mix variables of different nature without looking first if they overlap and measure the same thing. Which is absolutely not the case for satellites (full oceans) and tide gauges (coastal with vertical land changes).
Look and see what CSIRO has done:
https://wattsupwiththat.com/2018/12/17/inside-the-acceleration-factory/
Not the first time that they mix different kinds of data to show a “hockeystick”…
And you expect from me that I do believe anything that comes from the IPCC before looking at what they exactly have done?
“Willis Eschenbach used all available tide gauges all over the world and didn’t find any acceleration” … “never mix variables of different nature without looking first if they overlap and measure the same thing”.
Oh please. This “analysis” by Willis is completely bogus. I actually discussed it with him. The satellite and ground tidal gauge datasets do overlap and they do measure the same thing.
Here’s reality, bub: the satellite data … right from day one … has been continuously calibrated by …. guess what … ground based tidal gauges. A fact that clueless Willis (and his equally clueless readers) were not even aware of. So much for that stupid so called “objection” to “never mix variables of different nature”.
The “analysis” by Willis is also incorrect because ground station locations are far from randomly distributed, so simply averaging them all will not give a representative true mean value. In contrast, the Church and White analyses correctly adjust for the non-random nature of station locations.
The “response” from Willis to me in regard to these revelations was to just throw a juvenile hissy fit tantrum and call me names, LOL.
Here’s reality: These facts demonstrate that Willis Eschenbach “found” nothing. Nothing at all. His “analysis” is bogus.
It is just so silly, watching you clowns pretend that a weekend’s worth of never-checked-for-accuracy “analysis” by a single biased amateur non-scientist should be “trusted” more than years of double and triple checked scientific research conducted by scientific professionals from all over the world. All these laughable claims that you WUWT fools ignorantly trot out, that multiple scientific organizations all over the world have, for decades now, been conspiring to commit scientific “fraud”, are just so so so so SO ridiculous. Utterly delusional nonsense.
I’m embarrassed and ashamed for you, Ferd, that you would so easily fall hook, line, and sinker, for this laughably ludicrous conspiracy theory clap trap that WUWT spoon feeds you. It’s disgraceful. It really is.
OK, this is my last answer, as this discussion doesn’t make any sense at all…
Everyone knows that satellite seawater levels are calibrated with tide gauges. What you don’t (want) to understand is that all tide gauges are coastal and include land up- and downlift, while satellites don’t have that problem (but do have a lot of other problems to solve). Even if the satellites show exactly the same increase for all coastal stations, they can show a larger or smaller increase for what they measure: the total oceans.
Which is what Willis has proven (confirmed by NOAA): all tide gauges together show around 2 mm/year increase over the past 30 years for all coasts in the world, while the satellite measurements show around 3 mm/year for the full oceans.
As far as I know, coastal measurements and full ocean measurements, may give different answers, thus may never be mixed!
You even don’t grasp what Willis has done: he compared the difference for each station in its own for changes over two periods: pre-satellite and parallel with satellites.
That gives exactly the difference in increase for each individual station in the two adjacent periods. Which didn’t exist…
Moreover how do you explain the difference between NOAA (tide gauges only, no acceleration) and Church & White (strong “acceleration”). Or is NOAA also such a skeptic organization?
Last but not least, if there is any reason to “adjust” the tide gauge measurements, you can do that for the past 30 years with satellites (even if these were calibrated with tide gauges???), but how do you do that for the previous years when there were no satellites? If you adjust only the past 30 years, you create an acceleration that simply doesn’t exist.
It is clear to me that you don’t have any clue about what you are talking, just parrot the mainstream climate “science” and everyone with a different opinion, based on good evidence, must be insulted…
re: “Everyone knows that satellite seawater levels are calibrated with tide gauges.”
I’m not sure this is really true. When I mentioned this fact to Willis, he made zero indication that he was aware of it. And he never mentioned it anywhere in his article inferring that sea level rise acceleration had been nefariously “manufactured” via satellite data.
re: “You even don’t grasp what Willis has done”
I understood exactly what Willis did. As I mentioned previously, his method of merely averaging all tidal gauge stations will not give a representative global value, because the stations are not randomly distributed.
Specifically: sea level is currently rising most rapidly in the western Pacific. However, tidal gauge stations are rather sparse in that area as compared to other regions of the world. Thus the area with the most rapid rise rate is going to be significantly underweighted using just a simple average of all stations.
By the way, earlier you claimed that Willis found “no acceleration. None.” This is not correct. He did find acceleration, but it was smaller than the Church and White value.
re: “confirmed by NOAA: all tide gauges together show around 2 mm/year increase over the past 30 years for all coasts in the world”
Can you provide a reference for this statement? I’d be interested in seeing it. Nerem and Fasullo (American Meteorological Society 2018) found that globally, tidal gauges are measuring 3 mm/yr., in agreement with the satellite data.
re: “the satellite measurements show around 3 mm/year for the full oceans.” (italics are my emphasis)
This is perhaps the first genuine observation on this topic that might actually make any sense … noting the difference between measurements at just the coastlines versus measurements of the full oceans. Realize again, though, that Willis made zero mention of that specific difference in his accusations that “bad” scientists were “manufacturing sea level acceleration”.
re: “just parrot the mainstream climate “science” and everyone with a different opinion, based on good evidence, must be insulted…”
From my viewpoint, it is exactly the opposite. Because of political bias, WUWT constantly insults, dishonestly disparages, and often, just plain old outright lies about most any research scientist who has ever had any part in “mainstream climate science”. Egregious examples appear practically every week in WUWT articles.
“Again, a model that is widely outside these margins has something fundamentally wrong in its calculations or basic assumptions and is worthless. Back to the design table.”
The old adage of “the map is not the territory” certainly applies here. Too many unknowns for the climate model maps to be accurate enough for what they are being used for.
Good comment.
If the melting in the tundra is making a significant recent contribution to the CO2 in the atmosphere, then one would expect it to similarly be affecting the carbon isotope ratio because it is mostly frozen vegetation that is responsible for the CO2 and CH4.
Clyde, again…
130,000 years ago at the height of the Eemian warmer period than today: temperatures 5-10 C higher than today in Siberia and Alaska.
δ13C levels during the Eemian: -6.7 +/- 0.2 per mil.
δ13C levels in the past 10,000 years: -6.4 +/- 0.2 per mil.
δ13C levels today: -8.2 per mil, very little connection with melting permafrost.
https://cp.copernicus.org/articles/17/507/2021/
The usual carbon utilisation by plants preferentially fixes C12. However, in periods of stress some plankton use a carbon concentration mechanism which discriminates less. Land C4 plants similarly do not fix C12 preferentially.
Out gassed CO2 from warming water would, I suspect (anyone know?) have a light C signal.
I doubt that we know enough about the processing of C isotopes in the whole cycle to attribute changes to human fossil fuel emissions.
The warming from 1910 to 1940 looks like the warming from 1975 to 2005. It’s not CO2. It’s not us, or at least it’s not our fossil fuel burning.
There’s a blog TCW Defending Freedom, which occasionally touches on these matters. Cold Comfort, a recent post, suggests a contribution to 20th century warming that is anthropogenic but does not involve fossil fuel burning.
JF
There is also isotopic fractionation that takes place at the water/air boundary that doesn’t get discussed.
Julian, the discrimination between 13CO2 and 12CO2 at the sea-air border and back is measured: -10 per mil δ13C from water to air and -2 per mil δ13C from air to water. Overall – 8 per mil δ13C, when in- and outflows are in equilibrium.
https://scope.dge.carnegiescience.edu/SCOPE_16/SCOPE_16_1.5.05_Siegenthaler_249-257.pdf
With between +1 to +5 per mil δ13C in the ocean surface layer (depending of sea life), that gives an average of -6.4 +/- 0.2 per mil δ13C in the atmosphere over the whole Holocene until fossil fuel use did give a drop of -1.8 per mil over the past 170 years.
Plankton under stress and C4 land plants discriminate less for 13C, but still are below the current atmospheric δ13C, thus any extra growth increases the δ13C level in the atmosphere…
Good grief, are we all still in kindergarten here:
Quote:”Henry’s law does not work if there is a chemical reaction between the solute and solvent (e.g., HCl (g) reacts with water by a dissociation reaction to generate H3O+ and Cl − ions)
here
What sort of school did everyone (not) go to to understand this:
The ocean is an alkaline thing.
Thus it is never in a trillion years going to spontaneously release something/anything that is acidic (such as CO2) – and thus make itself more alkaline
Also for the Radioisotope People: CO2 emitted from soil erosion would have exactly the same C12 C13 ratio as CO2 from fossil fuels
Didn’t we just see a story published here about how clever we all now are and how fantastic everything is.
Then this garbage comes along just a few hours later.
wtf is going on – something is very very wrong with this world right now and it’s happening everywhere you look
Granted that it’s a lot more complicated than just Henry’s Law (with biology being a huge complication), it is nevertheless the case that, in general, warm ocean water tends to outgas CO2, and cold ocean water tends to absorb it. When we say that the oceans are net removers of CO2 from the atmosphere (with atmospheric CO2 at the current level), that doesn’t mean they do so everywhere and always.
I don’t know where you have had any chemistry, but Henry’s law still works perfectly for CO2, but only for dissolved CO2, not for the equilibrium reactions that converts CO2 into (bi)carbonates once CO2 is dissolved.
That makes that both in fresh water and seawater a doubling of CO2 in the atmosphere will give a doubling of dissolved CO2 per Henry’s law.
As pure CO2 is 99% of all inorganic carbon species in fresh water, a doubling in the atmosphere gives near a doubling in water and then it stops.
In seawater, pure CO2 is only 1%, bicarbonates 90% and carbonates 9% of all inorganic carbon species. If you double that in the atmosphere, CO2 doubles from 1% to 2%, again per Henry’s law, but the rest doesn’t double, as dissociation of CO2 into (bi)carbonates also sets H+ free, thus the solution gets less alkaline and that pushes the equilibrium back to pure CO2.
The net result is that a doubling of CO2 in the atmosphere doubles free CO2, but total DIC (CO2 + (bi)carbonates) increases with 10%. Still, seawater can absorb 10 times more CO2 for the same increase of CO2 in the atmosphere than fresh water. That is the Revelle/buffer factor…
—————–
If you heat a solution of bicarbonates (stomach salt), I am pretty sure that a lot of CO2 will get out of the solution, despite that the solution gets more alkaline…
—————–
Practically all inorganic carbon on this world: oceans, carbonate rock, volcanoes,… is much higher in 13C/12C ratio (around zero per mil) than everything organic (most below -20 per mil). There are only two main sources of low-13C on this earth: recent organics and fossil organics.
As recent organics are gaining mass (the earth is greening), thus removing more 12CO2 than 13CO2 in ratio, the only cause of the steep decline in 13C/12C ratio in the atmosphere is our use of fossil fuels.
—————–
Thus sorry, 3 out of 3 of your complaints are completely wrong…
Every time someone lets a glass of beer or soda warm up, they prove the assertion wrong that a liquid will not spontaneously release CO2 gas.
I am a university trained physical chemist, and as such I can assure you that the amount of CO2 which affects the pH of water is precisely known, and it is small.
There is a physical parameter called the hydration equilibrium constant.
For CO2 dissolved in water, the value of this constant is 1.70 x 10^-3.
This means that 1.7 molecules out of every thousand exists as carbonic acid and it’s two conjugate bases, bicarbonate and carbonate.
The other 998.3 of them remain as CO2 gas dissolved in the water as a gas, just as O2 remains as O2, nitrogen remains as N2 gas, et cetera.
So, no.
We are not in Kindergarten.
Not all of us, anyhow.
Meant to respond to Peta with this comment.
Exactly right Fernando.
Thank you, Ferdinand, that’s very educational.
Peta, you are wrong.
You are overlooking many things to state this, and to believe it.
For one thing, the vast majority of CO2 dissolved in water remains as a dissolved gas.
It does not react with water to form carbonic acid.
Also, Carbonic acid is a very weak acid.
The ocean is not merely basic, it is buffered.
In any case, it is a fact that CO2 dissolves into and outgasses from the ocean.
If nothing else convinces you, this graph should:
I think Peta’s point is that the flux of CO2 at the ocean’s interface will be into the ocean due to its alkalinity. He didn’t mention carbonic acid.
There will be some free CO2 that be forced into solution by Henry’s law coefficients, but also some will react to form bicarbonate mostly, as well as some carbonate, driving even more into solution.
It seemed to me he is saying the oceans cannot outgas CO2, not in a trillion years is that physically possible.
Which is clearly false.
He definitely referred to carbonic acid, even if he did not call it that.
He referred to CO2 itself as an acid, and also said this:
“(e.g., HCl (g) reacts with water by a dissociation reaction to generate H3O+ and Cl − ions)”
OK. “a trillion years” may be a wee bit of an exaggeration, particularly when we take issue with alarmists believing their lousy models work 50 or 100 years into the future.
I agree with his chemistry though. CO2 is an acid anhydride. In alkaline aqueous solution it’s going to react to form bicarbonate thus providing a driving force for more dissolution. Of course, molecules move back and forth but the net flux will be for the oceans to pull CO2 out of the air.
I think his point is that it will continue to do this so long as the oceans are alkaline, i.e., a long time.
The oceans release and absorb CO2 even when they are alkaline. All is a matter of concentrations, pH and temperature. These three factors give the partial CO2 pressure in equilibrium with the above atmosphere, no matter the pH level itself.
Take a stomach salt solution and add a drop of vinegar: CO2 will be released, even when the pH still is largely alkaline…
It is impossible that the oceans would absorb CO2 indefinitely, as that would imply zero CO2 in the atmosphere. And again, a CO2 sink is not responsible for the CO2 increase in the atmosphere.
Currently the ocean surface absorbs CO2 and DIC increases. That is measured at every point in the oceans where DIC is measured over longer periods.
CO2 and seawater DIC were in equilibrium with the atmosphere for millions of years, be it with (long) delays, as it takes a lot of time to move CO2 into and out of the deep oceans to get an equilibrium between atmosphere and oceans.
For the surface (mixed) layer that is far more rapid: a matter of years, but that contains only around 1,000 PgC, compared to the atmosphere at 830 PgC.
Apparently Fernando took his meaning the same as I did, and pointed out the same things I did.
Your comment on ocean alkalinity is good and as a chemist I should have realized it before.
With regard to something being very wrong, we are being bombarded by propaganda at a high rate, and it’s being used as a tool for our control. We are allowing ourselves to be so controlled. Some propaganda is targeted and is designed to divide people, to get them to take sides.
You should review the physical properties of CO2 before you agree with that nonsense.
I don’t in principle disagree with your points. I think we interpret what he meant differently. Perhaps I shouldn’t argue for him, as I might be misinterpreting him.
Anyway, I learned the Bjerrum plot as the “master variable diagram” as a freshman taking quantitative analysis. I was able to skip general chemistry due to receiving a perfect score on the AP exam. That was a long time ago.
Lately, I’ve been doing reactions to carboxylate aromatic compounds using organic super bases. Similar chemistry but the environment is aprotic.
I always assumed Peta is a woman
At this point, what difference does it make? /s
One mistake he seems to have made is to compare CO2 dissolved in water with HCL dissolved in water.
HCL is a strong acid…100% of it will dissociate into ions once it is in solution.
CO2 is a weak acid, plus it is a gas with a low hydration equilibrium constant.
So a very tiny percentage will convert to H2CO3, and a small amount of the H2CO3 will dissociate into H+(usually written as hydronium, H3O+) and HCO3-
Every time someone lets a glass of beer or soda warm up, they prove the assertion wrong that a liquid will not spontaneously release CO2 gas.
I am a university trained physical chemist, and as such I can assure you that the amount of CO2 which affects the pH of water is precisely known, and it is small.
There is a physical parameter called the hydration equilibrium constant.
For CO2 dissolved in water, the value of this constant is 1.70 x 10^-3.
This means that 1.7 molecules out of every thousand exists as carbonic acid and it’s two conjugate bases, bicarbonate and carbonate.
The other 998.3 of them remain as CO2 gas dissolved in teh water as a gas, just as O2 remains as O2, nitrogen remains as N2 gas, et cetera.
Carbonic acid is a VERY weak acid. Which means the vast majority of it remains as undissociated H2CO3, in the case where there is only water and CO2.
Having other substances present complicates the situation somewhat, but in the ocean, the relationship holds.
More specifically, there is a very well known graph called the Bjerrum plot.
See here:
“Most often, the carbonate system is plotted, where the polyprotic acid is carbonic acid (a diprotic acid), and the different species are dissolved carbon dioxide, carbonic acid, bicarbonate, and carbonate. In acidic conditions, the dominant form is CO2; in basic (alkaline) conditions, the dominant form is CO2−3; and in between, the dominant form is HCO−3. At every pH, the concentration of carbonic acid is assumed to be negligible compared to the concentration of dissolved CO2, and so is often omitted from Bjerrum plots. These plots are very helpful in solution chemistry and natural water chemistry. In the example given here, it illustrates the response of seawater pH and carbonate speciation due to the input of man-made CO2 emission by the fossil fuel combustion.”
Here is the money quote out of that:
“At every pH, the concentration of carbonic acid is assumed to be negligible compared to the concentration of dissolved CO2.”
Bjerrum plot – Wikipedia
Nicholas.
As you are an expert here can you please help me understand the following reactions.
Take a molar solution of sodium bicarbonate and add to this a molar solution of calcium chloride and observe the reaction. The first thing that happens is a precipitation of calcium carbonate occurs, this precipitation is then followed by a vigorous effervescent emission of carbon dioxide gas. I assume that the effervescence is caused by the reaction of hydrochloride acid in solution with the solid calcium carbonate precipitate.
We know that it is impossible to obtain calcium bicarbonate in solid crystalline form so the reaction described above appears to suggest that calcium bicarbonate does not exist in soluble form either. This leads to the suggestion that sodium bicarbonate crystals are not what they seem to be and also in seawater the dominant species after sodium chloride is calcium chloride.
The sodium bicarbonate would make the solution alkaline. I would assume that more Ca(OH)2 would precipitate than CaCO3, since its Ksp is lower but one would probably get some of each until the lower pH reaches a new equilibrium, which drives the effervescence.
In chemistry, there are numerous situations in which an intermediate exists in one phase or another in significant quantities until a reaction reaches equilibrium or completion. For that reason, one should not rule out the possible existence of CaHCO3 in solution even though it doesn’t exist as the solid.
Do you have a link to a particular demonstration? In an experiment, I would collect the precipitate and use HCl to liberate CO2 to quantify the carbonate vs hydroxide.
Scissor,
It’s an interesting and very simple experiment to try out using kitchen materials.
The standard geologist test for limestone is to add hydrochloric acid to the rock sample and observe if any effervescence occurs.
The fact that the precipitate immediately effervesced demonstrates that it is calcium carbonate and not calcium hydroxide that is being formed.
The process I am describing must therefore involve hydrochloric acid in the solution. From this I deduce that the dissolved calcium chloride CaCl2 combines with the sodium hydrogen carbonate NaHCO3 to form CaCO3 (ppt) NaCl (solution) and HCl (solution).
The hydrochloric acid solution then dissolves the calcium carbonate precipitate to form more calcium chloride solution and release carbon dioxide gas.
CaCO3 + 2HCl -> CaCl2 + H2O +CO2
As part of my geological studies I was very surprised to discover that there exist in Brazil natural mineral deposits of Tachyhdrite a hydrous chloride precipitate of calcium and magnesium. This leads me to wonder about the nature of calcium ions in seawater.
Wait a second, I never claimed to be an expert.
Just educated in the relevent discipline.
Beyond that, let’s look at some individual things you are saying:
“We know that it is impossible to obtain calcium bicarbonate in solid crystalline form so the reaction described above appears to suggest that calcium bicarbonate does not exist in soluble form either”
When in solution, these substances exist as individual ions in an equilibrium.
The formation of calcium bicarbonate solution is the process by which rainwater with CO2 in it dissolves limestone.
The fact that one cannot prepare a solid crystal of a substance does not mean that the two ionic constituents of the substance cannot exist in an aqueous solution.
“This leads to the suggestion that sodium bicarbonate crystals are not what they seem to be and also in seawater the dominant species after sodium chloride is calcium chloride.”
I am not sure what suggests either of these things given what you have stated.
The chemical composition of sodium bicarbonate can be confirmed in any number of ways, and if they are not what everyone in the world thinks they are, that is news to me.
In solution, these soluble salts do not exists as species of salts, but as ions of each component.

In sea water, there are chloride ions, calcium ions, sodium ions, etc.
The relative solubility of each salt has limits of course, and many factors effect the solubility, such as the temperature, the pH, the presence of other substances that may react with them, etc.
Nicholas,
Don’t be so modest, you clearly have a better understanding of this than I do.
One of the saddest aspects of the internet for me is that thanks to the anonymous trolls there is a tendency to assume bad faith.
Thank you for your honest replies.
Something else I have found helpful to keep in mind is that the term “soluble”, has itself a specific definition in chemistry, that is not the same as the term when used in casual conversation.
Nearly everything has some degree of ability to be dissolved in water.
Things that are called “insoluble” means that they dissolve in an amount below a specific value.
The word itself has a relative rather than an absolute meaning in chemistry.
There is a spectrum of solubility, and words to describe degrees of solubility, such as miscible, slightly soluble, insoluble, etc.
Chemistry textbooks often define “insoluble”, for example, as any substance that dissolves at a rate less than 0.1 grams per 100 mL of solvent.
Also one should keep in mind that when a substance precipitates out of solution because it has low aqueous solubility, there is virtually always some amount of that substance still in what is called colloidal suspension in the water. For this reason, very often a great deal of time is required for a solid to actually settle out of the column of liquid.
In order to believe that modern levels of CO2 in the air have nothing to do with people burning stuff, one would have to believe some things that are very difficult to believe.
For one thing, one would have to believe that every single effort to determine atmospheric CO2 levels for many million recent years, are totally wrong, or else one has to think that by some weird coincidence, CO2 levels which have not existed on Earth for millions of years just suddenly happened to occur starting the middle of the 20nth century, and that it is just a weird coincidence that this is exactly when we started to dig up/pump out a large amount of fossil fuels and burn them.
I do not believe either of those things.
For me to believe either of those, I would have to believe geologists are either wrong about everything, or else they are only wrong about the methods used to determine past CO2 concentrations.
And there are far too many independent and converging lines of evidence to believe any of those things either.
Compared to geology and Earth history, the ability to correctly account for worldwide fluxes of the total amounts of any particular molecule seems very flimsy and uncertain.
It is not such a weird coincidence considering that there is considerable concern that the tundra permafrost is melting and releasing CO2 and CH4.
Clyde: the Eemian, 130,000 years ago.
Much hotter than today (5-10 C in Siberia and Alaska) much permafrost melted, together with about 1/3 of the Greenland inland ice. Forest growing up to the Ice Sea, where today only tundra is.
According to ice cores:
CO2: 300 ppmv
CH4: 700 ppbv
Today:
CO2: 415 ppmv
CH4: 2000 ppbv
Nothing to do with melting permafrost…
OK, assuming for the sake of the argument that you are correct, why do you suppose that PBS NOVA did a recent program on it? Surely there are some that disagree with you and are concerned.
One possibility to consider is that during the height of the Eemian the plant communities had re-established themselves and were drawing down the CO2 that bacteria had released prior to the optimum.
Clyde, I am not responsible for the propaganda that most media make for catastrophic results of our CO2 emissions…
Indeed there is quite a difference in time period of the CO2/CH4 release from area’s of permafrost, but as the time necessary to break down CH4 into CO2 is quite short (10-20 years half life), that will not get high anyway. The same for CO2, where the half life time is about 37 years. You need a lot more emissions to have the increase we see today…
You need a lot of increase in permafrost emissions to have a discernible change.
For humans that gives a lot of trouble when roads are going up and down (as is the case in Alaska…) thanks to a melting underground or houses are sinking and/or destroyed…
Only by vested interests.
There us another story that the data tells us.
Lessons from Paleoclimate Conveniently Ignored by the IPCC – Thomas P Gallagher & Roger C Palmer
How can you say it would not be a very crazy weird coincidence?
It has been far warmer many times, and for far longer periods of time, and nothing like the recent rate of change in CO2 has been seen.
If you are arguing that CO2 at 400+ ppm is nothing unusual, then you should say so, because I have made it clear I am basing my view on the accepted proxy values of CO2 being largely correct.
We have proof that trees were growing well north of present tree lines thousands of years ago. Actual tree trunks. Glacial evidence that it was far warmer thousands of years ago.
Human historical evidence, such as Vikings farming in Greenland in locations where it is currently too cold to grow what they were growing.
People have disputed whether the Greenland ice core data can be used as a proxy for global temperature patterns, but here we are talking about temps at a similar latitude in the northern hemisphere.
Besides, Greenland ice core temps have been shown to correlate well (with some distortions) with Antarctic ice core temps, and data from many sources all over the globe is in general agreement with Antarctic ice core data, including sea level and ice sheet data from a very long stretch of time.
So there is a very neatly fitting jigsaw puzzle of facts that tell a consistent story.
And in this story, CO2 does not control temps, and CO2 has not been at present levels for a very long period of geological time.
So I am sticking with “It would be a very weird coincidence”, and warmista alarmism quoted by a skeptic playing devil’s advocate with facts is not gonna change my mind.
Perhaps they are wrong. According to Renee Hannon who wrote a WUWT article in the last year about it, ice core CO2 data was overly smoothed out (attentuated) by firning and data processing.
True, not everyone agrees with any particular finding from proxy data or anything else.
I personally take this into account and try to remember not to state things as absolutes.
And I went to some lengths right here to allow for the possibility of being mistaken.
At some point though, do we not have to decide what the weight of the evidence tells us is likely to be true?
If any degree of doubt made us unwilling to form any conclusions and move on from there, that seems to me the same as believing we cannot truly “know” anything at all.
Bob, the smoothing of the CO2 levels in ice cores depends of the local snow accumulation and thus of the time needed to close all air bubbles.
That makes that the average resolution is between 8 years (2 of 3 Law Dome ice cores) up to 560 and 600 years for Dome C and Vostok. But the other side is that the high resolution ice cores only span some 150 years in the past while Dome C spans 800,000 years before rock bottom is reached.
Data processing plays no role at all, as CO2 in ice cores are direct measurements in air with NDIR, GC, mass spectrometer, identical with similar equipment used for CO2 in ambient air.
All the figures in the is article show the increase in “natural” sources are smaller than the increases in the sinks. +30pg / year into atmosphere verses +36pg / year out of the atmosphere. How does this translate into an argument that natural changes are causing an increase in atmospheric CO2?
Where is the temperature;)
Nature is absorbing more and more CO2, despite rising temperatures for the simple reason that the increase in the atmosphere is faster than dictated by Henry’s law (12-16 ppmv/K) for the decreased solubility of CO2 in warming ocean waters…
Beste Frans,
Sorry, but you are completely wrong about the cause of the CO2 increase in the atmosphere. That makes that the very good pages that you have made will suffer form that terrible mistake.
Indeed, Murry, Salby, Berry and several others have made the same fundamental mistake:
The atmosphere is NOT a single reactor with one inlet and one outlet where the outlet flux is directly proportional to the height (pressure) in the reactor.
The bulk of the CO2 fluxes are seasonal and bidirectional. These are caused by the seasonal temperature changes and hardly influenced by the CO2 pressure in the atmosphere.
Even if the seasonal fluxes doubled over time, that has zero influence on the total amount of CO2, as long as the influxes and outfluxes are in equilibrium.
Over the past 60+ years, the outfluxes were always larger than the influxes, it simply is impossible that the natural fluxes were the cause of the CO2 increase, as the net result of all natural fluxes is more sink than source, already 60+ years…
Human emissions are one-way additions and larger than the measured increase in the atmosphere. Any book keeper will show you that this is what counts, not how much money is circulating in your business…
Then a few specific remarks:
“At 1 °C temperature increase, this results in an increase in emissions from the oceans of 19 PgC/yr.”
Which is impossible, as the CO2 in the atmosphere increases, thus the partial pressure difference (pCO2) between CO2 in the atmosphere and the ocean surface gets smaller again, and gets the old flux rate once the delta-pCO2 is the same as before at about 12-16 ppmv/K
If there is any increase in fluxes, again that is for both sides of the balance: the CO2 sinks in the oceans increased more than the sources…
That is fully reflected in the work of Feely e.a.:
https://www.pmel.noaa.gov/pubs/outstand/feel2331/mean.shtml
The same map of NOAA that you show also shows that the oceans are more sink that source for CO2 with about 2.2 +/- 0.4 PgC/yr thus not the cause of the CO2 increase in the atmosphere.
The rest is for tomorrow (it’s after 2 AM here…)
Here a realistic scheme from the natural and human CO2 fluxes in the atmosphere:
Ferdinand, this statement is I think the core of our misunderstanding. I agree with you that the atmosphere has more than one source and sink, but as a first order approach it can be regarded as a single reservoir where the outlet flux is proportional to the height (pressure). All the biological and chemical processes in the ocean are interesting, but not relevant.
There is a seasonal element in the natural fluxes, but not for the bulk and also not relevant. The concentration in the atmosphere is the main driver for the absorption of CO2.
How can you be so sure about this equilibrium, where the many natural fluxes are in total 20 times larger than the anthropogenic emission and have different drivers for up and down?
The simple fact that at the end of the year we have more sink than source is no proof. I never denied that. But both natural emissions and absorptions are now larger than in 1750. In your reaction you do not address that.
And about the temperature dependence of 19 PgC/yr I think it’s good if you have a look at the calculation in the 2019 article of Hermann Harde.
Frans,
“as a first order approach it can be regarded as a single reservoir where the outlet flux is proportional to the height (pressure)”
indeed that is the crux of the matter:
Most of the huge natural fluxes are NOT proportional to the CO2 pressure in the atmosphere, not at all.
Take the uptake of vegetation in spring/summer: a huge flux of estimated 60 PgC/half year that increases while CO2 levels in the atmosphere are falling. In fall/winter the opposite happens: more CO2 release when CO2 levels in the atmosphere are rising. That is totally opposite to what you (Harde, Salby, Berry,…) expect.
Why? Because that are biological processes that react on temperature, hardly on CO2 pressure.
The same for the about 50 PgC/half year fluxes between oceans and atmosphere: again these follow the seasonal temperature changes. In this case, CO2 releases are in the same direction as pressure changes, but the ocean temperature changes are the driving force, not the pressure changes.
That makes that at least for the bulk of the CO2 fluxes over a year these fluxes have nothing to do with the CO2 pressure in the atmosphere. Nothing.
It is this completely wrong picture of reality that makes that all calculations made by Harde, Salby and others are wrong.
If the atmosphere should react as a one inlet/outlet river or reactor, then any extra CO2 added to the atmosphere would be removed with the same speed as the rest of the CO2 for the total amount of CO2 in the reactor. The short residence time of about 4 years would be the same for any extra CO2 as for the bulk and there is no difference between the decay of the extra CO2 and the bulk of CO2… That is exactly where it gets wrong.
What then influences the CO2 changes in the atmosphere? The difference between all inputs together and all outputs together.
That difference is known and (near) entirely caused by human emissions of fossil fuel CO2. Almost every year for the past 60+ years.
At what speed is that extra CO2 removed?
That is a matter of extra pressure above equilibrium and that is hardly influenced by temperature.
The extra pressure in this case is not the total CO2 pressure in the atmosphere, but the partial pressure difference between atmosphere and the oceans. The latter should be at about 295 μatm for the current average ocean temperature, while the atmosphere is already at 415 μatm.
That is the driving force for the CO2 uptake: because of that pressure difference, less CO2 is released by the oceans and more is absorbed by oceans and vegetation. For vegetation decay it makes no difference.
That is a totally different, pressure dependent process which removes any extra CO2 above equilibrium, whatever the source, than what moves the temperature dependent seasonal fluxes, which make the bulk of all natural fluxes…
The measured e-fold decay rate for the removal of any extra CO2 above equilibrium is over 50 years, or a half life of over 35 years. Quite a difference with the residence time of around 4 years…
BTW, that is another error of Harde: the net sink rate of any extra CO2 in the atmosphere is against the CO2 pressure already in the oceans (and plant alveoles), not against zero CO2… It is the difference between the height/pressure in the atmospheric reactor and the height/pressure in the much larger ocean reactor not empty space…
The strange point is that Harde takes the CO2 pressure in the oceans into account for the decay rate of 14CO2, but not for the bulk CO2…
The rest is for next comment…
Then we have:
“How can you be so sure about this equilibrium, where the many natural fluxes are in total 20 times larger than the anthropogenic emission and have different drivers for up and down?”
Because we know the difference between all natural inputs together and all natural outputs together. That is currently near 5 +/- 3 PgC/year (2.5 +/- 1.5 ppmv/year) more sink than source. And growing.
If you back calculate the linear decay rate against the increase in the atmosphere, you end below 300 ppmv as the zero-sink value, that is the equilibrium value.
Even without that, we know the pCO2 dependence of seawater temperature and other factors and can calculate the average pCO2 for different temperatures. That too ends around 295 ppmv. All supported by the CO2/T changes as seen in ice cores…
“But both natural emissions and absorptions are now larger than in 1750. In your reaction you do not address that.”
There is nothing to address… A cycle doesn’t remove or add anything to the bulk in the atmosphere as long as there is no difference between ins and outs, no matter if that cycle doubles or triples. Only the difference matters and that is quite accurately known: more sink than source and the difference is proportional to the extra pressure above equilibrium.
“And about the temperature dependence of 19 PgC/yr I think it’s good if you have a look at the calculation in the 2019 article of Hermann Harde.”
I did look at an older work (2017) and have written a rebuttal:
http://www.ferdinand-engelbeen.be/klimaat/Harde.pdf|
Anyway, an increase of temperature will give an initial increase in pCO2 of the ocean surface with 12-16 μatm/K and the corresponding extra flux may be 19 PgC in the first year, but as because that extra flux the CO2 level in the atmosphere increases, in the second year, the pCO2 difference between warmer ocean and atmosphere decreased, thus less extra CO2 is released,… until the pCO2 in the atmosphere increased with the same amount as in the oceans surface and then the there is no extra CO2 release anymore and the previous fluxes are re-established.
Here for 1 K ocean temperature increase:
here the picture…
I would agree that it makes no sense that anthropogenic CO2 would stay in the atmosphere longer than CO2 from the natural flux. Can you provide a reference where they (the IPCC) make this claim?
I take their meaning to be that the excess being added from human sources will take some time to be removed from the air completely, by biological processes, and absorption by the ocean.
I think they may have overstated the amount of time it will take, maybe even drastically so, but I do not think they necessarily mean that there is a literal difference in the actual molecules…which would be clearly ridiculous to say.
Obviously all molecules of any given substance that are chemically identical (excluding the effect of different isotope concentrations), are fungible.
I have always argued that anthropogenic CO2 cannot account for most of the rise in CO2 in the atmosphere – it just takes the application of common sense to figure that out.
How one can “estimate” with any degree of certainty either the natural release or capture of atmospheric CO2 is beyond me. At best that must be a +/-50% figure, but one can obviously measure the result with some accuracy.
It is also just common sense that if the world warms, the CO2 cycle should become more active, and that likely leads to more CO2 available in the atmosphere, just as there would be a net average of more water vapor.
Now back to the root question that no one can seem to answer with anything more than guesses…why is the world warming? Yes, it’s mostly natural and cyclical, but what is it? The Sun seems most conspicuous, but there are other likely candidates. If one could prove something natural is causing the warming, then the whole CO2 charade is over.
It’s not warming. It’s cooling. Desertification is happening to our planet. Desertification happens because of COOLING, NOT WARMING.
I know, the simple human brain cobbled with years of public school indoctrination believes that “Deserts = HOT” shows just how simple people are. 0 dimensional thinking.
Heat evaporates water from the oceans which forms clouds.
Clouds give rain.
Lower temperatures = less oceanic water evaporation.
Less oceanic water evaporation = decreases in arable land and increases in the size of our deserts.
More CO2 means plants and trees can survive and grow with far less moisture than when CO2 was lower.
What is your empirical evidence desertification is happening?
Or are you just inferring that it is because cooler = dryer = larger deserts?
From space the Earth is greening.
As a practical matter, the Sahel had regular famines even a few decades ago, and many places were not able to grow enough food to feed their populations.
These things are far less true now than in even the recent past.
Whether it is overall warming or cooling, it is for sure than some places are getting warmer at some times of the 24 hour cycle, and some places are not as cold in the low sun season, and some places are not as hot during the day in the high sun season, etc.
Whatever is happening overall, on average (which it is hard to say for sure if anyone knows precisely with the exception of the satellite measurements of the total atmosphere), it is not very much and not very fast.
Given huge daily swings, seasonal swings, variations from place to place over a day, week, month, year, and from year to year, the overall temp is incredibly constant over decadal scale periods in recent years.
We are not seeing any dustbowls.
We have not had any years without a summer.
Nearly every place has almost all the time very normal weather, with occasional terrible weather events that are mostly local and mostly brief.
Just like always.
We seem to be suffering from a not so scary and not very severe case of global milding.
More CO2 means plants and trees can survive and grow with far less moisture? According to who?
Point blank, there are only 2 prime movers of earth climate.
1: The sun
2: The temperature of space in this region of the galaxy.
There are warm spots in our galaxy, caused by the milky way cannibalizing 2 smaller galaxies (the large and small Magellanic clouds). Where the 2 galaxies merge, temperatures increase.
Here’s a few facts our “scientists” got absolutely wrong:
1: The sun did not form first. The planets formed from the super nova of a much larger star long ago. The rotation of our galaxy imparts planetary formation, rocky bodies form from the debris, and eventually the sun gathers enough hydrogen to ignite its fusion engine. Once the sun ignites, planetary accretion STOPS, as the outward pressure of the solar wind literally blows everything out to the Ort cloud.
This is how the Ort cloud formed, and why.
2: Every single planetary collision is a result of extra-solar influence. When a solar system forms, there are no chaotic impacts from within. Every comet that leaves the Ort cloud, every impact crater on every planet, the asteroid belt, mariner valley on mars, the great red spot of Jupiter, the rings of Saturn, Uranus’ odd axial tilt (heck even OUR tilt) comes from extra solar influence. These ‘extra-solar influences’ are caused directly by galactic cannibalization. If you were to travel to another galaxy which evolved in complete isolation, ie one that has never cannibalized another galaxy, you would find planetary systems completely devoid of impact creators. Look at our moon, and see all the myriad of creators, and understand that every one was caused by rogue objects moving about our galaxy against the direction of galactic motion.
3: Extinction events are NOT RANDOM. If you take every known extinction event that has happened on Earth for the last billion years, and superimpose it on a chart that shows our location in our galactic orbit, you will EASILY see “hot zones” as we travel around the galactic center. These are regions where a large number of stars are zipping around our galactic center in odd trajectories. Here is where we get “extinction events”. In fact, I computed the odds of impact while in a “hot zone” as being roughly 50/50.
That’s right. When we go through certain galactic hot zones, it’s a coin toss as to whether or not we get clobbered.
All you need to know is the approximate duration of our “galactic year”, which is roughly 250 million years. Once you have this, you can look at every extinction event and literally plot them on our “galactic year map”. You will see that certain areas of the galaxy are relatively safe, and others a cosmic shooting gallery. Proving with absolute certainty that extinctions are VERY PREDICTABLE.
I’m sure you’ve heard of the Mayan calendar? The Mayan calendar didn’t predict the end of the world. The Mayan calendar predicted Earth’s entry into the next “hot zone”. It would seem that extinction events abound in our galaxy, thanks to the Magellanic clouds. Civilizations which have the technology to flee their worlds turn their telescopes skyward and look for LIQUID WATER. Earth, being loaded with it, appears as a “galactic safe house” to species fleeing their now destroyed worlds. You’ve perhaps heard of the Dropa people, and their disks of knowledge? The Dropa were galactic refugees that landed here and found an indigenous people (us). In fact, any “alien visitors” from other worlds wouldn’t come to Earth for exploration, or to teach cavemen geometry. No, the distances between stars are simply too vast for frivolous exploration. Every single alien species that has ever or will ever come here will be here for 1 reason and 1 reason alone. Their worlds were rendered uninhabitable thanks to extra-solar (in fact, extra-galactic) collisions.
Perhaps THIS is why our “governments” are pushing us so hard to accept “refugees”?
There is a simple reason why plants can survive drought better with more CO2: when CO2 is high in the growing season, the plants grow less stomata in next growing season, because they need less for the same or even larger amount of CO2 to take in.
Less stomata = less water vapor loss, so the plants need less water too to survive…
Not really sure why my last comment is “awaiting approval”…
Suppose the entire globe had the same average temp, say 60F. If that were to change to 61F over ten years would anyone notice? How much of a change would be needed for people to notice?
I suppose you mean if we did not have instruments to measure the difference, since obviously anyone with a thermometer would notice if they looked at it.
I think it would be very unlikely a person could sense such a difference on bare skin though, and I have used this exact point many times over the years.
Inside a temperature controlled room in which a thermostat controls a furnace or air conditioner, it typically requires about 2° F of change to trigger the mechanism to turn on or off the furnace or AC device.
This is to prevent cycling from being too frequent and cause excessive wear and strain on the machinery from start-ups and shut-downs.
Few can feel such an amount, and it seems the room is at a constant temperature.
For most people, our perception of the temperature is more influenced by factors peculiar to our physiology than such a small change in temp.
IOW, someone may feel 70° is too cold one day, and too warm on some other day, or time of day.
The amount of the triggered temperature change can be adjusted on most thermostats of course.
You make a good point though: If we did not have sensitive instruments like thermometers, would anyone even know the average temperature of the entire globe has changed by a degree C since the year 1850?
How could anyone think 1.5° of change will cause some sort of unsurvivable catastrophe, especially since we know that there have been far larger variations just in the period of human history?
And how did everyone come to believe that we are better off on a colder planet than on a warmer one?
Regarding: “The natural fluxes are much larger. To and from the sea this is about 80 PgC/yr, to and from land about 120 PgC/yr.” Most of this is oscillatory source/sinks, such as vegetable mass including leaves of deciduous trees. Then there are the oceans outgassing CO2 where they’re especially warm, but that gets matched by sinking by the oceans that is in addition to the net sinking by the oceans. The annual wiggle in the monthly CO2 measurements by the Mauna Loa observatory shows peak downturning month and peak upturning month have CO2 rate of change being on average about 8 times the annual rate of change.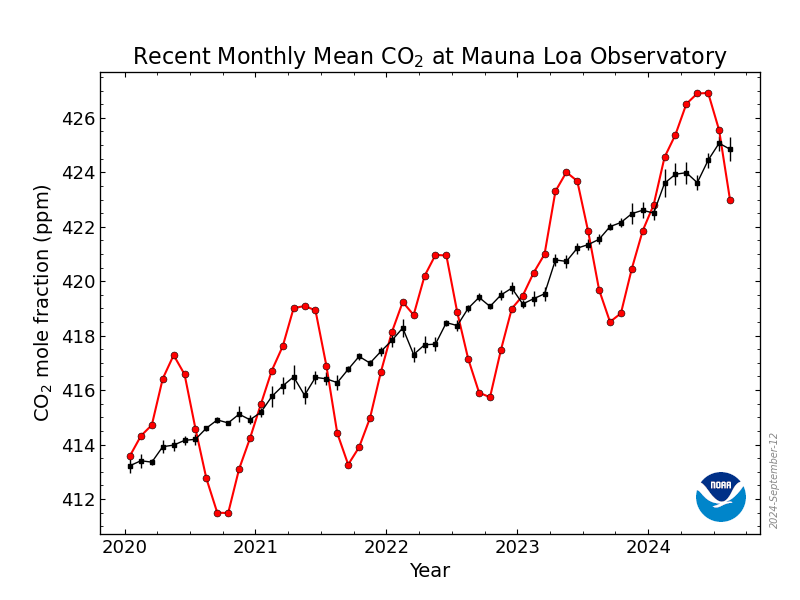 which is in https://gml.noaa.gov/ccgg/trends/ Also, there are natural sources and natural sinks even happening at the same time and pace, such as extratropical forests having quickening decay of the lots of dead vegetable matter that many of them have in late spring and early summer while they are also going gangbusters with starting to use sunlight and CO2 for building new biomass.
Not one scrap of evidence has yet been presented to show that CO2 denies the laws of physics.
An atom absorbs energy (heat). That photon is then radiated back outward IN A RANDOM DIRECTION.
What “climate change idiots” want you to believe is that CO2, through some magic process, refuses to radiate energy back in space, which it most assuredly does.
I haven’t heard anyone saying that radiation from an excited CO2 molecule isn’t send partly to space and your reasoning is wrong: without GHGs all radiation from the surface reaches space without anything being captured at all and nothing is send back.
With GHGs about half is redirected to the surface, thus increasing the energy budget of the surface (even if only 1% reaches the surface) which must heat up to get rid of that “recycled” energy.
I’m curious. Exactly what is it on the surface of the earth that absorbs all that “re-radiated” infra-red radiation and heats up? As far as I know most of the earth’s surface is made up of substances that don’t readily absorb IR radiation.
Tim, if the surface can emit IR, it can absorb IR…
For water, most IR is absorbed in the highest fraction of a mm in the skin layer and probably manly transformed into evaporation, but anyway absorbed and no energy is lost in that process…
“Tim, if the surface can emit IR, it can absorb IR…”
If the surface absorbs IR then why doesn’t it immediately re-radiate it back toward space?
The same thing happens at the surface of the land as it does to the ocean. IR doesn’t penetrate very far into the surface of either water or land.
You didn’t answer my question. Exactly what is it on the surface of the earth that absorbs all that re-radiated IR? Gypsum and silicon, two of the most common materials on the surface of the earth, don’t absorb IR very well at the frequency CO2 radiates. They would reflect most of the CO2 radiated IR.
Could it be that it is the atmosphere that is heating because it can’t radiate the heat energy away fast enough? Are we confusing heating of the Earth’s surface with heating of the Earth’s atmosphere?
It just seems like there is a big hole in this theory of “re-radiated” IR. It assumes that the “downward IR” is absorbed and RETAINTED by the Earth thereby raising the temperature of the Earth. That leads to two questions: 1. how is the IR absorbed by the Earth when its most common substances don’t absorb at CO2’s frequency, and 2. how does the Earth “retain” the heat from what it absorbs.
Tim, the broadband temperature related radiation is fixed by the Stefan-Boltzmann law. If some energy from back radiation is absorbed, that isn’t directly reradiated (assuming an ideal black body) but adds to the energy of the object. With that extra energy the object does increase in temperature and more energy is sent towards space, That can be in any wavelength within Planck’s law, depending of the absolute temperature of the object.
Different materials surely have different radiation and thermal conduction characteristics and some stuff that is reflecting near all sunlight (fresh snow) can be a perfect black body in the IR band…
What happens further, depends of the physical properties of the objects: for the oceans most is absorbed at the skin layer and while most leads to evaporation, some heats the skin layer so that less cooling will be observed at night than without back radiation… Some materials will conduct a lot of heat into deep layers during the day and slowly give that back at night, others have only a thin heated layer and are cooling fast at night…
All I know is that many surfaces absorb and emit sufficient IR to have an influence on average temperatures…
Here an overview of several stations that measure incoming and outgoing IR with a few doing detailed spectral analysis:
https://scienceofdoom.com/2010/07/17/the-amazing-case-of-back-radiation/
This only applies to black bodies which the earth is not. CO2 itself is not a black body. It only absorbs and emits at certain discrete frequencies, not all frequencies as done with a black body.
I believe you will find that molecules like CO2 absorb and emit at basically the same frequency. They do not absorb and emit at all frequencies. The “Planck curve” that is used to determine temperature of the earth assumes that all the different frequencies emitted by the various substances on earth do fit into that curve that is similar to a black body emission at a discrete temperature. The integral of all the combined frequencies of the earth do fit well within a Planck black body curve of a given temperature.
Your response does not discuss the thermodynamic problem of the greenhouse theory. The GHG “assumes” the atmosphere is transparent to the sun’s radiation and that the soil/water absorbs everything that isn’t reflected (albedo). It then re-emits that radiation at lower frequencies. This makes the solid earth a hot body and the atmosphere the cold body. As the temperature of the cold body rises so does its radiation. However the energy that is emitted toward earth (50% or less of the original) can not heat the hot body, it can only slow the cooling. In other words, when all is done, the atmosphere is an insulator, not a heat source, slowing the overall gradient of the planet’s heat loss.
I didn’t say anything about CO2 as a black body, as no gas is a black body, some are GHGs and absorb and re-emit in specific wavelengths, but the bulk of the atmosphere is a nobody: simply transparent for most frequencies.
That also is the case for temperature: without GHGs there wouldn’t be a lapse rate and only convection could give the atmosphere some temperature.
The re-emissions by a GHG molecule is (near) completely independent of its temperature and there is no rise in back radiation if the atmosphere warms, even less, because the frequency of collisions increases with temperature and then the CO2 molecule looses its excitation before re-emission can occur.
Even again on this part, the atmosphere is not a cold body, it is a nobody. Only the total energy in the system is conserved.
Further, GHGs do heat the earth’s surface and a lot.
The incoming solar energy reaching the surface and absorbed is only 163 W/m2. The incoming back radiation and absorbed by the surface is 340 W/m2, both together gives us the current earth with its livable temperatures and not snowball earth if we had only the sun heating the surface.
The back radiation is not new energy, but recycled energy, no energy is created.
That is far beyond a blanket slowing the outward radiation, it is actively increasing the energy reaching the surface by recycling part of the outgoing energy.
https://en.wikipedia.org/wiki/Earth%27s_energy_budget
The incoming solar energy reaching the surface and absorbed is only 163 W/m2. The incoming back radiation and absorbed by the surface is 340 W/m2, both together gives us the current earth with its livable temperatures and not snowball earth if we had only the sun heating the surface.”
Where exactly does that 340 W/m2 come from? Is the sky on fire?
Could it be that it comes from 340 W/m2 being emitted by the surface to begin with? If so then you have 340 W/m2 going up and 340 W/m2 coming back. First the earth cools as it radiates and then rewarms from the downward radiation. How then can it warm to a higher temperature than it started at?
You first say no energy is created. And then you say that it *increases* the energy received by the surface? How could that happen if no energy is created? That energy “increase” provided by the atmosphere is balanced by an energy “loss” by the earth to begin with. Thus you get conservation of energy. Anything else requires energy to be created by the atmosphere. And I see no fire in the sky when I look up.
Look up the formula for dry lapse rate. You will see that the acceleration of gravity is a factor. Why? Density reduces as you move up in altitude because the force of gravity is smaller. It has nothing to do with GHG’s creating the lapse rate.
From: https://www.thermal-engineering.org/what-is-kirchhoffs-law-of-thermal-radiation-definition/
Your statement violates this law in all respects.
GHG’s do not HEAT the earth’s surface. If they did, they would push the earth’s temperature back up the cooling gradient and raise the temperature of the surface.
Your statement relies on the atmosphere being warmer than the earth’s surface. In fact much warmer. That violates the main assumption that the atmosphere is unaffected by the sun’s energy and that the sun only heats the earth’s surface which then heats the atmosphere.
Do the GHG’s ever get warmer than the earth’s surface? I have never seen a reference that says that is the case. The basic assumption is that the atmosphere is cooler than the surface.
According to Planck’s thesis on heat radiation, the best that could happen is that the earth’s surface and the atmosphere could reach thermal equilibrium where both bodies radiate similar amounts toward each other.
Lastly, remember that this all ignores convection and the temperature changes that occur because of it.
You still haven’t answered my main question. What substance on the surface of the earth radiates and absorbs energy at the frequency of CO2? Is the surface of the earth made up of CO2?
You are quoting black body radiation physics to me which is meaningless! CO2 is not a black body. Gypsum is not a black body. Silicon is not a black body. H2O is not a black body.
All of these materials absorb and radiate IR at specific, narrow bands of frequencies. Again, they are *NOT* black bodies. What they cannot absorb or radiate they reflect, including radiation in the narrow band of frequencies associated with CO2.
Really? A black body by definition absorbs and radiates *all* frequencies. It doesn’t discern between “light” and “IR”. Not even water (i.e. snow) is a black body in the IR band. See the attached graph for the absorption spectrum of water in its gaseous, liquid, and solid form.
“Some materials will conduct a lot of heat into deep layers during the day “
What “some” materials absorb back radiation from the atmosphere during the day? What materials absorb back radiation from the atmosphere at night? I keep asking and you keep refusing to answer. What materials on the surface of the earth radiate at the frequency of CO2 during the day? During the night? I keep asking and you keep refusing to answer.
How do you *know* this? It would seem that it is merely an assumption on your part! If you cannot specify *which* surfaces do this then how can you *know*?
Your reference merely establishes the fact that downward radiation exists. It says absolutely nothing about what the impact of the downward radiation is on the surface of the earth.
As an example the subsoil temperature at 4″ depth in central Kansas was 8C yesterday. The air temp 6′ above the surface was 21C. That’s a big difference. How does an 8C body raise the temperature above it to 21C?
Until someone can give me a definitive answer as to what on the surface of the earth absorbs “back radiation” and retains it as heat I will continue to assert that there is something fundamentally wrong with the physics of the “greenhouse effect”. The greenhouse effect may be warming the atmosphere but that doesn’t mean it is warming the surface of the earth. That is an as yet unproven assumption I haven’t yet seen proved.
I have no idea which materials do absorb IR in the specific wavelengths of CO2, but all I know is that the measured incoming solar energy is much smaller than the measured downwelling radiation and that the measured upwelling IR is about the sum of both.
Thus anyhow some material on earth in the neighborhood of the measuring stations absorbs and re-emits a lot of IR radiation…
If they can measure upwelling IR radiation of over 300 W/m2, that seems to me not far different from a blackbody…
I’m sorry, all of the energy the earth receives is from the sun, i.e. solar energy. The atmosphere is not on fire so it can’t generate energy on its own.
All of the energy that CO2 (and H2o) re-radiates toward the earth is energy already lost by the earth at the CO2 radiation frequency. At best, if none of that CO2 frequency energy radiated by the earth escaped to space you would have a net energy flux of zero, X amount of CO2 based energy going up and X amount of CO2 energy coming back down equals a net of zero.
“Thus anyhow some material on earth in the neighborhood of the measuring stations absorbs and re-emits a lot of IR radiation…”
Now you are back to playing games. The issue is not *all* radiation energy, it is the radiation energy of CO2 that is at issue, it’s what supposedly produces the greenhouse effect, not all IR radiation.
And I still haven’t heard from you what substance on the surface of the earth you believe absorbs energy at the CO2 radiation frequency and retains that energy thus raising the temperature of the earth.
It’s seems that *no one* has an answer for that question.
Tim,
The sun gives 163 W/m2 observed incoming energy that is absorbed by the surface. That gives snowball earth, if there were no GHGs.
GHGs, mostly water vapor, but including CO2, give an observed 340 W/m2 back radiation all absorbed by the surface. Not because the atmosphere is “hot”, but because part of the outgoing energy is sent back to the surface. Outgoing radiant energy is near 400 W/m2, again measured. The residual total incoming energy is used for evaporation and convection.
See: https://en.wikipedia.org/wiki/Earth%27s_energy_budget
The outgoing energy is clearly recycled several times and it is that which increases the temperature of the surface far beyond reducing the outgoing energy like a blanket.
That is the total greenhouse effect.
What part CO2 plays in the total, I don’t know, but as far as I know, several water vapor bands are very near the CO2 bands, so it would be a strange coincidence that water vapor back radiation would be absorbed and CO2 back radiation not…
I keep asking you what on the surface absorbs that back radiation from the CO2 and you keep dodging. Why is that?
I keep asking you what absorbs all the non-CO2 back radiation and you keep dodging, Why is that?
If it is energy being “sent back” then where did it originate? Did the material providing that “sent back” energy cool off when it sent the 340 W/m2 outward for the atmosphere to send back?
If it cooled by 340 W/m2 then how can 340 W/m2 being sent back warm it up further than it already was?
This is a simple question to answer. Why do you keep dodging it?
How does “recycled” energy heat anything up past where it started, especially when that “it” is the source of the energy? The reflected energy comes from the “it” cooling by providing the energy that is being reflected. If the reflection is 100% efficient it can only raise the temperature of the “it” to where it started, not beyond!
You keep violating the Conservation of Energy law by creating more energy than you started with.
Who is saying this is the case? What on the surface absorbs water vapor back radiation? It’s the same question as for CO2. You haven’t answered either question. You’ve just used hand waving and magical thinking to say – “Well, that’s just the way it is”. Not very convincing.
Tim,
I don’t know what kind of surface does absorb all back radiation (except for water, where all IR is absorbed in the upper fraction of a mm), but as that is sent out by some surface, the same surface must absorb the same wavelengths again, no matter if that is only a small part of the outgoing wavelengths.
That is not even relevant for the question how radiant energy is recycled.
We do know what the energy budget is, as that is quite clear (but not very accurate):
At the surface, the measured (yes measured) fluxes are in average:
163 W/m2 solar SW in
340 W/m2 back radiation LW in
400 W/m2 outgoing LW out,
Thus some 500 W/m2 heats the surface and that is warming enough to give 400 W/m2 outgoing energy, the extra 100 W/m2 is spent for evaporation of water and heats the atmosphere and gives turbulence.
No energy is created or destroyed, only recycled.
Let us start with the simple balance where the first rays of the sun heat the surface:
163 W/m2 in, 163 W/m2 out when the surface temperature gets high enough to give as much outgoing energy as outgoing energy (no matter if that is black body or grey body radiation).
Without GHGs, the outgoing energy simply leaves the earth and that it is: snowball earth.
With GHGs, let’s say that 10% of the outgoing radiation is sent back to the surface. As that is at the same wavelengths as what was emitted, normally that is absorbed by the same surface.
The energy budget then gets:
163 W/m2 SW in + 16.3 LW in (back radiation) – 163 LW out = +16.3 W/m2 extra energy in.
That of course will heat up the surface, until the total incoming radiation and outgoing radiation are equal again at near 180 W/m2.
Even higher, as the outgoing radiation increased, thus now 18 W/m2 is sent back, etc… That all leads to a logarithmic increase in back radiation and corresponding temperature increase.
For the about 50% initial back radiation the net effect is over 200% of the initial energy, but still no energy is created, it is all recycled energy.
I have made an example with a heated plate (the earth’s surface heated by the sun) in a cold vacuum container, where after a few seconds an unheated plate (GHGs) gets inserted. All radiant energy in all directions and temperatures are instantly calculated and plotted. Near all initial parameters can be adjusted:
http://www.ferdinand-engelbeen.be/klimaat/klim_img/slayers.xlsx
Please read the “Readme” first.
That theoretical example shows how back radiation can heat a heated plate far beyond the initial temperature…
Hope that helps to clear the picture…
If you don’t know what is absorbing it then how do you know what is sending it? You are just creating a rationalization to justify your assumption with absolutely nothing to back it up!
How do you know what it isn’t lower level CO2 in the atmosphere that is the actual source of the upward radiation at the CO2 frequency?
What surface? You apparently can’t even define that!
“No energy is created or destroyed, only recycled.”
You keep missing the fact that “recycled” means that something lost the energy first in order for it to be recycled. When it lost that energy it cooled. The reflected energy, unless it is 100% reflected, can *never* warm the originating source back to where the originating source started.
Temperature is related to energy: CurrentEnergy = EnergyStart – EnergyLost + EnergyReflected. EnergyReflected can never be as much as EnergyLost. So CurrentEnergy can never be equal to EnergyStart.
So how does temperature go up if EnergyCurrent can never equal EnergyStart?
And what “surface” might that be?
You *still* aren’t defining what surface this occurs with! Is the lowest part of the atmosphere or the actual surface in contact with your bare feet when you are standing outside?
In addition, what happens to that 16.3 LW after it is absorbed? Does it get re-radiated by the absorbing material or is it retained? Only retained energy will actually raise the temperature. And once the temperature goes up why doesn’t it increase its radiation to account for the increased temperature?
If the energy balance theory is correct then how do you explain the past twenty year pause in warming and the current pause in warming? How would there *ever* be a pause if there is a consistent positive increase in energy due to reflected energy? What you are describing is a positive feedback loop. Positive feedback loops *always* runaway unless there is some limiting behaviour that interrupts the feedback loop. Where is your limiter in the energy balance?
Tim,
Why are you asking things at me you can find yourself with a little search on Internet?
Liquid water acts like a black body both for absorbance as for emissions in near the full IR spectrum, thus following the Stefan-Boltzmann law in radiant energy for temperature and absorbs all IR in a fraction of a mm:
https://www.sciencedirect.com/topics/physics-and-astronomy/infrared-radiation
That is for 70% of the earth’s surface.
The outgoing IR energy at one meter height over land is measured at several places on earth. Measured. No matter what kind of surface that was, that is IR energy from the surface, not from one meter air.
Total average: near 400 W/m2 if averaged for land + oceans.
Again: measured.
“The reflected energy, unless it is 100% reflected, can *never* warm the originating source back to where the originating source started.”
If the originating source of energy is heated with a constant heat source (electric, sun), any reflected energy will heat up the originating source, or you are destroying energy…
Have a look at the “cold plate injection” example I did send. All energy is conserved in the calculations and no energy is created or destroyed and yet the original plate heats up when you insert a cold plate between the heated object and the cold walls.
“Only retained energy will actually raise the temperature. And once the temperature goes up why doesn’t it increase its radiation”
It does increase the radiation as I told you and that increases the back radiation again…
“How would there *ever* be a pause if there is a consistent positive increase in energy due to reflected energy?”
Nobody says that re-emission of radiant energy is the only influence on temperature. Clouds are a very important (mostly negative feedback) factor, ocean currents, etc… In any case the increase of radiant energy back to the surface caused by the increase of CO2 in the period 2000-2010 was measured: 0.2 W/m2 for 22 ppmv CO2 increase:
https://escholarship.org/content/qt3428v1r6/qt3428v1r6.pdf
“Positive feedback loops *always* runaway unless there is some limiting behaviour that interrupts the feedback loop.”
Not at all: as long as the total gain is less than unity, there is no runaway, only a mutual increase, even without negative feedbacks. Here for a 10% gain from temperature on CO2 with a lag and a 10% gain of CO2 on temperature (just as example): both increase logarithmic with over 20%:
Photons collude with O2 and N2. Then what happens?
If an excited CO2 molecule collides with a O2 or N2 molecule, the extra energy is redistributed between both molecules and CO2 is no longer excited, but both show higher vibration energy, thus higher temperature and thus increasing the lapse rate.
When CO2 absorbs a photon it depends of the average time between collisions and re-emissions what will happen, where the average time of collisions is influenced by the local air pressure.
But the reverse also happen: a high energy N2 or O2 molecule can collide with a CO2 molecule and give an excitation of that CO2 molecule.
Hitran is a high resolution database which shows the line by line absorption/emission spectra from CO2 and a lot of other molecules for different air pressures.
https://hitran.org/media/refs/HITRAN-2020.pdf
All isotopes of CO2 are chemically identical.
The IPCC says that the anthro-CO2 fluxes are 4 percent of the total.
The amount of CO2 in the atmosphere is a tiny fraction of the biogeochemical fluxes between surface land/ocean and atmosphere. That means the sinks are approximately infinite.
That means that CO2 NEVER accumulates in the atmosphere. The Tau is 20 years.
Since the flux has increased by 4 percent, and added CO2 NEVER accumulates, the amount of anthro-CO2 in the atmosphere is 4 percent of 400 ppm, which equals 16ppm.
Exactly as reported by Harde.
The remaining 384 ppm is entirely natural.
If humans alter the CO2 discharged into the atmosphere, the anthro percentage will alter in the same way, it just goes with the flow. One percent, two percent, three percent, four percent, 5 percent, 6 percent, etc. it never matters.
If a CO2 comet of mass 3200 gigatonnes entered the atmosphere, it would add to a total of 6400 gigatonnes, the resulting 800 ppm CO2 would start dropping instantly into the infinite sink, and be down by more than 1/2 in 20 years. Back to the fluxes that exist in 2042.
Any pulse of CO2 added to the atmosphere will drop exponentially with a tau of 20 years.
If you add 4 percent to the flow of a river, the flux remains at 104 percent all the way to the sink. The sink is infinite. If you add a bucket of water to the amazon river, the added bucket does not “accumulate” in the river, it just flows down to the outlet into the Atlantic.
There is no difference between water flowing in a river and CO2 flowing out of the atmosphere.
CO2 never accumulates, and never will.
“There is no difference between water flowing in a river and CO2 flowing out of the atmosphere.”
Haha!
You so funny!
For the short bus people like you, substitute “process flow” for river.
https://www.nationalgeographic.org/activity/sources-sinks-and-feedbacks/
Similarly, there is no difference between making a ball out of a roll of aluminum foil and having sex.
https://youtu.be/q_YZX1SgZ5Y
Tell your therapist your medication has stopped working.
What, you mean you were serious?
https://youtu.be/PEKxP8DqEt4
“That means that CO2 NEVER accumulates in the atmosphere.”
“Never” is a big word.
And “accumulates”, it seems to me, includes all cases where the concentration of something increases over time.
A river is a terrible analogy for the flows and fluxes of CO2 into and out of the various reservoirs in which it exists, and the various chemical reactions and biological processes it participates in.
https://youtu.be/PEKxP8DqEt4
Your (and Harde’s) theory is already falsified, as the current amount of human CO2 in the atmosphere, based on the 13C/12C ratio, is already 10%, far beyond the 4% that can be reached for a one inlet – one outlet river example or the one reactor with one inlet and one outlet of Harde.
See the realistic scheme I made of the CO2 fluxes in the atmosphere at:
https://wattsupwiththat.com/2022/04/22/why-is-the-co%e2%82%82-concentration-rising/#comment-3504005
The atmosphere is not a one direction in/out scheme, as most of the fluxes are temperature controlled seasonal and bidirectional. That gives a very short residence time (about 4 years) because much CO2 is exchanged between the different reservoirs, but that doesn’t influence the total amount of CO2 in the atmosphere. Any extra CO2 above equilibrium does influence the balance between inputs and outputs, but that is a pressure controlled process, near completely independent of temperature that controls the seasonal fluxes…
Here the base of the 13C/12C change as measured in ice cores, firn and atmosphere and coralline sponges in the ocean surface, which closely follows the changes in the atmosphere:
Undiscovered subterranean volcanoes a la rediscovered extinct species?
This article is, tragically, nothing but pure lying rubbish. Shame Shame Shame Shame SHAME on WUWT for publishing such pathetically ridiculous, blatantly lying anti-science nonsense.
It is childishly easy to prove that nature cannot possibly be causing the CO2 increase in the atmosphere. Here’s how:
1- human are emitting over 30 gigatons of CO2 into the air every year ( data from easily verified fossil fuel usage data)
2- CO2 levels in the air are increasing by only around 20 gigatons per year. (data from Mauna Loa CO2 measurments)
3- Where are those missing 10+ gigatons of CO2 going? CO2 can’t just magically disappear. There is only one possible explanation: nature is absorbing that CO2 out of the air. Nature is actually taking more CO2 OUT of the air than it is putting INTO the air.
Pretending that nature, which takes more CO2 OUT of the air than it puts into the air, could possibly make CO2 in the air increase, is just as utterly ridiculous as pretending that taking more money OUT of your bank account than you put into it somehow makes the account balance “increase”.
Even a grade school child would easily understand this. So why does WUWT publish such utterly ridiculous, totally lying anti-reality drivel?
The turnover of CO2 does not select molecules by source. They are all the same chemical.
Natural sources are increasing from the tropics. See OCO-2 data. The net sinks are extra-tropical. See any biogeochemical process flow diagram.
The bank doesn’t make any distinction between your money and my money. But if my wife puts $1000 a month in our common deposit and I put $100 per month in our deposit, and I withdraw nothing and the local bank shows a gain of $600 at the end of the year, I am pretty sure my wife has taken average $1050 a month out of our deposit and that the only reason for the gain is my deposit, not the far higher deposit by my wife…
BTW, it doesn’t matter that the tropics increased their CO2 output, all what matters is the balance between natural CO2 releases and natural CO2 sinks. And since at least 1958 every year nature was more sink than source…
Any balance, no matter financial or about mass, shows gains and losses. It seems that some skeptics only look at the gains of CO2 and forget the losses…
Well said Ferdinand.
I think it is a small but vocal minority who do not understand, or refuse to think about it logically, or whatever their problem is.
None of them are willing to respond to direct questions that attempt to clarify what exactly it is they do not understand or which data they think is wrong.
The objections they state do not make logical sense and ignore the facts at hand, and yet they refuse to say which facts they do not recognize as being true.
It is not a new problem, such refusal to debate on the facts alone.
Warmistas have been doing it for many a long and weary year.
MGC: Bad analogy. Nobody is lying to you, it’s not ridiculous- it’s established physical science.
Henry’s Law controls CO2, not emissions. There never was any CO2 equilibrium regarding the ocean, thanks to an ever-changing temperature. If there were an outsize direct MM emission influence on ML CO2 the bulk changes in MME would clearly precede bulk changes in ML CO2, but they don’t, bulk MME lags bulk ML CO2 by ten years.
The ocean via Henry’s Law allows more (or less) CO2 from all sources to remain in (or sink from) the atmosphere on an ongoing basis depending on temperature, acting like a valve.
Let’s start at the beginning, where the annual insolation cycle drives tropical SSTs and CO2:
Which lead to my derivation of the CO2 outgassing/sinking threshold ≥25.6°C:
An example from 2010 of CO2 solubility versus latitude, demonstrates the principle:
This ocean temperature controlled valve has been progressively opening up since the early 1900s, allowing more and more CO2 to remain in the air rather than sink in the ocean. Most of the measured CO2 is in the NH where the ocean is warmer than in the south:
The ocean warmed since the 1800s such that the warm area ≥25.6°C grew by ~50% while the colder area shrank, significantly changing the ocean CO2 outgassing to sinking ratio.
I modeled the growth in ML CO2 with ocean CO2 outgassing. From plot #9 below, there is a 5x CO2 ppm range just within the 2 degrees above 25.6°C, so imagine how much more short-term outgassing occurs beyond 27.6°C. ML CO2 CO2 growth since 1958 is sufficiently modeled by applying the ≥25.6°C threshold.
From the ocean warming ~1°C, today it outgasses 50% more ppm per unit area from higher temperature from the warm area that grew by about 50% since then, for a double outgassing impact, together driving ML CO2 higher.
Therefore, belief in the naturally-controlled rise in CO2 is entirely rational, because Henry’s Law is as physical a reality as water freezing/thawing at 0°C.
Sorry Bob, but it is a perfectly apt analogy. For several decades now, nature has been taking more CO2 out of the air than it has been putting into the air. This is a scientific *fact* easily established with little more than grade school arithmetic.
As a net absorber of CO2 out of the air, nature as a whole cannot possibly make CO2 in the air “increase”. And no amount of complex pseudo-scientific handwaving mumbo jumbo nonsense on your part will ever change such simple grade school level arithmetic facts.
Moreover, Bob, if nature really were controlling the current CO2 increase (but of course it is not) then please explain how it is that the amount of CO2 in the air is now suddenly increasing over 100 times faster than it ever did for millions of years previously.
Oh never mind. There is no such “natural” explanation. You’re just fooling yourself with all your pseudo-scientific handwaving mumbo jumbo nonsense.
MGC,
I know what at least one of the difficulties is.
When you said this:
“Pretending that nature, which takes more CO2 OUT of the air than it puts into the air, could possibly make CO2 in the air increase, is just as utterly ridiculous as pretending that taking more money OUT of your bank account than you put into it somehow makes the account balance “increase”.”
You did not say that what you are talking about is regarding right now only.
A literal reading of that quote can be taken to mean you are saying that CO2 never increases from natural causes.
It should not be a huge sticking point however, since it has been clarified many times in this thread that the point being made is not about all places and all times, but specifically right now, and for the past several decades, and, unless something dramatic changes, will be the case over the coming 365 days.
CO2 was increasing for thousands of years prior to the dawn of the industrial age, but the rate of change was never at the present rate on a sustained basis.
Nick, the real difficulty here is not deficiency in my explanation. The real difficulty is that, because of ideological bias, some folks will simply flat out refuse to accept even blindingly obvious scientific facts, and will sometimes go to extreme lengths to try to fool themselves into pretending away those facts.
Bob Weber’s post above (not to mention Frans Schrijver and this very article itself) have provided us with some truly sorrowful examples.
You are wrong to think my work is ideological, it is physical science. I presented scientific information with a definite conclusion, and you missed it. Maybe its because you’re deficient. How would you know if you aren’t the one who is fooling yourself?
BTW, it was considered a ‘scientific fact’ that solar activity did not cause global warming, but I also overturned that one:
Good luck with your vendetta.
Weber says: “How would you know if you aren’t the one who is fooling yourself?”
If anyone is truly scientific, then they must always allow that they might be wrong.
However, my position agrees with the position of every major scientific organization in the entire world and more importantly, with all the research data published in the best scientific journals. See, for example, the research data in Tans, Oceanography 2009, which leads to this conclusion: “the increase of CO2 in the atmosphere is 100% due to human activities, and is dominated by fossil fuel burning”.
Not to mention that my position is an obvious conclusion easily derived by nothing more than simple grade school arithmetic.
Weber’s “position” on the other hand blindly denies simple grade school arithmetic, and is “supported” only by pseudo-scientific handwaving and anti-science blogs like WUWT. There is zero support for his “position” anywhere in the genuine scientific literature.
So, while it is theoretically possible that I might be wrong, the odds that every major scientific organization in the entire world, all the published research data, and simple grade school arithmetic are all “wrong” are infinitesimally small. Meanwhile, the fact that Weber has zero support anywhere in the worldwide professional scientific community speaks volumes.
Then Weber says: “I also overturned that one”
Ha ha ha ha ha ha ha !!
Ha ha ha ha ha ha ha !!
Ha ha ha ha ha ha ha !!
Ha ha ha ha ha ha ha !!
What a joke !!
The crucial part you left out, Weber, was that the total amount of “integrated solar energy” in your plot has been known for a long, long time to be far, far too small to have caused the observed warming trend.
This is what WUWT does to people. There are well known facts that rip their so-called “conclusions” completely to shreds, but they disingenuously ignore those facts, so that they can continue to live in an anti-science fairy tale dreamworld.
Bob, a lot of nice pictures don’t prove that temperature is the cause of the CO2 increase in the atmosphere.
That humans are the cause is simply proven by the mass balance.
For the current fluxes that is roughly:
Increase in the atmosphere = human input + natural input – natural sinks
2.25 ppmv/year = 5 ppmv/year + X – Y
X – Y = -2.25 ppmv/year
Thus nature is more sink than source, whatever the absolute height of X or Y.
Both the biosphere as the oceans are proven sinks for CO2.
That means that the total area of the oceans that releases CO2 is more than compensated by the extra absorption in other areas, because of the increased CO2 pressure in the atmosphere. The increased pressure is higher than what can be expected from Henry’s law: between 12-16 ppmv/K since the LIA, but CO2 increased with 120 ppmv, far beyond Henry’s law thus the main flux is more CO2 absorption than release.
That is proven everywhere DIC (all dissolved inorganic carbon species) are measured in seawater over longer periods:
https://tos.org/oceanography/assets/docs/27-1_bates.pdf
See figure 3 and Table 2 in that work.
Thus whatever the increase in releases of CO2 from warmer oceans, the oceans are a proven net sink for CO2 not a source.
“Increase in the atmosphere = human input + natural input – natural sinks”
Sinks might be unproperly called “natural” (and so not subtractable from natural input) since they are function of natural and human inputs, ie dependent on the CO2 concentration of two sources. It is also possible to distinguish, apart from greening, agriculture which is extremely efficient in producing food plants and therefore constitutes a purely human sink.
amike, even if you make the distinction between the current 10% human CO2 in the atmosphere and the 90% natural CO2, still the CO2 increase is (near) totally human:
In: 5 ppmv/year human
Out: 2.5 ppmv/year of which 10% human or 0.25 ppmv.
Although rough estimates, humans still destroy more nature than they replant and that is added to the total human emissions. I prefer to calculate only with the figures from fossil fuel use and cement fabrication as the extra CO2 from land use changes is rather uncertain.
Food and feed in general is a closed cycle and only recycles CO2 back to the atmosphere what was captured a few months/years before…
Ferdinand, those nice pictures and their numbers have consequences; with r values from .84 to .99, the thermo-regulation of CO2 is well-established.
Bob,
The following examples show that you use correlations that don’t show what you think they show:
There is a nice correlation between (solar input, ) temperature changes and CO2 changes over the seasons with a lag of a few months. About 5 ppmv/K
There is a nice correlation between temperature changes and CO2 changes over the years,with a lag of about half a year. 3-4 ppmv/K
Problem:
Seasonal CO2 changes go down when T goes up.
Year by year CO2 changes go up when T goes up.
Origin: different processes at work with different responses to temperature. In both cases mainly the dominant effect of temperature on vegetation, but the first on the deciduous forests in extra-tropical forests and the second on tropical forests.
Then we have the long term CO2 change over the past 800,000 years, which follows the ocean temperature largely with Henry;s law at 12-16 ppmv/K with lags of several hundred to many thousands of years.
In that case, the (deep) oceans are the main reactant. 12-16 ppmv/K
Currently we have an increase of CO2 which is not preceded by temperature changes in the order of previous changes: about 150 ppmv/K.
There is nothing in nature that can be tied to such a huge change in such a short time, but human emissions fit all observations and show an extreme good correlation with the accumulation in the atmosphere:
The Assertion is we have observed an atmospheric increase from 280 PPM to 419 PPM, requiring a 295 GtC increase in the atmosphere.
( What are you disputing? What are you asserting is the correct answer?)
The assertion is humans CO2 output has been 650 GtC
(What are you asserting if this is wrong?)
I dispute the idea put forth by many here that nature can’t control the level of atmospheric CO2 in spite of MM emissions, and I dispute that the ‘perfect’ mass balance explanation made by Ferdinand originally back in 2007 that Dave Burton and company rely on so heavily is incomplete and wrong because it doesn’t incorporate the real effect of Henry’s Law as I described.
Just because Ferdinand always regurgitates the same old wrong story doesn’t make him right.
Bob, nature can and will control the level of CO2 despite MM emissions, but that needs time (and the 4 years residence time is of no influence on that).
The current, measured (yes, measured) decay rate is about 2%/year of the CO2 pressure difference between atmosphere and ocean surface. The latter is what Henry’s law dictates for the current average ocean temperatures, that is around 295 ppmv. There is 415 ppmv in the atmosphere, that gives about 2,1 ppmv/year net sink rate for 120 ppmv extra pressure in the atmosphere.
Currently humans emit some 4.5 ppmv/year. If we should reduce that to 2.1 ppmv/year, then CO2 levels should stabilize at 415 ppmv. If humans fix their input at 4.5 ppmv/year. then the CO2 level will increase and stabilize at:
295 + 4.5 / 0.02 = 520 ppmv
All calculations are simple results of the observed linear relationship between the temperature dependent dynamic equilibrium (per Henry’s law) between ocean surface and atmosphere and the net effect of any extra CO2 pressure above that equilibrium per Le Chatelier’s principle.
MGC, If you heat your house in the winter and you decide to increase the heat energy flow by 5% (e.g. 5% more gas per hour), do you really expect that the temperature will keep on rising forever? The energy flow from the house to the environment is proportional to the temperature (or better temperature difference), so the temperature in house will rise a bit and then stabilize. In the same way the CO2 absorption to land and sea is proportional to the concentration. If there was only a stable human emission and no temperature influence the concentration would also have stabilized.
“the CO2 absorption to land and sea is proportional to the concentration.”
True.
“If there was only a stable human emission and no temperature influence the concentration would also have stabilized.”
Not true. Or perhaps better put, not true YET.
The increased CO2 absorption to land and sea you speak of is, at present, still dwarfed by human CO2 output. Moreover, the stabilization process you speak of takes time. There’s not yet been anywhere near enough time for CO2 absorption to land and sea to have caught up with human CO2 emissions output. In fact, the data shows that natural absorption is currently taking only about half of human emissions out of the air.
What you say is correct in the long run, Frans, but it will be a long long time before that stabilization has actually occurred. In the meantime, airborne CO2 concentration keeps rising.
Well, this is the core issue we disagree about.
From Figure 6 it’s obvious that it makes no sense to assume that human CO₂ accumulates in the atmosphere. It would be very illogical if the down-flux under the influence of the higher concentration does increase for natural CO₂, but not for human CO₂. Nature does not distinguish between human CO₂ molecules and natural ones. We know that for the natural flows the residence time is about 4 years, so this is also true for human CO2.
Frans, simple grade school arithmetic is all that is required to demonstrate beyond any doubt whatever that the current increase of CO2 in the air is entirely due to human emissions:
1- humans currently emit over 30 gigatons of CO2 into the air per year.
2- But CO2 in the air is increasing by only about 20 gigatons per year.
3- There is only one place those missing 10+ gigatons can go. Nature is absorbing them out of the air. They do not magically disappear by themselves. Nature is currently a net sink of CO2 out of the air, and has been for several decades.
Again: just this simple grade school arithmetic easily proves that nature as a whole is currently a net absorber of CO2 out of the air. Thus nature cannot possibly be a cause of a current net increase of CO2 in the air. Pretending otherwise is every bit as ridiculous as pretending that taking more money out of your bank account than you put into it can somehow magically make the account balance increase.
Since nature, as a current net absorber, cannot possibly be making CO2 increase in the air, the increase we are seeing must therefore be due to human emissions, and only human emissions. There is no other alternative.
No amount of pseudo-scientific handwaving changes these simple grade school level arithmetic facts.
And sorry to be so blunt, but I’m truly embarrassed (though not surprised) for you and for WUWT for having published such tragically incorrect pseudo-scientific mumbo jumbo nonsense that tries to pretend away such blindingly obvious grade school level facts.
I say “not surprised” because WUWT already has a long and woeful history of publishing tragically incorrect pseudo-scientific mumbo jumbo nonsense.
Based on your dismissive taunting attitude, painting this with a broad brush, you’re engaging in typical (luke)warmist gaslighting.
The thermo-regulation of CO2 includes the MM emissions as I’ve said. What you are doing is emotionally conflating two subjects: the amount of MME emissions, with how the ocean contributes to rising CO2. These are two separate subjects.
The warming ocean has allowed more CO2 from all sources to remain in the atmosphere, it doesn’t mean all the CO2 is from the ocean – I believe the root of your (et al) misunderstanding.
If you can’t understand the ocean can regulate atmospheric CO2 including MME, then you aren’t scientific, because then you are in the pseudo-scientific position of denying Henry’s Law, ie CO2 solubility in water, a known physical science.
CO2 outgasses heavily during evaporation, which is why CO2 spikes during El Ninos:
The ocean temperature also regulates the troposphere.
Weber speaks of “how the ocean contributes to rising CO2”.
Sorry, Weber, but the ocean is not contributing at all to the atmospheric CO2 increase. In fact, the data demonstrates that the ocean is currently acting as an overall net absorber of CO2 OUT of the air, and has been doing so for several decades. See the attached data which clearly demonstrates this proven scientific fact.
As a net absorber of CO2 OUT of the air, the ocean cannot possibly be causing an atmospheric CO2 increase. Why have you ignored such a crucial, proven scientific fact in all your pseudo-scientific handwaving?
You also speak of my “dismissive attitude”. Yes, I most certainly am dismissive, and I make no apologies for it. Every scientifically literate person should be dismissive of a position that refuses to accept obvious conclusions that can derived from just simple grade school arithmetic.
Bob, even during El Niño’s the oceans are (borderline) absorbing more CO2 than they release when averaged over a year. See Figure 7 (last page) of:
https://tildesites.bowdoin.edu/~mbattle/papers_posters_and_talks/BenderGBC2005.pdf
In all other years, the oceans are a strong sink for CO2, but not strong enough to absorb all human emissions (as mass, not the original molecules) the same year as emitted…
Thus the oceans do not contribute to the rise, neither does vegetation. Both are net sinks for CO2.
The general view in society is that human emissions of CO₂ are the all-determining cause of the increased concentration in the atmosphere.
Because that is the case.
Liar ! Humans contribute a small amount of the totally beneficial increase.
willful, intentional ignorance once again on truly shameful display.
Sorry b.nice for this case (and only this) Griff is right… Almost all CO2 increase is from human use of fossil fuels and I do agree that is beneficial…
Both the IPCC phrase The removal of all the human-emitted CO2 from the atmosphere by natural processes will take a few hundred thousand years (high confidence)” is straightforward non-sense, given long term climate unpredictability e.g. the ice age cycles. Equally the above attempt to single out human emitted CO2 on an annual basis makes no sense. Fact is that CO2 concentration of both land an sea have increased and this can only be caused by adding CO2 to the system by burning significant amounts of fossil fuels. There is no telling how nature especially algae en plant growth will react as a sink to absorb the more abundant CO2 but the odds are that there will be a stark response.
This article is a good summary of evidence that plainly disproves the party line. The narrative conforms to the standard of true science, as expressed in the quote by Feynman. It is doubtful that advocates of the party line, like those venting their spleen here (again), understand either.
Harde and Salby have now removed any doubt about what is really going on. It is NOT what the IPCC has claimed for 30 years. They show that the net emission of carbon dioxide from ALL contributions follows natural changes in the tropics – almost perfectly.
https://scc.klimarealistene.com/produkt/control-of-atmospheric-co2-part-2/
The new evidence confirms what was found earlier by Humlum, Stordahl, and Solheim.
https://www.researchgate.net/publication/257343053_The_phase_relation_between_atmospheric_carbon_dioxide_and_global_temperature
No amount of ranting will change what these scientists have shown.
Alex, I have written a rebuttal to the first part of the work of Harde and Salby, it was under peer review, but haven’t heard anything about it recently.
Anyway, Harde, Salby, Berry,… are all completely wrong as they see the atmosphere as one reactor with one inlet and one outlet, while the largest real fluxes are seasonal and bidirectional (every half year, an inlet gets an outlet and reverse) and don’t influence the amount of CO2 in the atmosphere after a full cycle of a year.
Here a rebuttal of an earlier work of Harde on the same lines of reasoning:
http://www.ferdinand-engelbeen.be/klimaat/Harde.pdf
Main points:
5. Conclusions
Dr. Harde makes three fundamental errors:
Using the residence time, or even the decay rate of the 14C bomb tests excess, doesn’t say anything about the time needed to reduce an extra bulk CO2 injection – whatever the source – above the temperature controlled steady state of the oceans with the atmosphere.
Using the total concentration of CO2 in the atmosphere as base implies a steady state of zero CO2 in the atmosphere, which is not realistic.
Using only natural emissions without taking into account the natural sinks violates the mass balance.
Alex, simple grade school arithmetic easily demonstrates that nature is actually taking more CO2 out of the air than it puts into the air. Thus nature cannot possibly be the cause of increased CO2 in the air. The “conclusions” of Harde and Salby are ridiculously false.
I’m embarrassed for you that you so easily fell hook, line, and sinker for their lying anti-science nonsense.
I’m embarrassed for you that you are so brain-washed and scientifically empty.
« The general view in society is that human emissions of CO₂ are the all-determining cause of the increased concentration in the atmosphere. »
True… compare it with a coffee filter, which you are pouring with excess water. He higher the water level, the faster the coffeeflows out of the filter. The current inflow of 35 GtCO2/y equilibrates at 530ppm, so nothing to worry.
Illustration: Increasing CO2 sink with increasing atmospheric co2 concentration
Why 530 ppm Hans? If there was no temperature influence a stable human emission flow of 10 PgC/yr (5 ppm/yr) combined with a residence time of 4 years would lead to a concentration increase of about 20 ppm.
Frans, That is where you go wrong your 4 year residence time is simply the biological mixing speed, it does not net absorb, it only works as a big mixer between the biological store and the atmosphere. As we cannsee from Mauna Loa the absorption rate is exponential with a 50 year time constant. From that we can cakculate the sink speed at a given atmospere level.
http://www.clepair.net/oceaanCO2-4.html
I am sorry Hans, but what is a biological mixing speed? In all models the atmosphere is regarded as a reservoir with in- and outflows. The fact that there is no net absorb for some time now doesn’t change that. As Figure 6 illustrates it would be very illogical if the down-flux under the influence of the higher concentration does increase for natural CO₂, but not for human CO₂. Nature does not distinguish between human CO₂ molecules and natural ones. There is no separate residence time for human CO2.
Breathing Frans. I often use my guinea pigs as example. They are a small carbon reservoirs with a lot of annual revenue as they eat their own weight in hey every day, but a net annual co2 sink (as they gain weight). The global co2 cycle is dominated by these biological processes which cycle the atmospheric co2 content completely in four years and during that process store some co2 as biomass.
So after 4 years all fossil co2 has been passed through a biological metabolism, and is pure technically speaking not fossil anymore. We notice however stil an atmispheric co2 level that is way above the equilibrium level that follows from henry’s law in your blue curve, the atmisphere will therefore try to return with an exponential decay of 50 years to that equilibrium concentration.
Frans, we all agree that the behavior of natural and human CO2 is exactly the same (with slight differences for different isotopes).
Where you and Harde, Salby, Berry,… are wrong is that the 4 years residence time removes any CO2. The residence time only shows how much CO2 is moving through the atmosphere, not how much is removed or gained.
The idea of a pressure dependent residence time is based on the faulty one-input-one-output reactor, where the output is proportional to the amount/pressure of CO2 in the atmosphere.
That picture is completely wrong. Most of the hugest natural CO2 fluxes are near completely independent of the CO2 pressure in the atmosphere, as the main fluxes are from (seasonal) temperature dependent processes. Not pressure dependent.
The residence time depends of the total mass that is exchanged over a year, it doesn’t matter that most natural CO2 fluxes revert direction each half year. Each exchange counts, whatever the direction. Thus even if there is zero net output at the end of the year, the residence time still is 4 years.
Not so for the decay rate of any extra CO2 (whatever the source) above the dynamic equilibrium between ocean surface and atmosphere.
The dynamic equilibrium for the current average ocean surface temperature is around 295 ppmv per Henry’s law.
The atmosphere is currently at 415 ppmv. It is that difference that drives CO2 into the oceans and vegetation.
The absorption ratio is much slower than what circulates and is around 50 years e-fold decay rate (tau) or a half life time of around 35 years. Again no matter which source caused the increase and no matter the origin of the CO2 molecules that still reside in the atmosphere…
Hallo Frans,
Dutch climatesceptic Prof Cees Lepair explains here why co2 is rising because of human emissions http://www.clepair.net/oceaanCO2-4.html
« Through this we arrive at the most reliable values of N(0) & T:
Equilibrium atmospheric concentration N(0) = 287 ppM
Decay time T = 53,5 year (equal to half life th = 37 year)»
Cees Lepair assumes that human emissions are the only cause of the increased concentration and that there is a fixed equilibrium concentration of 287 ppm. He then calculates how long it takes to remove the surplus from the atmosphere.
It is proven by mass balance and the mauna loa measurements, that the sum of natural contribution is negative.
The problem with the mass balance is that it excludes the natural flows that are 20 times larger than the human emission. It assumes that natural fluxes are always and exactly in perfect equilibrium with each other. My statement is that natural emissions have also increased, driven by the higher temperature.
Frans you need to tally your balance sheet. What you are doing in your figure 7 is that you suck out magically all fossil co2 from the atmosphere to replace it with a temperature dependent co2 source which is unheard of in the last 400.000 years. In fact your climate sensitivity which you are introducing there, should have caused already runaway effect in the geologic history of the earth. The fact that this runaway has not occurred in the past proves that you numbers are wrong.
Frans Schrijver : “The problem with the mass balance is that it excludes the natural flows that are 20 times larger than the human emission…. in perfect equilibrium with each other…..”.
The atmospheric carbon dioxide mass balance includes all the flows and the dynamics, no equilibrium considered.
For the period of time selected, the total mass going in equals the total mass going out plus the accumulated mass :
Natural_In + Fossil_In = Natural_Out + Accumulated
==>
Natural_Out – Natural_In = Fossil_In – Accumulated
The right hand part of the equation has for decades been positive and then the “Natural_Out” is bigger than the “Natural_In” even if those individual terms are very big and have changed in the meantime. Those dynamics are the reason for seasonal (and El Nino & La Nina) atmospheric CO2 concentration variations.
Although very dynamic the atmospheric mass balance shows a steady increase in CO2 due to the burning of fossil fuels for at least six decades.
Mass of oxidized CO and CH4 in the atmos is approximately zero in comparison.
Kind regards
Anders Rasmusson
<i>The increase in these fluxes is natural, i.e. not due to human emissions.</i>
The reason the fluxes from, and into, the natural sinks have increased is because of the increase in CO2 in both the atmosphere and in these natural sinks (oceans and terrestrial biosphere). The reason for this increase (as I think Nick Stokes has already pointed out) is the human emission of CO2. Hence the increase in these fluxes is due to human emissions.
Also, it might have been good to have cited our <a href=”https://ui.adsabs.harvard.edu/abs/2018GPC…164…67K/abstract”>response</a> to Hermann Harde’s paper.
“Hence the increase in these fluxes is due to human emissions.”
I’m really glad you “believe” that. (even though its only 15% true)
China , India and soon many other now developing countries will continue to massively increase global atmospheric CO2 emissions.
And there is absolutely nothing that AGW scammers, like you, can do about it . 🙂
b.nice, that humans are to blame for the increase of CO2 in the atmosphere, vegetation and ocean surface is proven beyond doubt and supported by every single observation on this earth.
If that has any negative effect is a completely different question and there is where the warmistas are totally wrong, based on failed climate models.
Insisting that humans are not the cause of the CO2 increase is shooting in your own foot and undermines any good arguments you have against the catastrophists…
Its also hilarious that the climate scammers go on and on about thawing peat moss, and permafrost etc etc, saying that these naturally warming areas will cause huge releases of CO2 and methane…..
…then try to blame all the highly beneficial increase in atmospheric CO2 on humans.
The cognitive mal-functioning is bizarre, to say the least.
“cognitive mal-functioning”
Such a sadly ironic and tragi-comical comment, coming from the guy who constantly demonstrates “cognitive mal-functioning” himself.
One needs little more than grade school arithmetic to demonstrate that nature is actually taking more CO2 out of the air than it puts into the air. Thus nature cannot possibly be causing an increase of CO2 in the air. Pretending otherwise is every bit as ludicrous as claiming that taking more money out of your bank account than you put into it makes the account balance “increase”.
Poor MGC thinks natural warming doesn’t cause more natural CO2 release.
That is what all the hoo-haw about melting permafrost, and peat moss is all about…. more CO2 and CH4 release. Trying to pretend otherwise is showing your lack of even grade school comprehension
You are a mathematical and scientific abyss ! Totally empty of both.
Seem you don’t even listen or read what your AGW priests have been saying.
So dumb !!
Do you have a bank account”? Lets assume you have 33 regular withdraws from that account, and 33 sources of input to said account.
Lets assume your net monthly and annual balance is $400.00 dollars,
Lets assume you increase one input to plus 10 dollars a month, and nothing else changes. ( You KNOW you did that)
At the end of the year you expect to have $520 dollars, yes?
Instead you find that you only have $460.00
Is it not obvious and irrefutable that, regardless of ALL OTHER CHANGES, if you had not made that additional $10.00 a month contribution, your net balance would have decreased?
Is it not clear that regardless of all other additions and subtractions, if you had not increased that one contribution by $10.00, your net balance would have lowered?
My question on this whole matter is not about our obvious human caused increase in annual net CO2 PPM, but why has the ocean land absorption increased so much, so rapidly? Does the increased bio growth of the oceans and land account for the lack of retention of CO2 in the atmosphere?
Does this mean that the growth in Bio life CO2 storage is increasing faster than the CO2 release from dead bio stock, and when the growth curve stops, and bio decay equalizes, then atmospheric PPM CO2 will stabilize?
David A
This entire discussion about the cause of CO2 increase is such a clear yet tragic example of how many people, because of ideological bias, steadfastly refuse to accept simple straightforward facts; even blindingly obvious facts that, to be verified as correct, require little more than grade school arithmetic. They’ve been so thoroughly brainwashed by their propaganda puppet masters that apparently no rational argument will ever dissuade them from their fairy tale world of anti-science delusions.
Now you are so mixed up, you are claiming that the warmistas are correct about runaway global warming causing an unprecedented warming of the permafrost, which no skeptic believes.
Clearly it was warmer at many times and for thousands of years since the Holocene started.
The Arctic was likely ice free for long stretches of time during the Holocene Climate Optimum.
At this point, you are Henry and everyone else who is unable to understand what we are saying, are acting exactly like warmistas do when they are confronted with facts that conflict with their dogma.
And then there’s biology…
JF
The temperature dependence Nick Stokes is referring to based on ice core data. As I have said you can have serious doubts about the absolute values of the assumed concentrations. The fact remains that if you accept that the absorption flow is proportional to the concentration a stable human emission alone cannot explain the continuous rise.
Ferdinand Engelbeen has been pushing his mass balance argument very persuasively for years. With a great deal of head-scratching I worked out that by his argument then any separate CO2 production sub-unit in the world’s CO2 system could, by the same arguments, be considered the cause of atmospheric CO2 increase. Please don’t ask me to repeat the process, it made my brain hurt.
The isotope changes could be simply explained by the fact that planktonic carbon fixation may or may not be changed by nitrogen pollution (Haber process, changes in dominant species), dissolved silica run-off (diatom increases), sewage, phosphate, organic fertiliser etc runoff, or all three (see the Sea of Marmara for the way these may have catastrophic effects on the warming rates of affected sea areas).
Here’s one guess about the light isotope signal: oil/surfactant/lipid pollution warms the sea surface, increases stratification and by supressing wave action reduces stirring and hence the bringing of nutrients up into the light zone. Oleaginous plankton release lipids which smooth the surface and allow light penetration to the still nutrient rich lower levels, while countering the reduced CO2 levels (less stirring from the lack of breaking waves) by switching their carbon fixation to the carbon concentration mechanism (CCM) that prescient evolution has prepared for just this situation. The CCM discriminates less against the heavier carbon isotopes so the carbon export to the deep sea is isotopically heavier: light isotope is misinterpreted as a fossil fuel burning signal.
We do not live on a planet ruled by Gaia — we are dominated by the Goddess Oceana, more than three times the size of the terrestrial ecosphere.
JF
You’d still need to explain what happened to human emissions. We’ve emitted about 600 GtC. Atmospheric CO2 has increased by just under 300 GtC. So, over 300 GtC has gone into the ocean and terrestrial biosphere. If you’re suggesting that something happened in the ocean to cause the increase in flux of CO2 from the ocean to the atmosphere, then why did atmospheric CO2 only rise by an amount equivalent to just under 50% of what humans have emitted?
50% is not even close. Greater or less pull down and export to the deep sea, differing isotope fixation or outgassing, all can be altered by the immense power of the ocean ecology.
We are just pimples on Oceana’s gluteus maximus.
JF
Atmospheric CO2 has increased from 280 ppm to about 419 ppm. That’s about 295 GtC. Total human emissions are about 650 GtC. So, the rise in atmospheric CO2 is equivalent to just under 50% of total human emissions. Typically the airborne fraction is estimate to be about 0.46.
Estimated by people like you who are incompetent at physics and maths, you mean.
Real maths shows humans are responsible for around 15% of the highly beneficial atmospheric plant food increase.
But that understanding is beyond you.
The Assertion is an atmospheric increase from 280 PPM to 419 PPM, requiring a 295 GtC increase in the atmosphere.
( What are you disputing? What are you asserting is the correct answer?)
The assertion is humans CO2 output has been 650 GtC
What are you asserting if this is wrong?
Notice none of the people disputing it ever answer directly which part of all of this they think is wrong?
I think they are not even engaging their brain with the actual question at hand.
This is what happens with cognitive dissonance: The mind refuses to engage with facts that are counter to what has already been decided.
They get thrown into the hopper, so to speak, along with the natural emissions. If the human emission were to suddenly disappear, the CO2 partial pressure in the atmosphere would decrease, perturbing the balance, and allow more out-gassing from the oceans and increase soil respiration. Therefore, there would be little, if any, change in the atmospheric concentration. It is being driven primarily by increasing temperatures, which increase biomass production on land and in the oceans, accelerate biogenic decomposition of the increased detritus, and allow sequestered organic material to escape from the tundra.
Temperature is the only variable for which a clear, unequivocal correlation can be established for CO2. Note the impact of the recent El Nino here:
Clyde, the long time (800,000 years) equilibrium between the ocean surface temperature and the pCO2 in the atmosphere is around 295 μatm not the current 415 μatm. That difference in pCO2 is the driving force for the natural uptake of CO2 into oceans and vegetation.
It seems that you are only interested in natural CO2 releases and natural sinks don’t exist in your writings. A balance has two sides and in this case the sink side is larger than the source side.
If we stop today with all human emissions, the first year there would be a drop of about 2.5 ppmv in the atmosphere, in direct proportion to the pCO2 difference between atmosphere and ocean surface. The next years, that difference get smaller, thus also what is net absorbed and that gets zero when 295 μatm is reached.
The e-fold decay rate is some 50+ years. Much slower than the residence time (which has nothing to do with CO2 removal) but much faster without the limits that the IPCC gives, according to the Bern model, which is equally wrong…
Julian Flood, the mass balance is valid in all material handling systems, let it be an industrial chemical reactor or a warehouse in operation.
Mass can not be destroyed (no nuclear application).
The atmosphere can be considered as a chemical reactor or a warehouse (or a bank account) and the mass balance is always applicable :
what goes in has to come out or the difference will accumulate.
By burning fossil fuels, directing the exhaust primarily to the atmosphere then the amount of carbon dioxide has to increase by that corresponding amount in the atmosphere. If not then there are other sources or sinks making the atmosphere increase more or less.
Kind regards
Anders Rasmusson
There is no reason to think that your last statement is wrong
That’s my point.
JF
Julian Flood, by burning fossil fuels there is a corresponding increase of carbon dioxide in the atmosphere, in the oceans and on land.
Kind regards
Anders Rasmusson
However, it can be removed temporarily from the Carbon Cycle by various sequestration mechanisms. Most notably, I suspect that the tundra is giving back the carbon that was sequestered during the last glaciation.
Clyde, “…… I suspect that the tundra is giving back the carbon that was sequestered during the last glaciation…..”.
Yes, and the corresponding amount of carbon dioxide from burning of fossil fuels is also primarily distributed to the atmosphere.
The atmospheric CO2 mass balance tells us there is a net CO2 transfer from the atmosphere to the nature (ocean and land).
All of the CO2 corresponding to the burning of the fossil fuels is transferred from the fuel sources to the carbon cycle.
Kind regards
Anders Rasmusson
Anders,
This is so obvious to me, and to many others here, that I am truly at a loss that anyone is disputing it, regardless of the unknowns of other specific sources and sinks.
Julian, I don’t think you are right about the isotopes: the deep oceans are around zero per mil δ13C, the ocean surface between +1 and +5 per mil δ13C, depending of local organic life.
When plankton grows, it discriminates against the heavier 13CO2 and when it dies, part sinks into the deep. The net effect is the difference in δ13C between ocean surface and deep oceans.
There is a physical discrimination of carbon isotopes when CO2 leaves water (- 10 per mil) and returns to water from the atmosphere (-2 per mil), which gives an overall change of – 8 per mil between oceans and atmosphere, which was maintained over the Holocene. The δ13C level over the past 10,000 years in the atmosphere was -6.4 +/- 0.2 per mil δ13C.
Even over glacial and interglacial transitions the δ13C change was not more than a few tenths of a per mil.
Since 1850, the whole δ13C level dropped with 1.8 per mil…
And you think that it is not by humans burning fossil fuels at average -24 per mil?